Embed Size (px)
Citation preview

Assessment of Postharvest loss for perishable produces from Wholesalers to consumers A case study of Et-fruit distribution company In Addis Ababa, Ethiopia Tesfaye Sebeko
Master’s thesis · 30 hec · Advanced level Environmental Economics and Management – Master’s Programme Degree thesis No 964 · ISSN 1401-4084 Uppsala 2015
Assessment of Postharvest loss for perishable produces from Wholesalers to consumers
A case study of Et-fruit distribution company In Addis Ababa, Ethiopia
Tesfaye Sebeko Supervisor: Girma Gebresenbet, Swedish University of Agricultural Sciences,
Department of Energy and Technology Assistant supervisor: David Ljungberg, Swedish University of Agricultural Sciences, Department of Energy and Technology Examiner: Karin Hakelius, Swedish University of Agricultural Sciences, Department of Economics Credits: 30 hec Level: A2E Course title: Independent project/degree in Business Administration Course code: EX0536 Programme/Education: Environmental Economics and Management – Master’s Programme Faculty: Faculty of Natural Resources and Agricultural Sciences Place of publication: Uppsala Year of publication: 2015 Cover picture: Tesfaye Sebeko Name of Series: Degree project/SLU, Department of Economics No: 964 ISSN 1401-4084 Online publication: http://stud.epsilon.slu.se Key words: Fresh produces in Ethiopia, Impact of food loss, postharvest loss, supply chain channels
iiii

Acknowledgements
I would like to extend the sincere appreciation to my advisor Prof. Girma Gebresenbet for the
valuable remarks, comments, financial support and commitment throughout the learning
process. It is also my pleasure to thank my examiner Karin Hakelius for valuable and
constructive comments. Above all, utmost indebtedness goes to the Almighty God for the
divine intervention in my academic-endeavor. Furthermore, I would like to acknowledge the
participants, who have gladly shared their valuable time through the interview process
specially, Mengistu Kebede; General Manager of Et-Fruit, Tsegaye Sedore; marketing
researcher of Et-Fruit and Fitamo G/Mechael; expert of Ethiopian Revenues and Customs
Authority (ERCA), who have helped me diligently. I would be greatly indebted to my beloved
families, who have supported me unconditionally through entire academic journey.
Especially, Tarekegn Sebeko, You are my inspiration. Sincere gratitude is hereby extended to
my best friends, Abenezer Zeleke and Wondemagegn Tafesse, who have been special
addition in my journey from very high school moment. Last but not least, I would love to
extend my appreciation for Swedish University of Agricultural Science for the scholarship.
Uppsala, 2015
Tesfaye Sebeko
iii

Abstract This thesis underlines an assessment of the Postharvest loss conditions of selected fresh
produces of Etfruit wholesalers and its impact on chain players in Addis Ababa, Ethiopia.
Reducing Postharvest loss instead of increasing the volume of production can save scarce
resources, ecofriendly and improve food security (Kader, 2004). The approach for conducting
the study consists of semi-structured interview and observation techniques with detailed
interviews of Etfruit-wholesalers and their close trade partners. Volume losses were estimated
for each supply chain channel and fresh produce. Total food loss along supply chain channels
for selected fresh produces is about 28% whereas 1% in consumers’ channel. Postharvest loss
largely occurs in supply channels than consumer for fresh produces in developing countries
(Fao, 2014). Lack of incentives against food loss given the initial supply curve (amount)
resulted in a lower quantity, higher price, producer’s surplus, welfare disadvantage for
consumers in fresh produces market. Moreover, failing to reduce food waste from
consumption resulted in a higher quantity, welfare advantage for produces and higher price in
the market. Therefore, lack of responsive action to reduce postharvest loss caused producers
to be greatly affected players’ in the supply chain.
There were hindrances which promote food loss in the supply chains; lack of cold chain
system, inadequate packaging and heavy dependence on manual Labor. These problems can
largely be reduced by implementing cold chain, refrigerated transport, plastic crates, locally
viable technologies and persistent policies. In Ethiopia where traditional postharvest handling
is the only choice, poorly harvested and packaged fresh produces loaded onto inadequate
transport by means of manual labor. Valuation of postharvest losses of fresh produces at
various phases of supply channels would benefit in pinpointing the causes for food losses.
This also enables to develop proper measures required to reduce losses and to increase the
accessibility of fresh produces. With postharvest concerns having been mostly overlooked, a
firm indication starts from lack of common assessment method. Moreover, there have not
been many researches on the impacts of food loss in developing countries. Therefore, there is
an urgent need for further quantitative researches that provide accurate loss estimates. Unless
deliberations on the potentials for reducing worldwide food loss will remains mostly
rhetorical.
iv

Table of Contents
1 INTRODUCTION .............................................................................................................................................. 1
1.1 PROBLEM BACKGROUND ................................................................................................................................ 1 1.2 PROBLEM STATEMENT .................................................................................................................................... 2 1.3 AIM AND DELIMITATIONS ............................................................................................................................... 3
1.3.1 Delimitations .......................................................................................................................................... 4
2. LITERATURE REVIEW ................................................................................................................................. 5
2.1 FRUITS AND VEGETABLES SUPPLY CHAINS IN ETHIOPIA ................................................................................. 5 2.2 AGRO-CLIMATE BENEFIT FOR HARVESTING FRUITS AND VEGETABLES ........................................................... 5 2.3 SUPPLY CHAIN CHANNELS FOR FRUITS AND VEGETABLES IN ETHIOPIA .......................................................... 6 2.4 WORLDWIDE TRENDS INFLUENCING POST-HARVEST FOOD LOSS................................................................... 7 2.5 POSTHARVEST FOOD LOSS IN DEVELOPING COUNTRIES .................................................................................. 8 2.6 STRATEGIES FOR REDUCING POSTHARVEST LOSSES ...................................................................................... 10
3. THEORETICAL FRAME WORK ........................................................................................................... 12
3.1 VALUE CHAIN ANALYSIS FRAMEWORK FOR DEVELOPING COUNTRY ............................................................. 13 3.2 VALUE CHAIN CONSTRAINTS ........................................................................................................................ 14
3.2.1 Market access ....................................................................................................................................... 14 3.2.2 Infrastructure and resources ................................................................................................................ 14
3.3 VALUE CHAIN ANALYSIS .............................................................................................................................. 15 3.3.1 The network structure .......................................................................................................................... 15 3.3.2 Supply and Demand relationship ......................................................................................................... 16
3.4 VALUE CHAIN ENHANCEMENT...................................................................................................................... 19 3.4.1 Value added .......................................................................................................................................... 19
4. METHOD .................................................................................................................................................... 21
4.1 CHOICE OF THEORETICAL FRAMEWORK AND LITERATURE REVIEW .............................................................. 21 4.1 SAMPLE SELECTION ...................................................................................................................................... 21 4.2 SAMPLE SIZE ................................................................................................................................................ 22 4.3 MAPPING OUT SUPPLY CHAIN PLAYERS ........................................................................................................ 22 4.4 ESTIMATION OF POSTHARVEST LOSS ............................................................................................................ 23 4.5 SAMPLE SELECTION FOR HOUSEHOLDS ........................................................................................................ 23 4.6 SAMPLE SIZE FOR HOUSEHOLDS ................................................................................................................... 24 4.7 ESTIMATION OF FOOD LOSS AT HOUSEHOLD LEVEL ...................................................................................... 24
5. THE EMPIRICAL STUDY ........................................................................................................................... 25
5.1 OVERVIEW OF ET-FRUIT ............................................................................................................................... 25 5.2 ETFRUIT SUPPLY CHAIN CHANNELS .............................................................................................................. 26
v
5.3 FOOD LOSS IN THE SUPPLY CHAIN ................................................................................................................ 28 5.4 LOSS IMPACT ON PRICE, QUANTITY AND WELFARE OF CONSUMERS ............................................................. 30 5.5 LOSSES AT CONSUMERS CHANNEL................................................................................................................ 31 5.6 FOOD WASTE IN CONSUMERS CHANNEL AND ITS IMPACTS ON PRICE, QUANTITY AND WELFARE ................... 32 5.7 HINDRANCES THAT PROMOTE FOOD LOSS IN THE CHAIN .............................................................................. 33
5.7.1 Packing systems ................................................................................................................................... 33 5.7.2 Mode of transportation ........................................................................................................................ 34
6. ANALYSIS AND DISCUSSION.................................................................................................................... 37
6.1 VALUE CHAIN CONSTRAINTS ........................................................................................................................ 37 6.1.1 Market access ....................................................................................................................................... 37 6.1.2 Infrastructure and resources ................................................................................................................ 38 6.1.3 Inadequate use of cold chain system .................................................................................................... 38 6.1.4 Lack of adequate packaging sheds ....................................................................................................... 39 6.1.5 Heavy dependence on manual Labor ................................................................................................... 39
6.2 VALUE CHAIN ANALYSIS .............................................................................................................................. 40 6.2.1 Network structure ................................................................................................................................. 40 6.2.2 Supply and Demand relationships ........................................................................................................ 40 6.2.3 Governance structure ........................................................................................................................... 42
6.3 IMPROVING .................................................................................................................................................. 43 6.3.1 Market access ....................................................................................................................................... 43 6.3.2 Value added .......................................................................................................................................... 44 6.3.3 Infrastructure and resources ................................................................................................................ 44
7. CONCLUSIONS ............................................................................................................................................. 46
BIBLIOGRAPHY ............................................................................................................................................... 47
LITERATURE AND PUBLICATIONS ....................................................................................................................... 47 Internet sources ............................................................................................................................................. 51 Personal Messages ........................................................................................................................................ 51
APPENDIX (I) ..................................................................................................................................................... 52
QUESTIONNAIRES FOR HOUSEHOLD ................................................................................................................... 52 QUESTIONNAIRES FOR INTERMEDIARIES ............................................................................................................ 54
APPENDIX (II) ................................................................................................................................................... 59
SUPPLEMENTARY INFORMATION........................................................................................................................ 59
vi
1 Introduction 1.1 Problem background Currently world is facing serious concern over the equitable, rational and sustainable use of
the natural resources that support fair food supply, labour, land, clean water, environment
friendly and agricultural inputs because failure in these endeavours leads to starvation and
civil war (Stuart, 2009a). The management and synchronization of the supply chain for fresh
produces has become increasingly fundamental concern. As business sectors need to reduce
postharvest losses and wastes in the supply chain by taking advantage of market opportunities
which perceived from fundamental shifts in customer preferences and tastes (Wilson, 1996).
World population is expected to reach 10 billion by 2050 which will require a 70% increase in
food production (FAO, 2009, Tilman et al., 2001). According to Fao (2014) study, 870
million people were food insecure and chronically undernourished during the year 2010-2012.
Unfortunately, largest proportion of them lives in developing countries. The percentage of
people in the world living as malnourished has declined from 18.6% to 12.5% since 1990.
However, an increase in malnutrition has taken place in different parts of world like North
Africa, sub Saharan Africa and Western Asia during the recent years. In sub Saharan Africa,
about 27% or 234 million people have no sufficient food available (Fao, 2014). Therefore,
Ethiopia is one of the Sub Saharan African nations that are poised at the brink of a severe
food insecurity and poverty (www, faostat, 2015). In order to fight poverty and ensure food security there has to be huge demand for investment
and development in the agricultural sector particularly in developing countries (Fao, 2014).
Production of agricultural products such as fruits and vegetables can contribute to increased
food security as well as better nutrition intake which could leads to economic development
(Weinberger and Lumpkin, 2007). The increased population size and shifting dietary
lifestyles in Ethiopia has intensified the need for local fruits and vegetables (Woldewahid et
al., 2012). However, the fruit and vegetable production has been small scale in Ethiopia
related to other crops; however, it has plentiful potential for production of several horticulture
products due to the climate is favourable (Emana and Hadera, 2007). For some local fresh
produces production has been increased by 60% such as Avocado, Banana and Mango during
the last decade in Ethiopia (www, faostat, 2015). Despite progress in horticultural production,
failure to reduce postharvest loss can decline food availability due to increase in physical loss
and decrease in income from the diminished market opportunities. Reducing postharvest loss
1
instead of increasing food production can save scarce resources and lesser environmental
pollution. This is because increased production can lead to more intensive farming (Zorya et
al., 2011). Therefore, reducing PHL is one of indispensable approaches to make more foods
available without increasing the pressure on the natural resources (Hodges et al., 2011). The production of fruits and vegetables in Ethiopia is normally scattered and carryout by a
great number of small farm holders and transported long distance to reach central markets. To
spread more to central outlet there are usually a lot of intermediaries between producers and
consumers (Shukla and Jharkharia, 2013). Hindrances in the supply chain for fresh produces
in Ethiopia mainly emanates from limited knowledge about postharvest handling and lack of
infrastructure (Wakjira, 2010). Food loss often occurs in all phases of postharvest handling
such as, storage, packaging, transportation, processing and marketing. Lack of information
access, application of better technology and credit services are obstacles along supply chains
and the infrastructure are mostly fragile in developing countries (Trienekens, 2011). Ethiopia harbours an extraordinarily rich agro-biodiversity resulting from its geography,
climatic variances, ethnic diversity and strong food culture. Uniqueness is the great variation
in climates, due to the great variation in altitude ranging from sea level up to 4,500m.
Together with ample possibilities for irrigation it is reasonable that a great variety of fruits
and vegetables can be harvested in Ethiopia (Wiersinga and de Jager, 2009). However, the
total area under fresh produce cultivation in Ethiopia accounts for about 5% of the total land
suitable for cultivation. There are several small producers harvesting a small range of fruits
and vegetables for the local market. The sector also comprises big state owned farms
delivering fresh produces for local and export market (Emana and Gebremedhin, 2007).
1.2 Problem statement As stated in the earlier section that dependable access to adequate food is limited in Ethiopia.
Therefore has a need to grant food security by increasing food production while reducing
losses along supply chain channels. Production of fresh produces can be one of the solutions
to enhance food availability and relieve undernourishment (Parfitt et al., 2010). Many
research findings showed that food loss is immensely increasing in developing countries.
Latest research reports by Gustavsson et al. (2011) estimated annual quantitative food loss in
the supply chain globally approximates 40-50% fresh produces; 30% for cereals; 20% for
oilseeds, meat and dairy. Regardless of different drivers and incentives, one of the most
2
important reasons attributing to lower availability of fresh produce is its huge quantity loss
that occur at different phases of supply channel (Prusky, 2011). Pariser (1982) argued that
factors for food loss in developing countries are an outcome of comprehensive, administrative
and technical constraints in harvesting methods, storage, transport, process, cold chain, road
infrastructures, package and market integration system. (Rutten, 2013b) also demonstrated
that a 40% decrease in food loss along supply chain in the EU would lead to, small, but
positive, a decrease in food prices (0,2%) while an increase in food consumption (0,04%) in
Sub Saharan Africa. Few systematic approaches have been used to estimate the losses at each stage of handling in
developing countries. Many of the them were based on small-scale experiments which do not
reflect the actual holistic situations on postharvest losses of fresh produces (Ratnam and
Nema, 1967, Biswas, 1969, FAO, 1981). Little information is available regarding postharvest
loss of perishable produces in Ethiopia mainly at different phases and their impact on supply
chain players. In Ethiopia, supply chain can be described as rudimentary system resulted from
inadequate infrastructure, disintegrated market and lack of information. Moreover, harvesting
of fresh produces dependant on natural rainfall and practically challenging (Wiersinga and de
Jager, 2009). This study assesses supply channels for selected fresh produces, role of players,
impacts of food loss on producers and consumers and estimation of food loss, Addis Ababa,
Ethiopia. According to FAO (2012), in the developing countries, absence of basic infrastructure and
knowhow in post-harvest handling have been identified as significant drivers in the formation
of food loss, both currently and foreseeable future. Kader (2005) also supported the notion
where global markets, domestic strategies and capital investment are lacking, prime
investments in basic infrastructure in developing world often unsuccessful. Postharvest losses
are very much dependent on specific conditions and local situations in a given country. In
broad terms, as per World Bank (2010), food losses are influenced by production and
processing choices, patterns and technologies, internal infrastructure and capacity, supply
chains and channels for distribution and consumer food use practices.
1.3 Aim and delimitations The aim of this study was to assess postharvest losses along the supply chains of fresh
produces in Addis Ababa, Ethiopia. In order to achieve the aim the supply and value chain for
3
selected fresh produces needed to be identified in Addis Ababa, Ethiopia. The research questions
addressed were:
1. What are supply chain channels for fresh produces and their main players?
2. What are hindrances and volume of postharvest losses in the supply chains?
3. What are impacts of postharvest losses on supply chain players? 1.3.1 Delimitations This study was conducted in Addis Ababa, Ethiopia as part of a project program between
Addis Ababa University and Swedish University of Agricultural Science; particularly
Department of Energy and Technology. The research area was delimitated to Addis Ababa,
Ethiopia. This location represents mostly country’s prevailing situations of postharvest loss
and handlings for fresh produces. Trade industry office was instrumental for the selection of
the main wholesalers of fruits and vegetables in Addis Ababa, Ethiopia. Fresh produces
categories were determined through discussion of marketing experts of Etfruit wholesale firm
on the bases of high loss prevalence and economic contribution. The study was delimitated to
only PHLs, thus losses that can occur before harvest was not taken into account. There are
several ways to estimate postharvest loss but interview technique was chosen as the method
for this study. At large, information on postharvest losses were limited in developing
countries and those existing were acquired either on the basis of the judgment of experts or
estimation of questionnaires. These biases could affect study result for instance asking
housewives to weight all food wasted at plate from total consumption through a given period
of time. However, participation and consideration of players own perception on postharvest
losses and handlings can only be achieved by this approach. Accurate results might be
estimated with other methods, but valuable information from the players’ perspective could
be overlooked. In exploring the supply chain channels for fresh produces mainly downstream
approach was used. Therefore, producer channel was not directly considered because using
producers to consumers would entail the danger of interviewing several numbers of producers
who may not produces fresh produces for commercial objectives in lager cities. Exploring
further the produces supply and value chain situation can provide prospects to find
improvement options that can be applied in both domestic and export chain.
4
2. Literature review
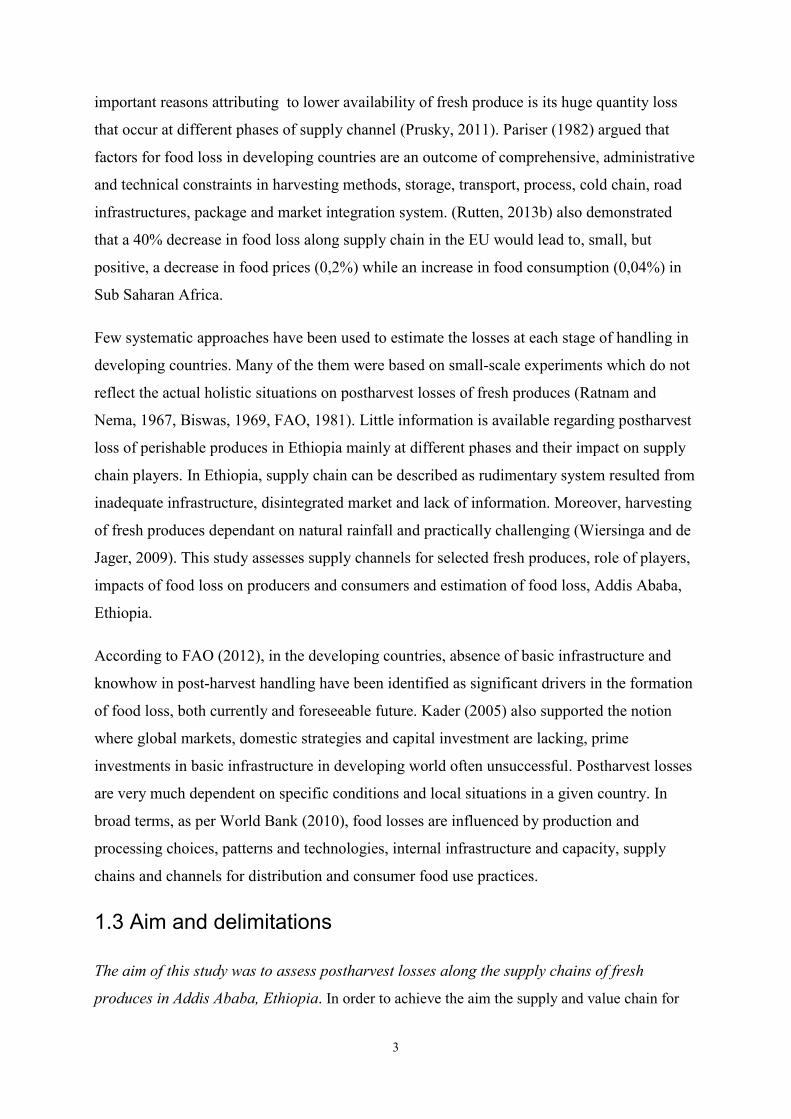
2.1 Fruits and vegetables supply chains in Ethiopia Ethiopia has a comparative advantage in a number of fruits and vegetables productions
because of its favourable weather, cheap labour, proximity to export market such as Europe
and Middle East (Ruel et al., 2005). However, the production of fruit and vegetable is much
less advanced than the production of staple grains. Normally, more than 2,399,566tons of
fresh produces are harvested by private and public commercial farm which is estimated to be
less than 2% of the total staple production. Total area under fresh produce is about 12,576
hectares in 2011 which is less than 1% (0.11%) of the total land area under cultivation (www,
CSA, 2014).
Table 1. Fruit and vegetable cultivation in Ethiopia for private peasant holdings (2010/11)
Statistical Abstract from (CSA, 2014)
2.2 Agro-climate benefit for harvesting fruits and vegetables
Ethiopia has highly diverse climate and altitude that are favourable for various agricultural
harvestings. It is also gifted by several rivers and lakes with massive irrigation possibilities.
Ethiopia has an estimated 10 million hectares of land with the potential of irrigation of which
merely about 1% is presently under irrigation system. Fruits and vegetables are crops of great
economic importance with a prospect for local consumption, export markets and processing
includes Bananas, Avocados, Mangoes, Mandarin, Papayas, Tomato, Onion, Carrot, and
Cabbages.
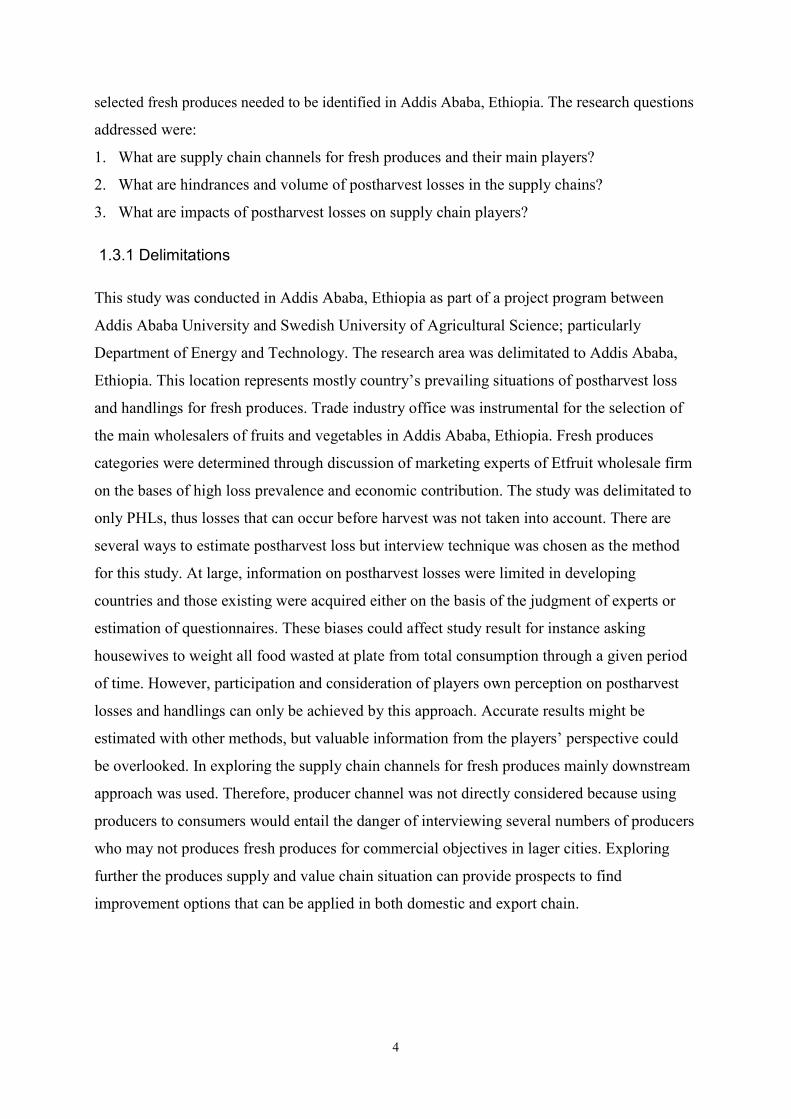
Table 2. Estimated Potential Area for Fruit and Vegetable Investment (CSA, 2014)
5
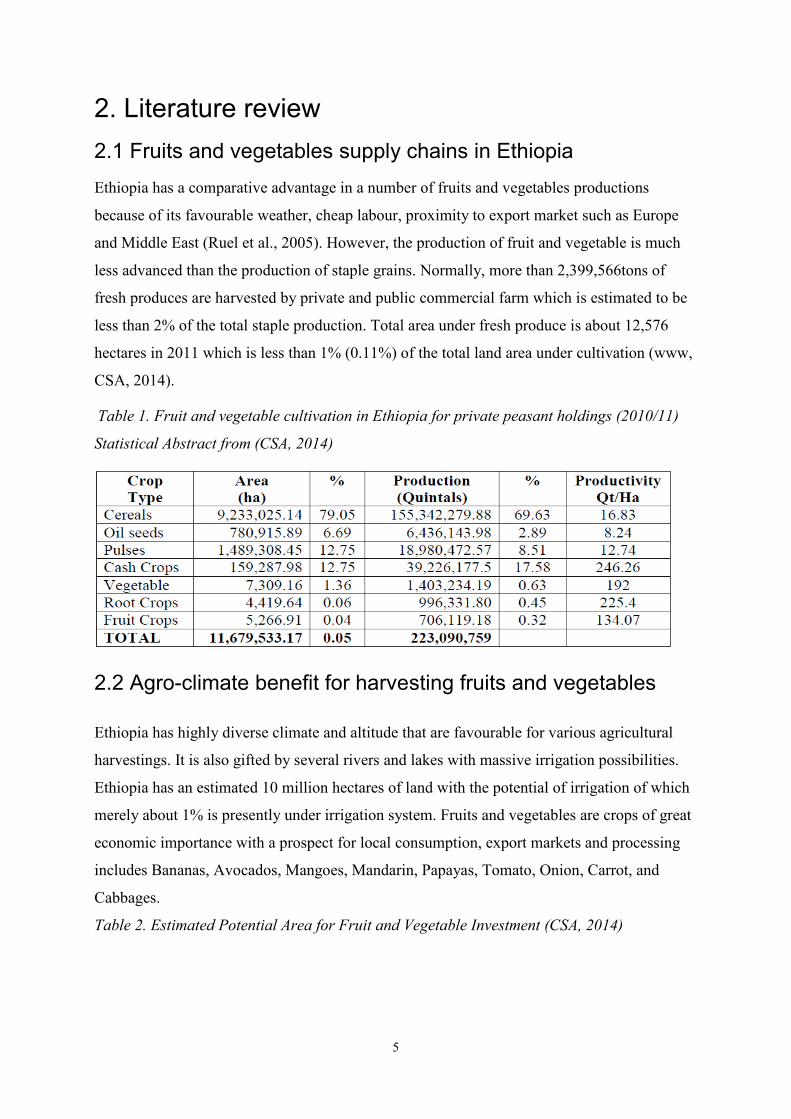
2.3 Supply chain channels for fruits and vegetables in Ethiopia As shown in Figure 1 there exist at least three supply chain channels for fresh produces on the
bases of product type and market destination. Ethiopian fresh produces marketing firm (Etfruit) is
one of largest state owned enterprise that dominated domestic distribution channels. Etfruit supply and
distribute fresh products of the horticultural state farms and other that harvest horticultural crops on a
contractual basis. Private exporters are also involved in the export of fresh produces.
Figure 1. Three types of supply chain channels for fresh produces in Ethiopia (ETHEMB,
2014, p.8)
6

2.4 Worldwide Trends Influencing Post-harvest food Loss
There are global tendencies that influence postharvest losses of food according to (Parfitt et
al., 2010). Firstly, it is apparent that there is continuous rapid developments of urban cities
and reduction of the agrarian sector in many countries. Due to this fact, the last couple of
decades have witnessed a substantial shift towards from the rural areas to the urban areas.
Farm cultivators are departing their farm fields and heading to the urban cities in pursuit of
improved livelihoods. Largest share of the world’s population currently resides in urban
cities. It is estimated that by year 2050, two-thirds of population or 6 billion societies will be
residing in urban areas when compared with the estimation of only 32% in 1960. This
developing phenomenon has initiated the need for protracted food supply chain channels to
feed urban area population. More food shall have to be moved over longer distances to get
urban cities, necessitating developments in transportation, roads, storage, distribution and
marketing infrastructure to evade additional losses. How these protracted food supply
channels adhere to pace with urban development has apparent effects for food loss globally.
The second development starts with the shift in food use practice patterns. Increased
urbanization in association with income increment, principally in transitional countries such
as China, India, Russia and, Brazil has caused in hasten of the diets diversification into fresh
fruits and vegetables and a decrease in consumption of staples food (Parfitt et al., 2010). This
change towards more fruits and vegetables, shorter shelf life produces is related with greater
food loss combined with greater demands placed on farming in terms of inputs and lands to
production system (Lundqvist et al., 2008a).
The third trend is associated with the globalization of trade system. Related to trade
globalization and liberalization, there are rapid increase in supermarkets – frequently
multinational firms are operating throughout several countries. Supermarkets are appearing
the central marketing intermediary among producers and consumers. They are displacing old-
fashioned retailers in several countries such as in Africa, Latin America and Asia. Also it
appears as the main rout line for delivering varied fruits and vegetables for the middle classes
as well as the urban poor. Related with supermarket domination, there are obvious
requirement to conform safety and quality standards of customers, along with volume and
appropriateness of demands for export and local markets, hence all contributes for food loss
in the supply chain.
7
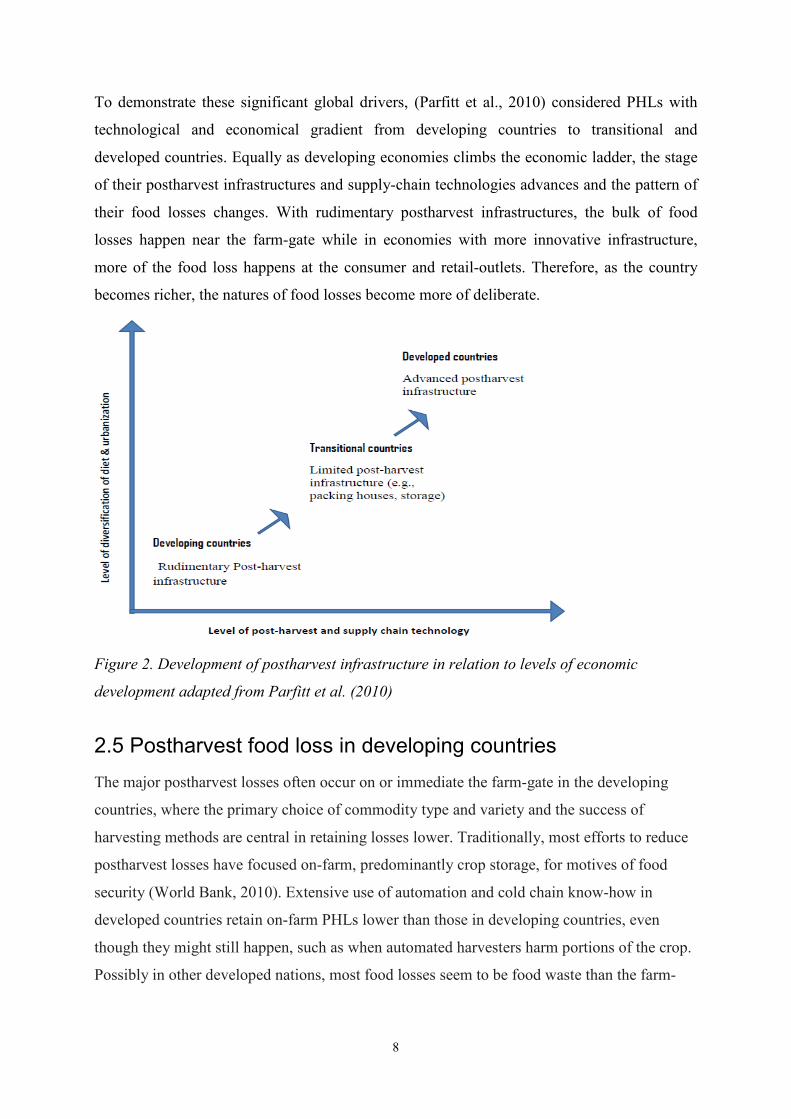
To demonstrate these significant global drivers, (Parfitt et al., 2010) considered PHLs with
technological and economical gradient from developing countries to transitional and
developed countries. Equally as developing economies climbs the economic ladder, the stage
of their postharvest infrastructures and supply-chain technologies advances and the pattern of
their food losses changes. With rudimentary postharvest infrastructures, the bulk of food
losses happen near the farm-gate while in economies with more innovative infrastructure,
more of the food loss happens at the consumer and retail-outlets. Therefore, as the country
becomes richer, the natures of food losses become more of deliberate.
Figure 2. Development of postharvest infrastructure in relation to levels of economic
development adapted from Parfitt et al. (2010)
2.5 Postharvest food loss in developing countries The major postharvest losses often occur on or immediate the farm-gate in the developing
countries, where the primary choice of commodity type and variety and the success of
harvesting methods are central in retaining losses lower. Traditionally, most efforts to reduce
postharvest losses have focused on-farm, predominantly crop storage, for motives of food
security (World Bank, 2010). Extensive use of automation and cold chain know-how in
developed countries retain on-farm PHLs lower than those in developing countries, even
though they might still happen, such as when automated harvesters harm portions of the crop.
Possibly in other developed nations, most food losses seem to be food waste than the farm-
8
gate, with superior bulks at the consumer channel than from the activities of retailers (Hodges
et al., 2011). The postharvest schemes of developing countries need substantial investment to form more
formal markets and advance their performance to a place where PHLs can be considerably
reduced. Particular of these developments have to take the form of public ‘goods’ comprising
infrastructure for instance the expansion of all-weather feeder road and rail network so that
commodities can reach right place at right time for right customer, a problem particularly
severe in Africa where transportation expenses can be five times those in Asia (Rigg et al.,
2009). Davis (1980), provided an illustration of the significance of the transport situations,
stating an article available in the Wall Street Journal (26 June, 1980). It was described that
production circumstances in Zaire changed from good to ideal, with the nation having the
possibility to feed much of the inhabitants on the continent of Africa. Still, it lost competence
to feed its own population due to a basic reason: Zaire has traditional transportation structure,
a crumbling railroad system and practically no modem roads. The article voiced of farmers
who are losing hope, since they easily cannot bring their crops to marketing places. Indeed,
this is not unique to Zaire, but common trend to a great number of countries in Africa.
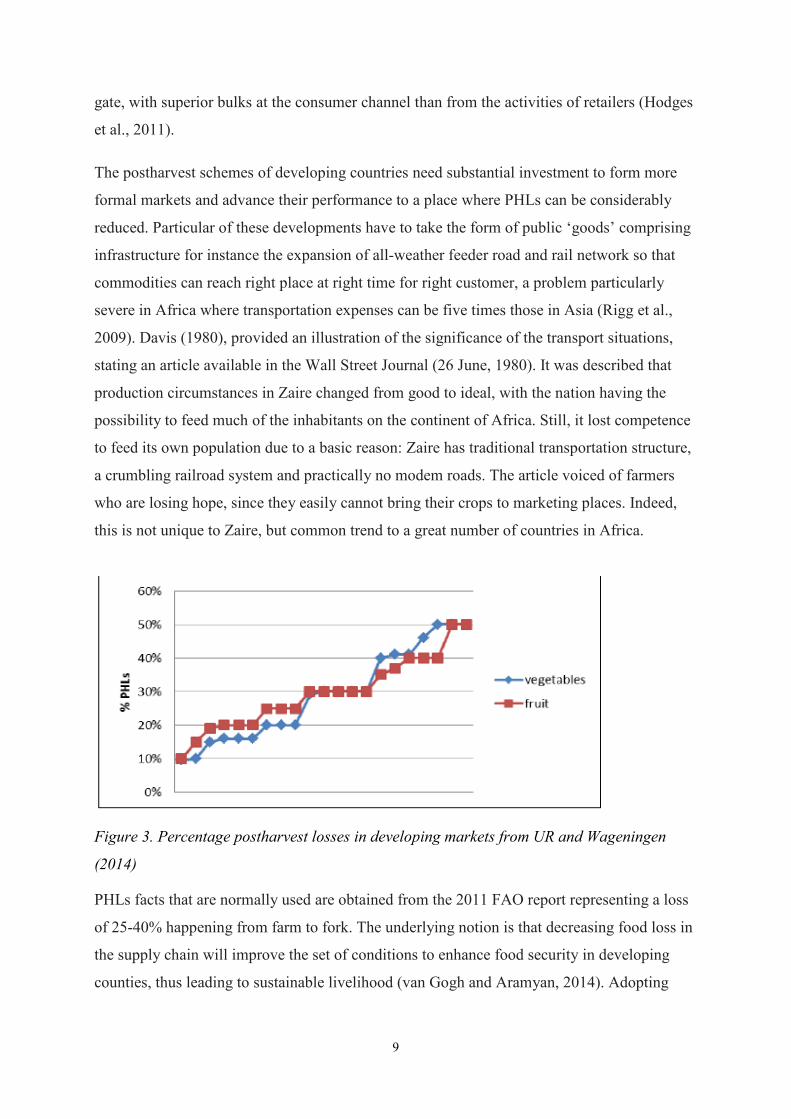
Figure 3. Percentage postharvest losses in developing markets from UR and Wageningen
(2014)
PHLs facts that are normally used are obtained from the 2011 FAO report representing a loss
of 25-40% happening from farm to fork. The underlying notion is that decreasing food loss in
the supply chain will improve the set of conditions to enhance food security in developing
counties, thus leading to sustainable livelihood (van Gogh and Aramyan, 2014). Adopting
9
improved methods and automation can free the time to devote on more profitable off-farm
activities(World Bank, 2010). Appropriate market organizations may need to be developed and stimulated to allow
marketing community and individuals to best react to market demand. Cooperative marketing
can take numerous forms and for grains might comprise inventory credit arrangements and
Warehouse Receipt Schemes to hasten the efficient elimination of the commodity from the
farmer into safe central storage system (Coulter and Shepherd, 1995). Effective marketing
system relies on a dependable supply of better-quality produce and this can be attained by
adopting value-added technologies that also lesser postharvest losses. In developing nations,
the incentives to minimize postharvest losses are much greater as loss reductions can
straightforward improve the life and food safety of the poor, and, possibly, food security and
quality with related health related benefits. The current attention for postharvest exploration in perishable products may be related with
increasing concern for food safety (Pariser, 1982, Greeley, 1991). Food quality and safety
aspects are receiving increased attention in food market (Henson and Loader, 2001).
According to (Bourne, 1977), most of studies that conduct actions in the extent of PHLs
reduction dedicate their efforts entirely to diminishing losses in grains and dry legumes. This
approach is perhaps based upon the element that the cereals and dry legumes are principal
foods and contribute foremost part of the calorie consumption of people in developing
nations. However, as (Bourne, 1977) recaps, some of the main nutritional insufficiencies in
developing nations, particularly of vitamins and minerals, can only be relieved through better
intake of fruits and vegetables. Shortages of these trivial nutrients entail an extensive period
of time to produce apparent clinical indications than do deficits in calories and proteins. But
shortages in trivial nutrients can surge mortality rates as certainly as calorific and protein
insufficiencies.
2.6 Strategies for reducing postharvest losses Mrema and Rolle (2002), discussed an advancement of priorities inside the postharvest
handling situation of developing nations from a predominantly technical emphasis geared
towards the diminishing of losses, to a more all-inclusive method intended to tie on-farm
activities to processing, marketing, and distribution. The major problems which contributes
for high postharvest losses relates with poor marketing systems, poor research and
10
improvement capability, and insufficiencies in guidelines, infrastructure, and information
sharing. Consistent analysis of every commodity’s production and handling practices would
be focal point in creating effective management strategies for reducing postharvest loss and
also a cost-benefit examinations to understand the return on investment in the suggested
postharvest technologies is indispensable (Kitinoja and Gorny, 1999). Goletti (2002) also mentioned the most appropriate concerns for developing countries: the
necessity for a regulatory basis that stimulates growth while safe-guarding well-being; for
sufficient market information to be given to all members participated; for additional
investments in postharvest exploration; and for involvement in international bargains which
endorse trade and food security. Evidently reducing postharvest losses of previously produced
food is more sustainable than boosting production to pay off for these losses, however, less
than 5% of the subsidy for agricultural exploration is assigned to postharvest research extents
(Kader, 2003 ). The drivers for change up to 2030 differ from developed nations to developing nations. In the
developed world, they include consumer education campaigns, carefully targeted taxation,
and private and public sector partnerships sharing the responsibility for loss reduction. The
developing countries drivers include more widespread education of farmers in the causes of
PHLs, better infrastructure to connect smallholders to markets, more effective value chains
that provide sufficient, financial incentives at the producer level, opportunities to adopt
collective marketing and better technologies supported by access to microcredit, and the
public and private sectors sharing the investment costs and risks in market-orientated
interventions (Hodges et al., 2011). (Stuart, 2009b) offered an extended list of notions about
in what manner consumers, retailers, governments and other groups can reduce food losses,
while financial costs, logistic difficulties and consumer tastes might stance in the way. For
numerous commodities in developed nations, food loss has dropped in current times (Buzby
et al., 2009) and new loss-reducing expertise are under expansion. However, developing
countries need exploration and dependable loss estimates for various foods types in the
postharvest chain to pinpoint where food loss can be diminished efficiently.
11
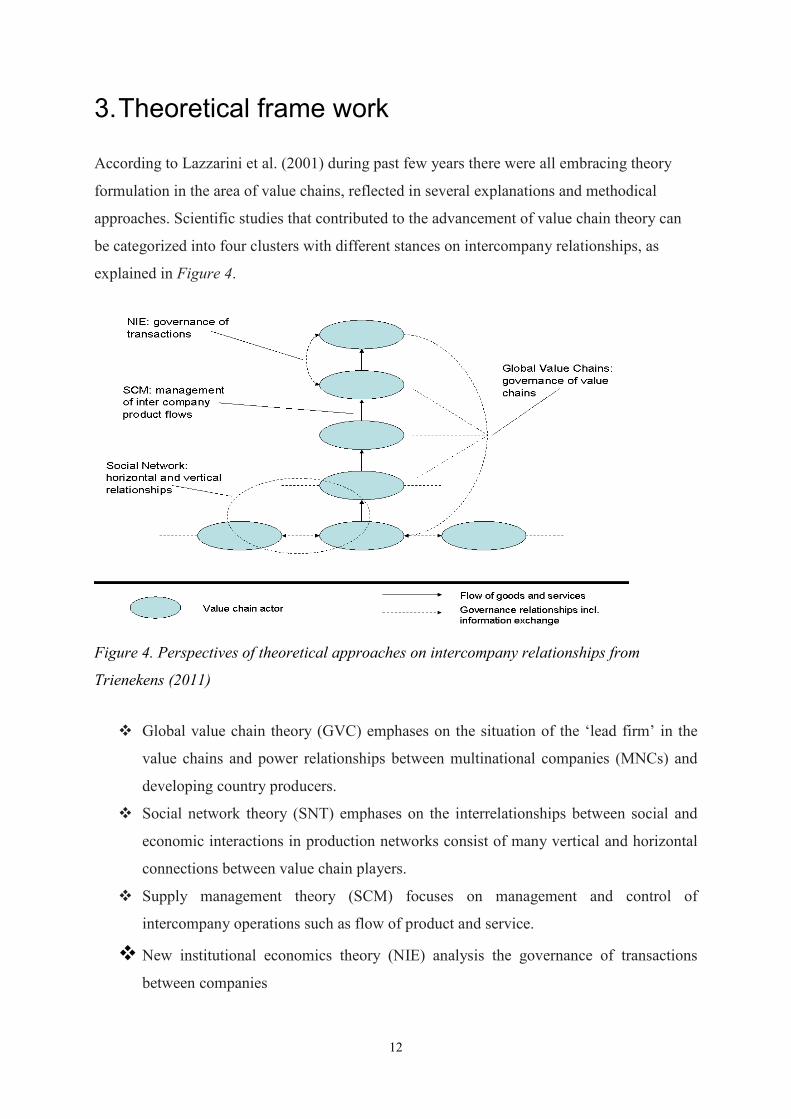
3. Theoretical frame work According to Lazzarini et al. (2001) during past few years there were all embracing theory
formulation in the area of value chains, reflected in several explanations and methodical
approaches. Scientific studies that contributed to the advancement of value chain theory can
be categorized into four clusters with different stances on intercompany relationships, as
explained in Figure 4.
Figure 4. Perspectives of theoretical approaches on intercompany relationships from
Trienekens (2011)
Global value chain theory (GVC) emphases on the situation of the ‘lead firm’ in the
value chains and power relationships between multinational companies (MNCs) and
developing country producers.
Social network theory (SNT) emphases on the interrelationships between social and
economic interactions in production networks consist of many vertical and horizontal
connections between value chain players.
Supply management theory (SCM) focuses on management and control of
intercompany operations such as flow of product and service.
New institutional economics theory (NIE) analysis the governance of transactions
between companies
12
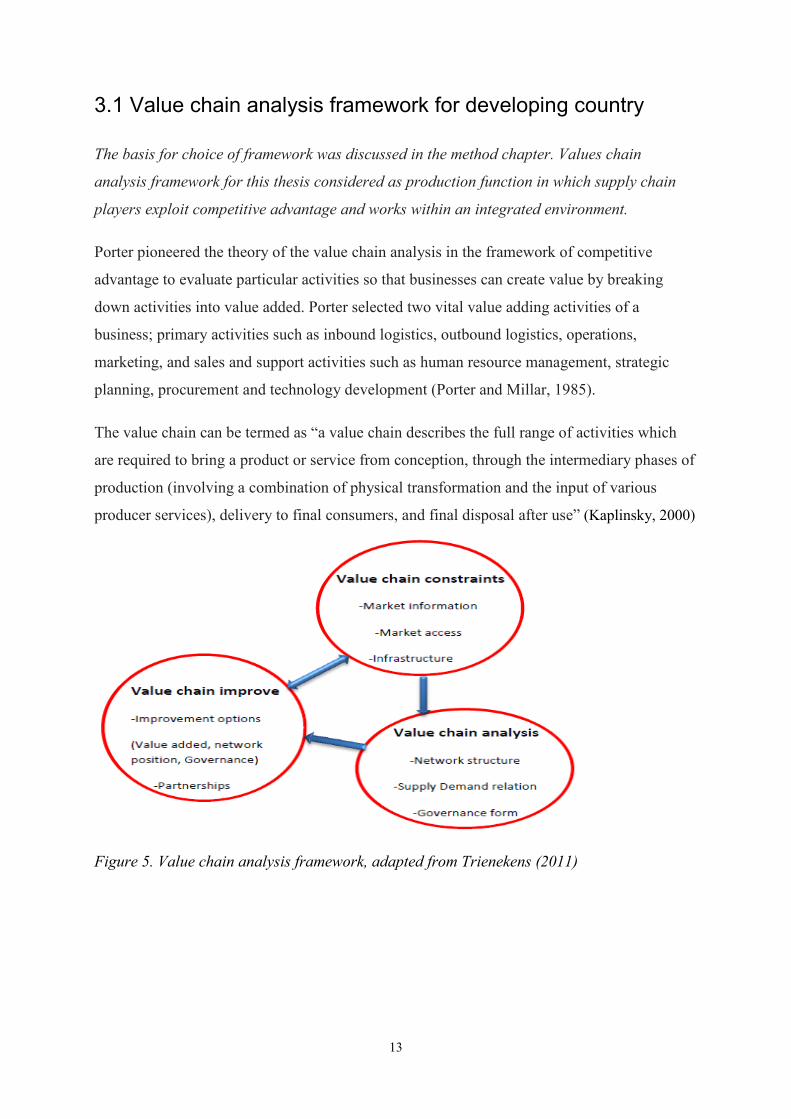
3.1 Value chain analysis framework for developing country The basis for choice of framework was discussed in the method chapter. Values chain
analysis framework for this thesis considered as production function in which supply chain
players exploit competitive advantage and works within an integrated environment. Porter pioneered the theory of the value chain analysis in the framework of competitive
advantage to evaluate particular activities so that businesses can create value by breaking
down activities into value added. Porter selected two vital value adding activities of a
business; primary activities such as inbound logistics, outbound logistics, operations,
marketing, and sales and support activities such as human resource management, strategic
planning, procurement and technology development (Porter and Millar, 1985). The value chain can be termed as “a value chain describes the full range of activities which
are required to bring a product or service from conception, through the intermediary phases of
production (involving a combination of physical transformation and the input of various
producer services), delivery to final consumers, and final disposal after use” (Kaplinsky, 2000)
Figure 5. Value chain analysis framework, adapted from Trienekens (2011)
13
3.2 Value chain constraints 3.2.1 Market access The food market in developing economies can be classified as A- B- and C-systems with
different market channels and a variation in quality demand and safety (Ruben et al., 2007).
The A system commonly occurs of small scale harvesters that distributes to a limited market
(local) and a low income chain (Ruben et al., 2007). Despite the fact that this market intents at
a local level but it can also be part of other market system through middlemen. This usually
builds to be part of extended chain while the added value is shared by a large number of
players. The locations from production to consumption are lengthy and the producers have
limited market information. In developing countries despite the fact the A systems usually
supply a large quantity of agricultural produces, however the significance is fairly low. The B- market system is local supply chain which mostly aims supermarkets ranging from
middle to high income (Ruben et al., 2007). The farmers in these supply chains are usually
operates in a small or medium level and are connected to each other in associations,
cooperatives and contracts. The amounts supplied by the B- market systems are at large lesser
than what has delivered by the A market system, however produces larger value yet. They
also accomplish quality standard to domestic and in certain cases international safety
standards for retailers to a greater extend when related to the A market system (Ruben et al.,
2007). The C market system is mostly focused on export market; however the products those
are inappropriate for export market is aimed to the domestic market (Ruben et al., 2007). The
C market systems are coordinated to a higher degree than the other market systems. In this
system fewer players exist and delivers a fewer quantity products with greater added value
(Ruben et al., 2007)
3.2.2 Infrastructure and resources The lack of affordable, reliable and adequate infrastructure facilities touches the life of developing
country’s family (Lebo and Schelling, 2001). In developing markets, there are four significant
constraints concerning infrastructure and resources. Firstly, there is limited access to input
resources. Secondly, geographic location of many producers that constrained by long distance for
the accessibility of market location and end consumers. Thirdly, lack of skilled human resource
and technology is a limit factors for markets to develop for production and dissemination drives.
Moreover, there is inadequate infrastructure concerning information and distribution. Efficient
14

distribution of products and information dissemination are basic conditions for a supply chain to
advance.
There are several scholars who argue that infrastructure is certain constrain for supply chains in
developing countries (Viswanadham, 2006, Shukla and Jharkharia, 2013, Barrett and
Mutambatsere, 2008). Lack of proper infrastructure and resources for load, transport, process and
cold storage are some of the ultimate drives for food loss in the fresh supply chains in developing
economies ((Viswanadham, 2006, Shukla and Jharkharia, 2013). Beyond these infrastructural
problems absence of information infrastructure is a main hindrance for the option of improvement
in the value chains (Shukla and Jharkharia, 2013). This problem is enormously related with
information gap between producers and consumers which in turn results in difficulties to estimate
balance in supply and demand. In developing countries, there are a large number of intermediaries along supply chains, which
can match the immature infrastructure, however it remains as huge cost for the chain (Boer and
Pandey, 1997). Local food chain systems which denotes various food systems usually has
disorganized dissemination infrastructure in developing countries (Gebresenbet and Bosona,
2012) This is usually exhibited through distribution system which is decentralized and huge
transport cost for each unit. Several producers residing in the rural locations are inhibited by
insufficient transportation infrastructure thus it is important in these locations to emphasis on
developing the collection centre, packaging, storage and distribution infrastructure of agricultural
products (Gebresenbet and Bosona, 2012).
3.3 Value chain analysis 3.3.1 The network structure The network perspective offers trust and openness amid the players as a condition for
achievement of the best possible outcomes from cooperation. The network theory is
characterized by three principal variables: players, activities and resources (Snehota and
Hakansson, 1995). The network approach (structure) in a value chain is greatly reliant on what
market channels players have chosen (Trienekens, 2011). In supply chain networks, players are
those who perform goal oriented activities or control resources. They can be an individual or
group of firms that embedded in economic relationships. The chain players perform activities
by creating, using, consuming heterogeneous bundles of commodities which can be controlled
directly or indirectly. These two forms of controls are of typical interest as the former is based
on ownership and the latter is attained through relationships. Significance of indirect control
15
arises when supply players forms exchange relations with other players hence connections of
dependence are formed and therefore their resources controlled by the central player. In this
perspective, players incline to be mutually independent to effectively coordinate their
capabilities and activities (Snehota, 2004).
Lazzarini et al. (2001) developed a theory called “netchain analysis” to achieve a network
analysis on condition where horizontal and vertical relationships in a value chain exist. In this
model both supply chain and network approaches are used to explore inter organizational
relationships focusing on value creation and harmonized sources within players in a network.
Supply chain analysis emphases on vertical transactions among the players in the supply
chain for instance contractual arrangement and logistics management (Lazzarini et al., 2001).
Network analysis underlines the horizontal relations between players in a network and
assesses social attachments and knowledge transfer. The netchain analysis highlights on
mapping out players on each phase of the value chains and their relationships to players on
the same phase. Relation development is intensely affected by the players’ opinions,
expectations and interests in addition to their mutual efforts in the collaboration process. As
(Mattsson and Johanson, 1992) shows, uniqueness could rise with the enhancement of the
specialization process. From a network viewpoint, positioning and network approach are
interrelated notions that influence players’ behavior. Network theories disclose the players’
visions and intents in the network. To declare effective controlling of their connections with
suppliers firms must have ample knowledge about the linkages they are embedded (Möller
and Halinen, 1999) 3.3.2 Supply and Demand relationship This section examines the economic impacts of food losses in a low-dimension partial
equilibrium analysis theory.
Reducing food loss in supply chain and its Impact on price, quantity and welfare
Economic perspective of value chain aims at the incorporation of business harmonization and
act of balance between supply and demand along the supply chain. It attempts to combine
both suppliers and customers in one concurrent business operation. It extents the whole chain
from original source to the final consumer (Halldorsson et al., 2007). Figure 6 shows the
market for a food commodity chain, d with a standard downward sloping demand curve and a
standard upward sloping supply curve (Salvatore, 2008). Pricing mechanism is a system in the
16
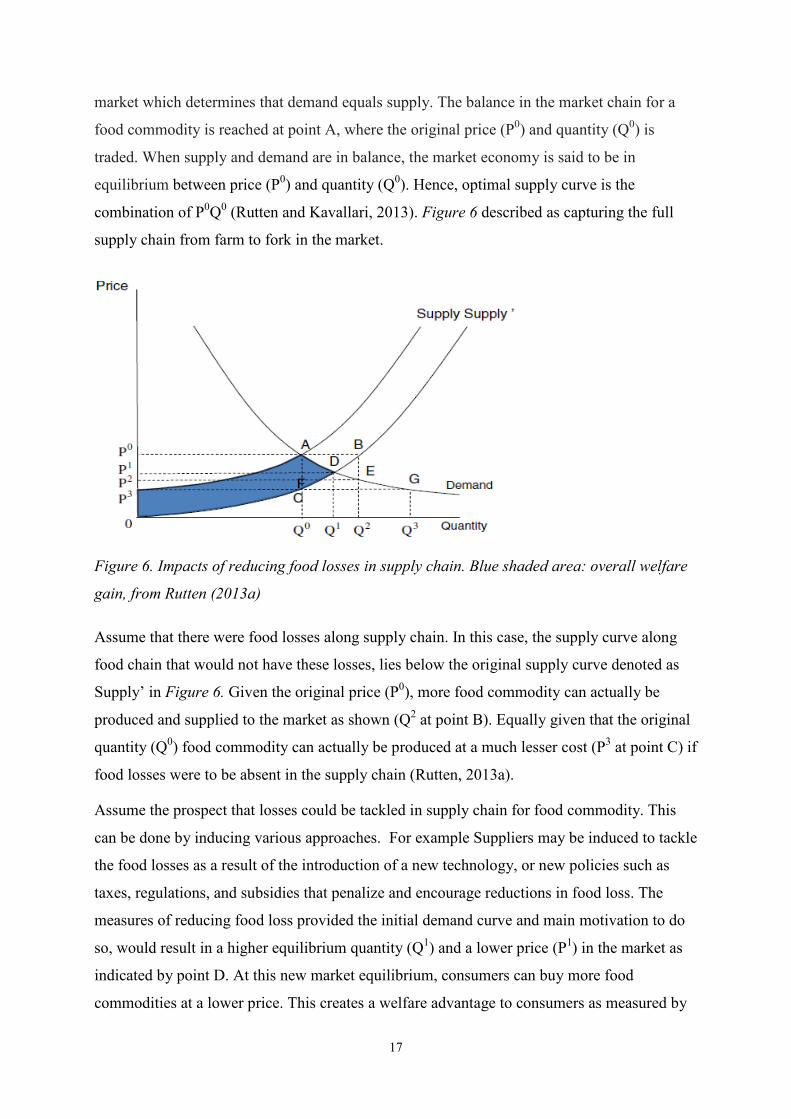
market which determines that demand equals supply. The balance in the market chain for a
food commodity is reached at point A, where the original price (P0) and quantity (Q0) is
traded. When supply and demand are in balance, the market economy is said to be in
equilibrium between price (P0) and quantity (Q0). Hence, optimal supply curve is the
combination of P0Q0 (Rutten and Kavallari, 2013). Figure 6 described as capturing the full
supply chain from farm to fork in the market.
Figure 6. Impacts of reducing food losses in supply chain. Blue shaded area: overall welfare
gain, from Rutten (2013a)
Assume that there were food losses along supply chain. In this case, the supply curve along
food chain that would not have these losses, lies below the original supply curve denoted as
Supply’ in Figure 6. Given the original price (P0), more food commodity can actually be
produced and supplied to the market as shown (Q2 at point B). Equally given that the original
quantity (Q0) food commodity can actually be produced at a much lesser cost (P3 at point C) if
food losses were to be absent in the supply chain (Rutten, 2013a).
Assume the prospect that losses could be tackled in supply chain for food commodity. This
can be done by inducing various approaches. For example Suppliers may be induced to tackle
the food losses as a result of the introduction of a new technology, or new policies such as
taxes, regulations, and subsidies that penalize and encourage reductions in food loss. The
measures of reducing food loss provided the initial demand curve and main motivation to do
so, would result in a higher equilibrium quantity (Q1) and a lower price (P1) in the market as
indicated by point D. At this new market equilibrium, consumers can buy more food
commodities at a lower price. This creates a welfare advantage to consumers as measured by
17
the change in the consumer's surplus of P0ADP1 (Rutten, 2013a). Similarly, producers can sell
more food commodities at a lower price. This causes a change in the producers’ surplus of
P1D0 - P0AP3, which is also positive outcome. The overall welfare advantage equals the sum
of the changes in the producers and the consumers’ surplus, which amount to the area of
P3AD0, the blue shaded region under the demand curve and between the two supply curves
(Lipinski et al., 2013b) Reducing food waste in demand and its Impacts on price, quantity and welfare Figure 7 describes the market for a food commodity along the supply chain from farm to fork
designed into a standard downward sloping demand curve and a standard upward sloping
supply curve. As illustrated in the Figure 7 the market equilibrium takes place at point A,
where the equilibrium price is P0 and the equilibrium quantity traded is Q0(Salvatore, 2008).
Assume that there are food losses in the consumption of this commodity, in that buyers
(consumers) waste portion of what they demand. In that case, the socially optimal demand
curve that would not have these losses lies to the left of the original demand curve is shown
by Demand’ in Figure 7 (Nicholson and Snyder, 2011). Provided that the original price, P0,
less food commodity needs to be consumed (Q2 at point B) in order to attain some level of
utility if waste portion was to be absent. On the other hand, the original equilibrium quantity
(Q0) entails a much lesser value to the consumers (P3 at point C) (Rutten, 2013a). Consumers could be convinced to tackle food waste as a result of a growing morale against
waste. There could be introduction of new policies, regulations and taxes that penalizes and
encourage reductions in food waste. Avoidance of waste in food consumption, provided the
original supply curve and underlying incentive of reduction in food waste would result in a
lower equilibrium quantity, Q1, and in lower price, P1, in the market as represented by point
D. At this equilibrium, producers are capable to sell less commodity at a lower price, as a
result their benefit (welfare) is negatively affected as indicated by a change in the producers
surplus of P1DE -P0AE = − DAP0 . Taking the subtraction between the area under the two
demand curves (old and new) and above the two prices (old and new) respectively, P1DF -
P0AG, creates a change in the consumers’ surplus of P1DBP0 –BAGF which is negative value
(Rutten, 2013a). The variance in the consumers surplus if food waste is eliminated equals to P1DF -P0BF =
P1DPB0 which is positive value. The over-all variation in society welfare equals P1DBP0 -
P1DAP0 = − BDA, the red shaded part in Figure 2 (Rutten and Kavallari, 2013). While the
18

equilibrium quantity move down from Q0 to Q1 which is the distance between Q2Q0 or BA
denoted food waste and was not eaten by consumers in the first place, thus actual food intake
is going up from Q2 to Q1 (Rutten, 2013a).
Figure 7. Impacts of reducing food waste in demand. Red shaded area: overall welfare loss
from Rutten (2013a)
3.4 Value chain enhancement 3.4.1 Value added Value chain enhancement can be done through different methods such as product upgrading,
functional upgrading, inter sectorial upgrading and process upgrading. Upgrading of
processes and products are often used upgrading option for value added in emerging
economies. Functional improvements indicate to the practices of insourcing production and
inter sectorial improvement to differentiating the business line. Product upgrading can
classified as internal and external (Trienekens, 2011). Internal improvement on supply chain
focuses to characteristics such as product value, packaging, and composition. External
development is more associated to the features of the processes such as fair trade or green
production. Developments concerning handling, transport, packaging and storage facilities are
significant aspects to nurture quality and reduce loss of fresh produce along supply chain
(Kader, 2004). With the intent of improving quality and safety of production along with
production processes some standard quality assurance and certification systems can be
applied (Trienekens and Zuurbier, 2008).
19
Process improvement links to the optimization of products and distribution in the production
system (Trienekens, 2011). Developments of new technologies are often required in order to
optimize the productions. Distribution system can be upgraded by better interaction between
the players,’ use of new transport technology, cold chain and practice of GPS systems,
internet access and mobile phones. In developing countries functional upgrading continued to
remain at low level as they deliver services for developed countries, therefore value adding
occurs in the final parts of the chain. Certain value adding activities have increased in the
supply chain of developing countries for instance juice processing, yet activities in form of
branding and marketing needs big measure (Humphrey and Memedovic, 2006).
20
4. Method
4.1 Choice of theoretical framework and literature review In this thesis, the literature reviews were collected with the purpose of creating awareness on
production of fruits and vegetables in developing countries. Furthermore information about
postharvest losses and handlings of the fruits and vegetables were acquired from the literature.
The collected relevant literatures were then used for the purpose of the interview and as a tool
during discussing and analysing the empirical evidences. The theoretical framework for this
study was selected on the bases of Trienekens (2011) value chain analysis for developing
countries. It consists of three theoretical approaches within the value chain framework such as
value chain constraints, value chain analysis and value chain improvements. Value chain
constraint approach was used to identity what constraints exist in the supply chain concerning
market access, infrastructure and resources. Value chain analysis approach was used in the
framework to examine the network structures, governance structure and value adding
activities in the supply chain. The last approach deals with options for improvement within
the value chains. The theoretical framework was used to analyse the supply chain channels for
selected 11 fruits and vegetables in Ethiopia. The selection of framework was based on the
appropriateness of value chains for the developing country. Trienekens (2011) framework
comprises global value chains, which was not included in this exploration as it mostly focuses
the domestic market in Addis Ababa, Ethiopia. Moreover, other research papers (Rutten,
2013a, Kader, 2004, 2009) have been used in the theoretical framework so as to elaborate
which were not covered by (Trienekens, 2011).
4.1 Sample selection Trade industry office was instrumental for the selection of the major wholesalers of fruits and
vegetables in Addis Ababa, Ethiopia. After purposive selection of the wholesalers, the other
supply chain actors were randomly picked from the list of names provided by the wholesalers
interviewed as per the survey questionnaire was demanded wholesalers to provide their close
trade partner. Thus, other actors were then chosen based on the list of names supplied by
wholesalers interviewed. Afterwards, fresh produce types were determined through discussion
of marketing experts of Etfruit firm on the bases of high prevalence of losses and economic
contribution. After all, Etfruit wholesale distribution company was selected purposively as
unit of analysis for this study; which is the major domestic distributor and exporter of fresh
21
fruits in Ethiopia. In exploring the supply channels for fresh produces mainly downstream
(wholesaler-to-consumer) interview approach was used.
4.2 Sample size The total sample size for consumers channel were 120 households and 47 respondents of
supply chain players were interviewed in Addis Ababa, Ethiopia. The sample incorporated 3
Etfruit-wholesalers, 11 retailers, 3 exporters, 9 processors, 11 street vendors, 6 Etfruit
container seller and 3 other wholesalers on the basis of Etfruit wholesale information.
Downstream interview method commenced with wholesalers. Major Etfruit Distribution
Company has been selected as initial phases for the interview with three sample Etfruit
wholesalers. At the end of the interview, the wholesalers were solicited to disclose names of
retailers, processors, street vendor and other wholesalers with whom they most often
interacted. Based on the revealed information, three other wholesalers, six container sellers,
nine processors, eleven retailers, eleven street vendors and four exporters were selected in
Addis Ababa, where most of its marketing activities were held. Names of fresh produces
suppliers (producers) with whom Etfruit-wholesalers’ trade partner were then included for
needed information. In general, the total sample was sought to be equally distributed along
supply chain players given that trade partnership with Etfruit wholesale. Eleven fruits and
vegetables (oranges, mandarin, banana, avocado, mango, papaya, tomato, onion, potato,
cabbage and carrots) were selected on the basis of high loss occurrences. The aim of sample
was to validate equal representation of supply chain players associated with the fruits and
vegetables that this study was mainly intended in.
4.3 Mapping out supply chain players Quantities purchased from producers were provided by the Etfruit wholesalers and amounts
sold to other actors have been calculated using the estimate provided on the share of produce
sold to the actors with whom Etfruit wholesalers partnered. This has been the foundation in
developing derivation of the actual shares of fruits and vegetables for which Etfruit
wholesalers supplied at various channels and sold to their main actors with respect to total
volume sold. This was elucidated with flow-map in association with volume supplied by
Etfruit wholesalers and food lost through downstream supply chain (Etfruit wholesalers-
consumers) in Figure 8. Furthermore, it incorporated the upstream associations (Etfruit
wholesalers-producers) looking into major supplies of fruits and vegetables.
22

4.4 Estimation of postharvest loss Data was collected through using semi-structured questionnaires and personal observation
approaches. Mean and percentage were used to calculate the PHLs of fruits and vegetables at
different phases of supply chain. For supply chain actors such as Etfruit-wholesalers, retailers,
processors, street vendor, Etfruit-container seller and other wholesalers, loss estimate was
quantified and calculated as the difference between volume purchased and volume sold in
relation to total volume sourced. Loss route line was calculated by administering
questionnaires for marketing research experts of Etfruit-wholesale. Accordingly, the experts
were consulted to estimate loss value percent for eleven fresh produces along supply chain
channels on the bases of total food loss. At the end, average estimated loss percent was
determined for every fresh produce. The mean value was identical for three different Etfruit-
wholesale market experts. Therefore, it was extracted from supply chain actors’ data bases.
This was executed by multiplying total food losses experienced along each channel with
corresponding loss percent of each fresh produce within channel to obtain estimated food loss
amount. To estimate monetary value of losses occurred, actual food losses in kilograms (kg)
was multiplied by average selling prices of each fruit and vegetable.
4.5 Sample selection for Households A three-stage sampling scheme was used. The first stage involved purposive selection of
Local administration areas (sub-city) in connection with Etfruit wholesales information; the
second, selection of districts within this areas; and the third, selection of sample population
from each district. There are 10 local administration sub-cities in Addis Ababa city consisting
of 116 districts. Kirkos sub-city was selected as household survey unit because Etfruit
wholesalers disclosed good account of household members as their customers from this
district. Moreover, use practices of fruits and vegetables declines as one move from
population center to sparsely-populated city areas. Thus, it is densely populated sub city.
There are eleven districts in Kirkos sub-city from which four districts were selected randomly
given that these woredas are selected based on residents density as it increases representation
of population and concentration of fresh produces stallholders. Thus, four districts with a total
of 120 households were identified as unit of analysis for this study. These households are
located at four sample districts namely district 01, district 04, district 06 and district 08. The
sample was intended to be as representative of the household population of Addis Ababa city
23
as much as possible, except that for operational reasons households in the sparsely-populated
areas since this study conducted relatively in populated areas.
4.6 Sample size for households
Household information along with their corresponding addresses was obtained from particular
districts (woredas) for fair representation of population diversity and resource management.
Three categories of socio-economic status (SES) respondents are picked systematically from
each district having 10 traders, 10 employees and 10 other households by using interval
sampling. The same development has been applied for remaining three categories of districts.
Hence, the total sample size amounts to 120 householders consist of equal number of traders,
employees and other households for each district. Socio-Economic Status (SES) indicators
were mainly categorized on the bases of the income, occupation, and education. The purpose
of this assessment is to estimate the food loss happening after food serving at plate in the
household and to find whether there were significant differences among households with
high, Middle and those with low SES in contribution for food loss. The person in charge for
food serving (cooking) at home was consulted for data collection.
4.7 Estimation of food loss at household level
Data analyses was carried out with the support of descriptive statistics. Food loss estimates at
plate of household has been quantified and calculated as percentage of consumed amount for
over one week and amount that has been left from provided cuisine on plate in unit of grams
for each household. This has been accomplished by asking a person to estimate loss amount
from household members who held responsible in serving the ready meal for diners by the
support of food frequency questionnaires (FFQ). A food frequency questionnaire contains
structured lists of individual fresh produce or food groups. Subsequently, Household members
are asked to estimate the frequency of consumption and wastage of those foods at plate,
indicating the amount of food consumed as well as wasted over a given period of time (day,
week, and month) (Cade et al., 2004). Therefore, a total of 120 households are arranged
according to their Socio-Economic Status group based on parameters such as income earrings,
occupational status, and educational backgrounds. Thus, three categories of household groups
were formed; each category has 40 households with high socio-economic status, middle
socio-economic status and low socio-economic status.
24
5. The empirical study 5.1 Overview of Et-fruit
The Ethiopian fruit and vegetable marketing share company (Et-Fruit) was pioneered since
1980, as the Horticultural Development Corporation (HDC) with the intention of functioning
as a marketing body for entirely state held horticulture farms. Through liberalization and
decentralization of the state’s economic strategy, Et-fruit was restructured again in 1993 in
harmony with provision of the public enterprise. The range of its service provision has since
then expanded to comprise private-horticultural farmers striving to move into export market.
Et-Fruit can be labeled as a leading and major national distributor and exporters of fresh fruits
and vegetables, and processed horticultural produces. Thus, it played a significant character in
the advancement of the horticultural sub-sector of Ethiopia at large (www, Etfruit, 2015). Et-Fruit is the main domestic wholesalers and exporters of fresh fruits and vegetables,
processed and flower products in Ethiopia. The varieties of fruits distributed to domestic
markets are avocado, banana, grapefruit, mandarin, mango, lemon, lime, orange, processed
fresh produces such as orange marmalade, tomato juice, orange squash, strawberry jam and
guava nectar are similarly supplied to the domestic markets like fresh vegetables such as
tomato, onion and potato…etc. Marketing chain facilities of Et-Fruit have progressed to better
status of development since last three decades through to its better market network and
associated facilities compared with other wholesalers (www, Etfruit, 2015). Nowadays,
Etfruit has 500 permanent workers as well as hires-up to 400-700 laborers annually on the
bases of volumes delivered. Et-Fruit has established its dissemination center and outlets in 16
main cities of the country. In Addis Ababa, Et-fruit have four main wholesale places, 60 retail
outlets and 30 mobile-shops. The key suppliers of fresh produces are the Upper-awash Agro-
industry Enterprise, Metehara sugar factory and Horticultural development enterprise
followed small private horticulture growers such as North Omo agricultural development
enterprise and Elfora Agro-Industry. Furthermore, it provides other services as market
information, refrigerated semi-trucks for rent and import quality seed (www, CSA, 2014). On the other hand, household information was obtained from particular districts known as
Kirkos sub-city covered an estimated area of 14.72square kilometers. According to population
census of Ethiopia (2007), residents of the sub-city accounts for about 220,991 from total 5
million populations in the capital, Addis Ababa. 103,314 populations are male residents
25
while the remaining 117,677 populations are female residents. However, the total share of
population accounts for only 8% of Addis Ababa’s total population. Accordingly, the
population density of the sub-city amounts 15,012.97 people within a kilometer square (www,
CSA, 2014). Apparently, this shows that this area is overpopulated area in the capital city of
Ethiopia, Addis Ababa.
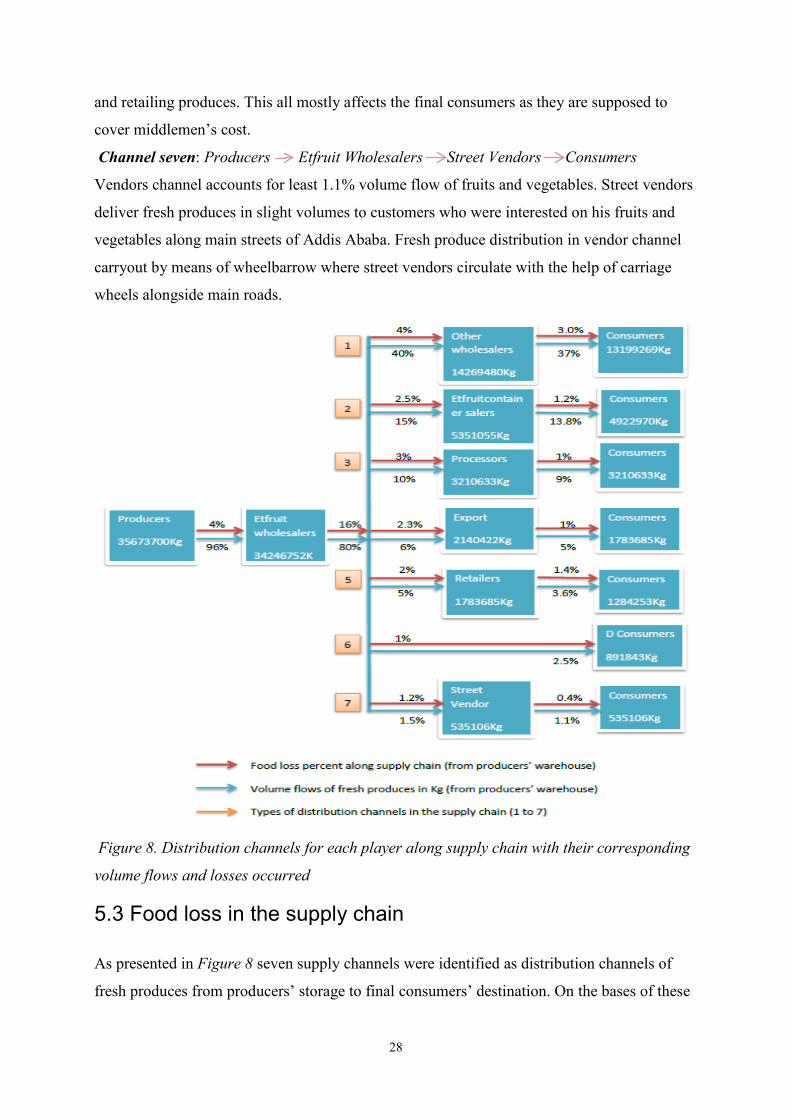
5.2 Etfruit supply chain channels Channel valuation was made mainly based on volume parameters that the channel has
accommodated from total supply. Supply chain channels as recapped in the Figure 8 was
developed from supply chain players’ assessment. There were seven main supply chain
channels for perishable produces which incorporates one international outlet and the rest
operates with in national level. The total quantity of fruits and vegetables obtained from farm
gate was 35673700 kg (100 percent) of eleven types of fruits and vegetables on annual bases.
As a result of food loss along the producers’ store until wholesales store, the total amount has
declined to 96 percent. From wholesale store, the fresh produces often be supplied and
distributed to other supply chain players. There was high chance of food loss until it got
consumer destination due to mode of transportation, storage facility and load facility. About
80 percent of fresh produces from Etfruit wholesale store distributed to other chain players.
However, 72% of fresh produces has finally reached consumers. As can be seen from Figure
8 the main suppliers from producers were Etfruit wholesalers with an estimated 96 percent
volume.
Channel one: Producers Et-fruit Wholesalers other wholesalers Consumers
Channel one (see Figure 8) distributed the highest volume of fruits and vegetables to final
consumers. It accounted for 37% of the total fresh produces supplied and distributed to final
customers and was found to be the most important distribution channel in terms of volumes
passed through to final consumers. There were several producers where Etfruit wholesalers
outsource to different market players in the supply chain. Players such as producers are most
important element of markets that harvests fresh produces for different intermediaries. Major
sources of fruit and vegetables for Etfruit Company were; small farm holders, state farm
(upper awash agro-industry enterprise), various Cooperatives (farmers’ association),
Methehara sugar factory, Hurso Military camp, Erergota Enterprise and private investors.
26
Channel two: Producer Etfruit Wholesaler Etfruit container seller Consumer channel
This channel accommodated 13.8% of volumes of fresh produces distributed in the supply
chain to final consumers. The channel was found to be the second vital marketing channel in
terms of volume supply and distribute. There were two main approaches that the Etfruit
Wholesale can reach final customer; direct purchase from wholesalers’ outlet and or direct
selling fresh produces through retail outlet to final customers. Each approach has different
selling strategies to accomplish the objective. The objective is to stimulate fair distribution of
fruits and vegetables to all customers. Therefore, customers have the opportunity to obtain the
fresh produces either by minimum purchase of 5kg directly from Etfruit wholesalers and or
maximum purchase of 2kg from Etfruit container retail-outlets.
Channel three: Producers Etfruit Wholesalers Processors Consumers channels
This supply channel accounts for 9% volume flows from total fruits and vegetables marketed
and distributed to final consumers. It is the third principal marketing channel in Addis Ababa.
Fresh produces are highly in demand and apparently witnessed enormously in juice making
plants where Africa juice processing plant and Yami juice processing plant takes the leads in
cuisine preparation. Despite the fact it is source of raw material for cosmetic industries; still
there were few maturing agro-processing plants in Addis for instance Kaliti food complex that
underpin its endeavor of blending avocado to produce macaroni and pasta. There were also
other local processing plants like Cosmetic Industry ´Zenit Gebse Eshet` has instigated
processing of hair pomade by means of avocado as raw material.
Channel four: Producers Etfruit Wholesalers Export Market international customers
This distribution channel accounts for 5% volume flows of entire fresh produces distributed
along Etfuit supply chain and an important distribution channel in terms of volume delivered
to an international outlet.
Channel five: Producer Etfruit Wholesaler Retailers Consumer
This channel distributed about 3.6% volumes of fruits and vegetables to the final consumers.
This supply channel was regarded as the fifth essential outlet with respect to volume delivered
for final customers. In this channel retailers supply fresh produces and provide roles such as
door to door service for several cafés, restaurants, supermarkets and juice making houses.
Channel six: Producer Etfruit Wholesaler Consumer
This channel accounts for 2.5% of total fresh produces supplied to final consumers. From the
consumers’ perspective, the shorter the supply chain channel, retail price would be more
likely affordable. At a retail store, the value final consumers pay for produce usually includes
the expenses of producing, packing produces, transporting produces, wholesaling produces,
27
and retailing produces. This all mostly affects the final consumers as they are supposed to
cover middlemen’s cost.
Channel seven: Producers Etfruit Wholesalers Street Vendors Consumers
Vendors channel accounts for least 1.1% volume flow of fruits and vegetables. Street vendors
deliver fresh produces in slight volumes to customers who were interested on his fruits and
vegetables along main streets of Addis Ababa. Fresh produce distribution in vendor channel
carryout by means of wheelbarrow where street vendors circulate with the help of carriage
wheels alongside main roads.
Figure 8. Distribution channels for each player along supply chain with their corresponding
volume flows and losses occurred
5.3 Food loss in the supply chain
As presented in Figure 8 seven supply channels were identified as distribution channels of
fresh produces from producers’ storage to final consumers’ destination. On the bases of these
28
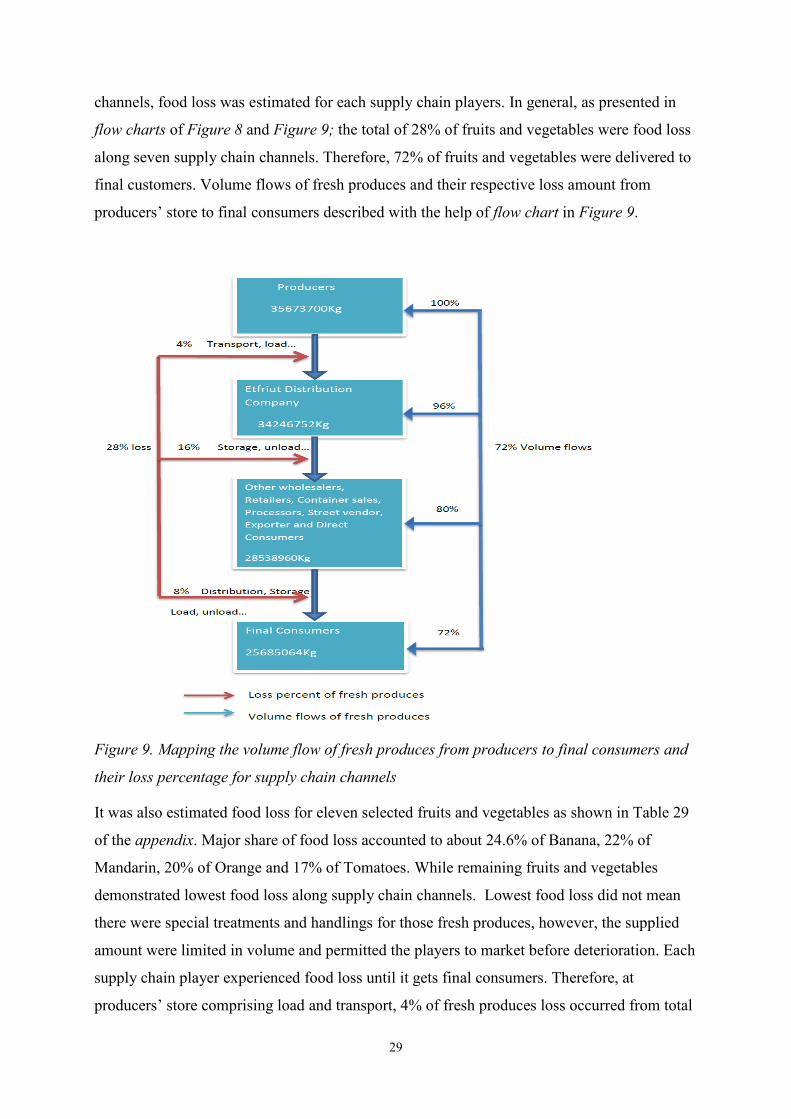
channels, food loss was estimated for each supply chain players. In general, as presented in
flow charts of Figure 8 and Figure 9; the total of 28% of fruits and vegetables were food loss
along seven supply chain channels. Therefore, 72% of fruits and vegetables were delivered to
final customers. Volume flows of fresh produces and their respective loss amount from
producers’ store to final consumers described with the help of flow chart in Figure 9.
Figure 9. Mapping the volume flow of fresh produces from producers to final consumers and
their loss percentage for supply chain channels
It was also estimated food loss for eleven selected fruits and vegetables as shown in Table 29
of the appendix. Major share of food loss accounted to about 24.6% of Banana, 22% of
Mandarin, 20% of Orange and 17% of Tomatoes. While remaining fruits and vegetables
demonstrated lowest food loss along supply chain channels. Lowest food loss did not mean
there were special treatments and handlings for those fresh produces, however, the supplied
amount were limited in volume and permitted the players to market before deterioration. Each
supply chain player experienced food loss until it gets final consumers. Therefore, at
producers’ store comprising load and transport, 4% of fresh produces loss occurred from total
29
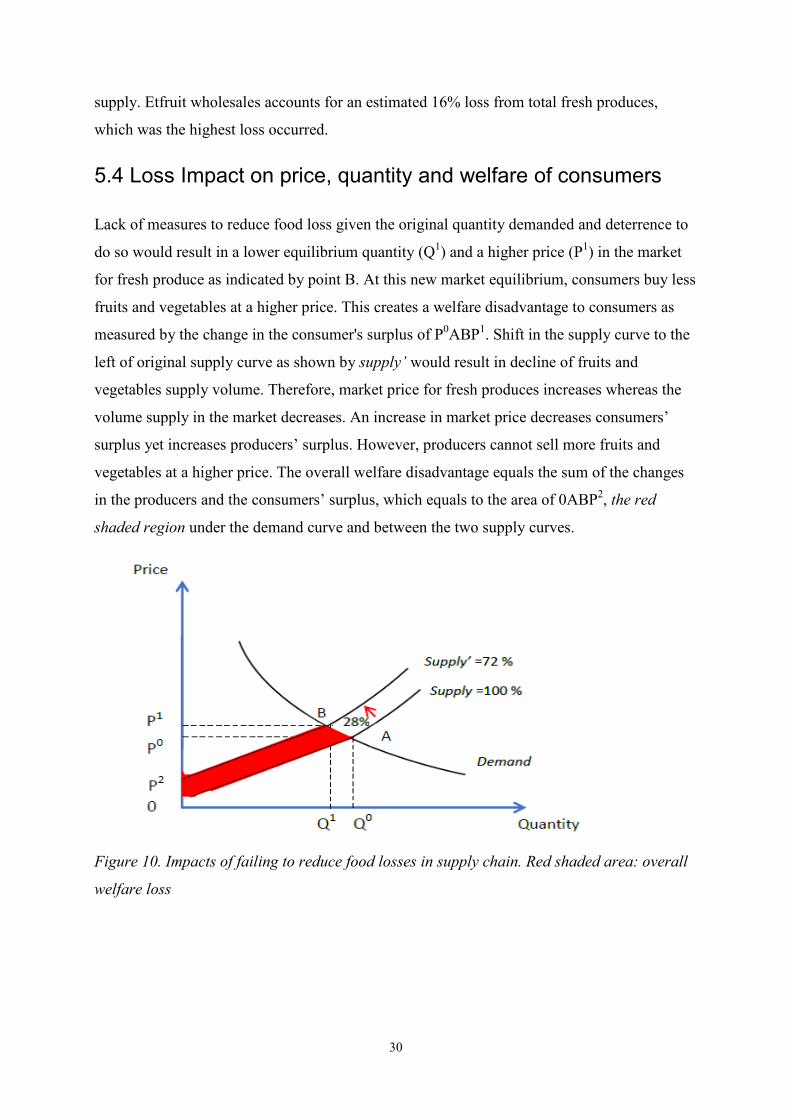
supply. Etfruit wholesales accounts for an estimated 16% loss from total fresh produces,
which was the highest loss occurred.
5.4 Loss Impact on price, quantity and welfare of consumers Lack of measures to reduce food loss given the original quantity demanded and deterrence to
do so would result in a lower equilibrium quantity (Q1) and a higher price (P1) in the market
for fresh produce as indicated by point B. At this new market equilibrium, consumers buy less
fruits and vegetables at a higher price. This creates a welfare disadvantage to consumers as
measured by the change in the consumer's surplus of P0ABP1. Shift in the supply curve to the
left of original supply curve as shown by supply’ would result in decline of fruits and
vegetables supply volume. Therefore, market price for fresh produces increases whereas the
volume supply in the market decreases. An increase in market price decreases consumers’
surplus yet increases producers’ surplus. However, producers cannot sell more fruits and
vegetables at a higher price. The overall welfare disadvantage equals the sum of the changes
in the producers and the consumers’ surplus, which equals to the area of 0ABP2, the red
shaded region under the demand curve and between the two supply curves.
Figure 10. Impacts of failing to reduce food losses in supply chain. Red shaded area: overall
welfare loss
30
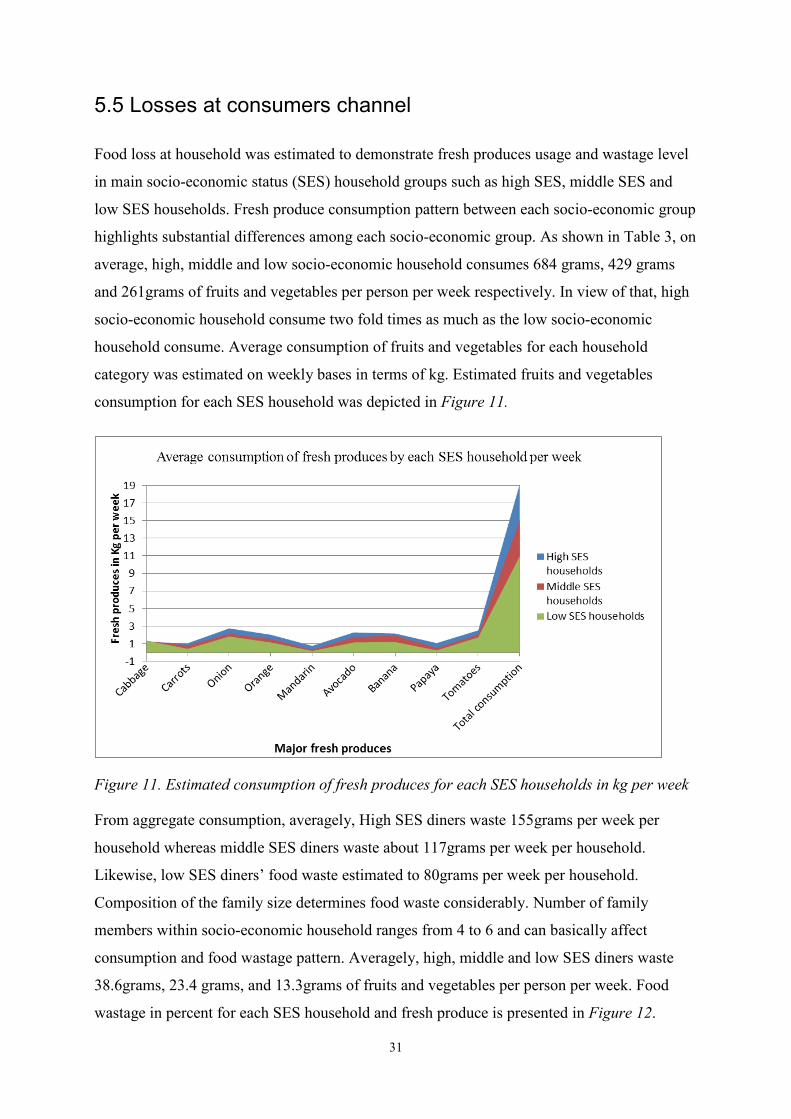
5.5 Losses at consumers channel Food loss at household was estimated to demonstrate fresh produces usage and wastage level
in main socio-economic status (SES) household groups such as high SES, middle SES and
low SES households. Fresh produce consumption pattern between each socio-economic group
highlights substantial differences among each socio-economic group. As shown in Table 3, on
average, high, middle and low socio-economic household consumes 684 grams, 429 grams
and 261grams of fruits and vegetables per person per week respectively. In view of that, high
socio-economic household consume two fold times as much as the low socio-economic
household consume. Average consumption of fruits and vegetables for each household
category was estimated on weekly bases in terms of kg. Estimated fruits and vegetables
consumption for each SES household was depicted in Figure 11.
Figure 11. Estimated consumption of fresh produces for each SES households in kg per week
From aggregate consumption, averagely, High SES diners waste 155grams per week per
household whereas middle SES diners waste about 117grams per week per household.
Likewise, low SES diners’ food waste estimated to 80grams per week per household.
Composition of the family size determines food waste considerably. Number of family
members within socio-economic household ranges from 4 to 6 and can basically affect
consumption and food wastage pattern. Averagely, high, middle and low SES diners waste
38.6grams, 23.4 grams, and 13.3grams of fruits and vegetables per person per week. Food
wastage in percent for each SES household and fresh produce is presented in Figure 12.
31
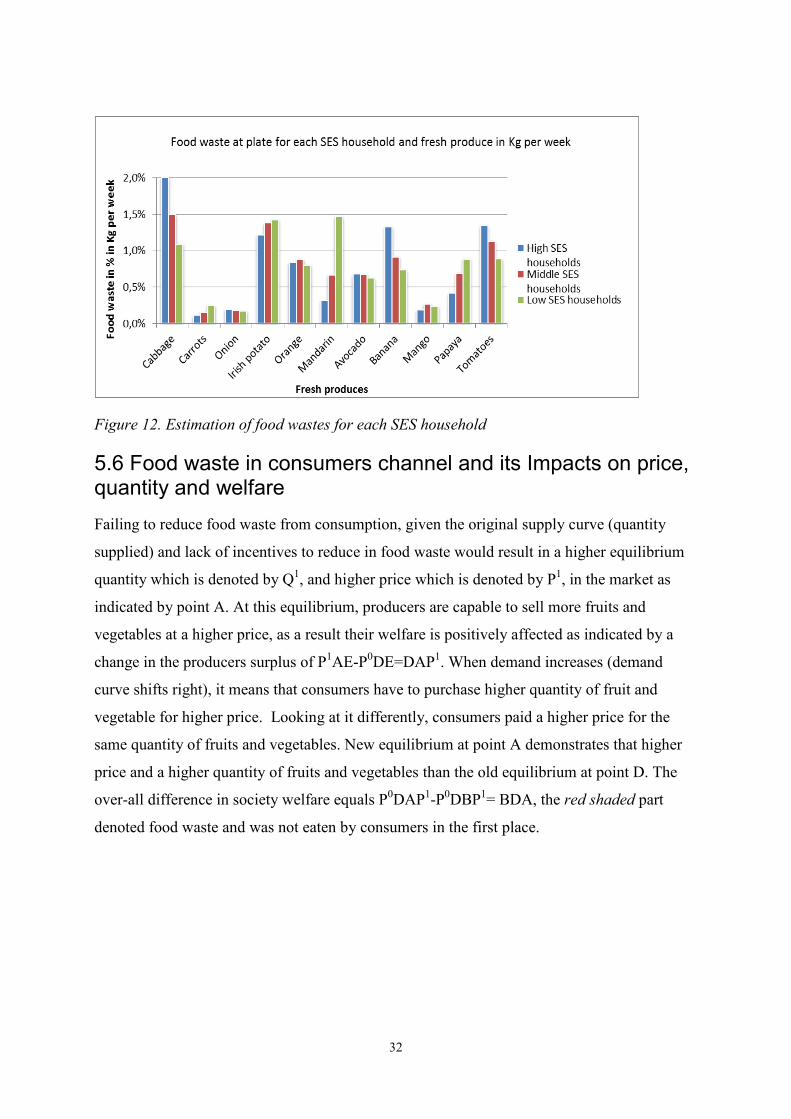
Figure 12. Estimation of food wastes for each SES household
5.6 Food waste in consumers channel and its Impacts on price, quantity and welfare Failing to reduce food waste from consumption, given the original supply curve (quantity
supplied) and lack of incentives to reduce in food waste would result in a higher equilibrium
quantity which is denoted by Q1, and higher price which is denoted by P1, in the market as
indicated by point A. At this equilibrium, producers are capable to sell more fruits and
vegetables at a higher price, as a result their welfare is positively affected as indicated by a
change in the producers surplus of P1AE-P0DE=DAP1. When demand increases (demand
curve shifts right), it means that consumers have to purchase higher quantity of fruit and
vegetable for higher price. Looking at it differently, consumers paid a higher price for the
same quantity of fruits and vegetables. New equilibrium at point A demonstrates that higher
price and a higher quantity of fruits and vegetables than the old equilibrium at point D. The
over-all difference in society welfare equals P0DAP1-P0DBP1= BDA, the red shaded part
denoted food waste and was not eaten by consumers in the first place.
32

Figure 13. Impacts of not reducing food waste in demand. Red shaded: overall welfare loss
5.7 Hindrances that promote food loss in the chain 5.7.1 Packing systems Lack of cold chain refrigeration is one of several setbacks that affect fruits and vegetables
held at Addis Ababa Etfruit storage. Further fresh produces deterioration has happened from
lacking necessary package materials. Despite the fact that all export deliveries are packed by
cardboard box as per the standard requirements for fresh fruits and vegetables and precautions
are taken. In the entire supply chain and handling system, packaging system has constrained
to maintain storage value and life. Almost all fresh produces reaches at Addis Ababa Etfruit
wholesale storage in exposed manner with poorly protected containers where plastic crates
covered with papers. The plastic crates are central packaging method along Etfruit-channels
for transporting fresh produces from producers’ storage to Etfruit-wholesale destination.
During moving fruits and vegetables by Etfruit-wholesalers, it tends to be exposed for further
severe damage mainly when plastic crates stacked on the top of each other. Therefore,
consumers in Addis Ababa such as small shops, supermarkets, container sellers and retailers
often have concern of receiving fresh produces. As presented in Figure 14 Etfuit wholesale
uses only plastic crates for packaging fruits and vegetables whereas export market players
often package by means of cardboard box. Certain chain players like container sellers,
processors, retailers and producers uses combination of packing materials such as plastic
crates, cartons, baskets and sacks. However, Players like Street vendors often lack packaging
material for fruits and vegetables.
33
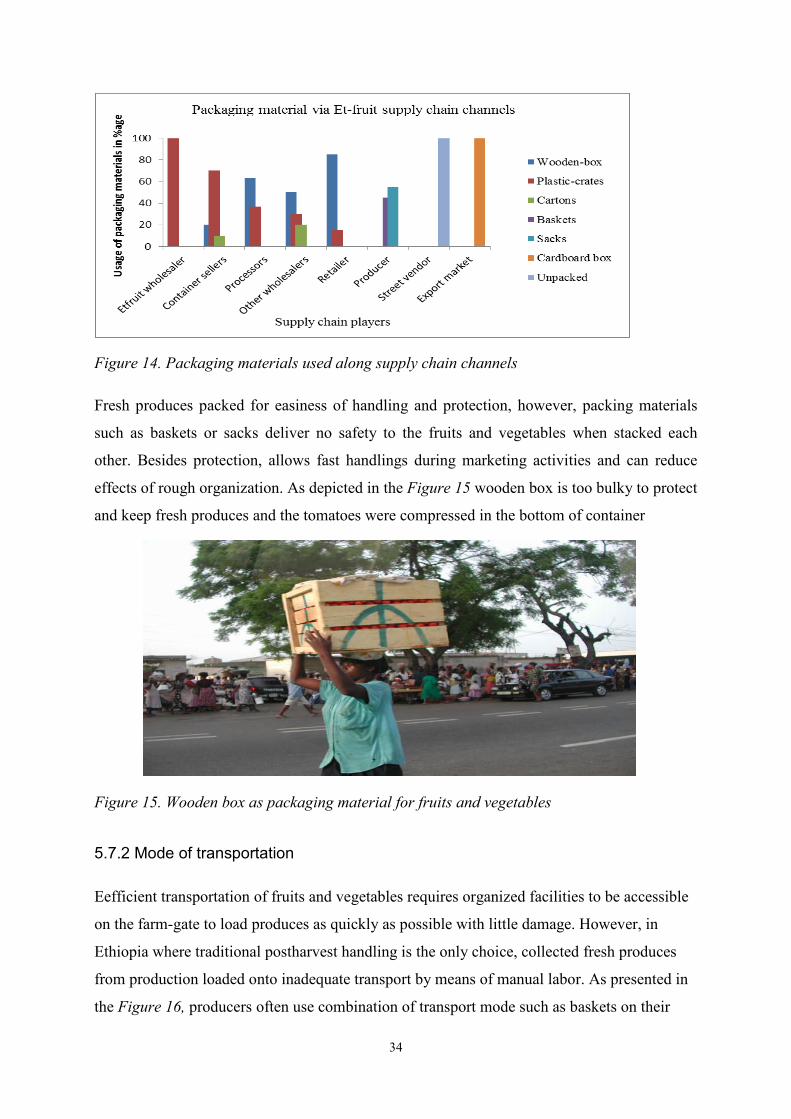
Figure 14. Packaging materials used along supply chain channels
Fresh produces packed for easiness of handling and protection, however, packing materials
such as baskets or sacks deliver no safety to the fruits and vegetables when stacked each
other. Besides protection, allows fast handlings during marketing activities and can reduce
effects of rough organization. As depicted in the Figure 15 wooden box is too bulky to protect
and keep fresh produces and the tomatoes were compressed in the bottom of container
Figure 15. Wooden box as packaging material for fruits and vegetables
5.7.2 Mode of transportation
Eefficient transportation of fruits and vegetables requires organized facilities to be accessible
on the farm-gate to load produces as quickly as possible with little damage. However, in
Ethiopia where traditional postharvest handling is the only choice, collected fresh produces
from production loaded onto inadequate transport by means of manual labor. As presented in
the Figure 16, producers often use combination of transport mode such as baskets on their
34
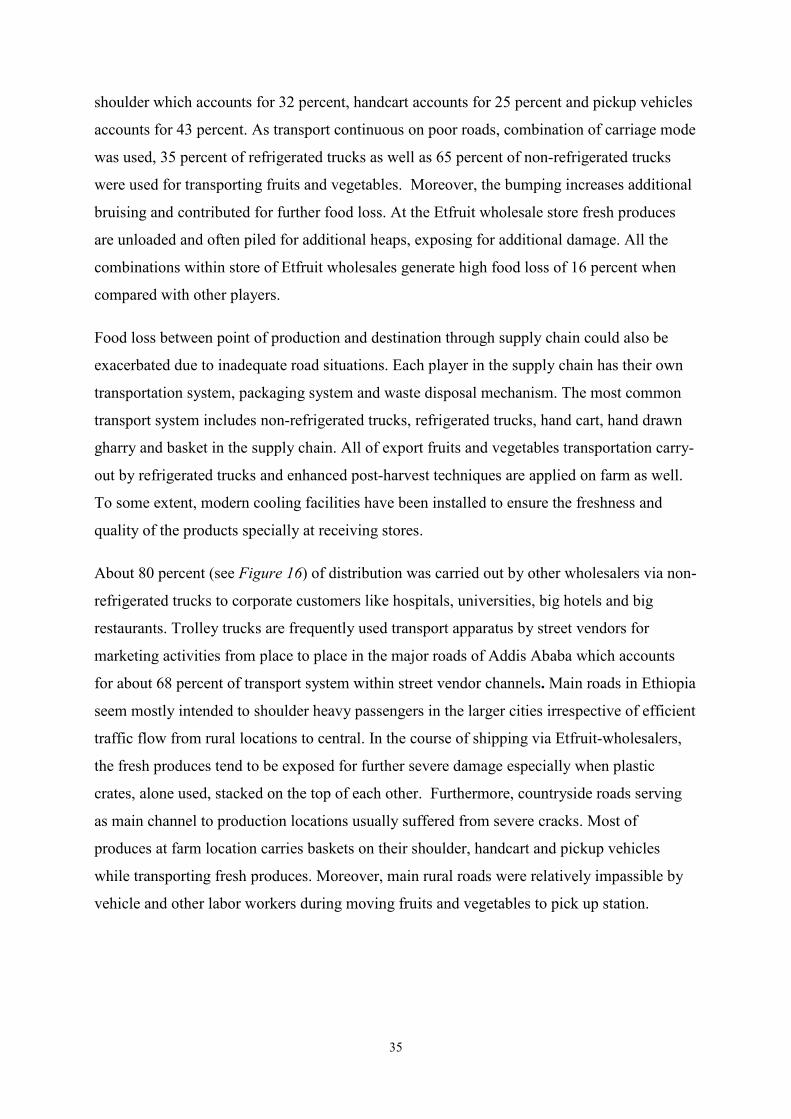
shoulder which accounts for 32 percent, handcart accounts for 25 percent and pickup vehicles
accounts for 43 percent. As transport continuous on poor roads, combination of carriage mode
was used, 35 percent of refrigerated trucks as well as 65 percent of non-refrigerated trucks
were used for transporting fruits and vegetables. Moreover, the bumping increases additional
bruising and contributed for further food loss. At the Etfruit wholesale store fresh produces
are unloaded and often piled for additional heaps, exposing for additional damage. All the
combinations within store of Etfruit wholesales generate high food loss of 16 percent when
compared with other players. Food loss between point of production and destination through supply chain could also be
exacerbated due to inadequate road situations. Each player in the supply chain has their own
transportation system, packaging system and waste disposal mechanism. The most common
transport system includes non-refrigerated trucks, refrigerated trucks, hand cart, hand drawn
gharry and basket in the supply chain. All of export fruits and vegetables transportation carry-
out by refrigerated trucks and enhanced post-harvest techniques are applied on farm as well.
To some extent, modern cooling facilities have been installed to ensure the freshness and
quality of the products specially at receiving stores. About 80 percent (see Figure 16) of distribution was carried out by other wholesalers via non-
refrigerated trucks to corporate customers like hospitals, universities, big hotels and big
restaurants. Trolley trucks are frequently used transport apparatus by street vendors for
marketing activities from place to place in the major roads of Addis Ababa which accounts
for about 68 percent of transport system within street vendor channels. Main roads in Ethiopia
seem mostly intended to shoulder heavy passengers in the larger cities irrespective of efficient
traffic flow from rural locations to central. In the course of shipping via Etfruit-wholesalers,
the fresh produces tend to be exposed for further severe damage especially when plastic
crates, alone used, stacked on the top of each other. Furthermore, countryside roads serving
as main channel to production locations usually suffered from severe cracks. Most of
produces at farm location carries baskets on their shoulder, handcart and pickup vehicles
while transporting fresh produces. Moreover, main rural roads were relatively impassible by
vehicle and other labor workers during moving fruits and vegetables to pick up station.
35
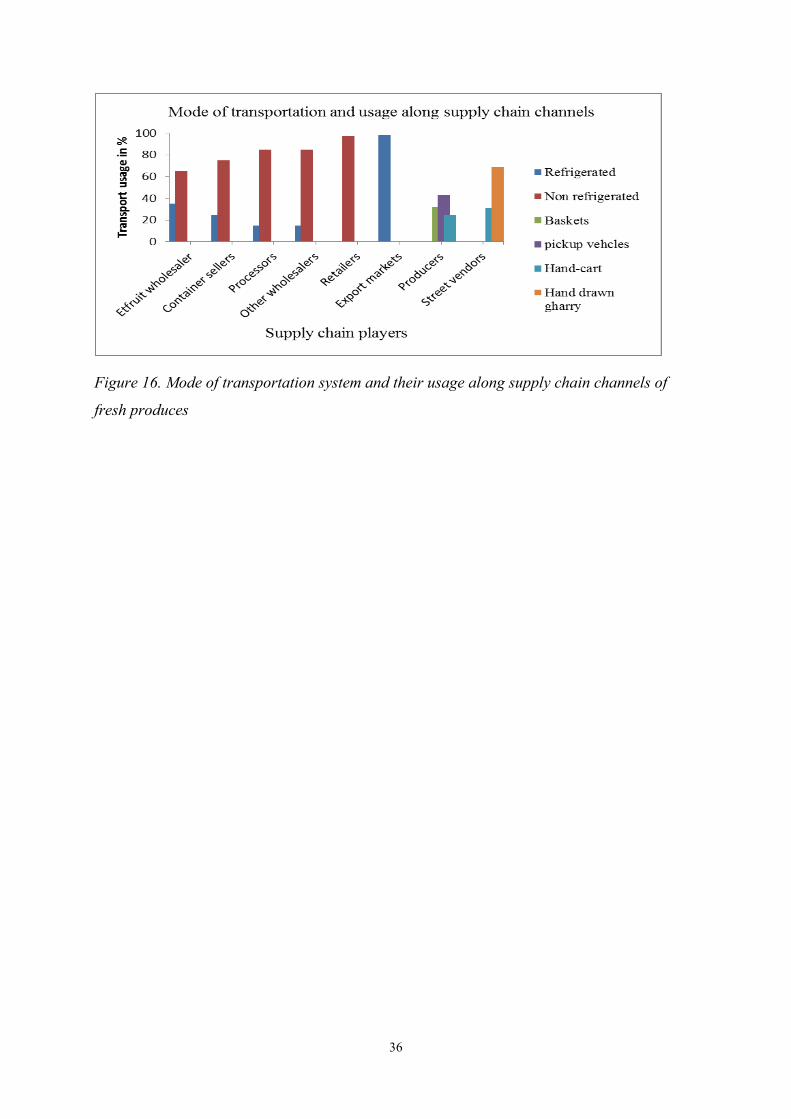
Figure 16. Mode of transportation system and their usage along supply chain channels of
fresh produces
36
6. Analysis and discussion
6.1 Value chain constraints
6.1.1 Market access For this study the supply channels for fresh produces can mostly be categorized as B-system
(Ruben et al., 2007). The B-system functions well for medium level players in the chain. The
fruits and vegetables in this study were often disseminated from wholesalers to market players
such as retailers, supermarkets and hotels in Addis Ababa, Ethiopia. This market system
matches well with the B-system as it aims at a local market but can mostly be part of different
market system, often via middlemen. A good numbers of the producers were members of
cooperatives as B-system was mostly connected in associations, cooperatives or other kinds
of contracts. The B-system largely aims supermarkets (Ruben et al., 2007), this was often the
case for this study as they mostly aim supermarkets, retail shops, and juice houses in local
markets. Production of fruits and vegetables for the internal market were often in scattered
manner and small scale in Ethiopia. The number of supply chain affiliated marketing outlets
are increasing quickly in Addis Ababa, however, many retail shops and supply chain stores do
not plant adequate number of storage facilities to validate operating with their own exclusive
distribution hubs. Producers were independently unable to achieve the volume, place and
quality standard of chains players and supermarkets in the city, Addis Ababa. The B-system
often focuses at values shared between numbers of players ranging from middle to high
income. Moreover, the C-system focused often on export market as there was only one global
channel in this study (Ruben et al., 2007). Thus, the supply channels for fruits and vegetables
in this study were best considered in B-systems.
Emana and Hadera (2007) stated that fresh products moving closer to the consumers’
destination from producers have little added value. Also stated that the producers have a little
information as the producers and sellers mostly have no any straight communication with
each other. Similarly Demissie (2011) claimed that producers have little bargaining power in
the supply chains of Ethiopia. Et-fruit wholesales’ bargaining powers generates from the
sourcing strategy. Etfruit wholesalers were often known for their purchase of bulky perishable
produces with better financial and information capabilities. They were most dominant players
in the supply channels and supplies fruits and vegetables directly from producers. Price was
determined on farm by the producers when its produces demanded by numerous consumers.
37
Therefore, producers were the purchase price-setter in advance via open tender invitation and
at least better price provision accepted and the winning award letter recognized. When the
producers were many and the wholesalers were few in numbers, the wholesalers have more
bargaining power and the price was determined through negotiation. This can place producers
on the loser side of supply chains. 6.1.2 Infrastructure and resources The persistent reliance of Addis Ababa’s middlemen on the central Etfruit wholesale can be
mainly attributed to the lack of a well-organized infrastructure and market integration in
several Ethiopian fruit and vegetable production locations. Absence of infrastructure and poor
harvesting techniques in several developing countries are major elements in the formation of
food loss (Kader, 2005). This research has shown that lack of dependable transportation,
finance, transparent information, packaging sheds and quality standards. The central issue for
developing nations is its inefficient and unorganized postharvest supply chain systems that
lead to the losses of food (Hodges et al., 2011). These have obliged close trade partners or
middlemen to depend heavily on wholesalers which reasonably meet their demands for sizes,
maturity, value, location and appearances. Expansion of adequate and efficient infrastructural networking is necessary for better
transportation, easy packaging, vehicles load and unload. Easy, cost-effective and improve
packaging system is required to keep food fresher for extended time. For instance, if fresh
produces picked directly into plastic crates in the production area, thus the food losses in such
perishable fresh produces in fact can be minimized significantly, even when more advanced
mechanical apparatuses were not on-hand for handling. This simple approach can easily
reduce the level of food losses, but they were not implemented so far. Moreover, now days, it
is common to witness prominence of pallet-trucks in developed world. But it requires
comfortable floor and usually require loading bay to have access for other distribution
vehicle. However, those engineered infrastructure is not available in Addis Ababa, Ethiopia. 6.1.3 Inadequate use of cold chain system Lack of refrigeration capacity is mostly accountable for the big postharvest losses experienced
in developing countries (Parpia, 1976). Trade partners admitted that the Etfruit-wholesalers
lacked to realize the significance of cold chain preservation for fresh produces. It was well
observed in the capital, Addis Ababa, no market players interested to invest in cold chain
38
because it demands huge capital. When fresh produces move out from main distributor
(Etfruit), commodities were already in risk of shrinkage and spoilage because it was not
passed through cold chain system. This has direct-effect on quantity and quality of purchases
made by households. Many of households in Addis Ababa had inadequate access to
refrigeration facility at home, therefore, likely to buy only slight quantities of fresh produce at
occasion of store visit (Reardon et al., 2003). 6.1.4 Lack of adequate packaging sheds To some degree only fruits and vegetables for export market often sort and classify at Etfruit
wholesale packing shed since these commodities are intended for export market. However,
packing materials for internal marketing of fresh produces was often just plastic crates.
Packing has so many functions for the product itself, seller and user. Packaging is so
significant in protecting a product from damage, keeping the product together; identify the
product, ease of transport, stacking and printed information (Ragaert et al., 2004). Trade
partners indicated all-embracing views as to why most fresh produces handled by Addis
Ababa Etfruit wholesale facilities were provided in plastic crates instead of more protective
card-board containers. Etfruit wholesalers at large replied that they use plastic-crates since
price sensitive trade-partners in Addis Ababa are reluctant to cover extra cost for insulated
and robust packaging. This was aggravated by Addis Ababa’s current experiences of inflation,
which elevated uncertainty to those consumers with low purchasing power of income unable
to afford fresh produces which were packed in more expensive packages. Instead, Etfruit
wholesalers described their packaging style as an alternative means to reduce financial outlays
by using reusable plastic packages.
6.1.5 Heavy dependence on manual Labor
The practice of employing automated forklifts to transfer pallet loads from cold stores was
nonexistence at Addis Ababa. Automated forklifts have become a crucial piece of equipment
in supply chain operations which offers greater safety during product load and unload
(Manikas and Terry, 2010). There were no refrigerated warehouses and insulated packaging
facilities possessed by Etfruit-wholesale companies. Therefore, forms of packing materials in
the supply chain would make it impossible to use machine-driven forklifts for load and
collection docks. Furthermore, the manual labor cost is easily affordable in Ethiopia, which
created alternative approach. The apparent limitation of labor-intensive loading system could
39

greatly delays time that the produces would have been at right location and leads to more
exposure of high temperature and contributes for further severe product damage and
substantial shelf life reduction.
6.2 Value chain analysis 6.2.1 Network structure There were seven main supply chain channels for perishable produces which incorporates one
international outlet and the rest operates with in national level. These supply channels consists
of eight various market players such as producers, Etfruit wholesalers, other wholesalers,
processors, export, retailers, street vendors and consumers. However, the findings related with
types of players were not similar with the study which was undertaken in eastern part of
Ethiopia by Emana and Hadera (2007). The network structure in a value chain is greatly
reliant on what market channels players have chosen (Trienekens, 2011). Existing market
networks for chain players to market their fruits and vegetables influenced by the market
access hindrances. Network structure underlines the horizontal relations between players in a network and
assesses social connections and knowledge transfer (Lazzarini et al., 2001). There were weak
horizontal connections among chain players in the value chain for fruits and vegetables
marketing. Almost all players were well understood for their dependency on Etfruit
wholesalers with limited competence of supplying and handling perishable produces from far
rural production location combined with low financial and information capacity. Robust
collaboration in a horizontal connection can inspire and facilitate market access and
information (Trienekens, 2011). In contrast, wholesalers are the dominant players in the
supply network structure which possess necessary marketing services as they renders market
information, rent of refrigerated semi-trailer truck for transportation and supply value added
seeds. There were some form of farmers associations and cooperatives with fragmented
cooperation with other chain players. Efficient flow of information and resources between
supply chain players are the most important component for horizontal cooperation to become
the strongest (Trienekens and Willems, 2007).
6.2.2 Supply and Demand relationships
40
As highlight in various qualitative literatures (Gustavsson et al., 2011, Lipinski et al., 2013a,
Lundqvist et al., 2008b) which support impacts of food loss on supply chain players. A long
the supply-side of market chain; lack of measures against food loss given the original supply
curve resulted in a lower equilibrium quantity, higher price, producer’s surplus, welfare
disadvantage for consumers in the market for fresh produces. This is compatible with the
impacts from the viewpoint of developing countries, where food loss on the supply channel
side dominates. Food loss largely occurs in supply channel in developing countries according
to World Bank (2010) research on PHLs of fruits and vegetables. The aggregate loss in the
supply chain appears to be much bigger in consumers’ channels in developing countries.
Kantor et al. (1997) recapped loss estimates for the USA that from 222mill tons of food
supply for the year of 2008, 9% (19.5 mill tones) were lost at the retail level and 17% (37.7
mill tones) at the consumer level. the result of this study reveals different results with the
Kantor et al. Estimated food loss for Ethiopian Et-Fruit company that from 36 thousand tons
of fresh food supply for the year of 2012, 28% (10 thousand tones) were lost at the supply
chain channels and less than 1% (0.732 tones) at the consumer level. Market price for fresh
produces increases while the quantity delivered in the market decreases. Therefore, an
increase in market price decreases consumers’ surplus, but increases producers’ surplus.
When look at it differently, producers cannot sell more fruits and vegetables at a higher price. There were food losses in the consumption side of fresh produces, in that consumers waste
portion of what they demand. In that case, the socially optimal demand curve lies to the right
of the original demand curve is shown by Demand’ in Figure 13 (Nicholson and Snyder,
2011). Along the demand-side of market chain, failing to reduce food waste from
consumption, given the original supply curve and lack of incentives to reduce in food waste
resulted in a higher equilibrium quantity, and higher price in the market. Producers are
capable to sell more fruits and vegetables at a higher price; as a result their welfare is
positively affected. When demand increases (demand curve shifts right), it means that
consumers will be forced to purchase more quantity of fresh produce for higher price.
Looking at it differently, consumers paid a higher price for the same quantity of fruits and
vegetables. In this study, food waste from demand side mainly related to households’ usage and wastage
practices of fresh produces. Higher SES household related with relatively higher usage and
waste of fresh produces when compared with low SES groups. The results supported the
evidence that people belonging to a higher SES have both a higher usage and wastage of fruits
41

and vegetables (Marmot et al., 1991, Holcomb, 1995, Hupkens et al., 1997, Osler and Schroll,
1995, Prättälä et al., 1992, Roos et al., 2001, Johansson et al., 1999). The estimate of
difference in the waste of fruit and vegetable between higher SES and low SES households
was 25g/person / week. The study of Estevez et al (2000) recaps us that the estimate of the
difference in the waste of fruit and vegetable was 24g/person/day between higher and low
socioeconomic households in developed countries. This showed the differences in wastage
level of fruits and vegetables at household and thus, the food wastage level is insignificant at
consumer channel in developing countries. This study found out households with high
persons would waste lower fruits and vegetables. Several studies support the same notion
(Wenlock and Buss, 1977, Osner, 1982, WRAP, 2006) they also demonstrated that food loss
was significantly affected by the composition of the family member and size. Family with
larger household size would waste less food per person than smaller household composition.
This study has indicated an average person in each SES household accounts four, five and six
from High to Low respectively. 6.2.3 Governance structure The selection of governance mechanism is influenced by how dependent the players in the supply
chain with each other and the differences in market power (Trienekens, 2011). A chain player
with ample market power can regulate the governance structure (Ruben et al., 2007). In this study
it was the Efruit wholesalers that appear to have utmost power in the value chains by possessing
better facility, pricing strategy and information. Et-fruit wholesales’ bargaining powers
generates from the product sourcing strategy. Etfruit wholesalers were known for their
purchase of bulky perishable produces with better financial and information capabilities. They
were most dominant players in the supply channels and supplies fruits and vegetables directly
from producers. Similarly Demissie (2011) stated that producers have little bargaining power in
the supply chains of Ethiopia. According to Etfruit-firm general manager, price determination
has its own strategy on farm-gate. Price was determined on production site by the producers
when its produces demanded by many purchasers. Therefore, producers were the purchase
price-setter in advance via open tender invitation and at least better price provision accepted
and the winning award letter recognized. When the producers were many and the wholesalers
were few in numbers, the wholesalers have more bargaining power and the price was
determined by negotiation. However, Et-Fruit often undertakes price-negotiation procedures
on farm-gates as they were dominant player in the supply chain with high possibility of
forming bargaining power. This can place producers on the loser and affected side of chain.
42
The incompetence of several Ethiopian perishable producers to provide market oriented fresh
produces directly to final markets combined with failure of other supply chain players to play
better role in market stabilization has created domination and significant advantage for
Etfruit-wholesalers. Etfruit-wholesale was capable to receive fresh products by refrigerated
and non-refrigerated mode of transport, and unloads commodities that possibly devalued in
transit to retail customers. They also overprice their close trade partners as all burden mounts
to producers and final consumers to compensate their outlay. Moreover, lack of adequate
quality control which has provided possibilities for the Et-fruit wholesale to take an advantage
of selling their blow par fruits and vegetables to other chain players and consumers.
6.3 Improving 6.3.1 Market access If big middleman such as wholesalers market dependably can deliver and provide standard
fresh products at favourable prices and also can be part of improved supply chains’ new
desires (Humphrey, 2007). Improved market access has to be implemented. Creating
conducive marketing environments is necessary for reduction of PHLs. This was evidently
exhibited by Mutangadura (2004), the purchase for progress (P4P) program in the World
Food Program. It delivers the most vulnerable supply chain participants with access to
markets and enables them to make durable investments, by contributing them various ways of
investment incentives and approaches of selling their fresh produces. Market improvement is vastly associated with creation of awareness among chain players
such as consumer education, campaign, fair trade or green production (Trienekens and
Zuurbier, 2008). It is a worthwhile to ensure that farming skills, postharvest handling and
home economics have been taught in universities, colleges, schools and communities. For
example conducting gender based consumers’ education and campaign would be paramount.
Almost all the food handlings and cooking process are undertaken by females in developing
countries. Therefore, offering guidance for consumers on how to access product information,
market, store, prepare, and handle would be required. Therefore, invaluable campaigns,
common principles, educations and standards may inspire implementation of good practices.
Also considering local framework into account and involvement of supply chain participants
within a participative approach would be critical success factor for reducing PHLs.
43
6.3.2 Value added Upgrading of processes is often used upgrading option for value added in developing
countries. Certain value adding activities have increased in the supply chain of developing
countries for instance juice processing, yet activities in form of branding and marketing
strategy needs big measure (Humphrey and Memedovic, 2006). There were some
improvements especially in processing wise but still there were huge gaps on branding and
selling strategy; however, it was mostly related with development level of country. There
were also high need to ensure internal improvement on supply chain such as product value,
packaging, and composition. Developments concerning handling, transport, packaging and
storage facilities are significant aspects to nurture quality and reduce loss of fresh produce
along supply chain (Kader, 2004). Developments of new technologies are often required in
order to optimize the productions. Distribution system can be upgraded by better interaction
between the players,’ use of new transport technology, cold chain and practice of GPS
systems, internet access and mobile phones. In developing countries functional upgrading
continued to remain at low level as they deliver services for developed countries, therefore
value adding occurs in the final parts of the chain Process improvement links to the
optimization of products and distribution in the production system (Trienekens, 2011) 6.3.3 Infrastructure and resources There is greater need for improved access to low cost handling and storage technologies such
as storage bags, evaporative coolers, crates and metal silos. For instance, supply chain players
especially producers have to construct evaporative cooler storage system. It delivers better
cooling environment by providing lower temperature and better humidity. As demonstrated
by Nenguwo (2002) study, this approach has successfully implemented for fresh produce
handling in Rwanda. Installation of cold chain system incorporated both refrigerated warehouse and transportation
system is required. To transport temperature sensitive fresh produces with full freshness, cold-
chain system should have well automated processes from production to final users.
Additionally, modern technologies have to be introduced which are intended to improve the
efficiency along supply chain with which fresh produces transported, stored, displayed and
delivered to consumers. This was validated by Houghton and Portougal (1997) as Just-In-
Time (JIT) production and application of online stock control system. This application has
44

radically reduced the amount of stock inventory in the food supply chain, taking down cost
drivers and waste accumulation despite transportation congestion and environmental issues. Despite supply chain’s complexity, well-known by resilient interaction of important number
of chain actors, comprehensive approach is significant mechanism in policy-making for loss
reduction. Reducing food loss deserves urgent reaction from the private sectors, policy-
makers and non-governmental players. It also demands thinking out of box, ‘farm-gate
approach’, the usual motto of ‘increasing production’, but increasing funds for studies of
post-harvest losses is vital (Marsden et al., 2000). Thus, all phases throughout supply chain
have to be managed entirely so as to prevent impact transmission from one phase to another.
45
7. Conclusions This chapter of thesis addressed the aim and research questions. The aim of this study was to
assess postharvest loss in the supply chains of fresh produces in Addis Ababa, Ethiopia.
Identified main players in the supply chain were Et-fruit wholesalers, Et-fruit retailers, other
wholesalers, processors, retailers, producers, vendor sellers and consumers. Channel one
distributed the highest volume of 37% fresh produces to final consumers. Et-Fruit wholesalers
were the main domestic distributors of fresh produces in Addis Ababa. The total food loss
along supply chain channels for selected fresh produces was about 28% whereas 1% in
consumers’ channel. Postharvest loss largely occurs in supply channels than consumers for
fresh produces in developing countries (Fao, 2014). Outcome of this study showed the similar
result; lack of responsive actions against food loss like players might be induced to tackle the
food losses as a result of a new technology, or new policies such as taxes, regulations, and
subsidies that penalize and encourage reductions. In the supply-side of market chain; lack of
such a measures resulted in a lower quantity, higher price, producer’s surplus, welfare
disadvantage for consumers in the market for fresh produces. In addition to this, failing to
reduce food waste from consumption resulted in a higher price in the market. Therefore,
failing to reduce food loss caused producers and consumers to be more affected players. There were hindrances which promote loss in the supply chain; lack of cold chain system,
lack of adequate packaging sheds and heavy dependence on manual Labor. In Ethiopia where
traditional postharvest handling is the only choice, poorly harvested and packaged fresh
produces loaded onto inadequate transport by means of manual labor. Valuation of
postharvest losses enables to develop proper measures which are required to reduce losses and
to increase the accessibility of fresh produces for domestic consumption as well as export
purposes. The major losses in the supply chain occur in the process of storage, transport and
packaging. These losses can largely be reduced by implementing cold chain system,
refrigerated trucks, plastic crates with safety cover, use of locally viable technologies and
persistent policies are desired. With postharvest concerns having been mostly overlooked, a
firm indication starts from lack of common valuation method. Furthermore, there have not
been many researches undertaken on the impacts of food loss in developing countries. Thus,
there is an urgent need for further quantitative researches that provide accurate loss estimates.
Unless deliberations on the potentials for reducing world-wide food loss will remains mostly
rhetorical.
46
Bibliography Literature and publications BARRETT, C. B. & MUTAMBATSERE, E. 2008. Agricultural markets in developing
countries. BISWAS, M. 1969. Wastage of Orange in Transit to Varanasi. Agricultural Marketing, 12,
11-16. BOER, K. D. & PANDEY, A. 1997. India's Sleeping Giant: Food. The McKinsey Quarterly,
82. BOURNE, M. 1977. Post harvest food losses–the neglected dimension in increasing the world
food supply. BUZBY, J. C., WELLS, H. F., AXTMAN, B. & MICKEY, J. 2009. Supermarket loss
estimates for fresh fruit, vegetables, meat, poultry, and seafood and their use in the ERS loss-adjusted food availability data. United States Department of Agriculture, Economic Research Service.
CADE, J., BURLEY, V., WARM, D., THOMPSON, R. & MARGETTS, B. 2004. Food-frequency questionnaires: a review of their design, validation and utilisation. Nutrition Research Reviews, 17, 5-22.
COULTER, J. & SHEPHERD, A. 1995. Inventory credit: an approach to developing agricultural markets, Fao.
DAVIS, J. C. 1980. Agriculture and transportation: a positive impact, in: increasing understanding of public problems and policies. 51-58.
DEMISSIE, M. 2011. Marketing of Kabuli and Desi chickpeas by smallholder farmers in Eastern Shewa Zone.
EMANA, B. & GEBREMEDHIN, H. 2007. Constraints and opportunities of horticulture production and marketing in Eastern Ethiopia. Dry land coordination group (DCG) report, 46.
EMANA, B. & HADERA, G. 2007. Constraints and opportunities of horticulture production and marketing in eastern Ethiopia. Dry land coordination group (DCG) report, 46.
FAO 1981. Food loss prevention in perishable crops. agricultural service Bulletin, 43. FAO 2012. Global initiative on food loss and waste reduction. FAO, U. How to Feed the World in 2050. Rome: High-Level Expert Forum, 2009. FAO, W. 2014. IFAD (2012) The State of Food Insecurity in the World 2012: Economic
growth is necessary but not sufficient to accelerate reduction of hunger and malnutrition. FAO, Rome.
GEBRESENBET, G. & BOSONA, T. 2012. Logistics and supply chains in agriculture and food, INTECH Open Access Publisher.
GOLETTI, F. Current status and future challenges for the postharvest sector in developing countries. XXVI International Horticultural Congress: Issues and Advances in Postharvest Horticulture 628, 2002. 41-48.
GREELEY, M. 1991. Postharvest technologies: Implications for food policy analysis, World Bank.
GUSTAVSSON, J., CEDERBERG, C., SONESSON, U., VAN OTTERDIJK, R. & MEYBECK, A. 2011. Global food losses and food waste. Food and Agriculture Organization of the United Nations, Rom.
HALLDORSSON, A., KOTZAB, H., MIKKOLA, J. H. & SKJØTT-LARSEN, T. 2007. Complementary theories to supply chain management. Supply Chain Management: An International Journal, 12, 284-296.
47
HENSON, S. & LOADER, R. 2001. Barriers to agricultural exports from developing countries: the role of sanitary and phytosanitary requirements. World Development, 29, 85-102.
HODGES, R. J., BUZBY, J. C. & BENNETT, B. 2011. Postharvest losses and waste in developed and less developed countries: opportunities to improve resource use. The Journal of Agricultural Science, 149, 37-45.
HOLCOMB, C. A. 1995. Positive influence of age and education on food consumption and nutrient intakes of older women living alone. Journal of the American Dietetic Association, 95, 1381-1386.
HOUGHTON, E. & PORTOUGAL, V. 1997. Reengineering the production planning process in the food industry. International Journal of Production Economics, 50, 105-116.
HUMPHREY, J. & MEMEDOVIC, O. 2006. Global value chains in the agrifood sector. HUPKENS, C. L., KNIBBE, R. A. & DROP, M. J. 1997. Social class differences in women's
fat and fibre consumption: a cross-national study. Appetite, 28, 131-149. JOHANSSON, L., THELLE, D. S., SOLVOLL, K., BJØRNEBOE, G.-E. A. & DREVON, C.
A. 1999. Healthy dietary habits in relation to social determinants and lifestyle factors. British Journal of Nutrition, 81, 211-220.
KADER, A. A. 2003 A perspective on postharvest horticulture (1978-2003). HortScience, 38, 1004-1008.
KADER, A. A. Increasing food availability by reducing postharvest losses of fresh produce. V International Postharvest Symposium 682, 2004. 2169-2176.
KADER, A. A. 2005. INCREASING FOOD AVAILABILITY BY REDUCING POSTHARVEST LOSSES OF FRESH PRODUCE. Acta Hort, 682, 2169-2176.
KADER, A. A. Handling of horticultural perishables in developing vs. developed countries. VI International Postharvest Symposium 877, 2009. 121-126.
KANTOR, L. S., LIPTON, K., MANCHESTER, A. & OLIVEIRA, V. 1997. Estimating and addressing America’s food losses. Food Review, 20, 2-12.
KAPLINSKY, R. 2000. Globalisation and unequalisation: What can be learned from value chain analysis? Journal of development studies, 37, 117-146.
KITINOJA, L. & GORNY, J. R. 1999. Postharvest technology for small-scale produce marketers: economic opportunities, quality and food safety. Postharvest Horticulture Series-Department of Pomology, University of California.
LAZZARINI, S. G., CHADDAD, F. R. & COOK, M. L. 2001. Integrating supply chain and network analyses: the study of netchains. Journal on chain and network science, 1, 7-22.
LEBO, J. & SCHELLING, D. 2001. Design and appraisal of rural transport infrastructure: ensuring basic access for rural communities, World Bank Publications.
LIPINSKI, B., HANSON, C., LOMAX, J., KITINOJA, L., WAITE, R. & SEARCHINGER, T. 2013a. Reducing food loss and waste. World Resources Institute Working Paper, June.
LIPINSKI, B., HANSON, C., LOMAX, J., KITINOJA, L., WAITE, R. & SEARCHINGER, T. 2013b. Reducing Food Loss and Waste.” Working Paper, Installment 2 of Creating a Sustainable Food Future. World Resources Institute, Washington, DC.
LUNDQVIST, J., DE FRAITURE, C. & MOLDEN, D. 2008a. Saving water: from field to fork. Curbing losses and wastage in the food chain.
LUNDQVIST, J., DE FRAITURE, C. & MOLDEN, D. 2008b. Saving water: from field to fork: curbing losses and wastage in the food chain.
MANIKAS, I. & TERRY, L. A. 2010. A case study assessment of the operational performance of a multiple fresh produce distribution centre in the UK. British Food Journal, 112, 653-667.
48
MARMOT, M. G., STANSFELD, S., PATEL, C., NORTH, F., HEAD, J., WHITE, I., BRUNNER, E., FEENEY, A. & SMITH, G. D. 1991. Health inequalities among British civil servants: the Whitehall II study. The Lancet, 337, 1387-1393.
MARSDEN, T., BANKS, J. & BRISTOW, G. 2000. Food supply chain approaches: exploring their role in rural development. Sociologia ruralis, 40, 424-438.
MATTSSON, L.-G. & JOHANSON, J. 1992. Network positions and strategic action: an analytical framework, Univ.
MÖLLER, K. K. & HALINEN, A. 1999. Business Relationships and Networks:: Managerial Challenge of Network Era. Industrial marketing management, 28, 413-427.
MREMA, G. C. & ROLLE, R. S. Status of the postharvest sector and its contribution to agricultural development and economic growth. 9th JIRCAS International Symposium, 2002. 13-20.
MUTANGADURA, G. B. 2004. World Health Report 2002: Reducing Risks, Promoting Healthy Life: World Health Organization, Geneva, 2002, 250 pages, US $13.50, ISBN 9-2415-6207-2. No longer published by Elsevier.
NENGUWO, N. 2002. Appropriate technology cold store construction and review of post-harvest transport and handling practices for export of fresh produce from Rwanda. Fresh Produce, 1.
NICHOLSON, W. & SNYDER, C. 2011. Microeconomic theory: basic principles and extensions, Cengage Learning.
OSLER, M. & SCHROLL, M. 1995. Lifestyle and prevention of ischaemic heart disease in Denmark Changes in knowledge and behaviour 1982–1992. The European Journal of Public Health, 5, 109-112.
OSNER, R. 1982. Food wastage. Nutrition & Food Science, 82, 13-16. PARFITT, J., BARTHEL, M. & MACNAUGHTON, S. 2010. Food waste within food supply
chains: quantification and potential for change to 2050. Philosophical Transactions of the Royal Society B: Biological Sciences, 365, 3065-3081.
PARISER, E. 1982. Post-harvest food losses in developing countries. Nutrition Policy Implementation. Springer.
PARPIA, H. 1976. Postharvest Losses—Impact of Their Prevention on Food Supplies, Nutrition, and Development. Nutrition and Agricultural Development. Springer.
PORTER, M. E. & MILLAR, V. E. 1985. How information gives you competitive advantage. Harvard Business Review, Reprint Service.
PRÄTTÄLÄ, R., BERG, M.-A. & PUSKA, P. 1992. Diminishing or increasing contrasts? social class variation in Finnish food consumption patterns, 1979-1990. European journal of clinical nutrition, 46, 279.
PRUSKY, D. 2011. Reduction of the incidence of postharvest quality losses, and future prospects. Food Security, 3, 463-474.
RAGAERT, P., VERBEKE, W., DEVLIEGHERE, F. & DEBEVERE, J. 2004. Consumer perception and choice of minimally processed vegetables and packaged fruits. Food Quality and Preference, 15, 259-270.
RATNAM, C. & NEMA, K. 1967. Studies on market diseases of fruits and vegetables. Andhra Agricultural Journal, 14, 60-65.
REARDON, T., TIMMER, C. P., BARRETT, C. B. & BERDEGUÉ, J. 2003. The rise of supermarkets in Africa, Asia, and Latin America. American journal of agricultural economics, 85, 1140-1146.
RIGG, J., BEBBINGTON, A., GOUGH, K. V., BRYCESON, D. F., AGERGAARD, J., FOLD, N. & TACOLI, C. 2009. The World Development Report 2009 ‘reshapes economic geography’: geographical reflections. Transactions of the Institute of British Geographers, 34, 128-136.
49

ROOS, G., JOHANSSON, L., KASMEL, A., KLUMBIENÉ, J. & PRATTALA, R. 2001. Disparities in vegetable and fruit consumption: European cases from the north to the south. Public health nutrition, 4, 35-44.
RUBEN, R., VAN TILBURG, A., TRIENEKENS, J. & VAN BOEKEL, M. 2007. Linking market integration, supply chain governance, quality, and value added in tropical food chains. Tropical food chains: governance regimes for quality management, 13-46.
RUEL, M. T., MINOT, N. & SMITH, L. 2005. Patterns and determinants of fruit and vegetable consumption in sub-Saharan Africa: a multicountry comparison, WHO Geneva.
RUTTEN, M. & KAVALLARI, A. 2013. Can reductions in agricultural food losses avoid some of the trade-offs involved when safeguarding domestic food security?
RUTTEN, M. M. 2013a. What economic theory tells us about the impacts of reducing food losses and/or waste: implications for research, policy and practice. Agriculture & Food Security, 2, 13.
RUTTEN, W. Y. 2013b. The socio-economic impacts of reducing food waste Presentation given by LEI Wageningen UR at Save Food Partnership Event
Rome SALVATORE, D. 2008. Microeconomics: theory and applications. OUP Catalogue. SHUKLA, M. & JHARKHARIA, S. 2013. Agri-fresh produce supply chain management: a
state-of-the-art literature review. International Journal of Operations & Production Management, 33, 114-158.
SNEHOTA, I. 2004. Perspectives and theories of market. Rethinking Marketing. Developing a new understanding of markets. Hokeboken, NJ: John Wiley & Sons, 15-32.
SNEHOTA, I. & HAKANSSON, H. 1995. Developing relationships in business networks, Routledge.
STUART, D. 2009a. Constrained choice and ethical dilemmas in land management: Environmental quality and food safety in California agriculture. Journal of agricultural and environmental ethics, 22, 53-71.
STUART, T. 2009b. Waste: Uncovering the global food scandal, WW Norton & Company. TILMAN, D., FARGIONE, J., WOLFF, B., D'ANTONIO, C., DOBSON, A., HOWARTH,
R., SCHINDLER, D., SCHLESINGER, W. H., SIMBERLOFF, D. & SWACKHAMER, D. 2001. Forecasting agriculturally driven global environmental change. Science, 292, 281-284.
TRIENEKENS, J. & WILLEMS, S. 2007. Innovation and governance in international food supply chains: The cases of Ghanaian pineapples and South African grapes. International Food and Agribusiness Management Review, 10, 42-63.
TRIENEKENS, J. & ZUURBIER, P. 2008. Quality and safety standards in the food industry, developments and challenges. International Journal of Production Economics, 113, 107-122.
TRIENEKENS, J. H. 2011. Agricultural value chains in developing countries a framework for analysis. International Food and Agribusiness Management Review, 14.
UR, O. W. U. W. & WAGENINGEN, C. W. 2014. Reducing postharvest food losses in developing economies by using a Network of Excellence as an intervention tool.
VAN GOGH, J. & ARAMYAN, L. Reducing postharves food losses in developing economies by using a Network of Excellence as an intervention tool. Proceedings of the IFAMA 2014 Symposium Proceedings' People Feed the World', 2014.
VISWANADHAM, N. 2006. 1 Can India be the Food Basket for the World? Achieving Rural & Global Supply Chain Excellence, 1.
WAKJIRA, M. 2010. Solar drying of fruits and windows of opportunities in Ethiopia. African Journal of Food Science, 4, 790-802.
50
WEINBERGER, K. & LUMPKIN, T. A. 2007. Diversification into horticulture and poverty reduction: a research agenda. World Development, 35, 1464-1480.
WENLOCK, R. & BUSS, D. 1977. Wastage of edible food in the home: a preliminary study. Journal of human nutrition, 31, 405.
WIERSINGA, R. C. & DE JAGER, A. 2009. Business opportunities in the Ethiopian fruit and vegetable sector, LEI Wageningen UR.
WILSON, N. 1996. The supply chains of perishable products in northern Europe. British Food Journal, 98, 9-15.
WOLDEWAHID, G., GEBREMEDHIN, B., HOEKSTRA, D., TEGEGNE, A., BERHE, K. & WELDEMARIAM, D. 2012. Market-oriented beekeeping development to improve smallholder income: Results of development experiences in Atsbi-Womberta District, northern Ethiopia.
WORLD BANK, W. 2010. Missing Food: The Case of Postharvest Grain Losses in Sub-Saharan Africa.
WRAP 2006. Understanding Consumer Food Management Behavior. ZORYA, S., MORGAN, N., DIAZ RIOS, L., HODGES, R., BENNETT, B., STATHERS, T.,
MWEBAZE, P. & LAMB, J. 2011. Missing food: the case of postharvest grain losses in sub-Saharan Africa.
Internet sources CSA, Central Statistical Ageny, www.csa.gov Fruit and vegetable cultivation in Ethiopia, 2014-08-10, http://www.countrystat.org/home.aspx?c=ETH&ta=238CLI010&tr=11 Etfruit, Ethiopian Fruit and vegitable marketing share company, www.etfruit.et General information about Etfruit, 2015-03-26, http://etfruit.et ETHEMB, Ethiopian Embasy, www.ethemb.se Investment opportunities profile for the production of fruits and vegetables in Ethiopia, 2015-05-20, http://ethemb.se/business/investment/investment-opportunities/ FAOSTAT, Food and Agriculture Organization Stastistics, www.faostat.fao.org Production-fruits and vegetables in Ethiopia, 2015-o3-22 http://faostat3.fao.org/search/fruits%20and%20vegetables/E Personal Messages Endalkachew, T., Member of House of Peoples' Representatives or parliament of Ethiopia, personal meeting
Fitamo, G., Expert of Ethiopian Revenues and Customs Authority (ERCA), personal meeting
Mengistu, K., General Manager of Ethiopian Fruit and vegitable marketing share company, personal meeting
Gebresenbet, G., Professor at Swedish University of Agricultural Sciences, department of Energy and Technology, personal meeting
Tsegaye, S., Marketing researcher of Ethiopian Fruit and vegitable marketing share company, personal meeting
51
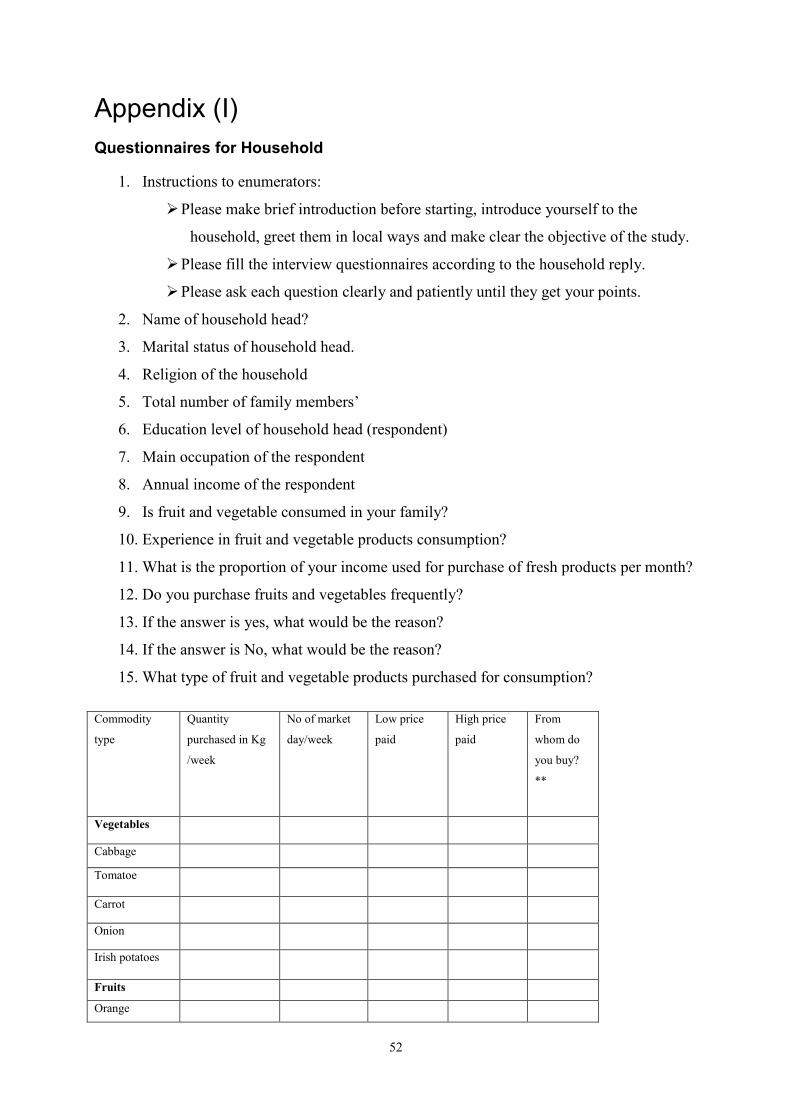
Appendix (I) Questionnaires for Household
1. Instructions to enumerators:
Please make brief introduction before starting, introduce yourself to the
household, greet them in local ways and make clear the objective of the study.
Please fill the interview questionnaires according to the household reply.
Please ask each question clearly and patiently until they get your points.
2. Name of household head?
3. Marital status of household head.
4. Religion of the household
5. Total number of family members’
6. Education level of household head (respondent)
7. Main occupation of the respondent
8. Annual income of the respondent
9. Is fruit and vegetable consumed in your family?
10. Experience in fruit and vegetable products consumption?
11. What is the proportion of your income used for purchase of fresh products per month?
12. Do you purchase fruits and vegetables frequently?
13. If the answer is yes, what would be the reason?
14. If the answer is No, what would be the reason?
15. What type of fruit and vegetable products purchased for consumption?
Commodity
type
Quantity
purchased in Kg
/week
No of market
day/week
Low price
paid
High price
paid
From
whom do
you buy?
**
Vegetables
Cabbage
Tomatoe
Carrot
Onion
Irish potatoes
Fruits
Orange
52
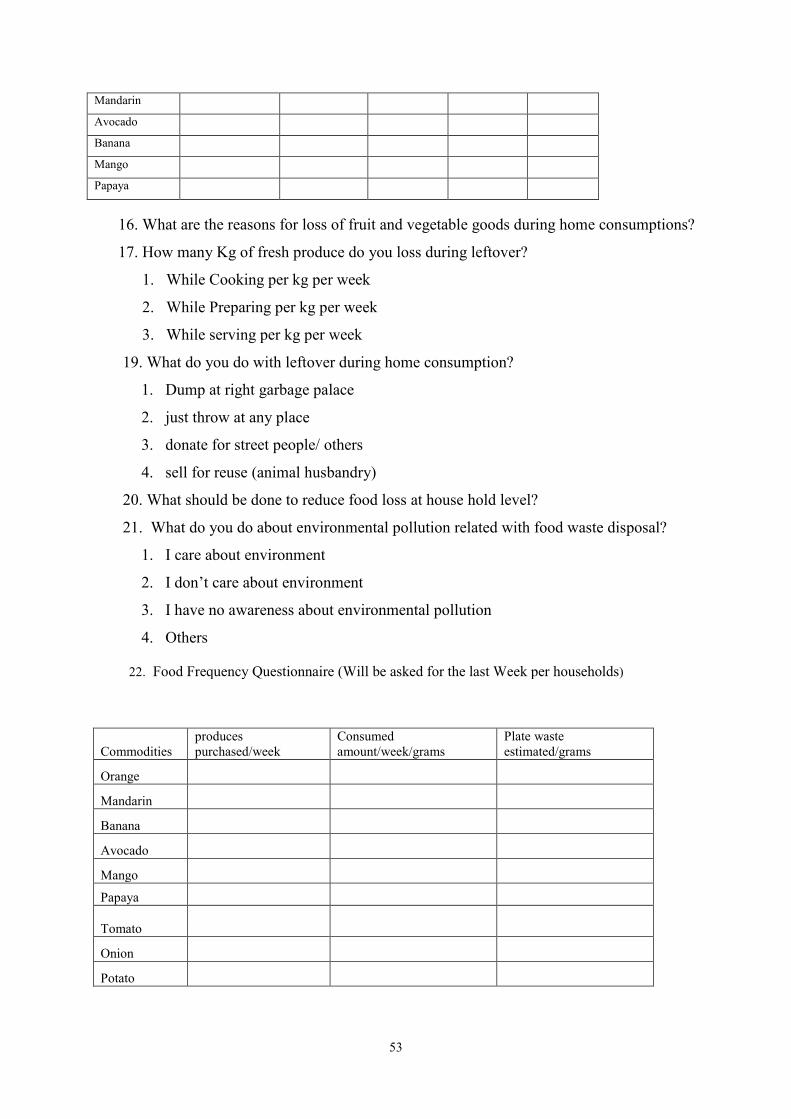
Mandarin
Avocado
Banana
Mango
Papaya
16. What are the reasons for loss of fruit and vegetable goods during home consumptions?
17. How many Kg of fresh produce do you loss during leftover?
1. While Cooking per kg per week
2. While Preparing per kg per week
3. While serving per kg per week
19. What do you do with leftover during home consumption?
1. Dump at right garbage palace
2. just throw at any place
3. donate for street people/ others
4. sell for reuse (animal husbandry)
20. What should be done to reduce food loss at house hold level?
21. What do you do about environmental pollution related with food waste disposal?
1. I care about environment
2. I don’t care about environment
3. I have no awareness about environmental pollution
4. Others
22. Food Frequency Questionnaire (Will be asked for the last Week per households)
Commodities
produces purchased/week
Consumed amount/week/grams
Plate waste estimated/grams
Orange
Mandarin
Banana
Avocado
Mango
Papaya
Tomato
Onion
Potato
53
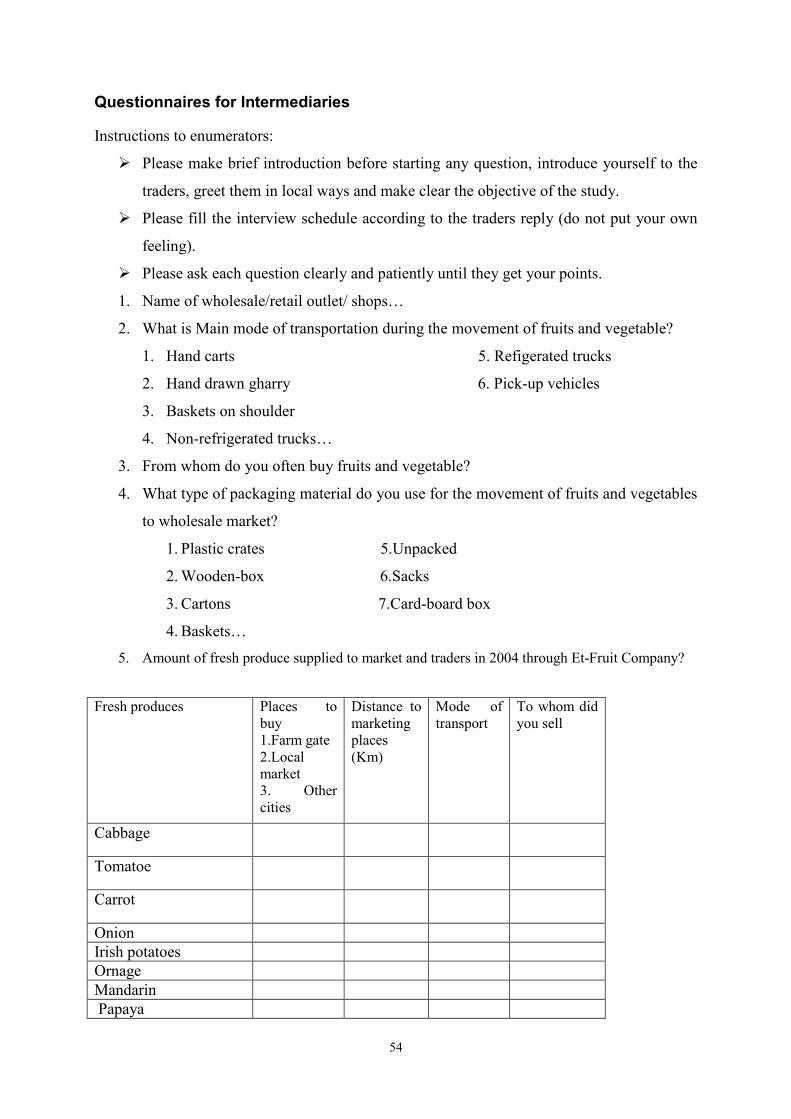
Questionnaires for Intermediaries Instructions to enumerators:
Please make brief introduction before starting any question, introduce yourself to the
traders, greet them in local ways and make clear the objective of the study.
Please fill the interview schedule according to the traders reply (do not put your own
feeling).
Please ask each question clearly and patiently until they get your points.
1. Name of wholesale/retail outlet/ shops…
2. What is Main mode of transportation during the movement of fruits and vegetable?
1. Hand carts 5. Refigerated trucks
2. Hand drawn gharry 6. Pick-up vehicles
3. Baskets on shoulder
4. Non-refrigerated trucks…
3. From whom do you often buy fruits and vegetable?
4. What type of packaging material do you use for the movement of fruits and vegetables
to wholesale market?
1. Plastic crates 5.Unpacked
2. Wooden-box 6.Sacks
3. Cartons 7.Card-board box
4. Baskets…
5. Amount of fresh produce supplied to market and traders in 2004 through Et-Fruit Company?
Fresh produces Places to
buy 1.Farm gate 2.Local market 3. Other cities
Distance to marketing places (Km)
Mode of transport
To whom did you sell
Cabbage
Tomatoe
Carrot
Onion Irish potatoes Ornage Mandarin Papaya
54

Avocado Banana Mango
6. How much did you pay for purchasing fruits and vegetables in kg/annam
7. How many quintals of fruits and vegetables do you loss during transportation time in
kg/Annam
8. What are the causes for the losses during transport?
1. Poor packing
2. Poor transport service
3. Poor road
4. Poor temperature management
5. Others…
9. What do you suggest to improve food loss during transportation time? 10. How many quintals of fruits and vegetables do you loss during packing in kg/annam?
11. What type of packaging system do you use during package of product per year?
1. Loose-fill jumble pack
2. Multilayer pattern pack
3. Multilayer size graded pack
4. Single layer packs
5. Others…
12. What do you think the reasons for the loss during packaging fruits and vegetables?
1. Inadequate packing
2. Lack of special treatment during pre-packing (Fumigation, Initiation of fruit
ripening )
3. Lack of post-packaging treatments (fumigation, cooling, storage)
4. Lack of adequet ventilation
5. Others specify…
13. What do you think the barriers for direct shipment of produce directly from producer-
to consumer?
Barriers to direct shipment Prioritize from highest barrier (5) to lowers
barrier (1). (1, 2, 3, 4 & 5) Institutional barriers
Infrastructural barriers
55
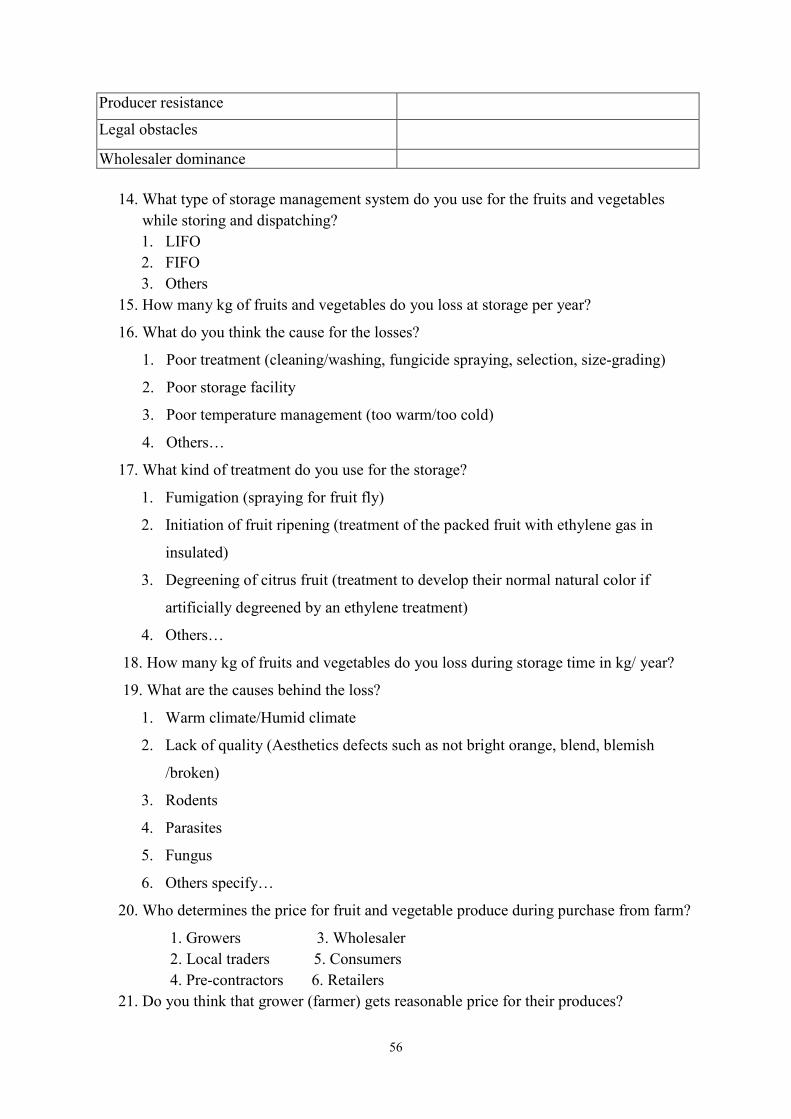
Producer resistance
Legal obstacles
Wholesaler dominance
14. What type of storage management system do you use for the fruits and vegetables while storing and dispatching? 1. LIFO 2. FIFO 3. Others
15. How many kg of fruits and vegetables do you loss at storage per year?
16. What do you think the cause for the losses?
1. Poor treatment (cleaning/washing, fungicide spraying, selection, size-grading)
2. Poor storage facility
3. Poor temperature management (too warm/too cold)
4. Others…
17. What kind of treatment do you use for the storage?
1. Fumigation (spraying for fruit fly)
2. Initiation of fruit ripening (treatment of the packed fruit with ethylene gas in
insulated)
3. Degreening of citrus fruit (treatment to develop their normal natural color if
artificially degreened by an ethylene treatment)
4. Others…
18. How many kg of fruits and vegetables do you loss during storage time in kg/ year?
19. What are the causes behind the loss?
1. Warm climate/Humid climate
2. Lack of quality (Aesthetics defects such as not bright orange, blend, blemish
/broken)
3. Rodents
4. Parasites
5. Fungus
6. Others specify…
20. Who determines the price for fruit and vegetable produce during purchase from farm?
1. Growers 3. Wholesaler 2. Local traders 5. Consumers 4. Pre-contractors 6. Retailers
21. Do you think that grower (farmer) gets reasonable price for their produces?
56
1. Yes 2. No
22. If the answer is No, what could be the reason? Multiple answers are possible. 1. Due to weak market organization 2. Due to lacking access to right marketing place 3. Due to fragile coordination among growers 4. Due to bargaining power of other intermediaries 5. Others?
23. Who has more power while negotiating price for more perishable fruit and vegetable produces? 1. Farmer 2. Wholesaler 3. Retailer 4. Local collector (merchants) 5. Others specify
24. Who has more power while negotiating price for relatively durable fruit and vegetable produces? 1. Farmer (grower) 2. Wholesaler 3. Retailer 4. Local collector (merchants) 5. Others specify
25. What do you think about environmental pollution related with scraps of fresh produces
waste disposal?
1. I care about environment (throw at right garbage)
2. I don’t care about environment (throw everywhere)
3. I have no awareness about environmental pollution
4. Others specify…
26. What kind of mechanism do you use for waste disposal? 25. Estimation of loss percent for each crop along each supply chain channels
57

T = Transport L& UL = Loading and Unloading S = Storage D = Distribution
23. Which of the following Food waste disposal mechanisms do you use along your supply chain channel?
Supply chain actors
Waste disposal mechanisms Public garbage
Private garbage
Donate for charity
Disposal at any places
Feed for animals
Feed street dwellers
Consumers Retailers Street vendors
Other wholesaler
Processors Container sellers
Etfruit wholesaler
22. Estimation of loss percent on the bases of total loss experienced for each crop along each supply chain channels
Crops Etfruit Wholesaler(1) Estimated loss for each crops via each channels
Etfruit Wholesaler(2) Estimated loss for each crops via each channels
Etfruit Wholesaler(3) Estimated loss for each crops via each channels
T L & UL S D T L& UL S D T L &UL S D Orange Mandarin Banana Avocado Mango Papaya Tomato Onion Potato Cabbage Carrots
58
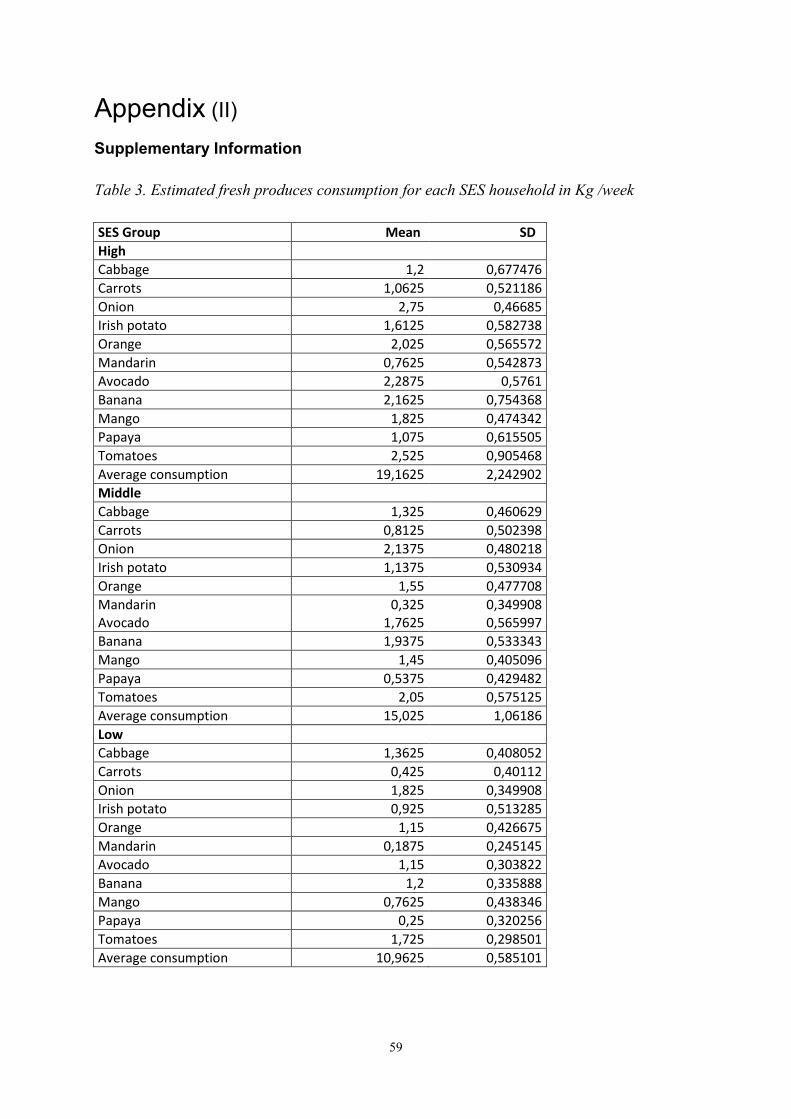
Appendix (II)
Supplementary Information
Table 3. Estimated fresh produces consumption for each SES household in Kg /week SES Group Mean SD High
Cabbage 1,2 0,677476 Carrots 1,0625 0,521186 Onion 2,75 0,46685 Irish potato 1,6125 0,582738 Orange 2,025 0,565572 Mandarin 0,7625 0,542873 Avocado 2,2875 0,5761 Banana 2,1625 0,754368 Mango 1,825 0,474342 Papaya 1,075 0,615505 Tomatoes 2,525 0,905468 Average consumption 19,1625 2,242902 Middle
Cabbage 1,325 0,460629 Carrots 0,8125 0,502398 Onion 2,1375 0,480218 Irish potato 1,1375 0,530934 Orange 1,55 0,477708 Mandarin 0,325 0,349908 Avocado 1,7625 0,565997 Banana 1,9375 0,533343 Mango 1,45 0,405096 Papaya 0,5375 0,429482 Tomatoes 2,05 0,575125 Average consumption 15,025 1,06186 Low
Cabbage 1,3625 0,408052 Carrots 0,425 0,40112 Onion 1,825 0,349908 Irish potato 0,925 0,513285 Orange 1,15 0,426675 Mandarin 0,1875 0,245145 Avocado 1,15 0,303822 Banana 1,2 0,335888 Mango 0,7625 0,438346 Papaya 0,25 0,320256 Tomatoes 1,725 0,298501 Average consumption 10,9625 0,585101
59
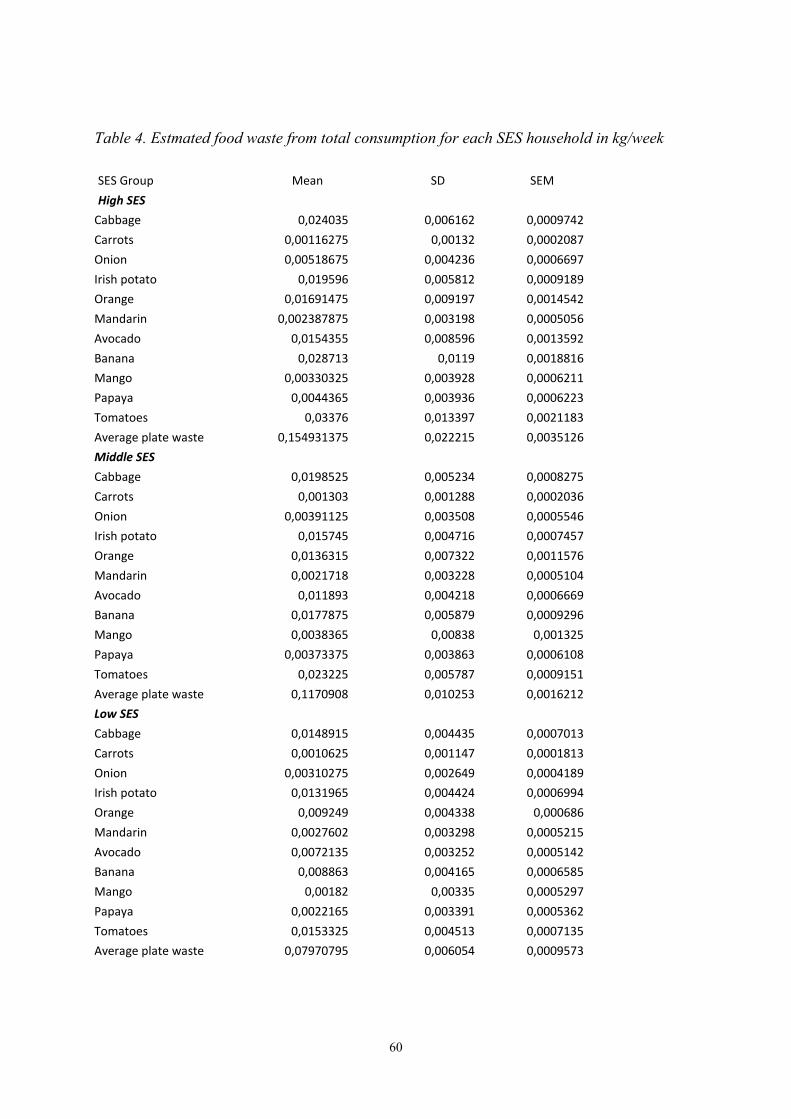
Table 4. Estmated food waste from total consumption for each SES household in kg/week SES Group Mean SD SEM High SES
Cabbage 0,024035 0,006162 0,0009742 Carrots 0,00116275 0,00132 0,0002087 Onion 0,00518675 0,004236 0,0006697 Irish potato 0,019596 0,005812 0,0009189 Orange 0,01691475 0,009197 0,0014542 Mandarin 0,002387875 0,003198 0,0005056 Avocado 0,0154355 0,008596 0,0013592 Banana 0,028713 0,0119 0,0018816 Mango 0,00330325 0,003928 0,0006211 Papaya 0,0044365 0,003936 0,0006223 Tomatoes 0,03376 0,013397 0,0021183 Average plate waste 0,154931375 0,022215 0,0035126 Middle SES
Cabbage 0,0198525 0,005234 0,0008275 Carrots 0,001303 0,001288 0,0002036 Onion 0,00391125 0,003508 0,0005546 Irish potato 0,015745 0,004716 0,0007457 Orange 0,0136315 0,007322 0,0011576 Mandarin 0,0021718 0,003228 0,0005104 Avocado 0,011893 0,004218 0,0006669 Banana 0,0177875 0,005879 0,0009296 Mango 0,0038365 0,00838 0,001325 Papaya 0,00373375 0,003863 0,0006108 Tomatoes 0,023225 0,005787 0,0009151 Average plate waste 0,1170908 0,010253 0,0016212 Low SES
Cabbage 0,0148915 0,004435 0,0007013 Carrots 0,0010625 0,001147 0,0001813 Onion 0,00310275 0,002649 0,0004189 Irish potato 0,0131965 0,004424 0,0006994 Orange 0,009249 0,004338 0,000686 Mandarin 0,0027602 0,003298 0,0005215 Avocado 0,0072135 0,003252 0,0005142 Banana 0,008863 0,004165 0,0006585 Mango 0,00182 0,00335 0,0005297 Papaya 0,0022165 0,003391 0,0005362 Tomatoes 0,0153325 0,004513 0,0007135 Average plate waste 0,07970795 0,006054 0,0009573
60

Table 5. Total fresh produces supply and purchase and selling price Produces Total supply for
(2004) in Kg purchased price in Birr/Kg
selling price in Birr/Kg
Place of supply with Km
Cabbages 1783685 3.75 4.50 Meki 90km from A.A Carrots 142695 7.00 10.00 Holeta 42km from
A.A onions 356737 2.50 3.50 Merti 230km from
A.A Potatoes 535106 2.50 3.50 Shashemane 250km
from A.A Orange 7134740 6.40 7.70 Merti 230km from
A.A Mandarin 7848214 4.00 5.00 Merti 230km from
A.A Avocado 1426948 4.50 7.00 Yergalem 330km from
A.A Banana 8775730 4.00 7.50 ArbaMinch 505km
from A.A Mango 713474 300 5.00 Assosa Merti 760 km
from A.A Papaya 1070211 2.75 3.75 Merti 90km from
A.A Tomatoes 5886161 3.00 4.50 Wenji 110km from
A.A
Table 6. Food loss in supply chain for major players and fresh produces in Kg (‘000th)
Fresh produces
Supply chain actors Total supply
Producer Store
Etfruit wholesal
Processors Other wholesale
Export Etfruit contain
Retail Vendor Total loss
Loss %
Cabbages 1784 71 285 18 54 18 21 25 7 499 5%
Carrots 143 6 23 1 4 1 2 2 1 40 4%
Onions 357 14 57 4 11 4 4 5 1 250 1%
Potatoes 535 21 86 5 16 5 6 7 2 150 2%
Orange 7135 285 1142 71 214 71 86 100 29 1998 20%
Mandarin 7848 314 1256 78 235 78 94 110 31 2198 22%
Avocado 1427 57 228 14 43 14 17 20 6 400 4%
Banana 8776 351 1404 88 263 88 105 123 35 2457 25%
Mango 713 29 114 7 21 7 9 10 3 200 2%
Papaya 1070 43 171 11 32 11 13 15 4 300 3%
Tomatoes 5886 235 942 59 177 59 71 82 24 1648 17%
Total 35674 1427 5708 357 1070 357 428 499 143 9989 100
61
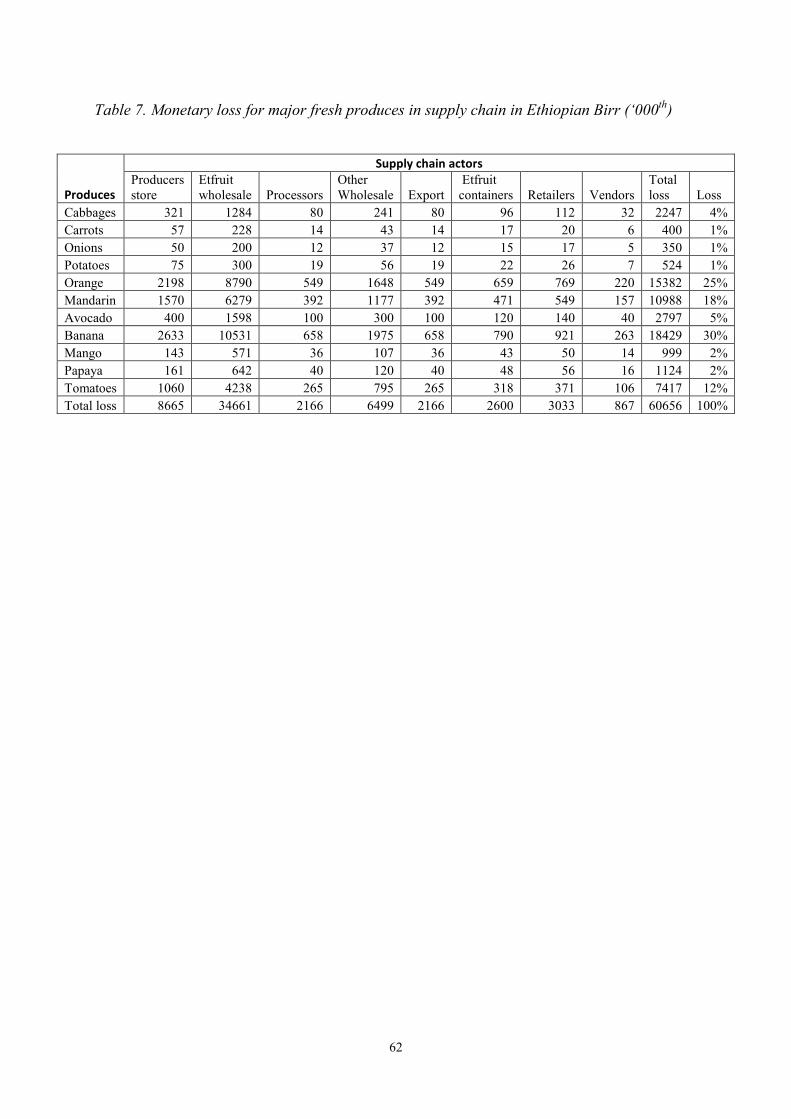
Table 7. Monetary loss for major fresh produces in supply chain in Ethiopian Birr (‘000th)
Produces
Supply chain actors Producers store
Etfruit wholesale Processors
Other Wholesale Export
Etfruit containers Retailers Vendors
Total loss Loss
Cabbages 321 1284 80 241 80 96 112 32 2247 4% Carrots 57 228 14 43 14 17 20 6 400 1% Onions 50 200 12 37 12 15 17 5 350 1% Potatoes 75 300 19 56 19 22 26 7 524 1% Orange 2198 8790 549 1648 549 659 769 220 15382 25% Mandarin 1570 6279 392 1177 392 471 549 157 10988 18% Avocado 400 1598 100 300 100 120 140 40 2797 5% Banana 2633 10531 658 1975 658 790 921 263 18429 30% Mango 143 571 36 107 36 43 50 14 999 2% Papaya 161 642 40 120 40 48 56 16 1124 2% Tomatoes 1060 4238 265 795 265 318 371 106 7417 12% Total loss 8665 34661 2166 6499 2166 2600 3033 867 60656 100%
62