Embed Size (px)
Citation preview
Chapter 5Fault Tree Analysis
The first fault tree in the history was the one from which Evetook the forbidden apple in the Garden of Eden
Lee RemickProbabilistic Safety Assessment conference, 1993
5.1 Introduction
The fault tree analysis is a standard method for the assessment and improvement ofreliability and safety [1–3]. It has been and it is applied in various sectors, such asnuclear industry, air and space industry, electrical industry, chemical industry,railway industry, transport, software reliability, and insurance. Its widely accep-tance is gained primarily when integrated with the event tree analysis as a part ofthe probabilistic safety assessment (PSA) for improving the safety of nuclearpower plants and for improving the safety of space missions [4–7].
The fault tree analysis is an analytical technique, where an undesired state ofthe system is specified and then the system is analyzed in the context of itsenvironment and operation to find all realistic ways in which the undesired eventcan occur. The undesired state of the system, which is identified at the beginningof the fault tree analysis, is usually a state that is critical from a safety or reliabilitystandpoint and is identified as the top event. Top event is therefore an undesiredevent, which is further analyzed with the fault tree analysis.
The fault tree analysis is a term that combines the graphical model, which iscalled the fault tree or fault tree model, the qualitative analysis of the fault tree,and the quantitative analysis of the fault tree, which includes the probabilisticfailure data and the associated results.
The fault tree is a graphic model of the various parallel and sequential com-binations of faults that can lead to the occurrence of the predefined undesired eventor top event.
The logical gates of the fault tree integrate the primary events to the top event.The primary events are the events that are not further developed, e.g., the basicevents and the house events.
The basic events are the ultimate parts of the fault tree, which represent theundesired events and their failure modes, e.g., the component failures, the missedactuation signals, the human errors, the unavailabilities because of the test and
M. Cepin, Assessment of Power System Reliability,DOI: 10.1007/978-0-85729-688-7_5, � Springer-Verlag London Limited 2011
61
maintenance activities, the common cause failure contributions, and softwareerrors.
The house events represent the conditions set to either true or false, whichsupport the modeling of connections between the gates and the basic events andenable that the fault tree better represents the system operation and its environment.
5.2 Fault Versus Failure
Failures are specific events which are the outcomes of the failure modes, andare directly connected with reasons for failure within the boundaries of theequipment under investigation. Faults are more general events and consider thebehavior outside of defined equipment boundaries in addition. If a relay does notclose, because the contacts are broken, this is a failure of the relay. If the relay doesnot close, because the signal for relay closure is not received, it is not the failure ofthe relay. But as the relay cannot function and it should, such state is its fault.
Another example of distinction of definitions of failure and fault is that theswitch closes at the wrong time because of the improper functioning of somecomponent. This is not a switch failure, but the circuit can enter into an unsatis-factory state or fault state. To generalize, all failures are faults but not all faults arefailures.
The fault tree is not a model of all equipment faults. It is a model of only thosefaults or of those failure modes, which can cause the top event to occur.
Fault tree is a static tool, although it has evolved to a number of semi-dynamicor dynamic attempts.
5.3 Fault Tree Analysis Procedure Steps
The fault tree analysis procedure steps are the following [5, 8–12].
• Identification of the objectives for the fault tree analysis• Definition of the top event of the fault tree• Definition of the scope, resolution, and ground rules of the fault tree• Fault tree construction• Qualitative fault tree evaluation• Preparation of the probabilistic failure database and connection of the basic
events of the fault tree with probabilistic failure data• Quantitative fault tree evaluation• Interpretation of the fault tree analysis results
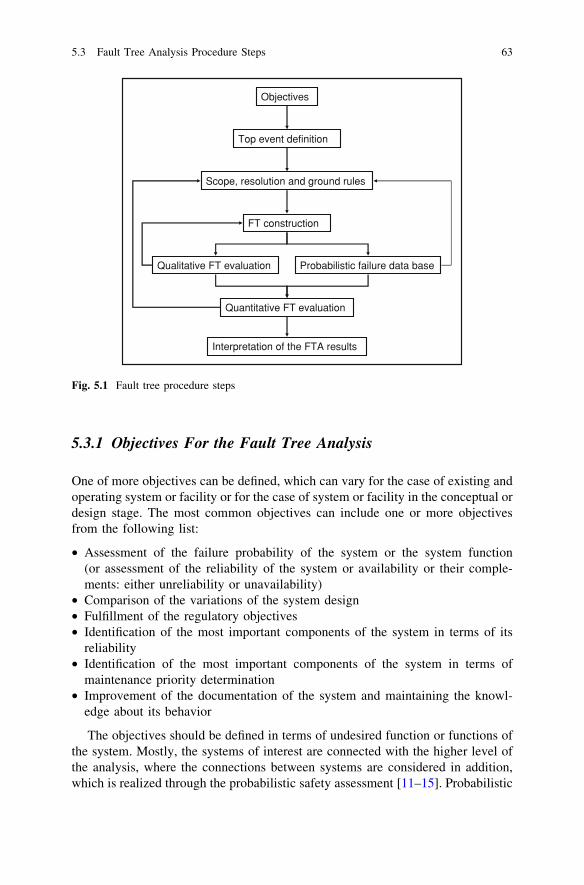
Figure 5.1 shows the fault tree analysis procedure steps together with theirmain mutual relationships. The procedure steps are described in the followingsubsections.
62 5 Fault Tree Analysis
5.3.1 Objectives For the Fault Tree Analysis
One of more objectives can be defined, which can vary for the case of existing andoperating system or facility or for the case of system or facility in the conceptual ordesign stage. The most common objectives can include one or more objectivesfrom the following list:
• Assessment of the failure probability of the system or the system function(or assessment of the reliability of the system or availability or their comple-ments: either unreliability or unavailability)
• Comparison of the variations of the system design• Fulfillment of the regulatory objectives• Identification of the most important components of the system in terms of its
reliability• Identification of the most important components of the system in terms of
maintenance priority determination• Improvement of the documentation of the system and maintaining the knowl-
edge about its behavior
The objectives should be defined in terms of undesired function or functions ofthe system. Mostly, the systems of interest are connected with the higher level ofthe analysis, where the connections between systems are considered in addition,which is realized through the probabilistic safety assessment [11–15]. Probabilistic
Objectives
Top event definition
Scope, resolution and ground rules
FT construction
Probabilistic failure data baseQualitative FT evaluation
Interpretation of the FTA results
Quantitative FT evaluation
Fig. 5.1 Fault tree procedure steps
5.3 Fault Tree Analysis Procedure Steps 63
safety assessment is a term describing application of several methods includingfault tree analysis for systems analysis and other analysis methods such as theevent tree analysis for the analysis of the connections between the systems[16–23].
5.3.2 Definition of the Top Event of the Fault Tree
The top event defines the failure mode of the system or its function, which is thenanalyzed in terms of failure modes of its components and influence factors. It isimportant to distinguish the success criteria of the system and the description ofthe top event, which is defined in term of failure modes [5, 6, 11].
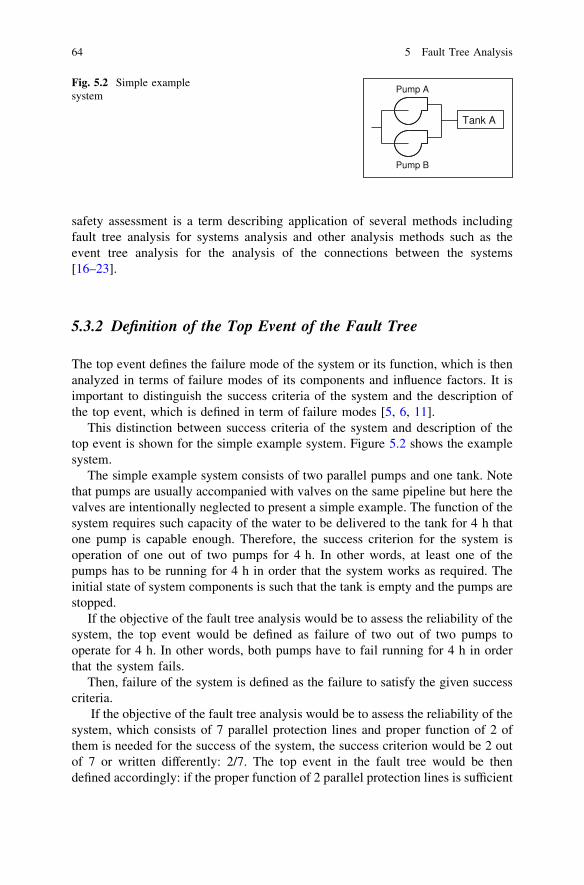
This distinction between success criteria of the system and description of thetop event is shown for the simple example system. Figure 5.2 shows the examplesystem.
The simple example system consists of two parallel pumps and one tank. Notethat pumps are usually accompanied with valves on the same pipeline but here thevalves are intentionally neglected to present a simple example. The function of thesystem requires such capacity of the water to be delivered to the tank for 4 h thatone pump is capable enough. Therefore, the success criterion for the system isoperation of one out of two pumps for 4 h. In other words, at least one of thepumps has to be running for 4 h in order that the system works as required. Theinitial state of system components is such that the tank is empty and the pumps arestopped.
If the objective of the fault tree analysis would be to assess the reliability of thesystem, the top event would be defined as failure of two out of two pumps tooperate for 4 h. In other words, both pumps have to fail running for 4 h in orderthat the system fails.
Then, failure of the system is defined as the failure to satisfy the given successcriteria.
If the objective of the fault tree analysis would be to assess the reliability of thesystem, which consists of 7 parallel protection lines and proper function of 2 ofthem is needed for the success of the system, the success criterion would be 2 outof 7 or written differently: 2/7. The top event in the fault tree would be thendefined accordingly: if the proper function of 2 parallel protection lines is sufficient
Tank A
Pump A
Pump B
Fig. 5.2 Simple examplesystem
64 5 Fault Tree Analysis
for proper operation of the system, then the failure of 6 lines would be needed inorder that the system has failed. So the top event in the fault tree, which representsthe system failure, would be defined as failure of 6 out of 7 lines or written as 6/7.
In general, the success criteria of certain system can be defined as k out ofn subsystems or written: k/n, which means that n parallel subsystems exist and k ofthem are needed for proper system function. The top event in the fault tree, whichrepresents the system failure, can be defined as (n - k ? 1)/n. This means thatn - k ? 1 parallel lines have to fail to have the system failure.
One interesting special case is the logic 2 out of 3, which means that two out ofthree parallel lines have to operate properly for the proper system operation. If wedetermine, what should be defined in the top event of the fault tree, we cancalculate n - k ? 1/n, which is (3 - 2 ? 1)/3, which is again two out of three.This special case is clearly logical. If we have three parallel lines of which twolines have to operate properly in order that the system operates, the failure of thesystem is reached if two out of three parallel lines fail.
An example of a top event when analyzing safety systems in nuclear powerplants would be: high pressure safety injection system fails to deliver water (2 outof 2 lines has to fail) to reactor coolant system, because the function of one line isenough for the system to operate properly.
An example of a top event when analyzing safety of space missions would be‘‘loss of a space vehicle.’’ Or another example ‘‘loss of crew.’’ An example of thetop event when calculating the reliability of a power substation could be loss ofpower to the load A or loss of power to the specific set of customers.
5.3.3 Definition of the Scope, Resolution, and Rulesof the Fault Tree
The scope of the fault tree indicates which of the faults and contributors areincluded in the model and subsequently in the analysis and which are not.
The state of the analyzed facility is frozen in terms of current design revision ata specified date. If the design changes of the facility are made or if the procedureschanges appear during the duration of the analysis project, they are not consideredimmediately. If needed, the new frozen date and design revision is determined andthe revision of the models is then made.
The scope includes that the boundary conditions of the analysis are defined. Theboundary conditions include the way how treatment of the outside events isconsidered in the analysis and where the limits of the system are. For example of asimple example system from Fig. 5.2, it could be assumed that electrical power isavailable and its loss is not considered or alternatively the loss of power supply toeach of the pumps is further analyzed. Or the actuation signal for the pumpsstart could be considered or not as a means of success or failure of the system.In addition, the initial states of the components are defined. If the pumps arestopped, they can fail to start and then can latter fail to run, but if the pumps would
5.3 Fault Tree Analysis Procedure Steps 65
be running, the only failure mode considered in the fault tree would be failure torun for required time.
The resolution of the fault tree analysis determines how large the componentsare. For example, the diesel generator can be considered as a component and it isnot further divided in the analysis. The basic events of the fault tree are then relatedto the failure modes of the diesel generator as a whole and they are only a few. Oralternatively, the pieces of the diesel generator can be assumed as the componentssuch as the daily tank, the instrumentation, the rotor, the stator and the associatedcables and pipes for example. Then, the basic events of the fault tree are related tothe larger number of components of the diesel generator and their failure modes.
The resolution of modeling is closely related to the reliability database. Theresolution is selected such that the components of the system suit the items fromthe reliability database that it is used.
The ground rules for the fault tree analysis include the procedures how the faulttree is developed and what are the rules for determining the descriptions and theirabbreviations.
The fault tree can be developed in sense that the system and its components arefollowed sequentially one after another through the paths of the system in a waythat the gates have only two inputs: (i) particular component failure mode or(ii) the input to that component. Or the fault tree gates are enabled with more inputevents or even the portions of the system, which include several components thatare treated as modules that are then jointly considered within the fault tree.
An important feature of the analysis of more complex facilities with severalsystems, several functions, and a large number of components is the namingscheme of the basic events and gates. This can at a later stage largely simplify thedifficulties with grouping of components, systems, basic events, top events, andrespective evaluations when interpreting the results.
For example, basic event name: xxx–yyy–zzzzz–ww can be formed from itsparts as:xxx System identificationyyy Subsystem identificationzzzzz Component identificationww Failure mode identification
5.3.4 Fault Tree Construction
The fault tree construction is a step, where the fault tree model is developedgraphically or where the Boolean equations which represent the fault tree aredeveloped.
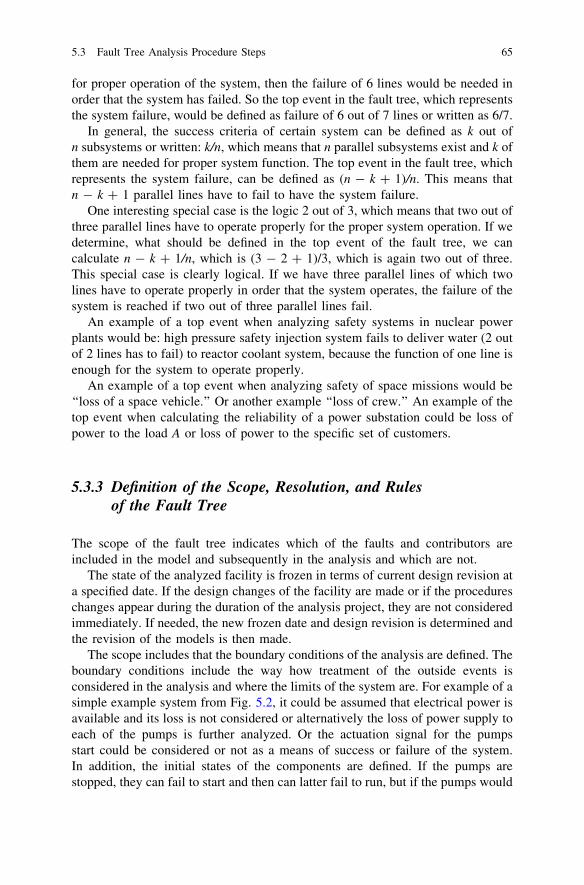
If the fault tree is developed graphically, the fault tree symbols are used.Figure 5.3 shows the fault tree symbols, although some others can be used inaddition, such as EXCLUSIVE OR gate, PRIORITY AND gate, and INHIBIT gate.
66 5 Fault Tree Analysis
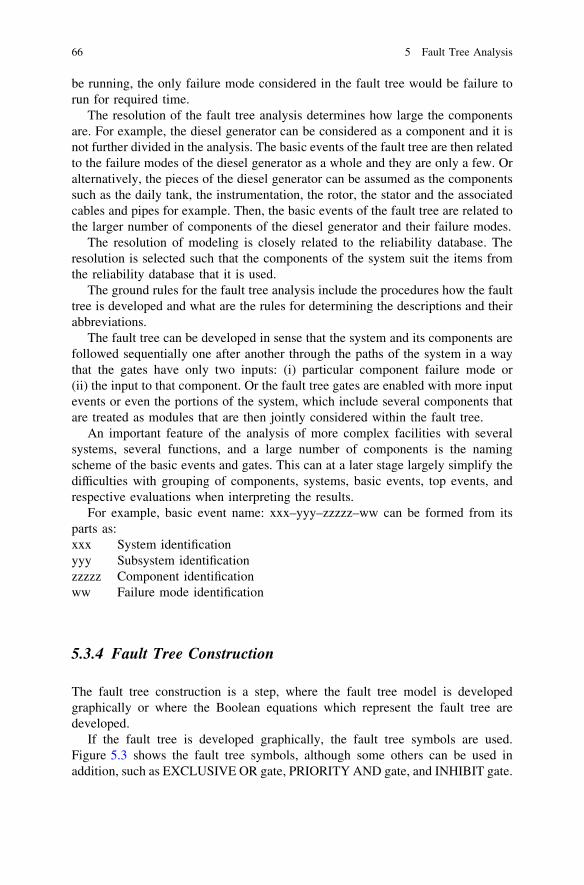
The first fault tree symbol is circle and represents the basic event. Figure 5.4shows examples of basic events. The left one includes description and circledetermining the basic event. The second one includes description, identificationcode and circle determining the basic event.
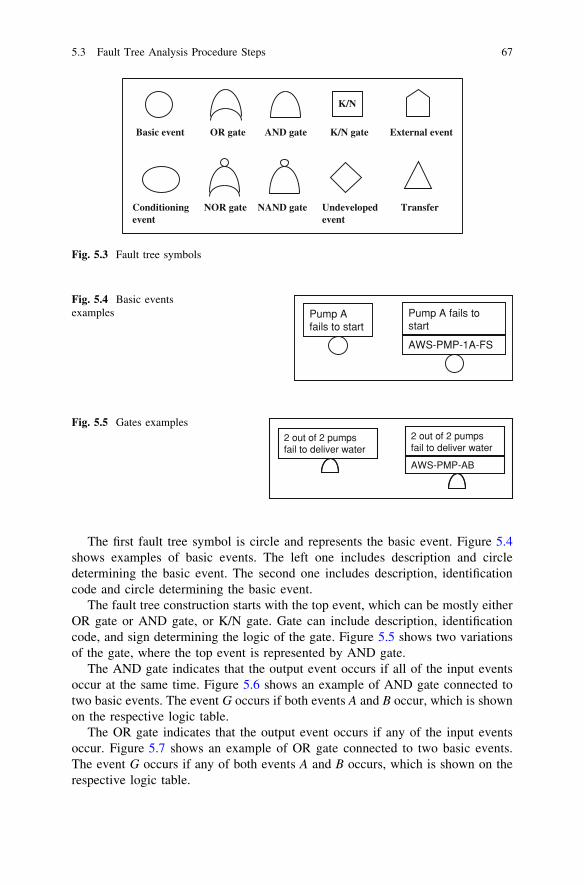
The fault tree construction starts with the top event, which can be mostly eitherOR gate or AND gate, or K/N gate. Gate can include description, identificationcode, and sign determining the logic of the gate. Figure 5.5 shows two variationsof the gate, where the top event is represented by AND gate.
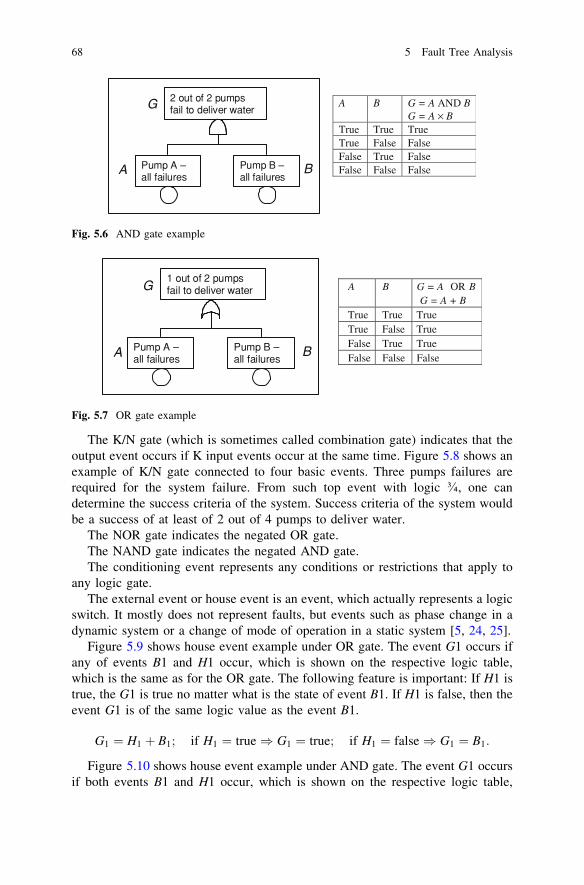
The AND gate indicates that the output event occurs if all of the input eventsoccur at the same time. Figure 5.6 shows an example of AND gate connected totwo basic events. The event G occurs if both events A and B occur, which is shownon the respective logic table.
The OR gate indicates that the output event occurs if any of the input eventsoccur. Figure 5.7 shows an example of OR gate connected to two basic events.The event G occurs if any of both events A and B occurs, which is shown on therespective logic table.
Basic event
Conditioningevent
Undevelopedevent
External event
K/N
Transfer
AND gateOR gate
NAND gateNOR gate
K/N gate
Fig. 5.3 Fault tree symbols
Pump A fails to start
Pump A fails to start
AWS-PMP-1A-FS
Fig. 5.4 Basic eventsexamples
2 out of 2 pumpsfail to deliver water
AWS-PMP-AB
2 out of 2 pumpsfail to deliver water
Fig. 5.5 Gates examples
5.3 Fault Tree Analysis Procedure Steps 67
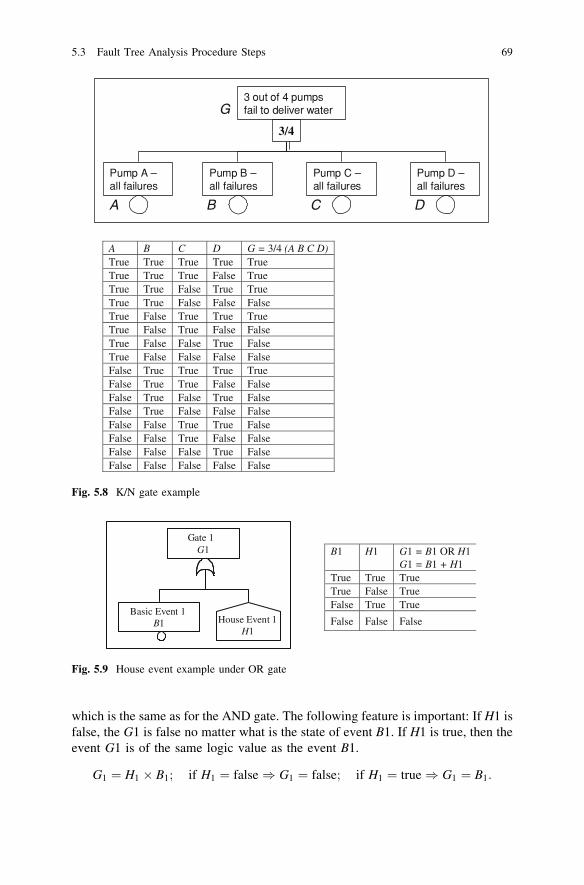
The K/N gate (which is sometimes called combination gate) indicates that theoutput event occurs if K input events occur at the same time. Figure 5.8 shows anexample of K/N gate connected to four basic events. Three pumps failures arerequired for the system failure. From such top event with logic �, one candetermine the success criteria of the system. Success criteria of the system wouldbe a success of at least of 2 out of 4 pumps to deliver water.
The NOR gate indicates the negated OR gate.The NAND gate indicates the negated AND gate.The conditioning event represents any conditions or restrictions that apply to
any logic gate.The external event or house event is an event, which actually represents a logic
switch. It mostly does not represent faults, but events such as phase change in adynamic system or a change of mode of operation in a static system [5, 24, 25].
Figure 5.9 shows house event example under OR gate. The event G1 occurs ifany of events B1 and H1 occur, which is shown on the respective logic table,which is the same as for the OR gate. The following feature is important: If H1 istrue, the G1 is true no matter what is the state of event B1. If H1 is false, then theevent G1 is of the same logic value as the event B1.
G1 ¼ H1 þ B1; if H1 ¼ true) G1 ¼ true; if H1 ¼ false) G1 ¼ B1:
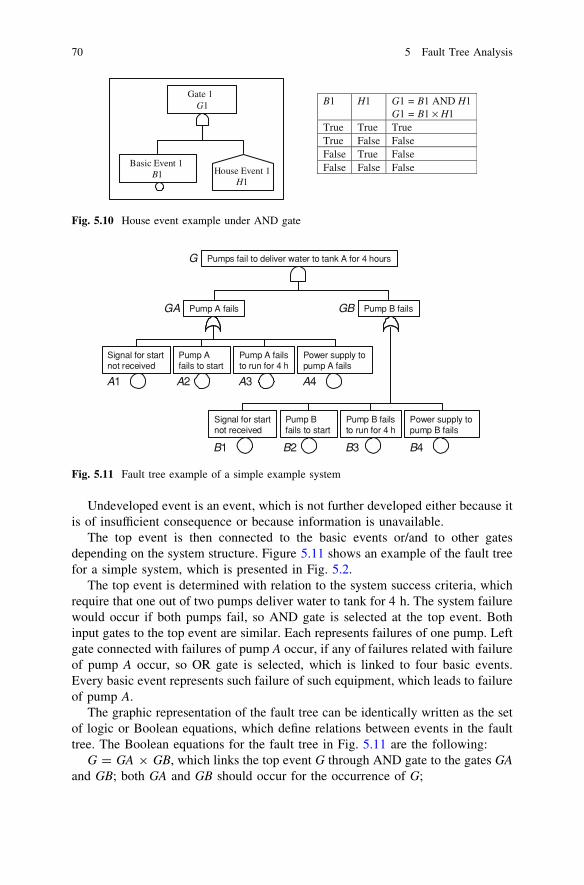
Figure 5.10 shows house event example under AND gate. The event G1 occursif both events B1 and H1 occur, which is shown on the respective logic table,
Pump A –all failures
2 out of 2 pumpsfail to deliver water
Pump B –all failures
G
A B
A B G = A AND B G = A × B
True True True True False False False True False False False False
Fig. 5.6 AND gate example
Pump A –all failures
1 out of 2 pumpsfail to deliver water
Pump B –all failures
G
A B
A B G = A OR B G = A + B
True True True True False True False True True False False False
Fig. 5.7 OR gate example
68 5 Fault Tree Analysis
which is the same as for the AND gate. The following feature is important: If H1 isfalse, the G1 is false no matter what is the state of event B1. If H1 is true, then theevent G1 is of the same logic value as the event B1.
G1 ¼ H1 � B1; if H1 ¼ false) G1 ¼ false; if H1 ¼ true) G1 ¼ B1:
Pump B –all failures
3 out of 4 pumpsfail to deliver water
Pump C –all failures
Pump A –all failures
Pump D –all failures
3/4
G
A B C D
A B C D G = 3/4 (A B C D) True True True True True True True True False True True True False True True True True False False False True False True True True True False True False False True False False True False True False False False False False True True True True False True True False False False True False True False False True False False False False False True True False False False True False False False False False True False False False False False False
Fig. 5.8 K/N gate example
Basic Event 1 B1
Gate 1 G1
House Event 1H1
B1 H1 G1 = B1 OR H1 G1 = B1 + H1
True True True True False True False True True
False False False
Fig. 5.9 House event example under OR gate
5.3 Fault Tree Analysis Procedure Steps 69
Undeveloped event is an event, which is not further developed either because itis of insufficient consequence or because information is unavailable.
The top event is then connected to the basic events or/and to other gatesdepending on the system structure. Figure 5.11 shows an example of the fault treefor a simple system, which is presented in Fig. 5.2.
The top event is determined with relation to the system success criteria, whichrequire that one out of two pumps deliver water to tank for 4 h. The system failurewould occur if both pumps fail, so AND gate is selected at the top event. Bothinput gates to the top event are similar. Each represents failures of one pump. Leftgate connected with failures of pump A occur, if any of failures related with failureof pump A occur, so OR gate is selected, which is linked to four basic events.Every basic event represents such failure of such equipment, which leads to failureof pump A.
The graphic representation of the fault tree can be identically written as the setof logic or Boolean equations, which define relations between events in the faulttree. The Boolean equations for the fault tree in Fig. 5.11 are the following:
G = GA 9 GB, which links the top event G through AND gate to the gates GAand GB; both GA and GB should occur for the occurrence of G;
Basic Event 1 B1
Gate 1 G1
House Event 1H1
B1 H1 G1 = B1 AND H1 G1 = B1 × H1
True True True True False False False True False False False False
Fig. 5.10 House event example under AND gate
Pumps fail to deliver water to tank A for 4 hours
Pump A fails to start
Pump A failsto run for 4 h
Signal for start not received
Power supply to pump A fails
Pump A fails
Pump B fails to start
Pump B failsto run for 4 h
Signal for start not received
Power supply to pump B fails
Pump B fails
G
BGAG
A1 A2 A3 A4
B1 B2 B3 B4
Fig. 5.11 Fault tree example of a simple example system
70 5 Fault Tree Analysis
GA = A1 ? A2 ? A3 ? A4, which links gate GA through OR gate with basicevents A1, A2, A3, and A4. Any of the events A1 OR A2 OR A3 OR A4 occur forthe occurrence of GA;
GB = B1 ? B2 ? B3 ? B4, which links gate GB through OR gate with basicevents B1, B2, B3, and B4. Any of the events B1 OR B2 OR B3 OR B4 occur forthe occurrence of GB.
5.3.5 Qualitative Fault Tree Evaluation
Qualitative fault tree evaluation is the process of finding the combinations of basicevents, which, if they occur, cause the top event occurrence.
If the fault tree is written in the form of Boolean equations, those need to becombined into one with applying the rules of Boolean algebra to obtain theequation for top event, which consists of sum of products of basic events.
If the fault tree is developed in its graphical form, the Boolean equations needto be written first based on the logic of the gates and their inputs. And then, therules of the Boolean algebra are applied to obtain the equation for top event, whichconsists of sum of products of basic events.
The sum of products of basic events identifies the minimal cut sets. The min-imal cut sets are the combinations of components failures, which fail the system.In other words, the minimal cut sets are combinations of the smallest number ofbasic events, which if occur simultaneously, may lead to the top event.
When the sum of products of basic events is expressed from Boolean equationsof the fault tree, each element of the sum includes the product of a certain numberof basic events. Those basic events together represent a minimal cut set.
A minimal cut set can include only one basic event. This is then single minimalcut set. Single minimal cut set means the single-component failure can fail thesystem, which is under consideration. A minimal cut set can include two basicevents. This is then double minimal cut set. Double minimal cut set means that twospecific component failures can fail the system. A minimal cut set can includethree basic events. This is then triple minimal cut set. Triple minimal cut set meansthat three specific component failures can fail the system. A minimal cut set caninclude four basic events. This is then quadruple minimal cut set. Quadrupleminimal cut set means that four specific component failures can fail the system. Aminimal cut set can include any larger number of basic events. The larger thisnumber is, the less probable system failure would be.
For the simplest example of the fault tree, which is presented in Fig. 5.6, onlyone short equation is representing the fault tree and at the same time it shows thequalitative result, which shows the sum of products of events. In this particularevent, it is only one set of products: G = A 9 B.
This equation shows that only one minimal cut set exists and it includes twoevents A and B. If both fail, would cause system to fail. This particular caseincludes one double minimal cut set.
5.3 Fault Tree Analysis Procedure Steps 71
For the simplest example of the fault tree, which is presented in Fig. 5.7, onlyone short equation is representing the fault tree and at the same time it shows thequalitative result, which shows the sum of products of events. In this particularevent, it is only two set of products: G = A ? B.
This equation shows that only two minimal cut set exist and they both includeone event. The first minimal cut set includes the event A and the second minimalcut set includes the event B. If event A occurs, this would cause the system to fail.Or if event B occurs, this would cause the system to fail. This particular caseincludes two single minimal cut sets.
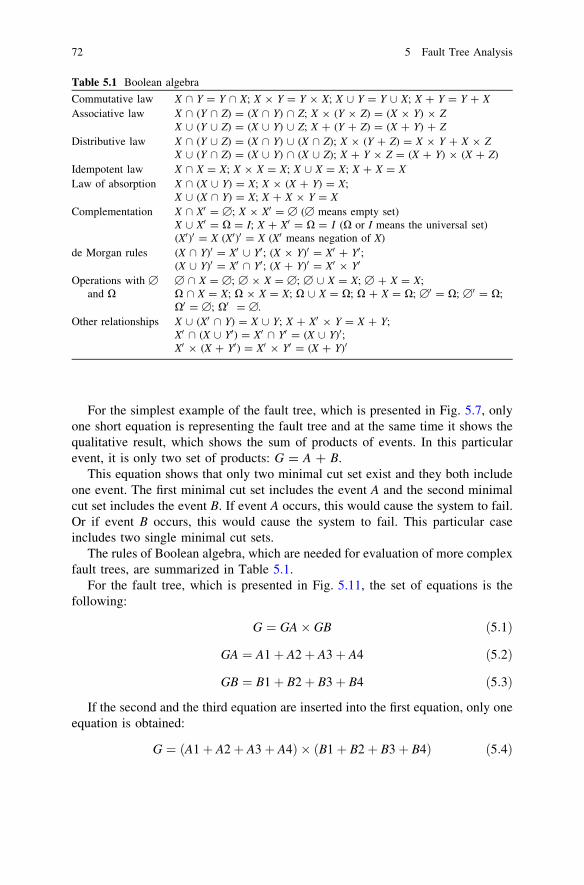
The rules of Boolean algebra, which are needed for evaluation of more complexfault trees, are summarized in Table 5.1.
For the fault tree, which is presented in Fig. 5.11, the set of equations is thefollowing:
G ¼ GA� GB ð5:1Þ
GA ¼ A1þ A2þ A3þ A4 ð5:2Þ
GB ¼ B1þ B2þ B3þ B4 ð5:3Þ
If the second and the third equation are inserted into the first equation, only oneequation is obtained:
G ¼ A1þ A2þ A3þ A4ð Þ � B1þ B2þ B3þ B4ð Þ ð5:4Þ
Table 5.1 Boolean algebra
Commutative law X \ Y = Y \ X; X 9 Y = Y 9 X; X [ Y = Y [ X; X ? Y = Y ? XAssociative law X \ (Y \ Z) = (X \ Y) \ Z; X 9 (Y 9 Z) = (X 9 Y) 9 Z
X [ (Y [ Z) = (X [ Y) [ Z; X ? (Y ? Z) = (X ? Y) ? ZDistributive law X \ (Y [ Z) = (X \ Y) [ (X \ Z); X 9 (Y ? Z) = X 9 Y ? X 9 Z
X [ (Y \ Z) = (X [ Y) \ (X [ Z); X ? Y 9 Z = (X ? Y) 9 (X ? Z)Idempotent law X \ X = X; X 9 X = X; X [ X = X; X ? X = XLaw of absorption X \ (X [ Y) = X; X 9 (X ? Y) = X;
X [ (X \ Y) = X; X ? X 9 Y = XComplementation X \ X0 = [; X 9 X0 = [ ([ means empty set)
X [ X0 = X = I; X ? X0 = X = I (X or I means the universal set)(X0)0 = X (X0)0 = X (X0 means negation of X)
de Morgan rules (X \ Y)0 = X0 [ Y0; (X 9 Y)0 = X0 ? Y0;(X [ Y)0 = X0 \ Y0; (X ? Y)0 = X0 9 Y0
Operations with [
and X[ \ X = [; [ 9 X = [; [ [ X = X; [ ? X = X;X \ X = X; X 9 X = X; X [ X = X; X ? X = X; [0 = X; [0 = X;X0 = [; X0 = [.
Other relationships X [ (X0 \ Y) = X [ Y; X ? X0 9 Y = X ? Y;X0 \ (X [ Y0) = X0 \ Y0 = (X [ Y)0;X0 9 (X ? Y0) = X0 9 Y0 = (X ? Y)0
72 5 Fault Tree Analysis
Evaluation of the product gives the final equation, which consists of 16 minimalcut sets, which are all double minimal cut sets in this particular example, andwhich means that each include two basic events:
G ¼ A1� B1þ A2� B1þ A3� B1þ A4� B1þ A1� B2þ A2� B2þ A3� B2þ A4� B2þ A1� B3þ A2� B3þ A3� B3þ A4� B3þ A1� B4þ A2� B4þ A3� B4þ A4� B4
ð5:5Þ
If events both A1 and B1 occur, the system fails. Similarly, this is valid for anyother double minimal cut sets, e.g., event A2 occurs and event B1 occurs, alltogether 16 double minimal cut sets.
In general, the equations for representing the minimal cut sets as the result ofthe qualitative fault tree analysis are joined into the following equation.
G ¼XI
i¼1
YJ
j¼1
Bj
where G is the top event, Bj is the basic event j, J is the number of basic events in aparticular minimal cut set, and I is the number of minimal cut sets.
5.3.6 Preparation of the Probabilistic Failure Database
Preparation of the probabilistic failure database and connection of the basic eventsof the fault tree with probabilistic failure data is a prerequisite for quantitativeevaluation of the fault tree analysis [26–30]. It is necessary to assess the failureprobability of each basic event or its unavailability.
Preparation of the probabilistic failure database includes the followingactivities:
• Selection of probabilistic model• Preparation of probabilistic failure database• Link of a probabilistic model with the appropriate data from database
5.3.6.1 Selection of Probabilistic Model
Probabilistic models are developed to assess component failure probabilities [31].The variety of probabilistic models is needed, because of the different nature ofconsidered components, their functioning role in the fulfilling the success criteriaof the system operation, and their failure modes.
5.3 Fault Tree Analysis Procedure Steps 73
For example, assessment of failure probability of a switch, which has to open orclose, is surely different than the failure probability of a running pump, which hasto run for a certain time interval.
Or, for example, the failure probability is surely different for a pump, which isrunning and has to be running for 4 h than for a pump, which has to start first andthen run for 24 h. Or, for example, the failure probability is surely different forvalve that has to open for accomplishment of its mission compared with a valvethat has to remain open for accomplishment of its mission.
The simplest probabilistic model is developed for components that have tooperate on demand. Their failure probability can be assessed through the ratio ofnumber of unsuccessful operations versus the number of all operations.
p ¼ nf
nð5:6Þ
where p is the component failure probability, nf is the number of unsuccessfuloperations, and n is the number of all operations.
Or the model assumes that the number of failures has a binomial distribution.On each demand, the outcome is a failure with some probability p, and a successwith probability 1 - p. This probability p is the same for all demands. Occur-rences of failures for different demands are statistically independent, which meansthe probability of a failure on one demand is not affected by what happens on otherdemands. The total number of failures and the total number of demands areobserved as a minimum. Under these assumptions, the random number of failuresin some fixed number of demands has a binomial (n, p) distribution.
p ¼ pðkÞ ¼ PðX ¼ kÞ ¼n
k
!pkð1� pÞn�k ð5:7Þ
where X is the random number of failures, and n is the fixed number of demands.If the component is assumed to transform to the failed state while the system is
in standby, the transition occurs at a random time with a constant transition rate.The latent failed condition ensures that the system fails at the next demand, but thecondition is not discovered until the next test, the inspection or actual demand. Theprobability that the system is failed when observed at time t is calculated knowingthe failure rate and the equation.
p ¼ 1� e�kt ð5:8Þ
where k is the failure rate and t is time.The failure to run during mission requires different approach, actually two
approaches, which differ, if the failure is repairable or it is not repairable.If the failure is repairable, it does not cause directly the mission failure. The
parameters, mean time to repair or the mean time to restore, are important inaddition to the failure rate of component in operation k0 for calculation of thecomponent failure probability.
74 5 Fault Tree Analysis
p ¼ koTr
1þ koTr
ð5:9Þ
where Tr is the mean time to restore (or mean time to repair) and ko is the failurerate of component in operation.
The other option of the equation for repairable component is equation com-bining failure rate and repair rate of the component.
p ¼ kkþ l
ð5:10Þ
where l is the repair rate.If the failure is not repairable, it causes the mission failure. Specially, for
missions of a short duration, it is difficult to expect that the failure can be arepairable, so the nonrepairable model is used considering parameters standbyfailure rate and lifetime.
p ¼ 1� e�ksTpl ð5:11Þ
where Tpl is the lifetime and ks is the standby failure rate.The testing and maintenance contribute to unavailability of standby compo-
nents. The unavailability of testing is larger if the testing time is of longer durationor if the test interval is shorter.
As the definition of unavailability says, it is the probability that certain eventoccurs under certain conditions in determined time interval, this unavailability oftesting can be added to failure probability of the component to combine both torepresent the component quantification in more details.
Qt ¼Tt
Ti
ð5:12Þ
where Tt is the testing time and Ti is the test interval.Similarly, it is for scheduled maintenance, where the frequency of scheduled
maintenance per test interval, maintenance duration time and maintenance intervalare the parameters of interest.
Qsm ¼ fmTma
Tmi
ð5:13Þ
where fm is the frequency of scheduled maintenance per test interval, Tma is themaintenance duration time, and Tmi is the maintenance interval.
Similarly, it is for unscheduled repair, where the frequency of unscheduledrepair per test interval, mean time to repair and test interval are the parameters ofinterest.
Qur ¼ frTr
Ti
ð5:14Þ
where fr is the frequency of unscheduled repair per test interval.
5.3 Fault Tree Analysis Procedure Steps 75
The combinations of certain probabilistic models are possible, specially, if thetesting or maintenance is considered for standby equipment in addition to theselected probabilistic model related to failure mode.
Several other probabilistic models exist in theory and each is a function of oneor more parameters of interest. The parameters of the probabilistic model have tobe obtained from the database.
5.3.6.2 Preparation of Probabilistic Failure Database
The collection and classification of the probabilistic data are a time-demandingand complex process [29]. The data for preparation of probabilistic failure data-base can be derived from different sources, including other databases, descriptiondocuments of the plant or facility, reports, industry experience, experience ofsimilar plants or facilities, and experience of the particular plant or facility.
The collection and classification of the probabilistic data have to be oriented toobtain all required parameters that support the evaluation of the probabilisticmodels. The parameters of interest include the following: failure rate, failureprobability on demand, mission time, mean time to repair, mean time to failure,testing interval, testing duration time, maintenance interval, maintenance durationtime, frequency of scheduled maintenance per test interval, and frequency ofunscheduled repair per test interval.
The parameters of interest are selected to cover the failure modes that aredefined in the basic events of the fault tree. Those failure modes include failure tochange position, failure to remain in position, failure to close, failure to open,failure to function, short to ground, short circuit, open circuit, plugging, rupture,spurious function, failure to run, failure to start, leaking, and overheating.
The parameters of the interest are selected to cover all components that aremodeled in the fault trees, such as piping, heat exchangers, pumps, valves, strainers,filters, transformers, relays, motors, conductors, batteries and chargers, circuitbreakers, disconnect switches, power lines, power generators, sensors, instrumen-tation channels, transmitters, signal-conditioning systems, switches, and othermechanical or electrical or instrumentation equipment.
Examples of databases are in the references [26–28]. Not only the mean value ofthe required parameter is contained in the database but also the parameters ofprobability distribution can be of interest to consider the uncertainty of the data[30].
5.3.6.3 Link of a Probabilistic Model With the Appropriate Datafrom Database
When the probabilistic model for a specific basic event is selected, the relatedparameters that support this probabilistic model are linked from database to spe-cific basic event. The selection of the data for a probabilistic model enablesquantification of the failure probability of respective basic event. Figure 5.12
76 5 Fault Tree Analysis
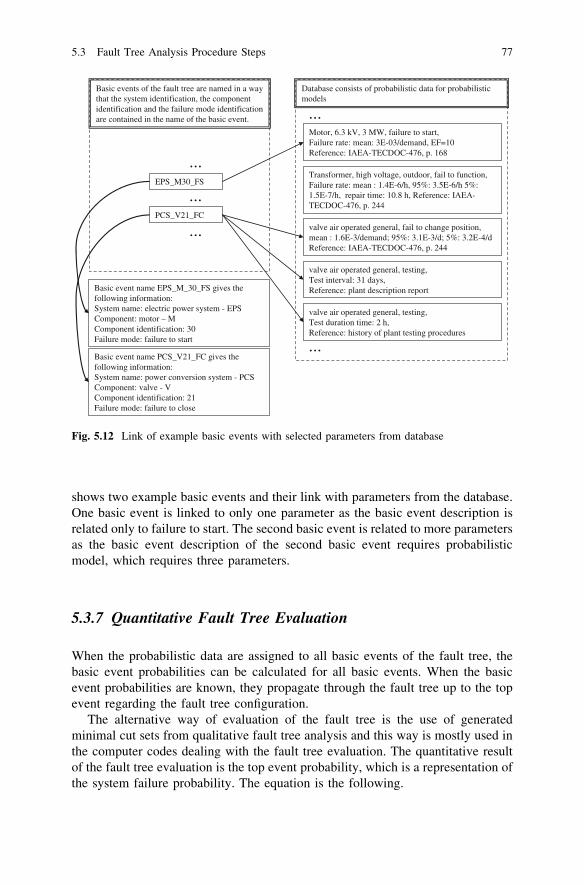
shows two example basic events and their link with parameters from the database.One basic event is linked to only one parameter as the basic event description isrelated only to failure to start. The second basic event is related to more parametersas the basic event description of the second basic event requires probabilisticmodel, which requires three parameters.
5.3.7 Quantitative Fault Tree Evaluation
When the probabilistic data are assigned to all basic events of the fault tree, thebasic event probabilities can be calculated for all basic events. When the basicevent probabilities are known, they propagate through the fault tree up to the topevent regarding the fault tree configuration.
The alternative way of evaluation of the fault tree is the use of generatedminimal cut sets from qualitative fault tree analysis and this way is mostly used inthe computer codes dealing with the fault tree evaluation. The quantitative resultof the fault tree evaluation is the top event probability, which is a representation ofthe system failure probability. The equation is the following.
Motor, 6.3 kV, 3 MW, failure to start, Failure rate: mean: 3E-03/demand, EF=10Reference: IAEA-TECDOC-476, p. 168
valve air operated general, fail to change position, mean : 1.6E-3/demand; 95%: 3.1E-3/d; 5%: 3.2E-4/dReference: IAEA-TECDOC-476, p. 244
...
PCS_V21_FC
EPS_M30_FS
...
...
Basic events of the fault tree are named in a waythat the system identification, the componentidentification and the failure mode identificationare contained in the name of the basic event.
Database consists of probabilistic data for probabilisticmodels
...
...
Basic event name EPS_M_30_FS gives thefollowing information:System name: electric power system - EPSComponent: motor – MComponent identification: 30Failure mode: failure to start
Basic event name PCS_V21_FC gives thefollowing information:System name: power conversion system - PCSComponent: valve - VComponent identification: 21Failure mode: failure to close
Transformer, high voltage, outdoor, fail to function,Failure rate: mean : 1.4E-6/h, 95%: 3.5E-6/h 5%: 1.5E-7/h, repair time: 10.8 h, Reference: IAEA-TECDOC-476, p. 244
valve air operated general, testing, Test interval: 31 days, Reference: plant description report
valve air operated general, testing, Test duration time: 2 h, Reference: history of plant testing procedures
Fig. 5.12 Link of example basic events with selected parameters from database
5.3 Fault Tree Analysis Procedure Steps 77
PTOP ¼Xn
i¼1
PMCSi �X
i\j
PMCSi\MCSj
þX
i\j\k
PMCSi\MCSj\MCSk � � � � þ ð�1Þm�1P\m
i¼1
MCSi
ð5:15Þ
where PTOP is the top event probability of the fault tree, PMCSi is the probability ofoccurrence of minimal cut set i (MCSi), n is the number of minimal cut sets, andm is the number of basic events in the largest minimal cut set.
PMCSi ¼ PB1 � PB2 PB1j � PB3 PB1 \ PB2 � � � � � PBm PB1 \ PB2 \ � � � \ PBm�1jjð5:16Þ
Parameters PB1, PB2, . . . , PBn, represent the failure probabilities of basic eventsB1, B2, . . . , Bn, respectively. The probabilities of basic events are calculated foreach basic event using the selected probabilistic model.
Under the assumption that the basic events are mutually independent, the fol-lowing equation stands.
PMCSi ¼Ym
j¼1
PBj ð5:17Þ
Failure probability of each basic event is a function of respective parametersfrom the selected probabilistic model. The general equation for all probabilisticmodels is represented by the following equation, where the failure probability ofthe respective basic event is a function of only certain parameters, which areconnected with the respective probabilistic model.
PBj ¼ PBjðkBj; pBj; TiBj; TtBj; TmBj; TrBj; gBjÞ ð5:18Þ
where kBj is the failure rate of equipment modeled in basic event Bj, pBj is theprobability per demand of equipment modeled in basic event Bj, TiBj is the testinterval of equipment modeled in basic event Bj, TtBj is the test duration ofequipment modeled in basic event Bj, TmBj is the mission time of equipmentmodeled in basic event Bj, TrBj is the repair time of equipment modeled in basicevent Bj, and lBj is the repair rate of equipment modeled in basic event Bj.
As the equation representing the evaluation of the fault tree from the use ofminimal cut sets may be too complex for larger fault trees, its simplified versionmay be used, which considers only a selected number of summands, e.g., three, forexample:
PTOP ¼Xn
i¼1
PMCSi �X
i\j
PMCSi\MCSj þX
i\j\k
PMCSi\MCSj\MCSk ð5:19Þ
Sometimes, a consideration of only the first summand is sufficient, specially, ifwe bear in mind that the conservative value is given with such a simplification.
78 5 Fault Tree Analysis
Such approximation is called the first-order approximation. For PMCSi less than0.1, the approximate results stay in 10% of accuracy in the conservative side[4, 5, 14].
PTOP ¼Xn
i¼1
PMCSi ð5:20Þ
If for the example system from Fig. 5.11 the failure probabilities of all com-ponents equal to 1E-2, then the quantification of the top event probability gives thesystem failure probability of 0.148.
PTOP ¼X16
i¼1
10�2 � 10�2 �X15þ14þ���þ1
1
10�2 � 10�2 � 10�2 � 10�2
¼ 0:16� 0:012 ¼ 0:148 ð5:21Þ
The quantitative results include the importance factors in addition [32]. Theimportance factors include Fussel–Vesely importance, risk achievement worth,risk reduction worth, Birnbaum importance, criticality importance, and differentialimportance measure. The various importance measures are based on slightly dif-ferent interpretations of the concept of component importance. In general, theimportance of a component within a system depends on the location of thecomponent in the system, onthe reliability of the component, and the reliability ofthe system. The importance measures can be quantified for each of the basicevents, if the interest about specific component is important, or for the groups ofbasic events, if the group of the components is important.
5.3.7.1 Fussel–Vesely Importance
Fussel–Vesely importance shows the contribution of the event to the top eventprobability. It provides a numerical significance of all the events as parts of thefault tree and allows them to be prioritized. It is calculated according to thefollowing equation.
FVk ¼ 1� PTOPðPk ¼ 0ÞPTOP
¼ 1� 1RRWk
ð5:22Þ
where FVk is the Fussel–Vesely importance for component modeled in basic eventk, PTOP is the top event probability, PTOP (Pk = 0) is the top event probabilitywhen failure probability of component modeled in basic event k is set to 0, andRRWk is the risk reduction worth for component k.
For the example system from Fig. 5.11, the Fussel–Vesely is calculated for theevent A1 knowing that PTOP(Pk = 0) is calculated from 12 minimal cut setswithout 4 minimal cut sets, which equal 0, because they contain PA1 = 0.
5.3 Fault Tree Analysis Procedure Steps 79
PTOPðPk ¼ 0Þ ¼X12
i¼1
10�2 � 10�2 �X11þ10þ���þ1
1
10�2 � 10�2 � 10�2 � 10�2
¼ 0:12� 0:0066 ¼ 0:1134 ð5:23Þ
FVk ¼ 1� PTOPðPk ¼ 0ÞPTOP
¼ 1� 0:11340:148
¼ 0:234 ð5:24Þ
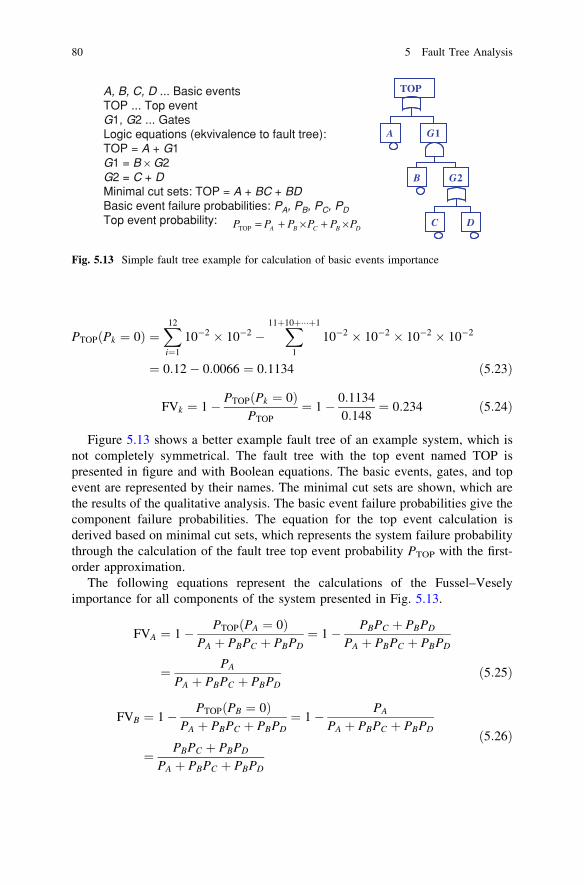
Figure 5.13 shows a better example fault tree of an example system, which isnot completely symmetrical. The fault tree with the top event named TOP ispresented in figure and with Boolean equations. The basic events, gates, and topevent are represented by their names. The minimal cut sets are shown, which arethe results of the qualitative analysis. The basic event failure probabilities give thecomponent failure probabilities. The equation for the top event calculation isderived based on minimal cut sets, which represents the system failure probabilitythrough the calculation of the fault tree top event probability PTOP with the first-order approximation.
The following equations represent the calculations of the Fussel–Veselyimportance for all components of the system presented in Fig. 5.13.
FVA ¼ 1� PTOPðPA ¼ 0ÞPA þ PBPC þ PBPD
¼ 1� PBPC þ PBPD
PA þ PBPC þ PBPD
¼ PA
PA þ PBPC þ PBPDð5:25Þ
FVB ¼ 1� PTOPðPB ¼ 0ÞPA þ PBPC þ PBPD
¼ 1� PA
PA þ PBPC þ PBPD
¼ PBPC þ PBPD
PA þ PBPC þ PBPD
ð5:26Þ
2
TOP
B
C D
A
G
G1
A, B, C, D ... Basic eventsTOP ... Top eventG1, G2 ... GatesLogic equations (ekvivalence to fault tree):TOP = A + G1G1 = B × G2G2 = C + DMinimal cut sets: TOP = A + BC + BDBasic event failure probabilities: PA, PB, PC, PDTop event probability:
DBCBATOP P×PP×PPP ++=
Fig. 5.13 Simple fault tree example for calculation of basic events importance
80 5 Fault Tree Analysis
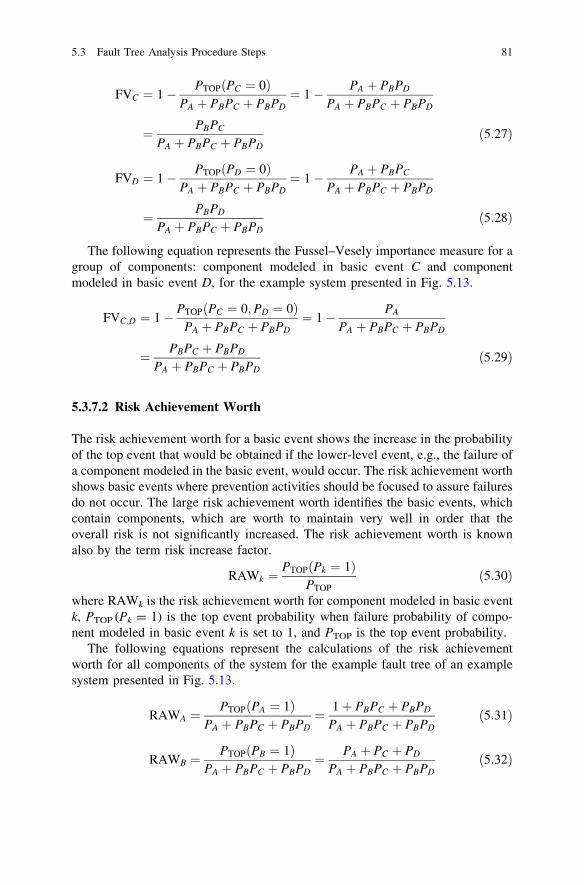
FVC ¼ 1� PTOPðPC ¼ 0ÞPA þ PBPC þ PBPD
¼ 1� PA þ PBPD
PA þ PBPC þ PBPD
¼ PBPC
PA þ PBPC þ PBPDð5:27Þ
FVD ¼ 1� PTOPðPD ¼ 0ÞPA þ PBPC þ PBPD
¼ 1� PA þ PBPC
PA þ PBPC þ PBPD
¼ PBPD
PA þ PBPC þ PBPDð5:28Þ
The following equation represents the Fussel–Vesely importance measure for agroup of components: component modeled in basic event C and componentmodeled in basic event D, for the example system presented in Fig. 5.13.
FVC;D ¼ 1� PTOPðPC ¼ 0;PD ¼ 0ÞPA þ PBPC þ PBPD
¼ 1� PA
PA þ PBPC þ PBPD
¼ PBPC þ PBPD
PA þ PBPC þ PBPDð5:29Þ
5.3.7.2 Risk Achievement Worth
The risk achievement worth for a basic event shows the increase in the probabilityof the top event that would be obtained if the lower-level event, e.g., the failure ofa component modeled in the basic event, would occur. The risk achievement worthshows basic events where prevention activities should be focused to assure failuresdo not occur. The large risk achievement worth identifies the basic events, whichcontain components, which are worth to maintain very well in order that theoverall risk is not significantly increased. The risk achievement worth is knownalso by the term risk increase factor.
RAWk ¼PTOPðPk ¼ 1Þ
PTOP
ð5:30Þ
where RAWk is the risk achievement worth for component modeled in basic eventk, PTOP (Pk = 1) is the top event probability when failure probability of compo-nent modeled in basic event k is set to 1, and PTOP is the top event probability.
The following equations represent the calculations of the risk achievementworth for all components of the system for the example fault tree of an examplesystem presented in Fig. 5.13.
RAWA ¼PTOPðPA ¼ 1Þ
PA þ PBPC þ PBPD¼ 1þ PBPC þ PBPD
PA þ PBPC þ PBPDð5:31Þ
RAWB ¼PTOPðPB ¼ 1Þ
PA þ PBPC þ PBPD¼ PA þ PC þ PD
PA þ PBPC þ PBPDð5:32Þ
5.3 Fault Tree Analysis Procedure Steps 81
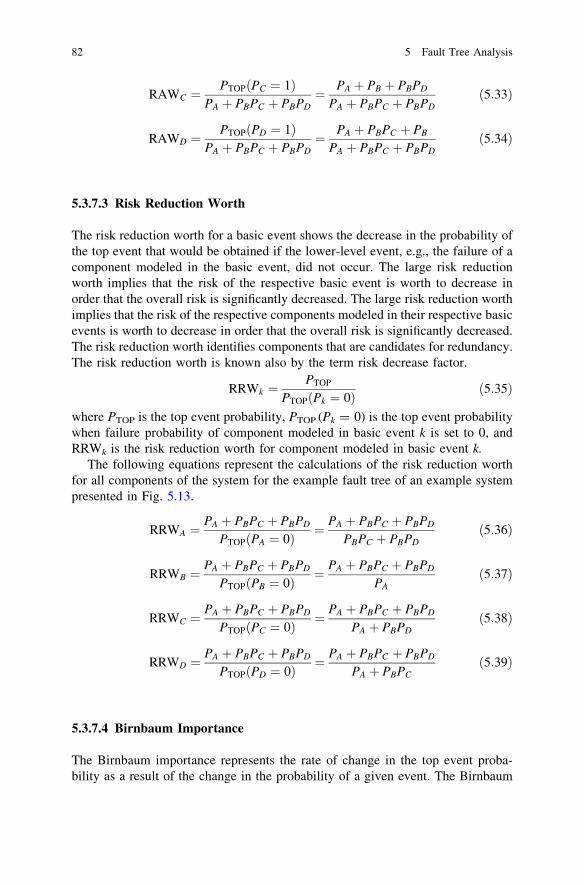
RAWC ¼PTOPðPC ¼ 1Þ
PA þ PBPC þ PBPD¼ PA þ PB þ PBPD
PA þ PBPC þ PBPDð5:33Þ
RAWD ¼PTOPðPD ¼ 1Þ
PA þ PBPC þ PBPD¼ PA þ PBPC þ PB
PA þ PBPC þ PBPDð5:34Þ
5.3.7.3 Risk Reduction Worth
The risk reduction worth for a basic event shows the decrease in the probability ofthe top event that would be obtained if the lower-level event, e.g., the failure of acomponent modeled in the basic event, did not occur. The large risk reductionworth implies that the risk of the respective basic event is worth to decrease inorder that the overall risk is significantly decreased. The large risk reduction worthimplies that the risk of the respective components modeled in their respective basicevents is worth to decrease in order that the overall risk is significantly decreased.The risk reduction worth identifies components that are candidates for redundancy.The risk reduction worth is known also by the term risk decrease factor.
RRWk ¼PTOP
PTOPðPk ¼ 0Þ ð5:35Þ
where PTOP is the top event probability, PTOP (Pk = 0) is the top event probabilitywhen failure probability of component modeled in basic event k is set to 0, andRRWk is the risk reduction worth for component modeled in basic event k.
The following equations represent the calculations of the risk reduction worthfor all components of the system for the example fault tree of an example systempresented in Fig. 5.13.
RRWA ¼PA þ PBPC þ PBPD
PTOPðPA ¼ 0Þ ¼ PA þ PBPC þ PBPD
PBPC þ PBPDð5:36Þ
RRWB ¼PA þ PBPC þ PBPD
PTOPðPB ¼ 0Þ ¼ PA þ PBPC þ PBPD
PAð5:37Þ
RRWC ¼PA þ PBPC þ PBPD
PTOPðPC ¼ 0Þ ¼ PA þ PBPC þ PBPD
PA þ PBPDð5:38Þ
RRWD ¼PA þ PBPC þ PBPD
PTOPðPD ¼ 0Þ ¼ PA þ PBPC þ PBPD
PA þ PBPCð5:39Þ
5.3.7.4 Birnbaum Importance
The Birnbaum importance represents the rate of change in the top event proba-bility as a result of the change in the probability of a given event. The Birnbaum
82 5 Fault Tree Analysis
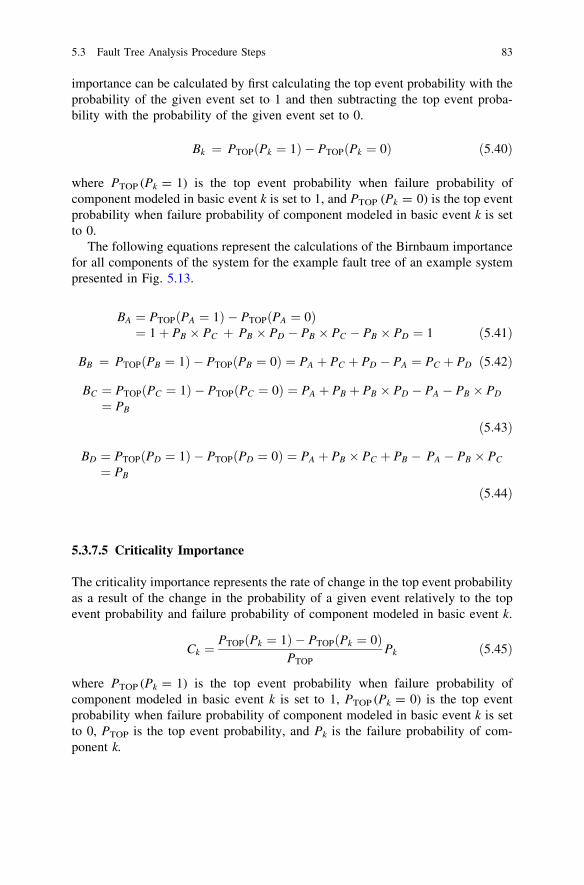
importance can be calculated by first calculating the top event probability with theprobability of the given event set to 1 and then subtracting the top event proba-bility with the probability of the given event set to 0.
Bk ¼ PTOP Pk ¼ 1ð Þ � PTOP Pk ¼ 0ð Þ ð5:40Þ
where PTOP (Pk = 1) is the top event probability when failure probability ofcomponent modeled in basic event k is set to 1, and PTOP (Pk = 0) is the top eventprobability when failure probability of component modeled in basic event k is setto 0.
The following equations represent the calculations of the Birnbaum importancefor all components of the system for the example fault tree of an example systempresented in Fig. 5.13.
BA ¼ PTOPðPA ¼ 1Þ � PTOPðPA ¼ 0Þ¼ 1þ PB � PC þ PB � PD � PB � PC � PB � PD ¼ 1 ð5:41Þ
BB ¼ PTOPðPB ¼ 1Þ � PTOPðPB ¼ 0Þ ¼ PA þ PC þ PD � PA ¼ PC þ PD ð5:42Þ
BC ¼ PTOPðPC ¼ 1Þ � PTOPðPC ¼ 0Þ ¼ PA þ PB þ PB � PD � PA � PB � PD
¼ PB
ð5:43Þ
BD ¼ PTOPðPD ¼ 1Þ � PTOPðPD ¼ 0Þ ¼ PA þ PB � PC þ PB � PA � PB � PC
¼ PB
ð5:44Þ
5.3.7.5 Criticality Importance
The criticality importance represents the rate of change in the top event probabilityas a result of the change in the probability of a given event relatively to the topevent probability and failure probability of component modeled in basic event k.
Ck ¼PTOPðPk ¼ 1Þ � PTOPðPk ¼ 0Þ
PTOP
Pk ð5:45Þ
where PTOP (Pk = 1) is the top event probability when failure probability ofcomponent modeled in basic event k is set to 1, PTOP (Pk = 0) is the top eventprobability when failure probability of component modeled in basic event k is setto 0, PTOP is the top event probability, and Pk is the failure probability of com-ponent k.
5.3 Fault Tree Analysis Procedure Steps 83
5.3.7.6 Differential Importance Measure
Differential importance measure is in more details presented in reference [33].
5.3.8 Interpretation of the Fault Tree Analysis Results
The interpretation of the fault tree analysis results is a phase where the qualitativeand quantitative results of the fault tree analysis are considered together with theassumptions and limitations of the analysis, with the boundary conditions of theanalysis and the resolution of modeling. It is a phase where the sensitivity anduncertainty of the results are evaluated before the final conclusions, of what theresults show, are made.
5.4 Applications of the Fault Tree Analysis
Applications of the fault tree analysis are numerous. Only a small number ofselected applications are mentioned:
• Reliability studies of safety systems in nuclear and air and space industry[5, 13, 16, 21]
• Optimization of preventive maintenance in nuclear power plants• Vulnerability studies [34, 35]• Safety software quality improvement [36–38]
The methods for optimization of preventive maintenance in a large extentconsider the standby safety equipment, because the majority of the safety systemsin nuclear power plants are in standby. The methods include:
• Optimization of surveillance-testing intervals [39–43]• Optimization of scheduling of testing and maintenance activities [42, 44]• Optimization of testing strategies [45, 46]• Optimization of allowed outage times [46, 47]
Common to optimization ideas and their implementations is a fact that theproblems are becoming larger and larger, because the new methods and bettercomputers in present time allow modeling of processes and properties, which werenot considered in the past.
The bottleneck of maintenance optimization methods and their applications laysin difficulty of appropriate modeling of all positive and all negative aspects ofmaintenance in the probabilistic models, which are consequently used in optimi-zation methods.
The number of papers about fault tree analysis in scientific literature shows thatits importance is increasing through the years [48–80].
84 5 Fault Tree Analysis
References
1. ASME RA-S-2002 (2002) Standard for probabilistic risk assessment for nuclear power plantapplications, addendum (2005). ASME
2. RA-S-2008 (2008) Standard for level 1/large early release frequency probabilistic riskassessment for nuclear power plant applications. ASME
3. IEC 61025 (2006) Fault tree analysis (FTA). IEC4. Roberts NH, Vesely WE, Haasl D, Goldberg FF (1981) Fault tree handbook, NUREG-0492.
NRC, Washington5. Vesely W, Dugan J, Fragola J et al (2002) Fault tree handbook with aerospace applications.
National Aeronautics and Space Administration6. Kumamoto H, Henley EJ (1996) Probabilistic risk assessment and management for engineers
and scientists. IEEE, New York7. Villemeur A (1992) Reliability, availability, maintainability and safety assessment: methods
and techniques. Wiley, New York8. No 50-P-8 (1995) Procedures for conduction probabilistic safety assessments of nuclear
power plants (level 2), Safety Series. IAEA9. No 50-P-12 (1996) Procedures for conduction probabilistic safety assessments of nuclear
power plants (level 3), Safety Series. IAEA10. No 50-P-12 (1996) Procedures for conduction probabilistic safety assessments of nuclear
power plants (level 3), Safety Series. IAEA11. Probabilistic risk assessment procedures guide (1982) NUREG/CR-2300, NRC12. Probabilistic safety analysis procedures guide (1985) NUREG/CR-2815, NRC13. PRA NASA Guide (2002) Probabilistic risk assessment procedures guide for NASA
managers and practitioners. NASA14. Cepin M (2005) Analysis of truncation limit in probabilistic safety assessment. Rel Eng Syst
Saf 87(3):395–40315. Interim reliability evaluation program procedures guide (1983) NUREG/CR-2728, NRC16. Analysis of core damage frequency (1990) NUREG/CR-4550, NRC17. WASH-1400 (1975) Reactor safety study: an assessment of accident risks in US commercial
nuclear power plants, NRC18. WASH-740 (1957) Theoretical possibilities and consequences of major accidents in large
nuclear power plants (The Brookhaven Report), AEC19. German Risk Study (1979) Deutsche Risikostudie Kernkraftwerke, GRS, FRG20. Brisbois J, Lanore JM, Villemeur A et al (1990) Les etudes probabilistes de surete des
centrales nucleaires francaises de 900 et 1300 MWe21. Severe accident risks: an assessment for five US nuclear power plants (1989) NUREG/CR-
1150, NRC22. Swaminathan S, Smidts C (1999) The mathematical formulation for the event sequence
diagram framework. Rel Eng Syst Saf 65:103–11823. Papazoglou IA (1998) Mathematical foundations of event trees. Rel Eng Syst Saf 61:169–18324. Cepin M, Mavko B (2002) A dynamic fault tree. Rel Eng Syst Saf 75(1):83–9125. Vrbanic I, Kaštelan M (1997) Optimization of NPP Krško PSA model structure by the
employment of house events. Nuclear Energy in Central Europe, Proceedings, pp 414–42126. IEEE Standard 500 (1984) IEEE Guide to the collection and presentation of electrical,
electronic, sensing component, and mechanical equipment reliability data for nuclear-powergenerating stations, appendix D. Reliability Data for Nuclear-Power Generating Stations,IEEE
27. T-book: reliability data of components in nordic nuclear power plants (2000) Villingby,Sweden TUD Office and Pörn Consulting
28. T-Book (1992), ATV29. IAEA-TECDOC-478 (1988) Component reliability data for use in probabilistic safety
assessment. IAEA
References 85
30. Jordan Cizelj R, Mavko B, Kljenak I (2001) Component reliability assessment usingquantitative and qualitative data. Rel Eng Syst Saf 71:81–95
31. Atwood CL, La Chance JL, Martz HF et al (2003) Handbook of parameter estimation forprobabilistic risk assessment (NUREG/CR-6823). NRC
32. Measures of risk importance and their applications (1983) NUREG/CR-3385, NRC33. Borgonovo E, Apostolakis GE (2001) A new importance measure for risk-informed decision
making. Rel Eng Syst Saf 72:193–21234. Cepin M (2010) Applications of the fault tree analysis for vulnerability studies (Chapter 8).
In: Lesage A, Tondreau J (eds) Nuclear fuels: manufacturing processes, forms, and safety.Nova, New York
35. Cepin M, Cizelj L, Leskovar M, Mavko B (2006) Vulnerability analysis of a nuclear powerplant considering detonations of explosive devices. J Nucl Sci Tech 43(10):1258–1269
36. Muthukumar CT, Guarro SB, Apostolakis G (1994) Dependability of embedded softwaresystems, reliability and safety assessment of dynamic process systems. In: Aldemir T, Siu NS,Mosleh A, Cacciabue PC, Goktepe BG (eds) NATO ASI series F. Springer Verlag, Heidelberg,pp 59–77
37. Cepin M, Mavko B (1999) Fault tree developed by an object-based method improvesrequirements specification for safety-related systems. Rel Eng Syst Saf 63:111–125
38. Garrett J, Guarro SB, Apostolakis GE (1995) The dynamic flowgraph methodology forassessing the dependability of embedded software systems. IEEE Trans Syst Man Cybern25(5):824–840
39. Vaurio JK (1995) Optimization of test and maintenance intervals based on risk and cost. RelEng Syst Saf 49:23–36
40. Cepin M, Mavko B (1997) Probabilistic safety assessment improves surveillancerequirements in technical specifications. Rel Eng Syst Saf 56:69–77
41. Martorell S, Carlos S, Sanchez A, Serradell V (2000) Constrained optimization of testintervals using a steady-state genetic algorithm. Rel Eng Syst Saf 67:215–232
42. Cepin M (2002) Optimization of safety equipment outages improves safety. Rel Eng Syst Saf77:71–80
43. Yang JE, Sung TY, Yin Y (2000) Optimization of the surveillance test interval of the safetysystems at the plant level. Nucl Tech 132:352–365
44. Harunuzzaman M, Aldemir T (1996) Optimization of standby safety system maintenanceschedules in nuclear power plants. Nucl Tech 113:354–367
45. Cepin M, Gomez Cobo A, Martorell S et al (1999) Methods for testing and maintenance ofsafety related equipment: examples from an IAEA research project. In: Proceedings ofESREL99: safety and reliability, pp 247–251
46. IAEA-TECDOC-669 (1992) Case study on the use of PSA methods: assessment of technicalspecifications for the reactor protection system instrumentation. IAEA, Vienna
47. Cepin M, Martorell S (2002) Evaluation of allowed outage time considering a set of plantconfigurations. Rel Eng Syst Saf 78:259–266
48. Siu N (1994) Risk assessment for dynamic systems: an overview. Rel Eng Syst Saf 43:43–7349. Ren Y, Dugan JB (1998) Optimal design of reliable systems using static and dynamic fault
trees. IEEE Trans Rel 234–24450. Dugan JB (1991) Automated analysis of phased-mission reliability. IEEE Trans Rel
40(1):45–5251. Dugan JB, Lyu MR (1994) System reliability analysis of an N-version programming
application. IEEE Trans Rel 43(4):513–51952. Burdick GR, Fussel JB, Rasmuson DM, Wilson JR (1977) Phased mission analysis: a review
of new developments and an application. IEEE Trans Rel R 26(1):43–4953. Modarres M, Cheon SW (1999) Function-centered modeling of engineering systems using
the goal-success tree technique and functional primitives. Rel Eng Syst Saf 64:181–20054. Hu YS, Modarres M (1999) Evaluating system behavior through dynamic master logic
diagram modeling. Rel Eng Syst Saf 64:241–269
86 5 Fault Tree Analysis
55. Matsuoka T, Kobayashi M (1988) GO-FLOW: a new reliability analysis methodology. NuclSci Eng 98:64–78
56. Farmer F (1967) Reactor safety and siting: a proposed risk criterion. Nucl Saf 8:539–54857. Apostolakis GE (2004) How useful is quantitative risk assessment? Risk Anal 24:515–52058. Berg HP, Gortz R, Schimetschka E (2003) Quantitative probabilistic safety criteria for
licensing and operation of nuclear plants. BFS-SK-03/03, BFS59. Cepin M (2007) The risk criteria for assessment of temporary changes in a nuclear power
plant. Risk Anal 27(4):991–99860. Caruso MA, Cheok MC, Cunningham MA et al (1999) An approach for using risk assessment
in risk-informed decisions on plant-specific changes to the licensing basis. Rel Eng Syst Saf63:231–242
61. Use of probabilistic risk assessment methods in nuclear activities: final policy statement(1995) Federal Register, NRC
62. Individual plant examination for severe accident vulnerabilities-10CFR 50.54(f) (1988)Generic Letter, GL 88-20, NRC
63. Criteria for the performance of probabilistic safety assessment applications (2002) GS-1.14,CSN
64. Safety assessment principles for nuclear plants (1992) Health & Safety Executive, London65. RG 1.174 (2002) An approach for using probabilistic risk assessment in risk-informed
decisions on plant-specific changes to the licensing basis, NRC66. RG 1.177 (1998) An approach for plant-specific, risk-informed decision making: technical
specifications, NRC67. RG 1.200 (2007) An approach for determining the technical adequacy of probabilistic risk
assessment results for risk-informed activities, NRC68. RG 1.201 (2006) Guidelines for categorizing structures, systems, and components in nuclear
power plants according to their safety significance, NRC69. Probabilistic safety assessment (PSA) for nuclear power plants, regulatory standard (2005)
S-294, Canadian Nuclear Safety Commission70. Probabilistic safety analysis in safety management of nuclear power plants (2003) YVL-2.8,
STUK71. Holmberg J, Puikkinen U, Rosquist T, Simola K (2001) Decision criteria in PSA applications.
NKS-4472. Samanta P, Kim IS, Mankamo T, Vesely WE (1995) Handbook of methods for risk-based
analyses of technical specifications (NUREG/CR-6141). NRC73. TR-105396 (1995) PSA applications guide. Electric Power Research Institute74. Martorell S, Carlos S, Villanueva JF, Sánchez AI et al (2006) Use of multiple objective
evolutionary algorithms in optimizing surveillance requirements. Rel Eng Syst Saf91(9):1027–1038
75. Keller W, Modarres M (2005) A Historical overview of probabilistic risk assessmentdevelopment and its use in the nuclear power industry: a tribute to the late Professor NormanCarl Rasmussen. Rel Eng Syst Saf 89(3):271–285
76. NUREG/CR-1278 (1983) Handbook for human reliability analysis with emphasis on nuclearpower plants application. NRC
77. Cepin M (2008) DEPEND-HRA: a method for consideration of dependency in humanreliability analysis. Rel Eng Syst Saf 93(10):1452–1460
78. Cepin M (2007) Importance of human contribution within the human reliability analysis (IJS-HRA). J Loss Prev Proc Ind 21(3):268–276
79. Prošek A, Cepin M (2008) Success criteria time windows of operator actions using RELAP5/MOD33 within human reliability analysis. J Loss Prev Proc Ind 21(3):260–267
80. Volkanovski A, Cepin M, Mavko B (2009) Application of the fault tree analysis forassessment of power system reliability. Rel Eng Syst Saf 94(6):1116–1127
References 87