Embed Size (px)
DESCRIPTION
process parameters
Citation preview
International Conference on Innovative Applications of Computational Intelligence on Power, Energy and Controls with theirImpact on Humanity (CIPECH14) 28 & 29 November 2014
Assessment of Process Parameter to Improving power Plant Performance
Balaram saha1 Department of Electrical
Engineering, Indian school of mines Dhanbad
Vivek patel2 Department of Electrical
Engineering, Indian school of mines Dhanbad
Kalyan chaterjee3 Department of Electrical
Engineering, Indian school of mines Dhanbad
Abstract—This paper proposes an assessment of the
operational parameters of a thermal power plant to promote effectively & efficient running of the machine while ensuring a degree of compliance with statutory regulations. This study aims to identify the operational gaps associated with running operational parameter in power plant process. It is focused to detect a different thermodynamic variable involved, being multivariate and automatic. For variation of each one of this operational parameters, performance calculations are carried out to configure a database of energy variation. The variable data sets now can be used as assessment criteria based on detecting deviations from a reference system that has been updated during plant-performance tests. Although the most important outcome is the highly precise and valuable information that will be obtained on the live operating mode, leading to ahead improvements in the cycle efficiency and achieved in the overall control system of the thermal plant. The main aim is to detect any abnormality, reacting as quickly as possible to return the plant to a normal operation mode at best efficient manner.
Keywords: Heat Rate, Steam Temperature, Thermal efficiency
I. INTRODUCTION Generation of electricity is a very complex process involving many sub-processes and has multiple critical parameters. A Higher load factor usually means more output and a lower cost per unit. So the power plant performance is very important for having higher PLF. Major concerns for a station’s performance are Thermal efficiency factors, maintenance loss, plant load factors (PLF), forced outages and plant availability factor. A fall in thermal efficiency leads to a higher cost of electricity generation due to more fuel usage and will also result in much higher Carbon footprints.so, it is very important to stress on the performance of thermal power plants. The performance of a thermal power plant can be expressed through some critical performance factors such as: • Heat rate (energy efficiency) • Thermal efficiency • Capacity factor • Load factor • Economic efficiency • Operational efficiency
So to optimise the performance, losses must be optimised. Efficient operation of the thermal unit is very critical due to cost and reliability factors. The cost implication due to a rise in
the heat rate, make-up water consumption, oil consumption, condensed back pressure, excess air etc., indicate the urgent need to control these parameters within the designed ratings.
Efficient operation of power plants has always been important to utilities. The heat rate of a Coal fired power plant is a measure of how efficiently it converts the chemical energy contained in the fuel into electrical energy [1]. In each of these sub-processes, some amount of energy is lost to the environment. Some of the fuel is not burned perfectly, some of the energy is lost out through the stack and also rejected to the cooling tower, some of the kinetic energy and mechanical energy produce heat instead of electricity, and finally, some of the electricity that is produced is used by these sub-processes. The heat rate of a thermal power plant is the amount of chemical energy in the coal that must be supplied to produce one unit of electrical energy. Heat rate is expressed in kcal/kWh. If a power plant is able to convert 100% of the chemical energy in the fuel into electricity, the thermal plant would have a heat rate of 860 kcal/kWh. Unfortunately, due to the losses described above, a modern conventional power plant might have at best a design full load heat rate of the order of 2200 kcal/kWh, which is about 39% efficient.
Heat rate monitoring is focused on identifying heat rate gaps and then identifying and implementing corrective actions to eliminate the efficiency loss. In this approach, heat rate deviations from expected or design levels are identified and quantified.
II. HEAT RATE IMPROVEMENT ACTIVITIES: There are many areas where heat rate improvements are
possible at many plants. Most of these improvements require little effort and expense. These areas are typical opportunities for improving efficiency, reducing maintenance, and obtaining other additional benefits.
Heat Rate of the plant can be improved by improving the following areas.
• Improved Condenser Cleanliness
• Arresting Condenser Air In-leakage
• Improved Cycle Isolation: Arresting the high temp steam & water leakages / drains from any system.
• Milling System: Maintain Optimum air flow, Mill O/L temp, fineness etc.
441c©2014 CIPECH14.

• Optimised Furnace O2 Operation
• Arresting attemperation Valves Passing
• Instrument Calibration for accurate results & readings.
• Maintains Boiler Cleanliness
• Flue Gas Analysis: Maintain High Excess Air in the prescribe limits.
• Reduction of High Exit Gas Temperature
• Maintain HP/IP/LP Efficiency at design value.
• Maintain HP Heater Performance
• Maintain CT High Cold Water Temperature
• Installation of Variable Speed Drives for Major Auxiliaries
The fig:1 shows the basic process of thermal power plant[3].The utilities worldwide strives to operate their power stations at best achievable / design efficiency level. It is also
Fig. 1. Thermal Power Plant Cycle
a hard fact that with the passage of time, degradation sets in various equipment and as a result plant’s efficiency deteriorates. We require correct assessment of degradation, their impact on unit efficiency (and in turn cost) and generation of appropriate corrective action for restoration of efficiency. Normally, some key operating parameters and some performance indices are required to monitor performance. The process of equipment and system modelling and analysis of the shortfall in efficiency of individual component and their impact on the heat rate has become very important in the utilities. Now in this paper we will discuss about the some key performance parameter improvement which will affect the Heat Rate improvement thus reduce the cost. Heat rate monitoring is focused on identifying heat rate gaps and then identifying and implementing corrective actions to eliminate the efficiency loss. In this approach, heat rate deviations from expected or design levels are identified and quantified.
Station Heat Rate (SHR) is an important factor to assess the Efficiency of a thermal power station. Efficiency of thermal
power station (TPS) is a function of station heat rate and it is inversely proportional to SHR. Station heat rate improvement also helps in reducing pollution from thermal power stations.
TABLE I. ALL INDIA STATION HEAT RATE(SOURCE:CEA)
Year Design SHR Operating SHR %
Deviation 2003-04 2407 2762 15
2004-05 2397 2788 16
2005-06 2398 2747 14.57
2006-07 2398 2861 19.31 2007-08 2377 2703 13.76
2008-09 2348 2618 11.51
442 2014 Innovative Applications of Computational Intelligence on Power, Energy and Controls with their impact on Humanity (CIPECH)

In this way, Performance Evaluation Division of CEA had
devised a Performa to monitor the various parameters of efficiency of thermal power stations. On monitoring, the data of station heat rate parameters had been received from 67 TPS during the year 2008-2009. The data on the operating station heat rate(SHR) parameters so received have been compiled & analysed for instituting an incentive scheme on Improved Station Heat Rate (SHR) and have been compared with design SHR of the thermal power station. All the stations analysed have used coal as the primary fuel to generate power and oil as secondary fuel for starting purposes. The analysis has been carried out on the station basis. The Station may comprise of any size of units.
III. PROBLEM FORMULATION/DESCRIPTION A fossil fuelled power station is a collection of
subsystems. Poor performance in one subsystem affects the rest because of the close interrelationship between them. The knock on effect of off design performance in one subsystem can seriously affect the overall plant economics. The costs of the plant occur as operations and Maintenance (0 & M) expenses, capital expenses or lost revenue from reduced plant Output.
While 0&M costs are unavoidable and are therefore budgeted items, poor system performance can quickly consume a “reasonable” budget and lead to major over runs. The same is true of unanticipated capital expenses. Poor combustion results in unburned fuel and an increased Heat Rate (HR). Thus the amount of fuel energy (Kcal) required to generate one kilowatt hour of saleable electrical energy is increased. Such increases in HR have the immediate effect of raising fuel costs and are generally indicative of other performance problems.
Normally, some key operating parameters are affecting the overall performance of Boiler & Turbine, Thus affecting the Heat Rate. So it is important to operate the unit closer to design parameter.
Now we will discuss the effect of temperature at different areas of Steam & Flue gas cycle to improve the plant performance.
• Effect of Main Steam Temperature:
• Effect of RH- Temperature.
• Effect of RH spray flow:
• Feed water Temperature
• Flue gas exit temperature.
Generally thermal power plant works on principle of the Rankine Cycle shown in Fig. 2[5]The cycle consists of four processes: (1-2) Isentropic compression on pump; (2-3) Constant pressure heat addition in a boiler; (3-4) Isentropic expansion in a turbine; (4-1) Constant pressure heat rejection in a condenser. To improve this cycle some factors
Can be considered like lowering the condenser pressure, superheating the steam to high temperatures, increasing the boiler pressure, reheating Rankine cycle or by using
regenerative Rankine cycle where feed water is heated by extracted steam from the turbine.
Fig. 2. Rankine cycle (T-S Diagram)
A. Effect of main Steam inlet temperature: Enthalpy of steam is a function of pressure and temperature. At lower Temperature, enthalpy will be lower, than work done by the turbine will be low, so turbine efficiency will be low, and hence steam consumption for the required output will be higher.
1) Turbine Efficiency-Calculation Turbine Actual Enthalpy drop Efficiency (%) = --------------------------- X 100 Isentropic Enthalpy drop
hin – hout = ---------------- X 100 hin – hisen Where hin = Enthalpy of Steam at Cylinder Inlet conditions hout = Enthalpy Steam at Cylinder Outlet conditions hisen = Isentropic Enthalpy Main steam temperature before Emergency Stop Valve - day average of 24 hrs of all the available temperature points located before ESV is to be taken for calculation. This average value of temperature is to be compared with expected temperature. (Expected temperature = Design Temperature). The difference will be taken for Heat rate deviation calculation based on customized correction curves. [Customized correction curves are given by OEM to be used].
Sample calculation (Column wise w.r.t Daily HR Deviation Report)
Design M.S Temperature = 537 0C
Expected M.S Temperature = 537 0C
2014 Innovative Applications of Computational Intelligence on Power, Energy and Controls with their impact on Humanity (CIPECH) 443
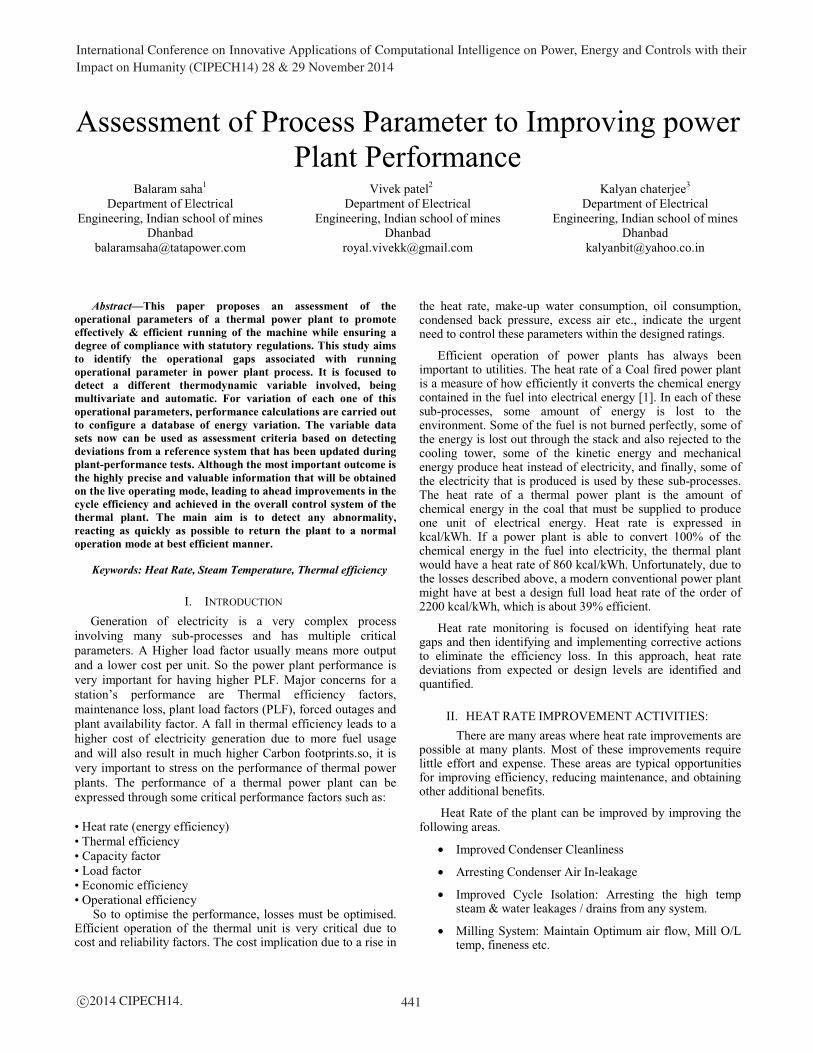
Actual M.S Temperature = 529 0C
Variance (Exp. - Act. M.S Temp) = - 8 0C
Turbine HR Correction Factor = 0.998 from Curve
Design Turbine HR = 2000 Kcal/kWh
Design Boiler = 86.8 %
HR Deviation = (2000/(86.8/100))*(1-0.998)
= 4.6 kcal/kWh
Fig. 3. Correction Curve for MS Temperature
2) Cause of variation in Main Steam Temperature:
a) Effect on Enthalpy Drops of Different Stages • Enthalpy drop of each HP stages increase with rise in
MS Temperature
b) Effect on Losses of Different Stages • Nozzle & Moving Blade Losses increase with
Temperature rise.
• Profile loss & Cumulative loss increase with Temperature rise
c) Effect on Efficiencies of Different Stages • HP Stages efficiencies remain almost constant at
different temperatures
d) Effect on Internal Power of Different Stage • Internal power of HP stages increases with increased
temperature
e) Effect on Cycle Efficiency & Heat Rate of Different Stages
• Cycle Efficiency deteriorates and Heat Rate increased with lower Main Steam Temperature.
B. Hot Reheat Temperature: Hot Reheat Temperature before Interceptor Valve - Day
average of 24 hrs of all the available temperature points located
before Interceptor Valve is taken for calculation. This average value of temperature is to be compared with expected temperature.
(Expected temperature = Design Temperature).
The difference of temperature will be taken for Heat rate deviation calculation based on customized correction curves. [Customized correction curves are given by OEM is used].
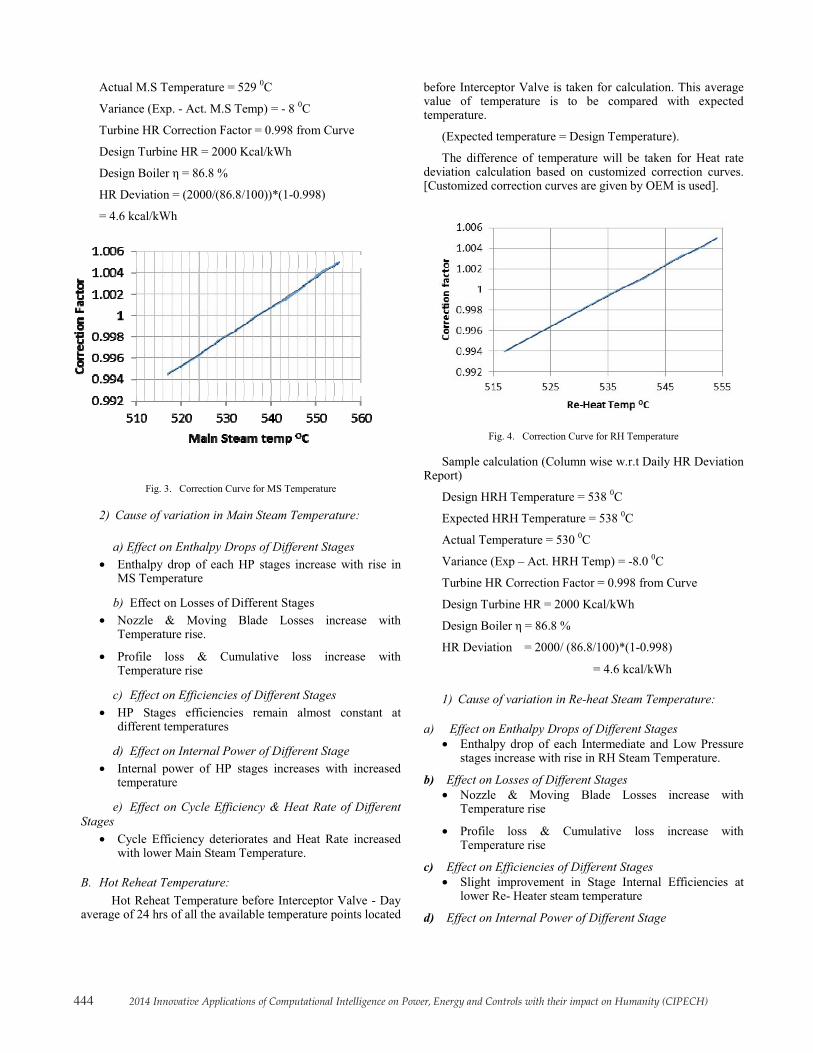
Fig. 4. Correction Curve for RH Temperature
Sample calculation (Column wise w.r.t Daily HR Deviation Report)
Design HRH Temperature = 538 0C
Expected HRH Temperature = 538 0C
Actual Temperature = 530 0C
Variance (Exp – Act. HRH Temp) = -8.0 0C
Turbine HR Correction Factor = 0.998 from Curve
Design Turbine HR = 2000 Kcal/kWh
Design Boiler = 86.8 %
HR Deviation = 2000/ (86.8/100)*(1-0.998)
= 4.6 kcal/kWh
1) Cause of variation in Re-heat Steam Temperature:
a) Effect on Enthalpy Drops of Different Stages • Enthalpy drop of each Intermediate and Low Pressure
stages increase with rise in RH Steam Temperature.
b) Effect on Losses of Different Stages • Nozzle & Moving Blade Losses increase with
Temperature rise
• Profile loss & Cumulative loss increase with Temperature rise
c) Effect on Efficiencies of Different Stages • Slight improvement in Stage Internal Efficiencies at
lower Re- Heater steam temperature
d) Effect on Internal Power of Different Stage
444 2014 Innovative Applications of Computational Intelligence on Power, Energy and Controls with their impact on Humanity (CIPECH)

• Internal power of both IP & LP stages increase with increase RH steam temperature
e) Effect on Cycle Efficiency & Heat Rate of Different Stages
• Cycle Efficiency deteriorates and Heat Rate increased with lower Reheat Steam Temperature.
C. Superheat Attemperation: Super Heater (S/H) attemperation to the boiler – Day
average of 24 hrs is to be taken for calculation. This average value of S/H attemperation to be compared with expected S/H attemperation.
The difference of the average value of the day and expected value of S/H attemperation is to be taken for Heat rate deviation calculation based on customized correction curves.
Customized/OEM correction curves are to be used.
Sample calculation (Column wise w.r.t Daily HR Deviation Report)
Design S/H Attemperation = 0 t/hr.
Expected S/H Attemperation = 16 t/hr
Actual S/H Attemperation = 46 t/hr
(Variance Exp. – Act. Attemp.) = -30 t/hr
= -5 % of Main Stream Flow
Turbine HR Correction Factor = 0.999 from Curve
Design Turbine HR = 2000 Kcal/kWh
Design Tested Boiler = 86.8 %
HR Deviation = 2000/ (86.8/100)*(1-0.999)
= 2.3 kcal/kWh
Fig. 5. Correction Curve for Super Heater Spray flow
D. Reheat Attemperation: Re- Heater (RH) attemperation to the boiler – day average
of 24 hrs is to be taken for calculation. This average value of R/H attemperation to be compared with expected R/H attemperation (Expected R/H attemperation = Value corresponding to actual load is to be derived using Load vs reheat attemperation curve). The difference of the average value of the day and expected value of R/H attemperation is to be taken for Heat rate deviation calculation based on customized correction curves.
Customized/OEM correction curves are to be used.
Sample calculation (Column wise w.r.t Daily HR Deviation Report)
Design R/H Attemperation = 0 t/hr
Expected R/H Attemperation = 6 t/hr
Actual R/H Attemperation = 18 t/hr
Variance (Exp. – Act. Attemp) = -12 t/hr
= -2 % of Main Stream Flow
Turbine HR Correction Factor = 0.9968 (From Curve)
Design Turbine HR = 2000 Kcal/kWh
Design Boiler = 86.8 %
HR Deviation = 2000/(86.8/100)*(1-0.997)
= 7.4 kcal/kWh
Fig. 6. Correction Curve for Re- Heater Spray flow.
E. Feed Water Temperature: The Feed water temperature at top HP Heater outlet after
joining of HP Heater bypass line, based on daily 24 hrs averages is to be taken for calculation. This average value of Feed water temperature is to be compared with the expected value of Feed water temperature (Expected FW temperature = Feed water temperature corrected for load, derived from curve between feed water temperature vs load).
2014 Innovative Applications of Computational Intelligence on Power, Energy and Controls with their impact on Humanity (CIPECH) 445
The difference of Average value of Day and Expected value of Feed water temperature is to be taken for Heat rate deviation calculation based on customized correction curves. Customized/OEM correction curves are to be used.
Sample calculation (Column wise w.r.t Daily HR Deviation Report)
Design Feed Water Temperature = 248 0C
Expected FW Temperature = 236 0C
Actual FW Temperature = 234 0C
Variance (Exp. – Act. FW Temp) = 2 0C
Turbine HR Corr. Factor at 236 0C = 0.996 from Curve
Turbine HR Corr. Factor at 234 0C = 0.995 from Curve
Design Turbine HR = 2000 Kcal/kWh
Design Boiler = 86.8 %
HR Deviation = (2000/ (86.8/100))*(0.996-.995)
= 2.3 kcal/kWh
F. APH Exit Temperature: It’s important to ensure that the online measurements of air
and flue gas temperatures are representative of average temperatures in the duct.
In 500 MW units, the flue gas sampling and temperature measurement should be done in the common flue gas duct of Primary and Secondary air heater outlet on each side. At present the flue gas temperature is monitored only at outlets of each air heater and an average value of 24 Hrs based on assumed proportions of flue gas flow through primary and secondary air heaters, is used for efficiency computation.
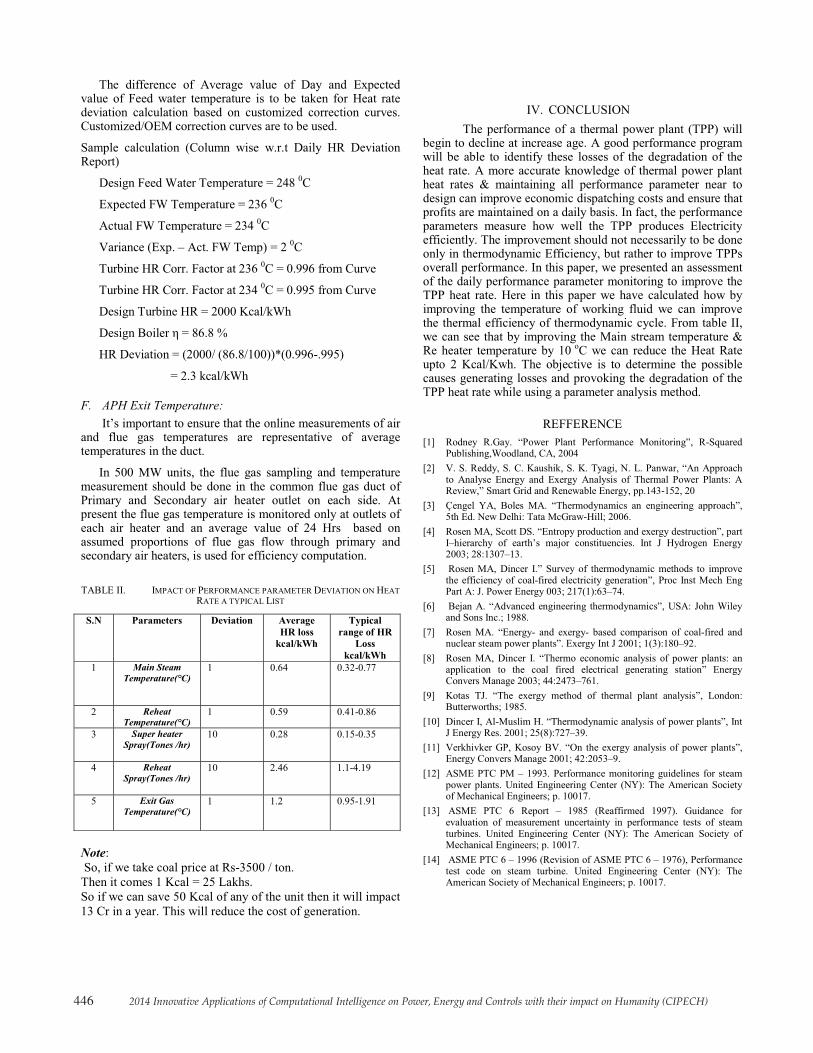
TABLE II. IMPACT OF PERFORMANCE PARAMETER DEVIATION ON HEAT RATE A TYPICAL LIST
S.N
Parameters Deviation Average HR loss
kcal/kWh
Typical range of HR
Loss kcal/kWh
1 Main Steam Temperature(°C)
1 0.64 0.32-0.77
2 Reheat Temperature(°C)
1 0.59 0.41-0.86
3 Super heater Spray(Tones /hr)
10 0.28 0.15-0.35
4 Reheat Spray(Tones /hr)
10 2.46 1.1-4.19
5 Exit Gas Temperature(°C)
1 1.2 0.95-1.91
Note: So, if we take coal price at Rs-3500 / ton. Then it comes 1 Kcal = 25 Lakhs. So if we can save 50 Kcal of any of the unit then it will impact 13 Cr in a year. This will reduce the cost of generation.
IV. CONCLUSION The performance of a thermal power plant (TPP) will
begin to decline at increase age. A good performance program will be able to identify these losses of the degradation of the heat rate. A more accurate knowledge of thermal power plant heat rates & maintaining all performance parameter near to design can improve economic dispatching costs and ensure that profits are maintained on a daily basis. In fact, the performance parameters measure how well the TPP produces Electricity efficiently. The improvement should not necessarily to be done only in thermodynamic Efficiency, but rather to improve TPPs overall performance. In this paper, we presented an assessment of the daily performance parameter monitoring to improve the TPP heat rate. Here in this paper we have calculated how by improving the temperature of working fluid we can improve the thermal efficiency of thermodynamic cycle. From table II, we can see that by improving the Main stream temperature & Re heater temperature by 10 oC we can reduce the Heat Rate upto 2 Kcal/Kwh. The objective is to determine the possible causes generating losses and provoking the degradation of the TPP heat rate while using a parameter analysis method.
REFFERENCE [1] Rodney R.Gay. “Power Plant Performance Monitoring”, R-Squared
Publishing,Woodland, CA, 2004 [2] V. S. Reddy, S. C. Kaushik, S. K. Tyagi, N. L. Panwar, “An Approach
to Analyse Energy and Exergy Analysis of Thermal Power Plants: A Review,” Smart Grid and Renewable Energy, pp.143-152, 20
[3] Çengel YA, Boles MA. “Thermodynamics an engineering approach”, 5th Ed. New Delhi: Tata McGraw-Hill; 2006.
[4] Rosen MA, Scott DS. “Entropy production and exergy destruction”, part I–hierarchy of earth’s major constituencies. Int J Hydrogen Energy 2003; 28:1307–13.
[5] Rosen MA, Dincer I.” Survey of thermodynamic methods to improve the efficiency of coal-fired electricity generation”, Proc Inst Mech Eng Part A: J. Power Energy 003; 217(1):63–74.
[6] Bejan A. “Advanced engineering thermodynamics”, USA: John Wiley and Sons Inc.; 1988.
[7] Rosen MA. “Energy- and exergy- based comparison of coal-fired and nuclear steam power plants”. Exergy Int J 2001; 1(3):180–92.
[8] Rosen MA, Dincer I. “Thermo economic analysis of power plants: an application to the coal fired electrical generating station” Energy Convers Manage 2003; 44:2473–761.
[9] Kotas TJ. “The exergy method of thermal plant analysis”, London: Butterworths; 1985.
[10] Dincer I, Al-Muslim H. “Thermodynamic analysis of power plants”, Int J Energy Res. 2001; 25(8):727–39.
[11] Verkhivker GP, Kosoy BV. “On the exergy analysis of power plants”, Energy Convers Manage 2001; 42:2053–9.
[12] ASME PTC PM – 1993. Performance monitoring guidelines for steam power plants. United Engineering Center (NY): The American Society of Mechanical Engineers; p. 10017.
[13] ASME PTC 6 Report – 1985 (Reaffirmed 1997). Guidance for evaluation of measurement uncertainty in performance tests of steam turbines. United Engineering Center (NY): The American Society of Mechanical Engineers; p. 10017.
[14] ASME PTC 6 – 1996 (Revision of ASME PTC 6 – 1976), Performance test code on steam turbine. United Engineering Center (NY): The American Society of Mechanical Engineers; p. 10017.
446 2014 Innovative Applications of Computational Intelligence on Power, Energy and Controls with their impact on Humanity (CIPECH)