Embed Size (px)
Citation preview
Assessment of Psychological Processes
Milton J. Dehn, Ed.D., NCSPSchoolhouse Educational Services
Fall 2013

Notice of Copyright 2013
This PowerPoint presentation and accompanying materials are copyrighted by Schoolhouse Educational Services, LLC. They are not to be reprinted, copied, or electronically disseminated without written permission. To obtain permission, email [email protected].
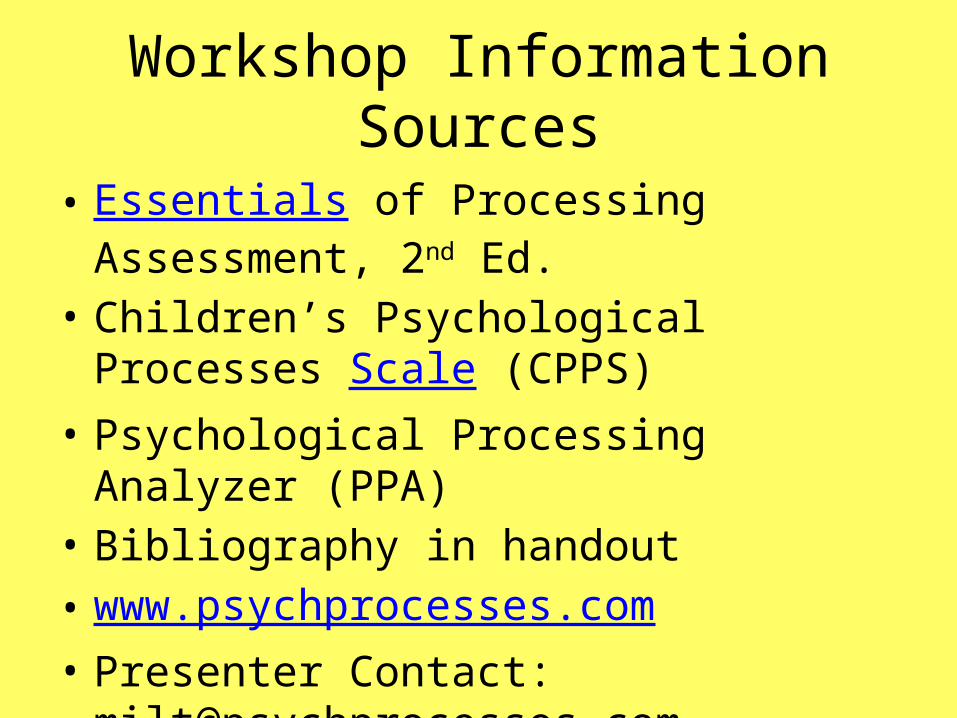
Workshop Information Sources
• Essentials of Processing Assessment, 2nd Ed. • Children’s Psychological Processes Scale (CPPS)• Psychological Processing Analyzer (PPA)• Bibliography in handout• www.psychprocesses.com• Presenter Contact: [email protected]

Workshop Topics
1. Processes to assess 2. Processes and academic skills3. PSW Models4. Selective, cross-battery testing5. Identifying processing deficits with the PPA6. Identifying processing deficits with the CPPS
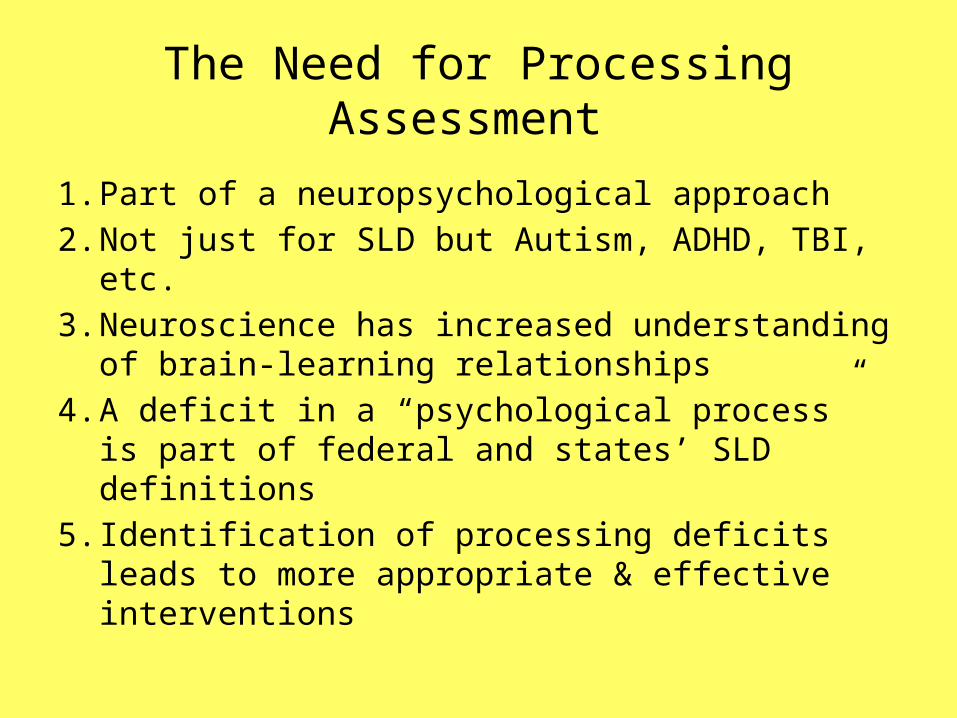
The Need for Processing Assessment
1. Part of a neuropsychological approach2. Not just for SLD but Autism, ADHD, TBI, etc.3. Neuroscience has increased understanding of
brain-learning relationships4. A deficit in a “psychological process” is part
of federal and states’ SLD definitions5. Identification of processing deficits leads to
more appropriate & effective interventions
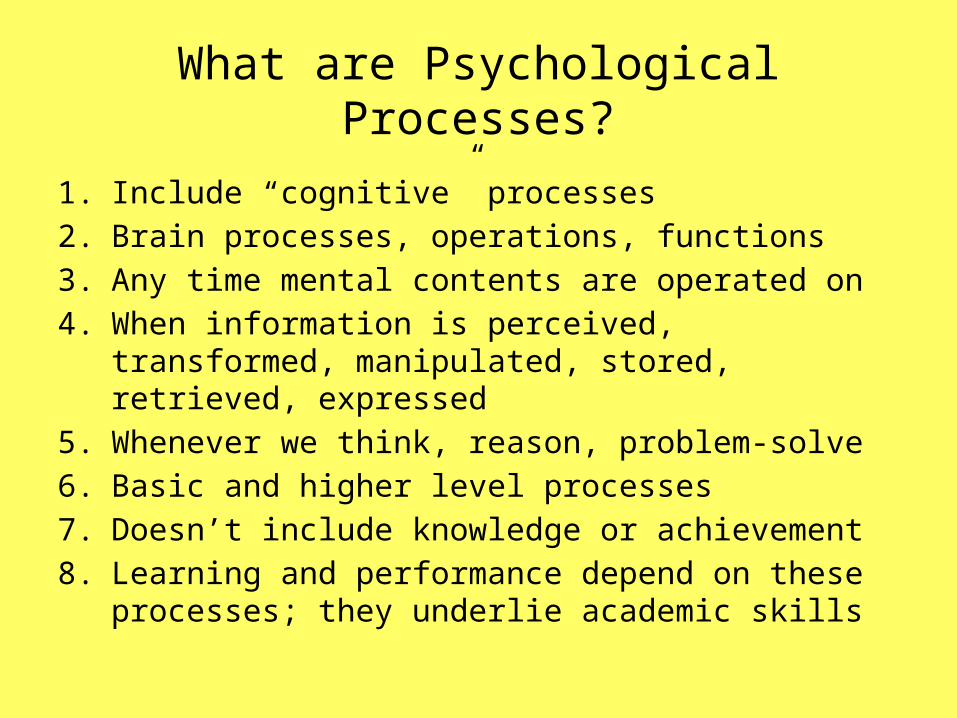
What are Psychological Processes?
1. Include “cognitive” processes2. Brain processes, operations, functions3. Any time mental contents are operated on4. When information is perceived, transformed,
manipulated, stored, retrieved, expressed5. Whenever we think, reason, problem-solve6. Basic and higher level processes7. Doesn’t include knowledge or achievement8. Learning and performance depend on these
processes; they underlie academic skills
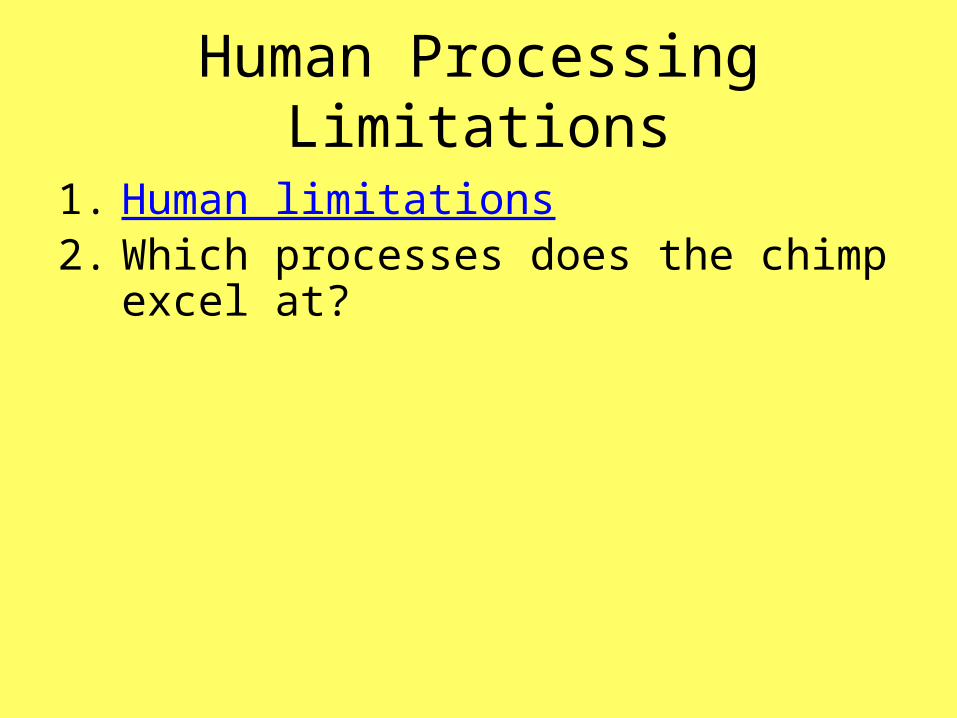
Human Processing Limitations
1. Human limitations2. Which processes does the chimp excel at?
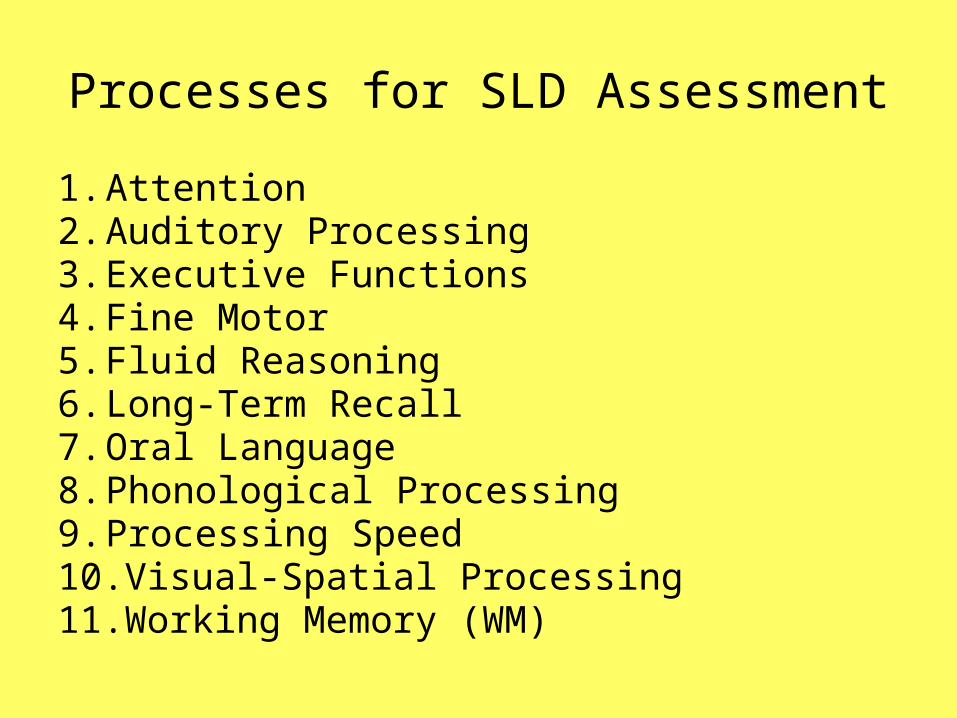
Processes for SLD Assessment
1. Attention2. Auditory Processing3. Executive Functions4. Fine Motor5. Fluid Reasoning6. Long-Term Recall7. Oral Language8. Phonological Processing9. Processing Speed10.Visual-Spatial Processing11.Working Memory (WM)
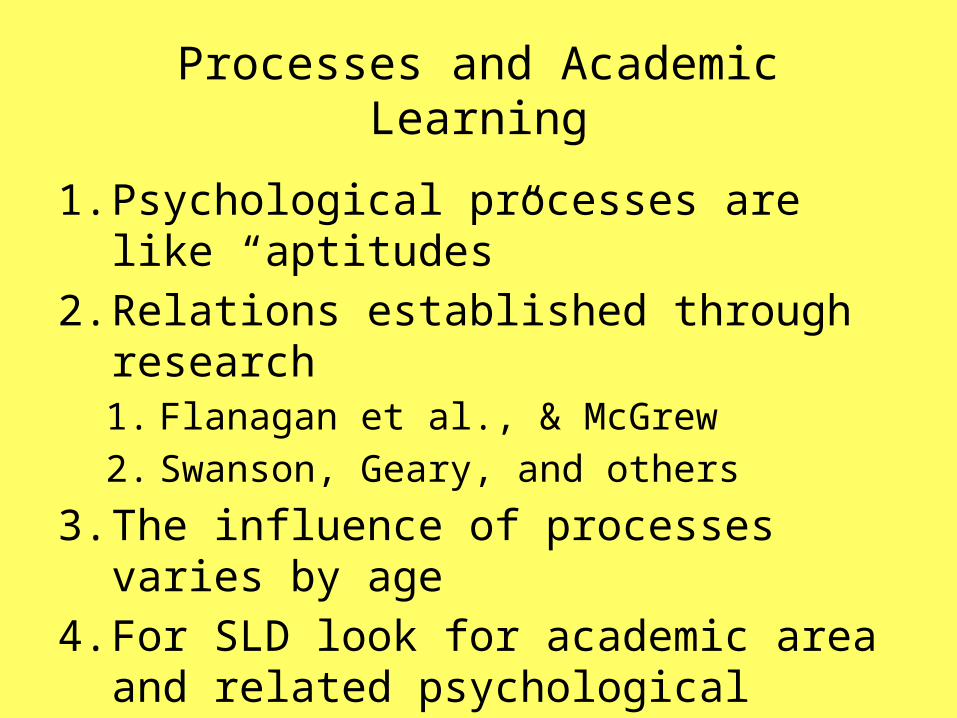
Processes and Academic Learning
1. Psychological processes are like “aptitudes”2. Relations established through research
1. Flanagan et al., & McGrew2. Swanson, Geary, and others
3. The influence of processes varies by age4. For SLD look for academic area and related
psychological processes to both be low5. See Table
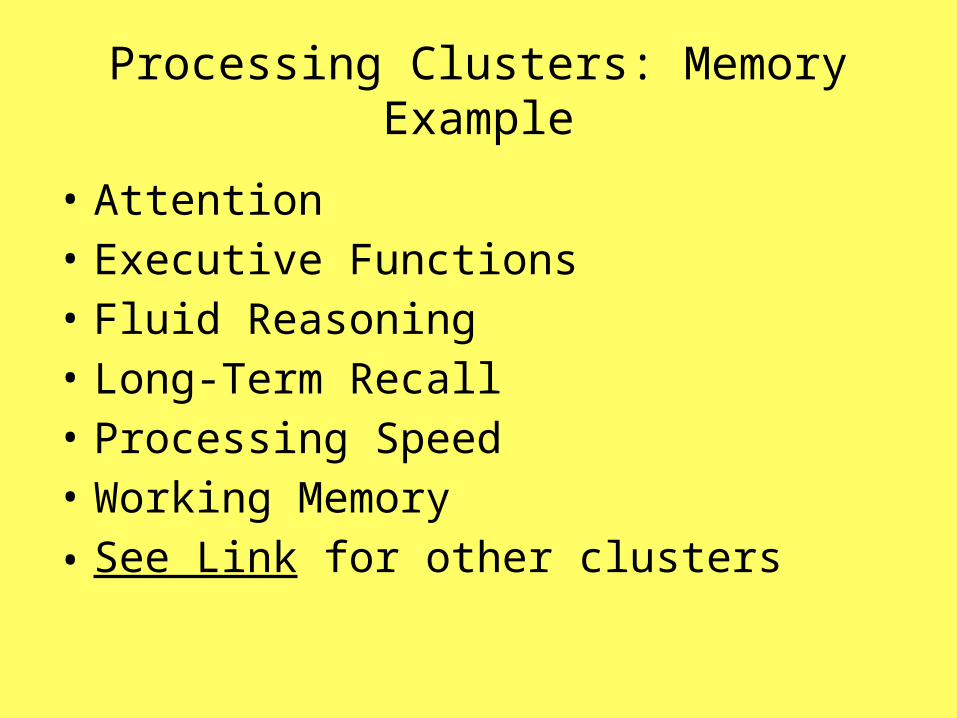
Processing Clusters: Memory Example
• Attention • Executive Functions• Fluid Reasoning• Long-Term Recall• Processing Speed• Working Memory• See Link for other clusters

Developmental Groupings
Mature early after gradual development:• Auditory Processing• Fine Motor Processing• Long-Term Recall• Phonological Processing• Visual-Spatial Processing• See link for other groupings
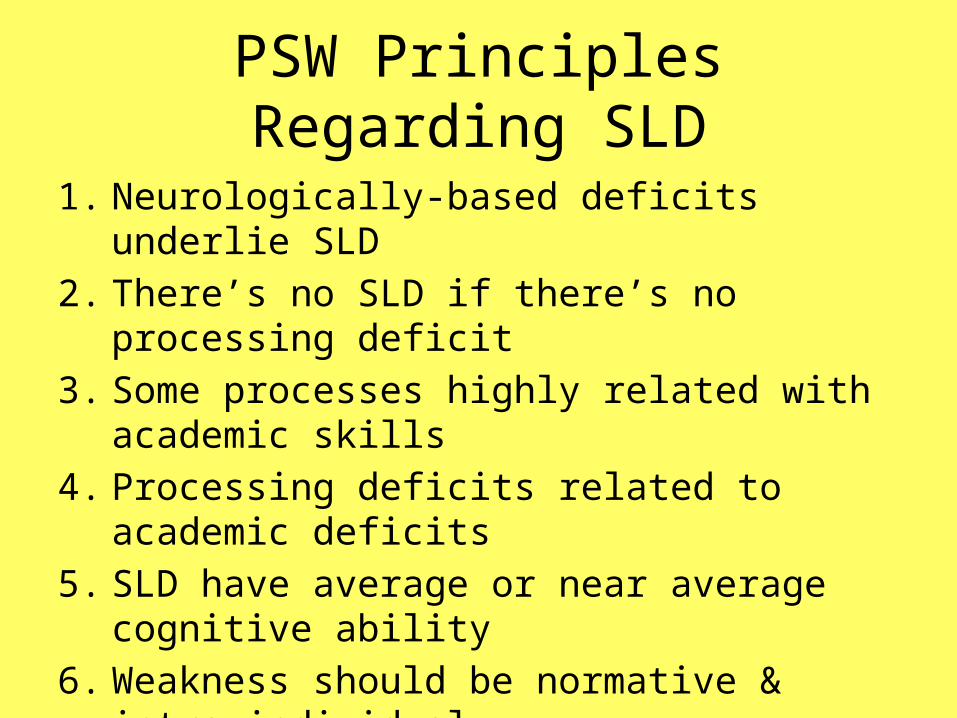
PSW Principles Regarding SLD
1. Neurologically-based deficits underlie SLD2. There’s no SLD if there’s no processing deficit3. Some processes highly related with academic skills4. Processing deficits related to academic deficits5. SLD have average or near average cognitive ability6. Weakness should be normative & intra-individual7. Weakness: statistically significant and unusual8. PSW doesn’t mean there is a learning disability.


Concordance-Discordance Model
1. From James Brad Hale Link2. Similar to Naglieri’s model3. Processing areas not significantly related to
the academic area should be discordant: Processing strengths should be significantly higher than the academic weakness
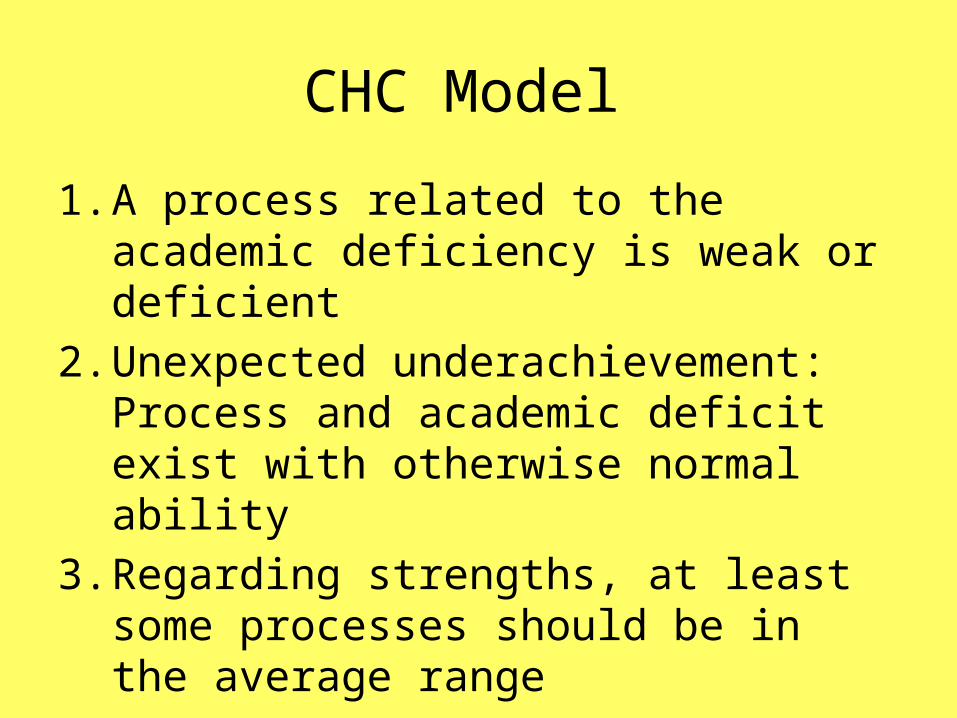
CHC Model
1. A process related to the academic deficiency is weak or deficient
2. Unexpected underachievement: Process and academic deficit exist with otherwise normal ability
3. Regarding strengths, at least some processes should be in the average range

Dehn’s PSW Model
1. Normative weakness + intra-individual weakness = deficit (3 reasons for deficit emphasis)
2. At least one process is a deficit3. Intra-individual weakness is statistically significant4. Subtest scores must be unitary for a deficit5. At least one processes is in average range (a
strength)6. The deficit is related to deficient academic skill7. Consistency between low process score(s) and the
related low academic skill score

Processing Assessment Challenges
1. Connecting to academic concerns2. Interrelated processes3. Not all are found in one convenient battery4. Doing it efficiently5. Linking with interventions
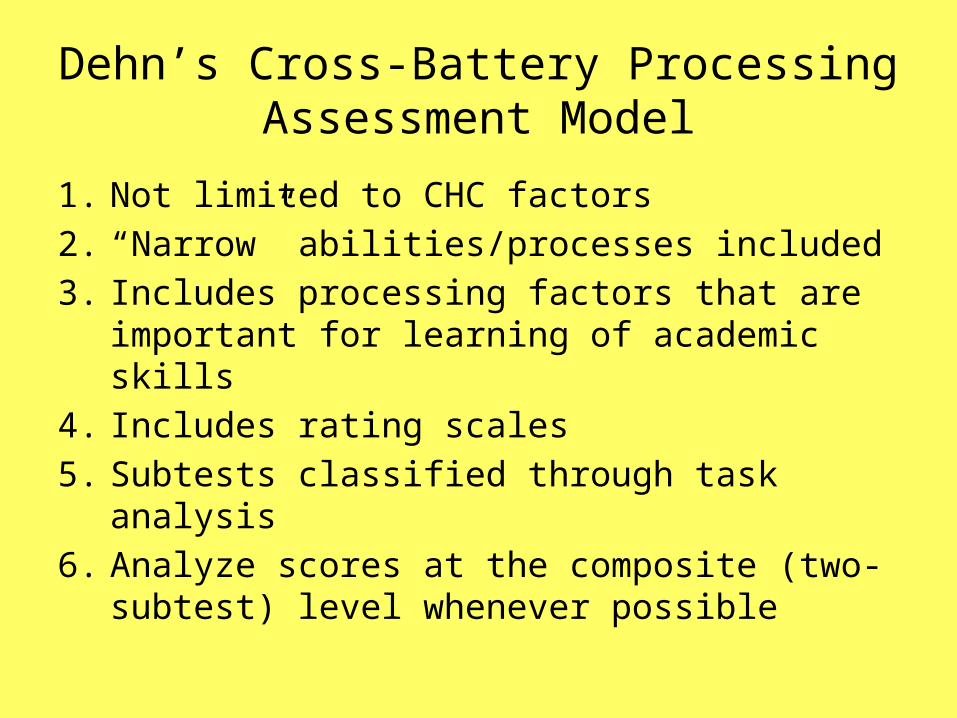
Dehn’s Cross-Battery Processing Assessment Model
1. Not limited to CHC factors2. “Narrow” abilities/processes included3. Includes processing factors that are
important for learning of academic skills4. Includes rating scales5. Subtests classified through task analysis6. Analyze scores at the composite (two-
subtest) level whenever possible

Cross-Battery, Selective Testing
1. Test all processes important for academics With most attention to an in-depth assessment of hypothesized weaknesses
2. Pick composites first3. Categorized by factor and task analysis4. See selective testing table Link5. See comprehensive list link from Essentials
of Processing Assessment, 2nd Edition

Task Analysis/Classificationof Subtests
1. Consider definition of the process2. Consider factor analytic information3. What is the primary process being measured
by the subtest? (not just input or output)4. Which primary process allows the examinee
to successfully complete the task5. What the task is typically used to measure6. No such thing as “pure” subtest measure

Planning Processing Assessment
1. Assess most major processes, especially those hypothesized to be deficits
2. Identify academic deficiencies3. Generate processing deficit hypotheses
based on relations with academics4. Decide on method; some informal okay5. Select tests and subtests, not entire batteries

Hypothesis Testing Approach
1. Given academic deficiency, what are the most likely process deficits
2. It’s “why” the child has a learning problem3. Include non-processes 4. Must collect assessment data to “test”
hypotheses5. Try to avoid “confirmatory bias”6. We all have weaknesses
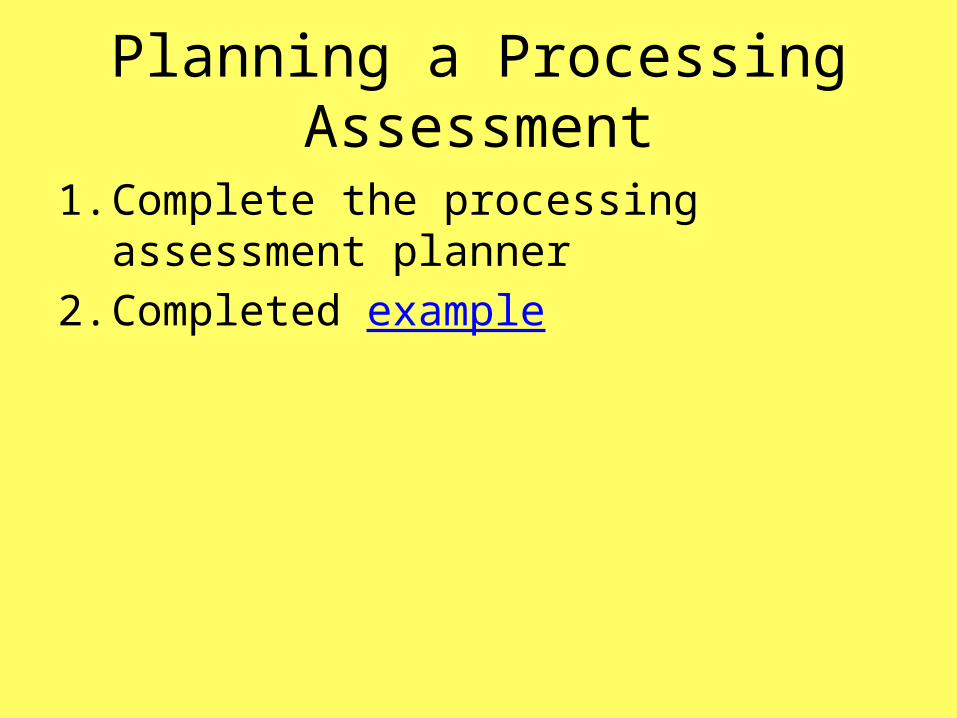
Planning a Processing Assessment
1. Complete the processing assessment planner2. Completed example

Processing Analysis
1. Composite scores from test manual when possible2. Convert all scores to standard scores3. Compute clinical scores by averaging4. Compute processing or memory mean or use IQ5. Calculate discrepancies6. Determine weaknesses and deficits7. Both kinds of weaknesses = a deficit8. Do pairwise comparisons
1. Opposites and those closely related9. Completed Example
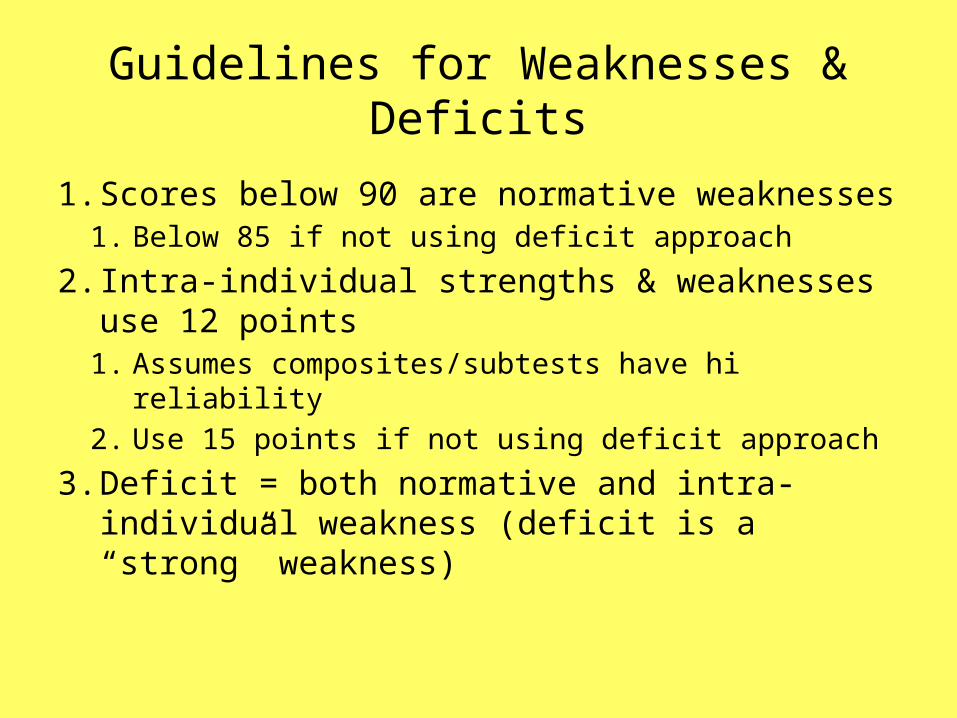
Guidelines for Weaknesses & Deficits
1. Scores below 90 are normative weaknesses1. Below 85 if not using deficit approach
2. Intra-individual strengths & weaknesses use 12 points
1. Assumes composites/subtests have hi reliability2. Use 15 points if not using deficit approach
3. Deficit = both normative and intra-individual weakness (deficit is a “strong” weakness)
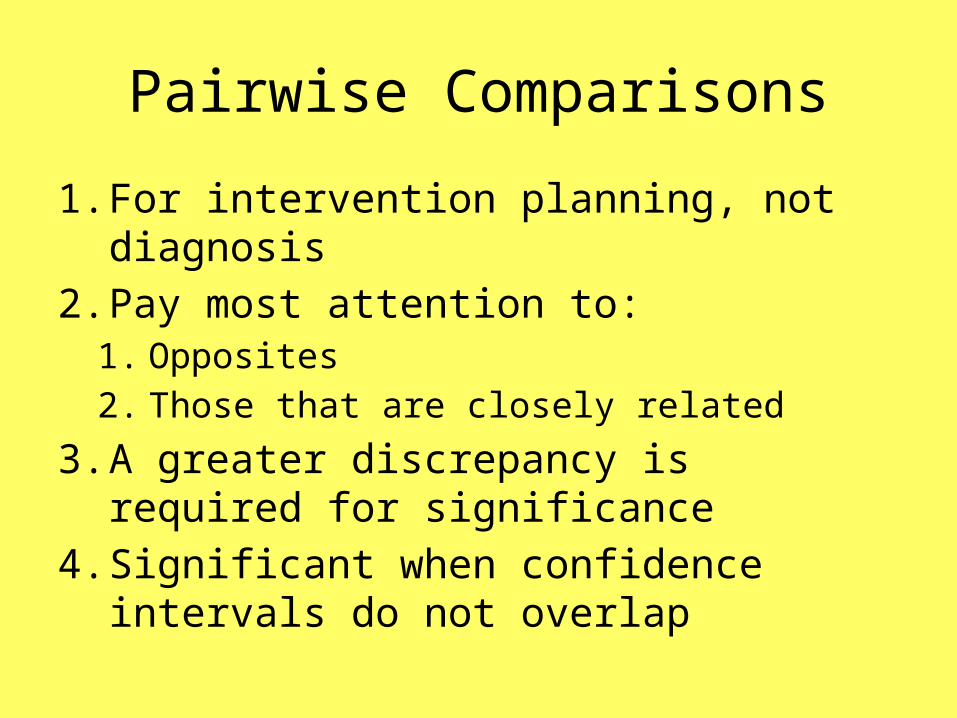
Pairwise Comparisons
1. For intervention planning, not diagnosis2. Pay most attention to:
1. Opposites2. Those that are closely related
3. A greater discrepancy is required for significance
4. Significant when confidence intervals do not overlap
Using Dehn’s Automated Analysis Worksheet to Determine PSW
1. Automated worksheet from Essentials of Processing, 2nd Edition
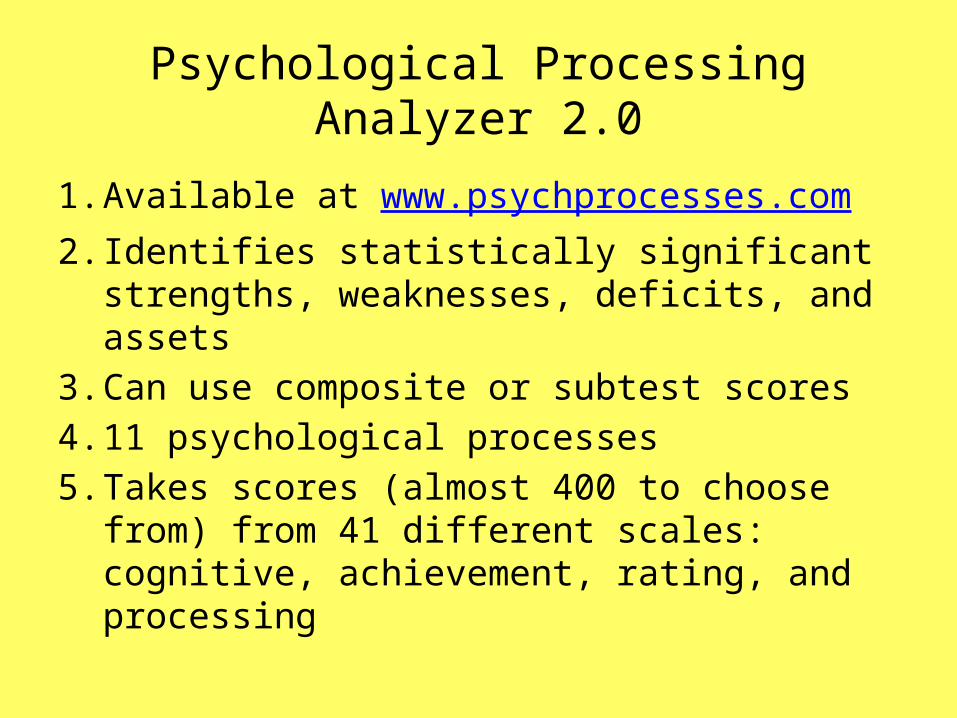
Psychological Processing Analyzer 2.0
1. Available at www.psychprocesses.com2. Identifies statistically significant strengths,
weaknesses, deficits, and assets 3. Can use composite or subtest scores4. 11 psychological processes5. Takes scores (almost 400 to choose from)
from 41 different scales: cognitive, achievement, rating, and processing

Psychological Processing Analyzer
1. Normally use the mean of the process scores as predicted score
1. Predicted score for each process based on mean of other 10
2. But IQ or cognitive composite is an option when not many processes assessed or only weak processes assessed
3. Differences greater than critical values are intra-individual weaknesses

Psychological Processing Analyzer
1. Composite and subtests are limited to those that are fairly direct measures
2. Some are re-classified based on the primary demands of the task
3. Difference formulas based on reliability coefficients of composites/subtests
4. Regression toward the mean5. .01 or .05 level of significance
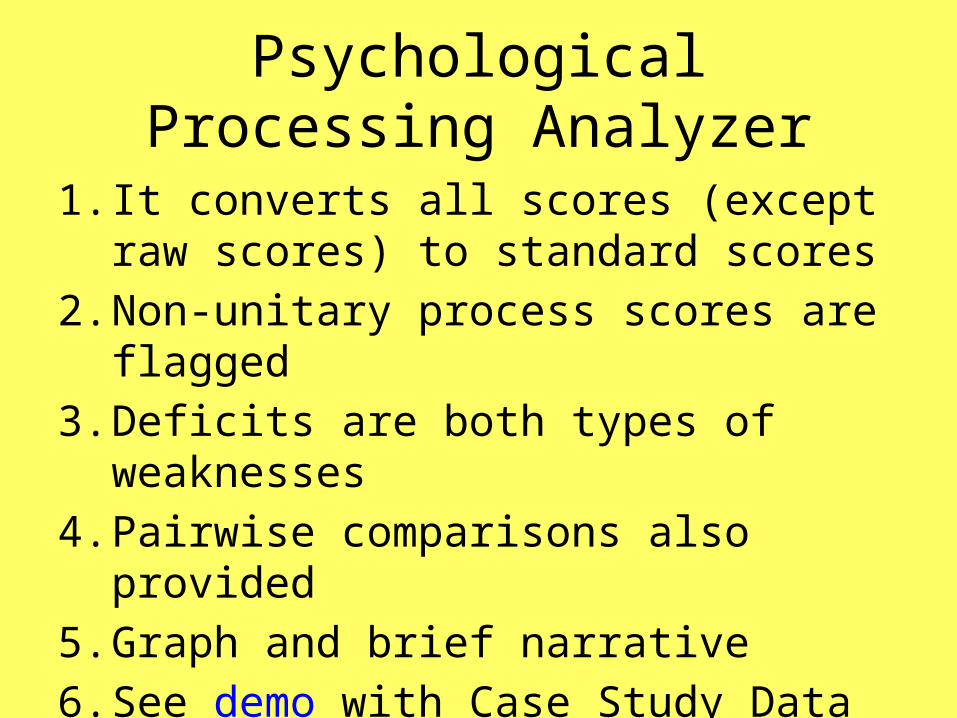
Psychological Processing Analyzer
1. It converts all scores (except raw scores) to standard scores
2. Non-unitary process scores are flagged3. Deficits are both types of weaknesses4. Pairwise comparisons also provided 5. Graph and brief narrative6. See demo with Case Study Data

Rating Scales
1. Processing deficits are manifested through behaviors
2. Behavior ratings can be used to measure processing abilities
3. Examples: BRIEF and other Executive Function Scales
4. Also, the new CPPS
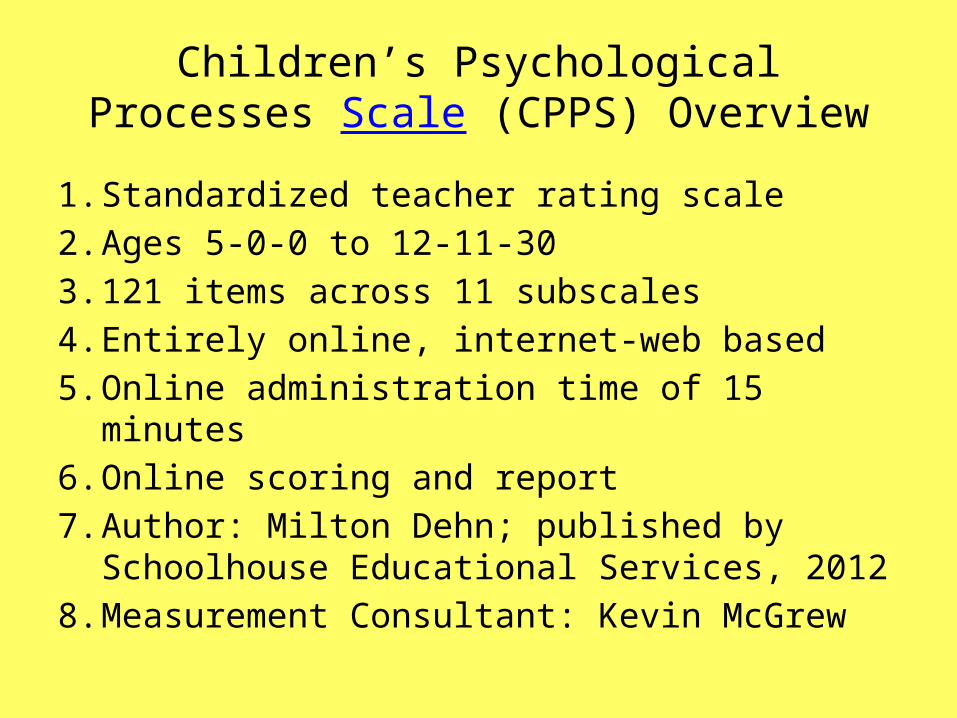
Children’s Psychological Processes Scale (CPPS) Overview
1. Standardized teacher rating scale2. Ages 5-0-0 to 12-11-303. 121 items across 11 subscales4. Entirely online, internet-web based5. Online administration time of 15 minutes6. Online scoring and report7. Author: Milton Dehn; published by Schoolhouse
Educational Services, 20128. Measurement Consultant: Kevin McGrew
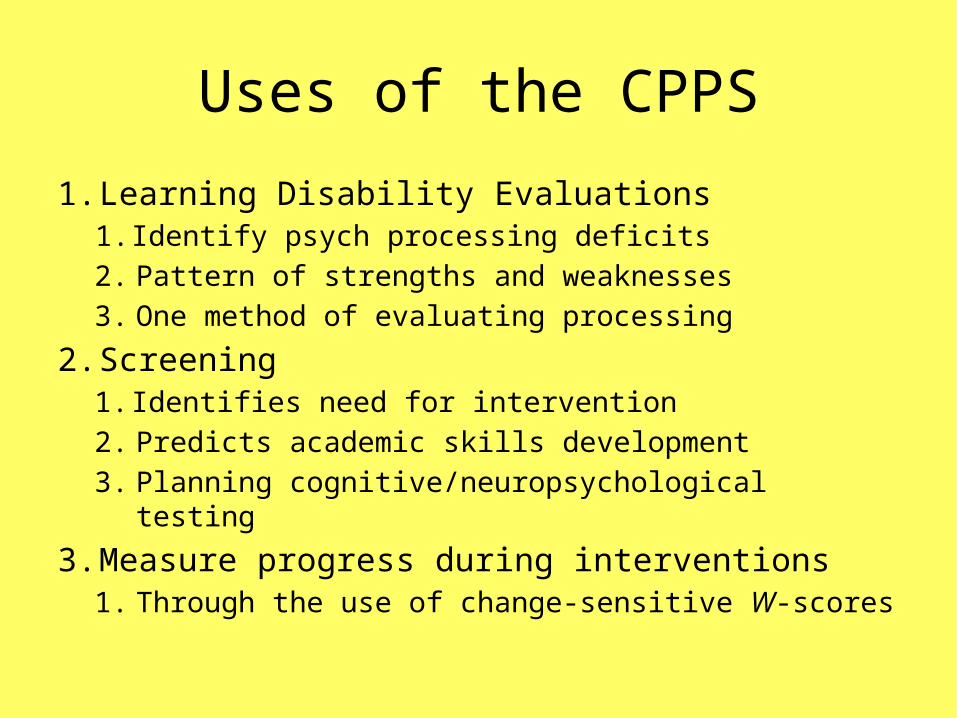
Uses of the CPPS
1. Learning Disability Evaluations 1. Identify psych processing deficits2. Pattern of strengths and weaknesses3. One method of evaluating processing
2. Screening1. Identifies need for intervention2. Predicts academic skills development3. Planning cognitive/neuropsychological testing
3. Measure progress during interventions1. Through the use of change-sensitive W-scores

CPPS Standardization
1. 1,121 students rated by 278 teachers2. 128 communities in 30 states3. All data collected online4. Demographics match U.S. Census well5. Norms: 4 age groups (5-6; 7-8; 9-10; 11-12)6. Included children with disabilities 7. Demographics details Link
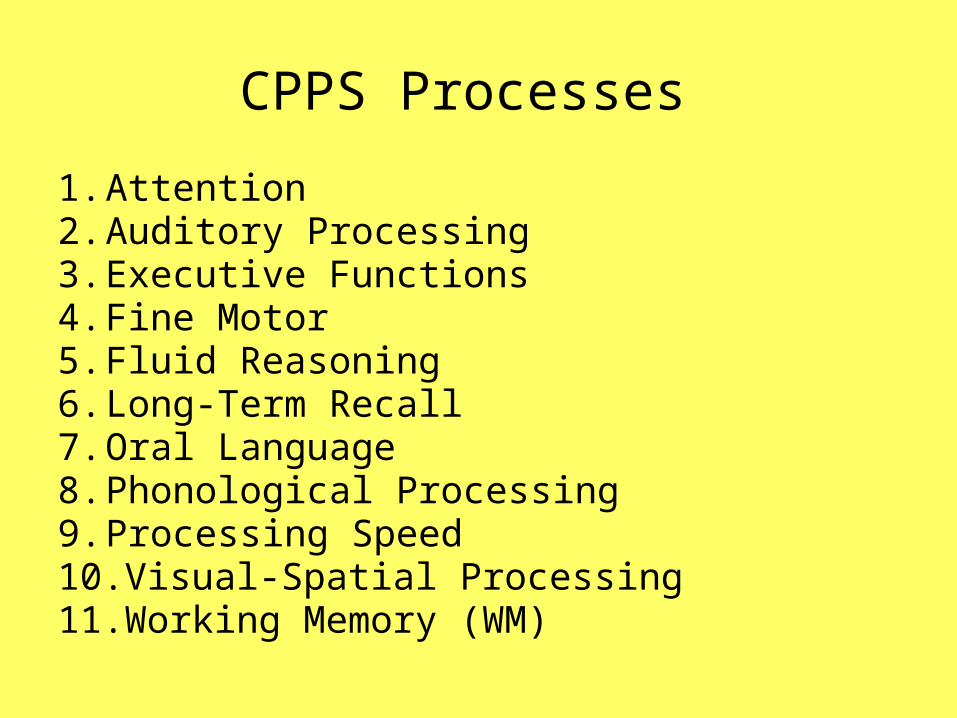
CPPS Processes
1. Attention2. Auditory Processing3. Executive Functions4. Fine Motor5. Fluid Reasoning6. Long-Term Recall7. Oral Language8. Phonological Processing9. Processing Speed10.Visual-Spatial Processing11.Working Memory (WM)
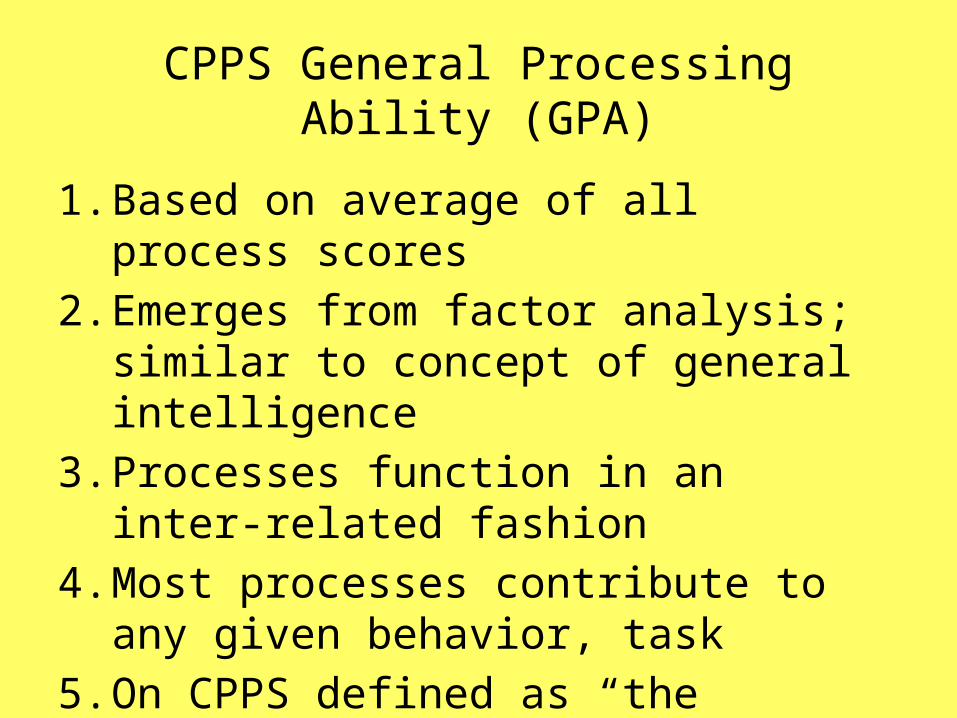
CPPS General Processing Ability (GPA)
1. Based on average of all process scores2. Emerges from factor analysis; similar to
concept of general intelligence3. Processes function in an inter-related fashion4. Most processes contribute to any given
behavior, task5. On CPPS defined as “the underlying efficiency
of processing”
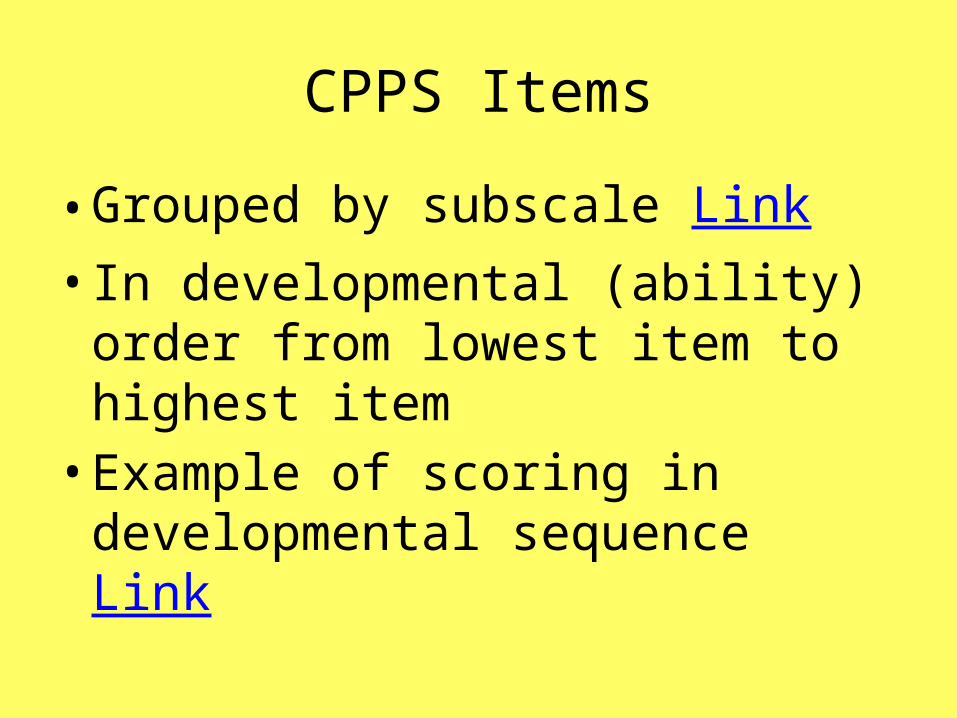
CPPS Items
• Grouped by subscale Link• In developmental (ability) order from
lowest item to highest item• Example of scoring in developmental
sequence Link
CPPS Administration
1. Online teacher rating scale 12-15 minutes1. Can print free paper copy and enter later 2. Must answer all items (but can save incomplete)
2. Never, Sometimes, Often, Almost Always3. Rating scale saved until report generated
How The Online CPPS Works
1. A psychologist’s side and a teacher’s side2. Psychologist fills in teacher information and
email sent3. Teacher completes ratings4. Psych receives email stating ratings complete5. Psych generates report6. See screen shots
CPPS Report
1. Brief narrative, graph, and a table of scores2. Change-sensitive W-scores3. T-scores; percentiles; confidence intervals4. Intra-individual strengths and weakness
discrepancy table5. T-score to standard score converter6. Example
CPPS Discrepancy Analysis
1. Use discrepancy table to determine pattern of strengths and weaknesses
2. Predicted score based on mean of other 103. Regression toward the mean included 4. +/- 1.00 to 2.00 SD of SEE discrepancy options5. Strengths and Weakness labeling is opposite
of discrepancy, e.g. “-” value = a strength6. Link
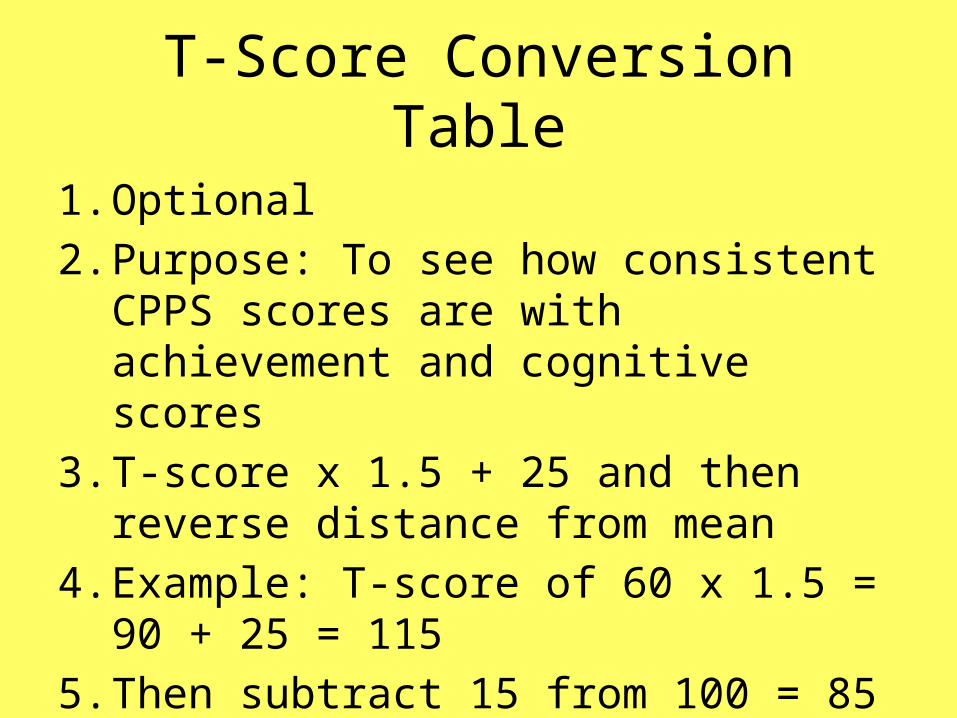
T-Score Conversion Table
1. Optional2. Purpose: To see how consistent CPPS scores
are with achievement and cognitive scores3. T-score x 1.5 + 25 and then reverse distance
from mean4. Example: T-score of 60 x 1.5 = 90 + 25 = 1155. Then subtract 15 from 100 = 85 Example
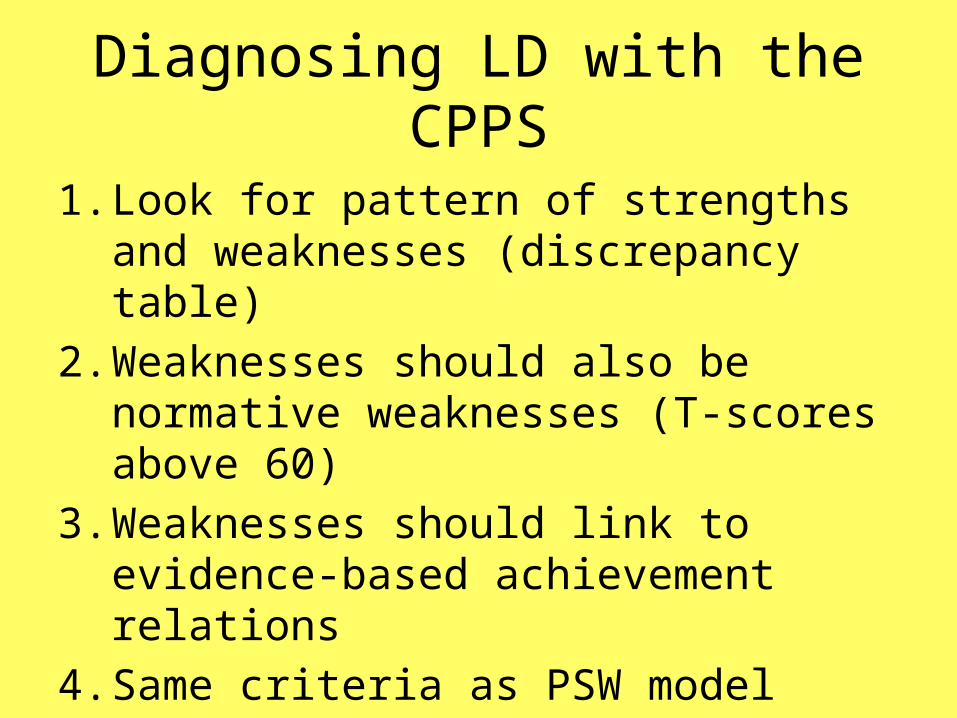
Diagnosing LD with the CPPS
1. Look for pattern of strengths and weaknesses (discrepancy table)
2. Weaknesses should also be normative weaknesses (T-scores above 60)
3. Weaknesses should link to evidence-based achievement relations
4. Same criteria as PSW model
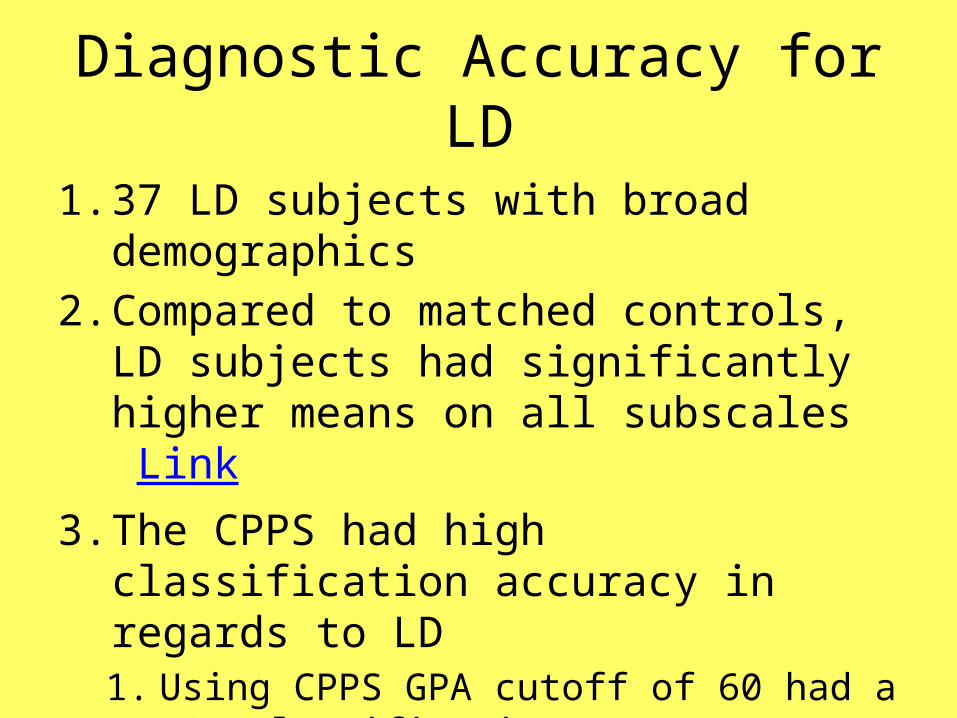
Diagnostic Accuracy for LD
1. 37 LD subjects with broad demographics2. Compared to matched controls, LD subjects
had significantly higher means on all subscales Link
3. The CPPS had high classification accuracy in regards to LD1. Using CPPS GPA cutoff of 60 had a 92%
classification accuracy across 74 subjects

Frequently Asked CPPS Questions
1. Is there a paper form?2. Can I print individual item ratings?3. Security?4. Students 13 and older?5. Parent form?

Reviewer #1 Comments
“The technical documentation and delivery package of the CPPS is quite impressive for an assessment measure at its price point. Its coverage of the full spectrum of processing abilities through rating scale technology is a welcome addition to the cognitive assessment field.”Ryan J. McGill, Journal of Psychoeducational Assessment, 2013, 31:423
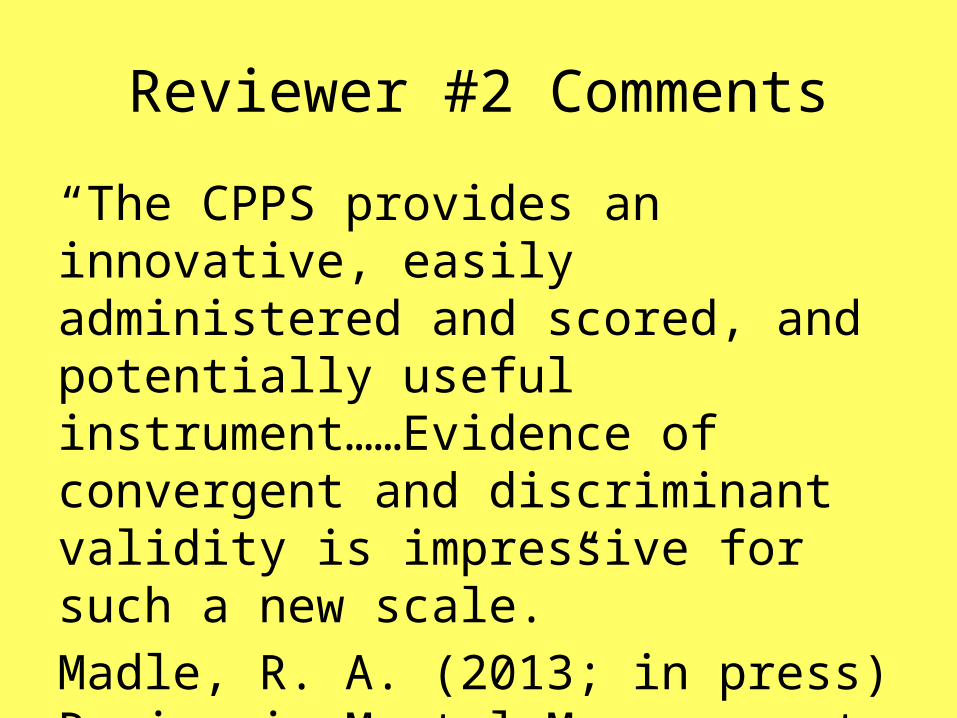
Reviewer #2 Comments
“The CPPS provides an innovative, easily administered and scored, and potentially useful instrument……Evidence of convergent and discriminant validity is impressive for such a new scale.”Madle, R. A. (2013; in press) Review in Mental Measurements Yearbook, Volume 19.