Embed Size (px)
Citation preview
Chris P. Pantelides
Jon Hansen
Justin Nadauld
and
Lawrence D. ReaveleyUniversity of Utah
Assessment of Reinforced Concrete Building Exterior Jointswith Substandard Details
Pacific Earthquake EngineeringResearch Center
PEER 2002/18MAY 2002
Assessment of Reinforced Concrete Building Exterior Joints with Substandard Details
Chris P. Pantelides
Professor of Civil and Environmental Engineering University of Utah
Jon Hansen
Research Assistant
Justin Nadauld Research Assistant
Lawrence D. Reaveley Professor of Civil and Environmental Engineering
PEER Report 2002/18 Pacific Earthquake Engineering Research Center
College of Engineering University of California, Berkeley
May 2002
iii
ABSTRACT
Reinforced concrete (RC) buildings designed before the mid-1970s may have serious structural
deficiencies and are considered substandard according to current seismic design criteria.
Specifically, the failure of the beam-column joints has been the cause of building collapse in
many recent earthquakes worldwide. This report evaluates the seismic performance of beam-
column joints with three different details of beam and beam-column joint reinforcement. A total
of six full-scale RC exterior joints were tested and their performance was examined in terms of
lateral load capacity, drift, plastic rotation, joint shear strength, ductility, residual strength, and
other PEER-established performance criteria. Two levels of axial compression load in the
columns were investigated, and their influence on the performance of the joint is discussed.
Performance levels for two types of failure mechanisms are established and comparisons are
made to FEMA 273, FEMA 356, and ACI 352. In addition, the bond-slip behavior of the bottom
beam bars is discussed. Limit states models are created and new modeling criteria for exterior
joints with substandard details are proposed. Finally, a strut-and-tie model is developed for
verifying the experimental results.
iv
ACKNOWLEDGMENTS
This work was supported by the Pacific Earthquake Engineering Research Center through the
Earthquake Engineering Research Centers Program of the National Science Foundation under
Award number EEC-9701568.
The in-kind contribution made by Gerber Construction is greatly appreciated.
The research presented in this report was performed at the University of Utah. The
authors would like to thank the following students from the Department of Civil and
Environmental Engineering for their assistance: Danny Alire, B.Sc., Chandra Clyde, M.Sc., and
Yasuteru Okahashi, Ph.D. candidate.
v
CONTENTS
ABSTRACT................................................................................................................................... iii
ACKNOWLEDGMENTS ............................................................................................................. iv
TABLE OF CONTENTS.................................................................................................................v
LIST OF FIGURES ...................................................................................................................... vii
LIST OF TABLES......................................................................................................................... xi
1 INTRODUCTION .................................................................................................................1
2 TEST SPECIMENS...............................................................................................................9
2.1 Description of Test Units ................................................................................................9
2.2 Material Properties ..........................................................................................................9
2.2.1 Concrete ..............................................................................................................9
2.2.2 Steel Reinforcement ..........................................................................................10
2.3 Construction of Test Units ............................................................................................10
3 TEST SETUP.......................................................................................................................17
3.1 Instrumentation .............................................................................................................17
3.1.1 Strain Gages ......................................................................................................17
3.1.2 LVDTs ..............................................................................................................19
3.1.3 Displacement Transducers ................................................................................20
3.2 Loading Apparatus ........................................................................................................21
3.3 Test Procedure...............................................................................................................21
4 TEST RESULTS AND DISCUSSION...............................................................................23
4.1 Theoretical Predictions .................................................................................................23
4.2 Experimental Results ....................................................................................................24
4.2.1 Test Unit 1.........................................................................................................24
4.2.2 Test Unit 2.........................................................................................................28
4.2.3 Test Unit 3.........................................................................................................31
4.2.4 Test Unit 4.........................................................................................................36
4.2.5 Test Unit 5.........................................................................................................40
4.2.6 Test Unit 6.........................................................................................................44
5 PERFORMANCE-BASED EVALUATION.....................................................................49
5.1 Description of Parameters .............................................................................................49
vi
5.2 Performance Levels.......................................................................................................63
5.3 Bond-Slip ......................................................................................................................71
5.4 Comparison with FEMA 273 and ACI 352 ..................................................................74
5.5 Limit States Model........................................................................................................75
5.6 Proposed New Modeling Criteria for Exterior Joints with Substandard Details ..........79
6 STRUT-AND-TIE-MODEL ...............................................................................................85
6.1 Objective .......................................................................................................................85
6.2 Test Unit........................................................................................................................87
6.3 Model Development......................................................................................................88
6.4 Evaluation of Truss .......................................................................................................93
7 CONCLUSIONS..................................................................................................................97
REFERENCES...........................................................................................................................101
vii
LIST OF FIGURES
Fig. 1.1 Inadequate detailing of joint in the Tehuacan, Mexico, earthquake of June 15, 1999....2
Fig. 1.2 Severe damage to moment frame beam-column joints in the Izmit, Turkey,
earthquake of August 17, 1999 .......................................................................................2
Fig. 1.3 Collapse of building due to failure of beam-column joints in the Izmit, Turkey,
earthquake of August 17, 1999 .......................................................................................3
Fig. 1.4 Failure of beam-column joint in the Athens, Greece, earthquake of
September 7, 1999...........................................................................................................3
Fig. 1.5 Damage to partially collapsed 15-story building: beam-column failure at façade
in the Chi-Chi, Taiwan, earthquake of September 21, 1999...........................................4
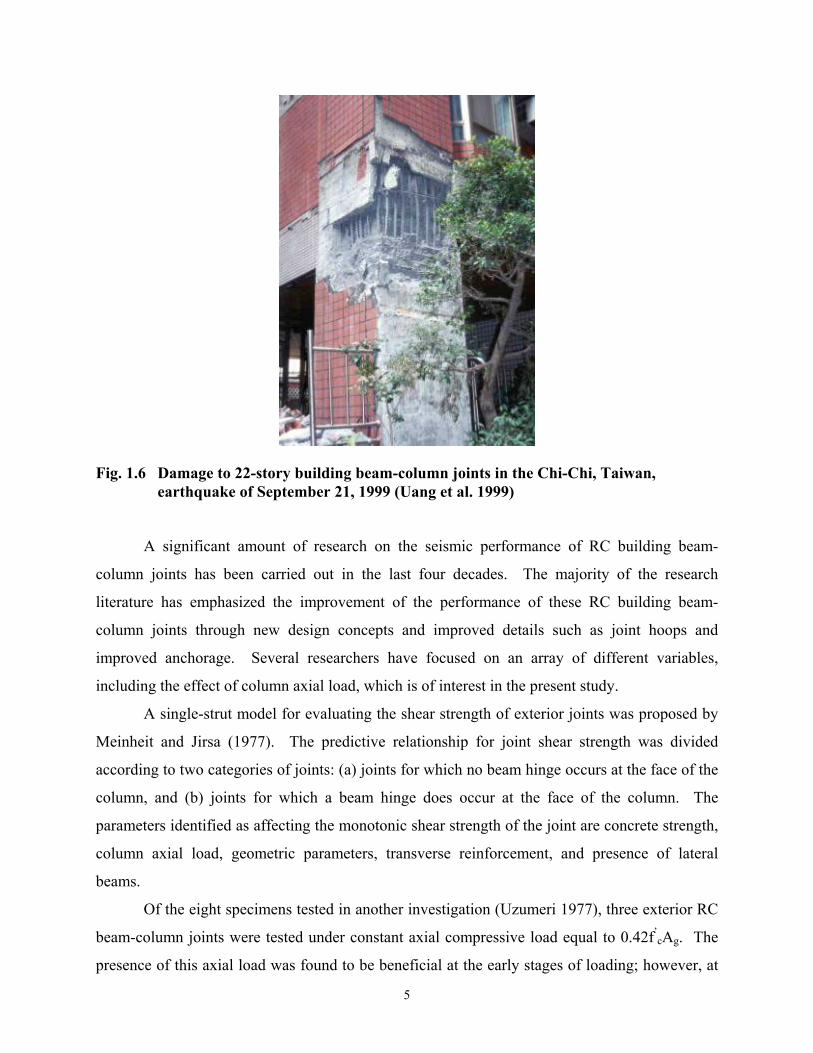
Fig. 1.6 Damage to 22-story building beam-column joints in the Chi-Chi, Taiwan,
earthquake of September 21, 1999..................................................................................5
Fig. 2.1 Test units 1 and 2: dimensions and reinforcement details ...........................................11
Fig. 2.2 Test units 3 and 4: dimensions and reinforcement details ............................................12
Fig. 2.3 Test units 5 and 6: dimensions and reinforcement details ............................................13
Fig. 2.4 Beam cross section........................................................................................................14
Fig. 2.5 Column cross section ....................................................................................................15
Fig. 3.1 Test units 1 and 2: strain gage locations .......................................................................17
Fig. 3.2 Test units 3 and 4: strain gage locations .......................................................................18
Fig. 3.3 Test units 5 and 6: strain gage locations .......................................................................19
Fig. 3.4 Test setup ......................................................................................................................20
Fig. 3.5 Typical loading pattern .................................................................................................22
Fig. 4.1 Unit 1: lateral load versus drift ratio .............................................................................24
Fig. 4.2 Unit 1: moment-rotation and moment-plastic-rotation envelopes ................................25
Fig. 4.3 Unit 1: variation of axial compression column load .....................................................26
Fig. 4.4 Unit 1: cumulative energy dissipation...........................................................................27
Fig. 4.5 Unit 1: joint shear stress versus joint shear strain .........................................................27
Fig. 4.6 Unit 2: lateral load versus drift ratio .............................................................................28
Fig. 4.7 Unit 2: moment-rotation and moment-plastic-rotation envelopes ................................29
Fig. 4.8 Unit 2: variation of axial compression column load .....................................................30
viii
Fig. 4.9 Unit 2: cumulative energy dissipation...........................................................................31
Fig. 4.10 Unit 3: lateral load versus drift ratio .............................................................................32
Fig. 4.11 Unit 3: moment-rotation and moment-plastic-rotation envelopes ................................33
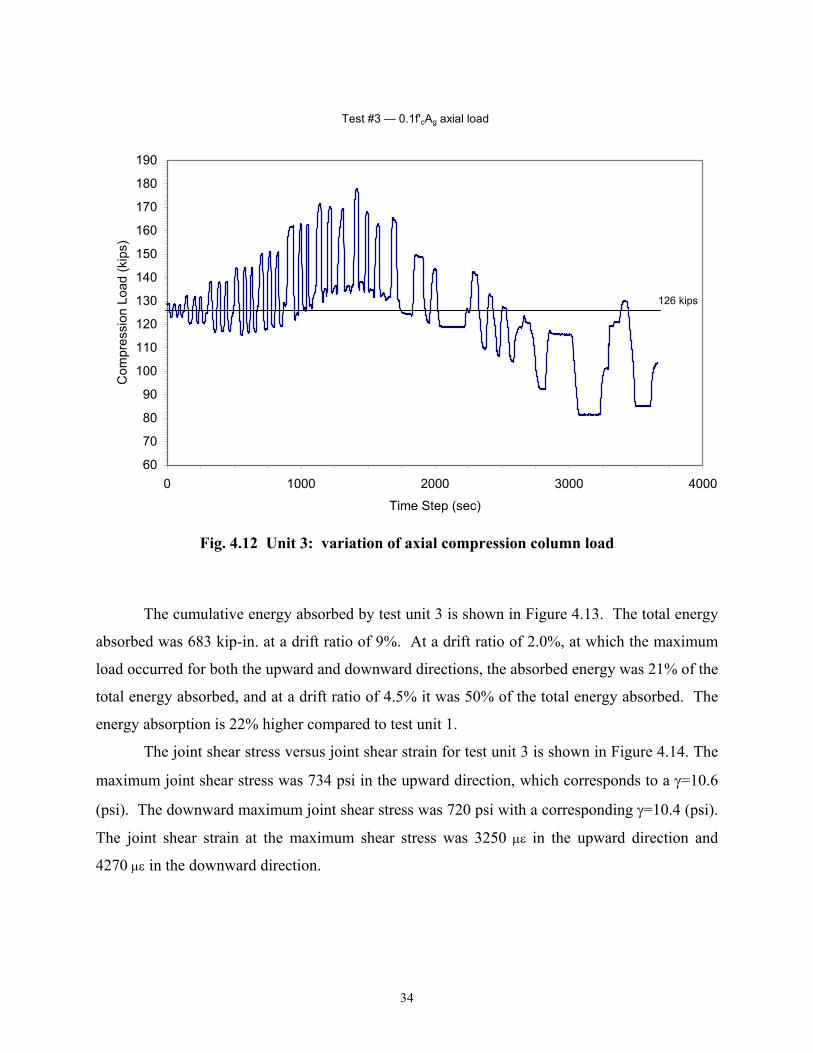
Fig. 4.12 Unit 3: variation of axial compression column load .....................................................34
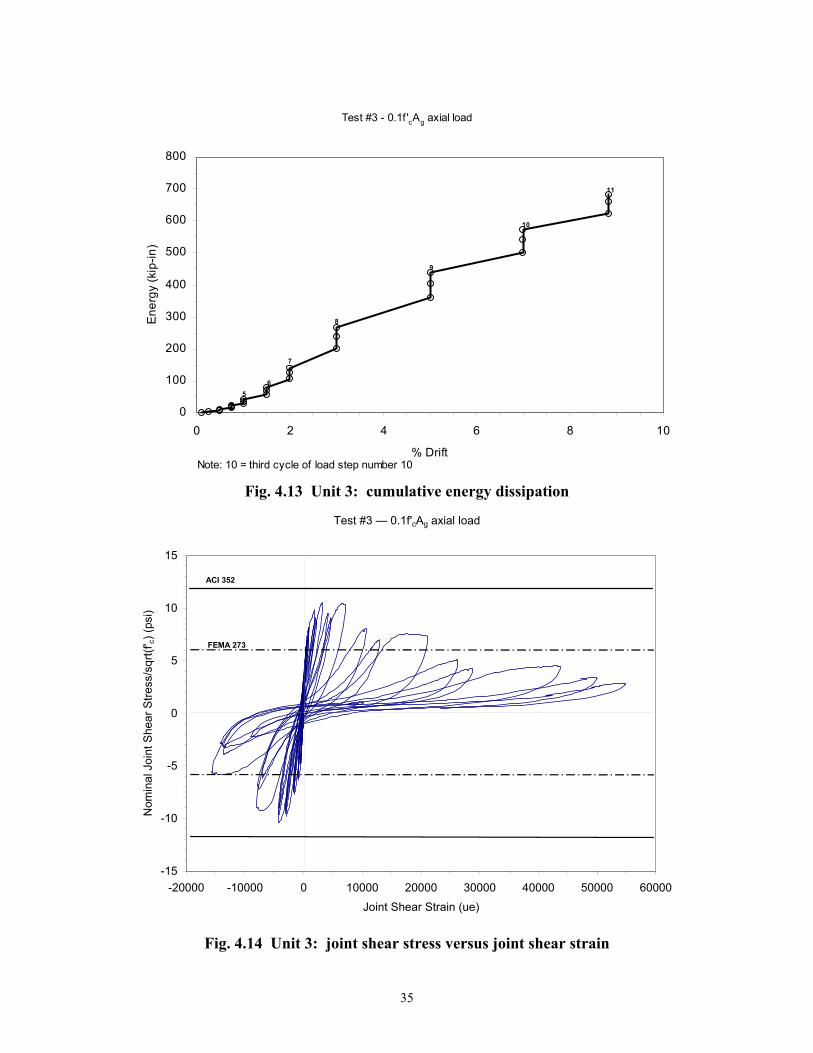
Fig. 4.13 Unit 3: cumulative energy dissipation...........................................................................35
Fig. 4.14 Unit 3: joint shear stress versus joint shear strain .........................................................35
Fig. 4.15 Unit 4: lateral load versus drift ratio .............................................................................36
Fig. 4.16 Unit 4: moment-rotation and moment-plastic-rotation envelopes ................................37
Fig. 4.17 Unit 4: variation of axial compression column load .....................................................38
Fig. 4.18 Unit 4: cumulative energy dissipation...........................................................................39
Fig. 4.19 Unit 4: joint shear stress versus joint shear strain .........................................................39
Fig. 4.20 Unit 5: lateral load versus drift ratio .............................................................................40
Fig. 4.21 Unit 5: moment-rotation and moment-plastic-rotation envelopes ................................41
Fig. 4.22 Unit 5: variation of axial compression column load .....................................................42
Fig. 4.23 Unit 5: cumulative energy dissipation...........................................................................43
Fig. 4.24 Unit 5: joint shear stress versus joint shear strain .........................................................43
Fig. 4.25 Unit 6: lateral load versus drift ratio .............................................................................44
Fig. 4.26 Unit 6: moment-rotation and moment-plastic-rotation envelopes ................................45
Fig. 4.27 Unit 6: variation of axial compression column load .....................................................46
Fig. 4.28 Unit 6: cumulative energy dissipation...........................................................................47
Fig. 4.29 Unit 6: joint shear stress versus joint shear strain .........................................................47
Fig. 5.1 Test #1: performance level identification curve............................................................65
Fig. 5.2 Test #1: photo documentation of performance levels ...................................................65
Fig. 5.3 Test #2: performance level identification curve............................................................66
Fig. 5.4 Test #2: photo documentation of performance levels ...................................................66
Fig. 5.5 Test #3: performance level identification curve............................................................67
Fig. 5.6 Test #3: photo documentation of performance levels ...................................................67
Fig. 5.7 Test #4: performance level identification curve............................................................68
Fig. 5.8 Test #4: photo documentation of performance levels ...................................................68
Fig. 5.9 Test #5: performance level identification curve............................................................69
Fig. 5.10 Test #5: photo documentation of performance levels ...................................................69
Fig. 5.11 Test #6: performance level identification curve............................................................70

ix
Fig. 5.12 Test #6: photo documentation of performance levels ...................................................70
Fig. 5.13 Unit 2: plastic rotation versus bottom beam bar pullout ...............................................71
Fig. 5.14 Unit 3: plastic rotation versus bottom beam bar pullout ...............................................72
Fig. 5.15 Unit 4: plastic rotation versus bottom beam bar pullout ...............................................73
Fig. 5.16 FEMA modeling parameters .........................................................................................74
Fig. 5.17 Limit states model for exterior joint units 1 and 2........................................................76
Fig. 5.18 Crack width model for exterior joint units 1 and 2 .......................................................76
Fig. 5.19 Limit states model for exterior joint units 3, 4, 5, and 6 ...............................................77
Fig. 5.20 Crack width model for exterior joint units 3, 4, 5, and 6 ..............................................78
Fig. 5.21 FEMA 273 generalized deformation relation ...............................................................79
Fig. 5.22 Proposed generalized deformation relations for exterior beam-column joints .............80
Fig. 5.23 Bond-slip behavior of unit 1 and unit 2 ........................................................................81
Fig. 5.24 Shear behavior of units 3, 4, 5, and 6............................................................................81
Fig. 6.1 Joint detail for test unit 6...............................................................................................86
Fig. 6.2 Test setup ......................................................................................................................87
Fig. 6.3 Discontinuity region......................................................................................................88
Fig. 6.4 Truss model...................................................................................................................89
Fig. 6.5 Member and joint numbers of strut-and-tie model .......................................................90
Fig. 6.6 Comparison of truss model to actual joint cracks .........................................................91
Fig. 6.7 Strut-and-tie-model failure mode showing strut widths ...............................................95
xi
LIST OF TABLES
Table 2.1 Concrete compressive strength of test units and level of axial load..........................10
Table 2.2 Steel reinforcement strength......................................................................................10
Table 2.3 Comparison of steel details to current ACI code.......................................................15
Table 4.1 Beam and column theoretical flexural capacity and flexural strength ratio ..............23
Table 4.2 Theoretical and actual beam moment capacities .......................................................48
Table 5.1 Test #1 performance parameters (0.1f’cAg) up direction...........................................51
Table 5.2 Test #1 performance parameters (0.1f’cAg) down direction......................................52
Table 5.3 Test #2 performance parameters (0.25f’cAg) up direction.........................................53
Table 5.4 Test #2 performance parameters (0.25f’cAg) down direction....................................54
Table 5.5 Test #3 performance parameters (0.1f’cAg) up direction...........................................55
Table 5.6 Test #3 performance parameters (0.1f’cAg) down direction......................................56
Table 5.7 Test #4 performance parameters (0.25f’cAg) up direction.........................................57
Table 5.8 Test #4 performance parameters (0.25f’cAg) down direction....................................58
Table 5.9 Test #5 performance parameters (0.1f’cAg) up direction...........................................59
Table 5.10 Test #5 performance parameters (0.1f’cAg) down direction......................................60
Table 5.11 Test #6 performance parameters (0.25f’cAg) up direction.........................................61
Table 5.12 Test #6 performance parameters (0.25f’cAg) down direction....................................62
Table 5.13 Test #1 performance levels (0.1f’cAg) .......................................................................65
Table 5.14 Test #2 performance levels (0.25f’cAg) .....................................................................66
Table 5.15 Test #3 performance levels (0.1f’cAg) .......................................................................67
Table 5.16 Test #4 performance levels (0.25f’cAg) .....................................................................68
Table 5.17 Test #5 performance levels (0.1f’cAg) .......................................................................69
Table 5.18 Test #6 performance levels (0.25f’cAg) .....................................................................70
Table 5.19 Modeling parameters for test units in comparison with FEMA 273 .........................74
Table 5.20 Modeling parameters for exterior beam-column joints with nonconforming
details.........................................................................................................................82
Table 5.21 Proposed modeling parameters for exterior beam-column joints with non-
conforming details .....................................................................................................83
Table 6.1 Member forces and strut widths based on ultimate lateral beam load ......................92
1 Introduction
Distress in beam-column joints leading to building collapse has been observed in past
earthquakes (Moehle and Mahin 1991); the cause of collapse has been attributed to inadequate
joint confinement. Observations of damage after the 1995 Hyogo-ken Nanbu, Japan, earthquake
indicated that some reinforced concrete (RC) buildings designed before the mid-1970s may have
serious structural deficiencies; these deficiencies are a consequence of a lack of capacity design
approach and/or poor detailing of reinforcement (Park et al. 1995). In more recent earthquakes,
the inadequacy of building joints designed according to earlier rather than more current
standards was cause for severe damage or collapse. Characteristically, in 1999 reconnaissance
reports from the Tehuacan, Mexico, earthquake of June 15, 1999 (EERI 1999a), the Izmit,
Turkey, earthquake of August 17, 1999 (Sezen et al. 2000), the Athens, Greece, earthquake of
September 7, 1999 (EERI 1999b), and the Chi-Chi Taiwan, earthquake of September 21, 1999
(Uang et al. 1999, EERI 1999c) show that all four earthquakes involved seismic damage to RC
building joints with substandard details.
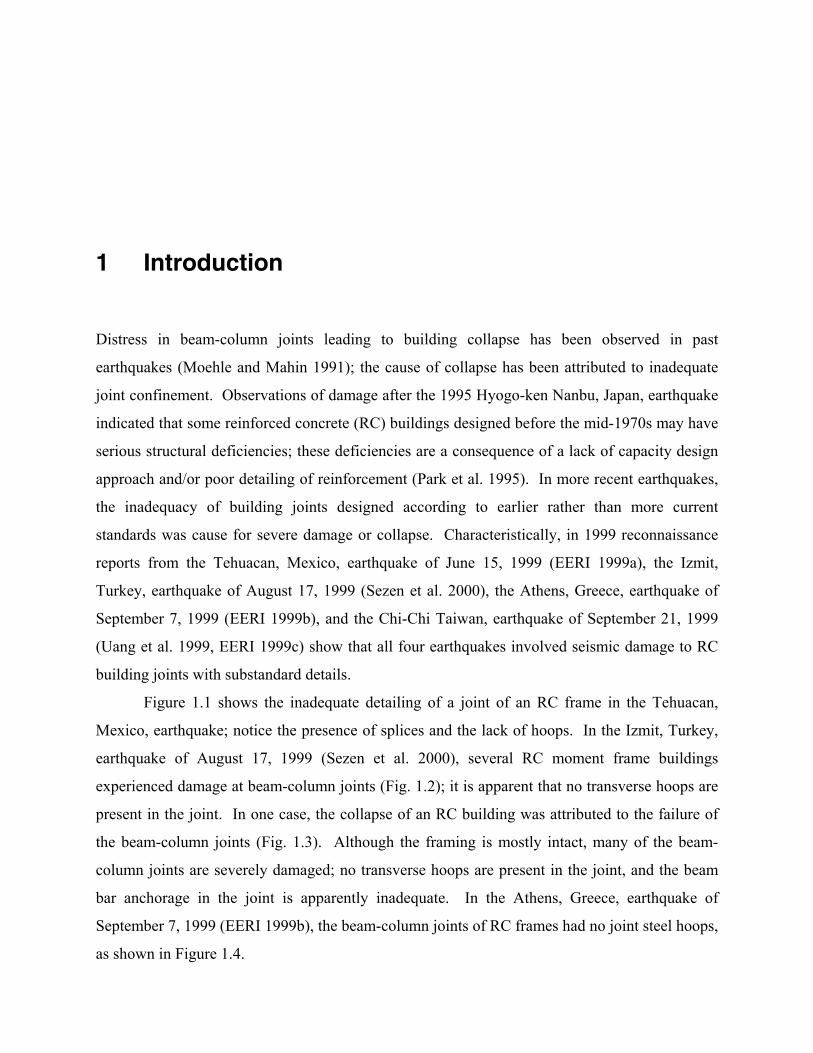
Figure 1.1 shows the inadequate detailing of a joint of an RC frame in the Tehuacan,
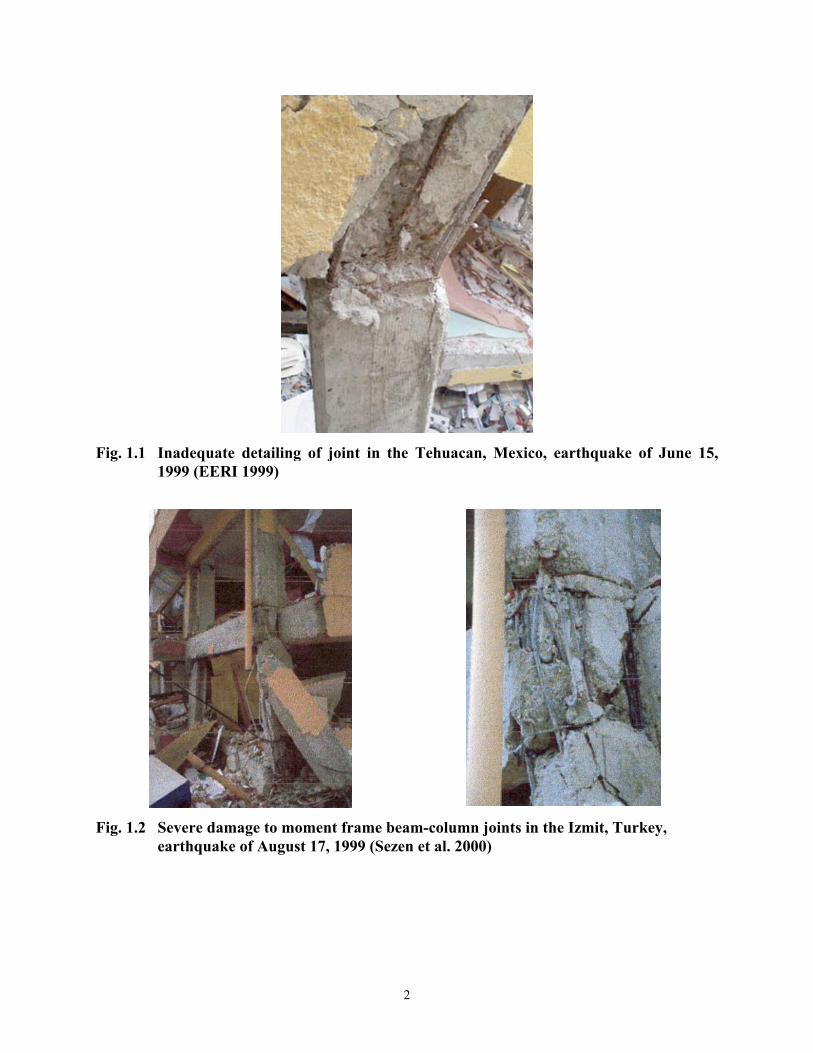
Mexico, earthquake; notice the presence of splices and the lack of hoops. In the Izmit, Turkey,
earthquake of August 17, 1999 (Sezen et al. 2000), several RC moment frame buildings
experienced damage at beam-column joints (Fig. 1.2); it is apparent that no transverse hoops are
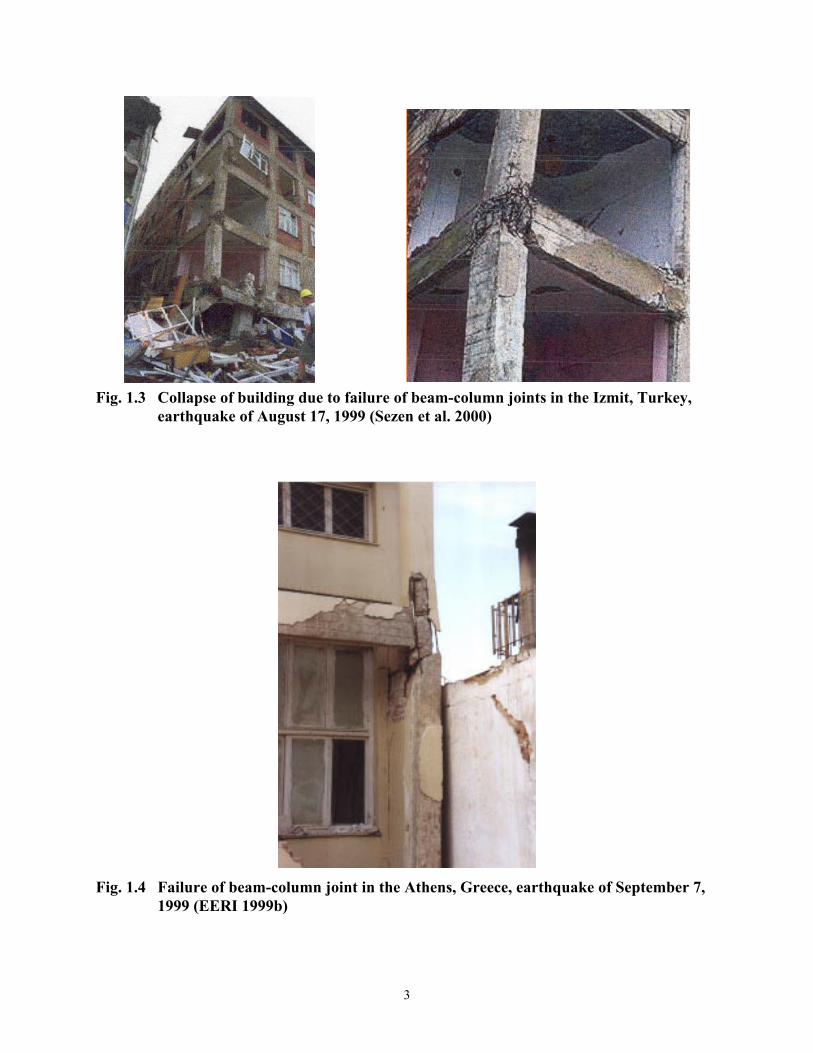
present in the joint. In one case, the collapse of an RC building was attributed to the failure of
the beam-column joints (Fig. 1.3). Although the framing is mostly intact, many of the beam-
column joints are severely damaged; no transverse hoops are present in the joint, and the beam
bar anchorage in the joint is apparently inadequate. In the Athens, Greece, earthquake of
September 7, 1999 (EERI 1999b), the beam-column joints of RC frames had no joint steel hoops,
as shown in Figure 1.4.
2
Fig. 1.1 Inadequate detailing of joint in the Tehuacan, Mexico, earthquake of June 15,
1999 (EERI 1999)
Fig. 1.2 Severe damage to moment frame beam-column joints in the Izmit, Turkey, earthquake of August 17, 1999 (Sezen et al. 2000)
3
Fig. 1.3 Collapse of building due to failure of beam-column joints in the Izmit, Turkey,
earthquake of August 17, 1999 (Sezen et al. 2000)
Fig. 1.4 Failure of beam-column joint in the Athens, Greece, earthquake of September 7,
1999 (EERI 1999b)
4
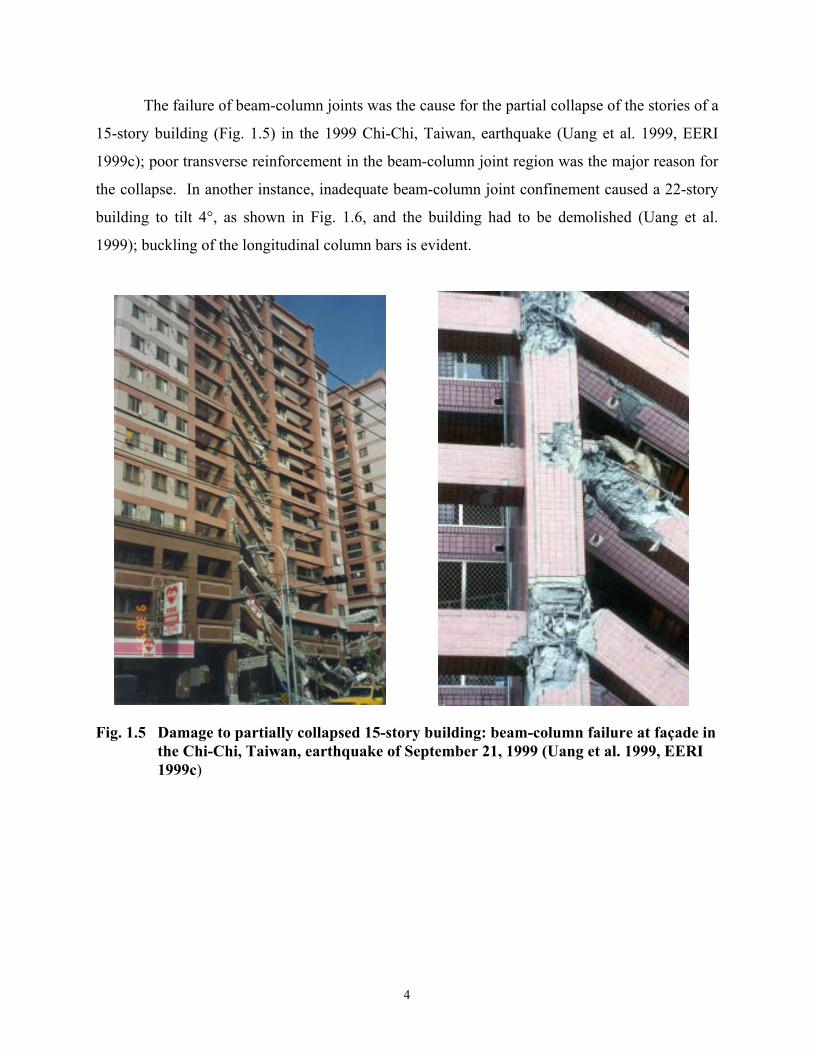
The failure of beam-column joints was the cause for the partial collapse of the stories of a
15-story building (Fig. 1.5) in the 1999 Chi-Chi, Taiwan, earthquake (Uang et al. 1999, EERI
1999c); poor transverse reinforcement in the beam-column joint region was the major reason for
the collapse. In another instance, inadequate beam-column joint confinement caused a 22-story
building to tilt 4°, as shown in Fig. 1.6, and the building had to be demolished (Uang et al.
1999); buckling of the longitudinal column bars is evident.
Fig. 1.5 Damage to partially collapsed 15-story building: beam-column failure at façade in the Chi-Chi, Taiwan, earthquake of September 21, 1999 (Uang et al. 1999, EERI 1999c)
5
Fig. 1.6 Damage to 22-story building beam-column joints in the Chi-Chi, Taiwan, earthquake of September 21, 1999 (Uang et al. 1999)
A significant amount of research on the seismic performance of RC building beam-
column joints has been carried out in the last four decades. The majority of the research
literature has emphasized the improvement of the performance of these RC building beam-
column joints through new design concepts and improved details such as joint hoops and
improved anchorage. Several researchers have focused on an array of different variables,
including the effect of column axial load, which is of interest in the present study.
A single-strut model for evaluating the shear strength of exterior joints was proposed by
Meinheit and Jirsa (1977). The predictive relationship for joint shear strength was divided
according to two categories of joints: (a) joints for which no beam hinge occurs at the face of the
column, and (b) joints for which a beam hinge does occur at the face of the column. The
parameters identified as affecting the monotonic shear strength of the joint are concrete strength,
column axial load, geometric parameters, transverse reinforcement, and presence of lateral
beams.
Of the eight specimens tested in another investigation (Uzumeri 1977), three exterior RC
beam-column joints were tested under constant axial compressive load equal to 0.42f’cAg. The
presence of this axial load was found to be beneficial at the early stages of loading; however, at
6
the latter stages when the concrete joint core acts as a series of struts, it was postulated that the
large axial load might be detrimental rather than helpful. The three specimens were not
reinforced in the joint area; two of the specimens contained a transverse stub beam on one side
of the column, whereas the third specimen had no transverse beams. Load reversals after bond
loss caused large deformations in the concrete, which resulted in splitting along column bars and
anchorage failure of the beam steel. In all three cases, the beam remained intact while the joint
rapidly deteriorated with increasing imposed displacements. The joints without transverse
reinforcement were able to provide anchorage for the beam steel to the extent that between 92%
and 98% of the theoretical ultimate moment capacity of the beams was reached. The joint was
unable, however, to sustain the anchorage of the beam steel in cycles subsequent to this load
level.
An experimental study of three exterior beam-column joints indicates that horizontal
joint shear reinforcement may be reduced considerably (Paulay and Scarpas 1981). The amount
of shear reinforcement varied between units; however, the vertical shear reinforcement (i.e.,
intermediate column bars) was the same in all units. The effect of the axial load was studied in
one of the units when it was reduced from 0.15f’cAg to 0.075f’
cAg; this resulted in a dramatic
reduction of the stiffness, strength, and energy dissipation of the specimen in the subsequent
loading cycle.
Ehsani and Wight presented the results of six exterior RC beam-column subassemblages
that were tested in cyclic loading (1985). It was determined that in order to avoid the formation
of plastic hinges in the joint, the flexural strength ratio should be no less than 1.4. The
maximum joint shear stress in exterior connections should be limited to 12√f’c (psi) to reduce
excessive joint damage, column bar slippage, and beam bar pullout. It was found that in cases
where the flexural strength ratio, the joint shear stress, or the anchorage requirements are
significantly more conservative than the limits of the recommendations, the amount of joint
transverse reinforcement could be safely reduced.
Limited experimental evidence suggests that increasing the column axial load tends to
reduce the total lateral drift at yield (Kurose 1987). Although some researchers report that
increased column axial load results in increased shear strength of joints without reinforcement,
the data do not show a significant trend (Beres et al. 1992).
7
Bond and anchorage of bars in RC beam-column joints was studied by Kaku and
Asakusa (1991). It was shown that the consequences of bond deterioration included pinching of
the force story-drift hysteresis curves, increasing the slip deformation at the beam-column
interface, changing the shear transfer mechanism in the joint core, and decreasing the flexural
strength of the adjoining members.
Pantazapoulou and Bonacci investigated the mechanics of beam-column joints in
laterally loaded frames (1992). Their formulation established the compatibility of the strain and
stress equilibrium. It was shown that the shear strength of a joint depends on the usable
compressive strength of concrete. It was concluded that joint shear strength could decrease with
increasing column axial load, and that in addition to bond failure, joint capacity could be limited
by crushing along the principal diagonal or by yielding of the vertical reinforcement after hoop
reinforcement yielding.
The effect of the column axial load was also investigated in an analytical study of 57
exterior beam-column joint tests (Pantazapoulou and Bonacci 1994). The relationship between
maximum joint shear stress and nominal column axial stress (normalized by f’c) was sought with
respect to hinging and shear failures. For the limited amount of available experimental data, no
discernible correlation was established between the two variables. It was concluded that
deformability, rather than strength, would be affected by axial load. In the same study, a finite
element model was developed to study the effect of several parameters on the shear behavior of
interior and exterior joints.
In a recent study by Clyde et al. (2000), four half-scale RC exterior joints were tested to
investigate their behavior in a shear-critical failure mode. The joints were typical of building
frames with nonductile details in the beam-column joints. The joints were subjected to quasi-
static cyclic loading, and their performance was examined in terms of lateral load capacity, drift
ratio, axial load reduction in the column at high drift ratios, joint shear strength, ductility, shear
deformation angle of the joint, and residual strength. Two levels of axial compressive column
load were investigated to determine how this variable might influence the performance of the
joint. Specific performance levels for this type of RC joint were established and a comparison
was made to current design and rehabilitation standards. A limit states model was established,
which could be used for performance evaluation or seismic rehabilitation.
More recently, Hakuto et al. (2000) performed simulated seismic load tests on RC one-
way interior and exterior beam-column joints with substandard reinforcing details typical of
8
buildings constructed before the 1970s. The exterior beam-column joints contained very little
transverse reinforcement in the members and the joint core. In one beam-column joint unit the
hooks at the end of the beam top bars were bent up and the hooks at the ends of the bottom bars
were bent down. In the other beam-column joint unit the hooks at the ends of the bars were bent
into the joint as in current practice. The improvement in performance of the joint with beam bars
anchored according to current practice was demonstrated.
The emphasis of the present study was the evaluation of the seismic performance of
exterior joints in existing nonductile one-way RC building frames with three different details of
beam and beam-column joint reinforcement. These reinforcement details were selected to satisfy
the 1963 ACI Code (ACI 1963), but do not satisfy current provisions such as the ACI 352
Committee Report (ACI 1991). A total of six test units were tested. All of the test units had top
bars bent into the joints with a 180° hook; two of the test units had bottom bars extending only 6
in. into the joint, two test units had the bottom bars extending all the way into the joint, and the
remaining two test units had bottom bars bent up into the joint with a 180° hook. The details of
the reinforcement are somewhat typical of buildings built before the 1970s and are substandard
according to current codes. These details can also be found in areas of the world where seismic
forces are not the governing load condition. In the present study, two levels of axial
compression load were investigated for each of the three details: 10% and 25% of the axial
column capacity in compression.
2 Test Units
2.1 DESCRIPTION OF TEST UNITS
The six test units were full-scale models of typical exterior beam-column joints in RC buildings
found in the United States before 1970. The longitudinal and transverse reinforcement in the
beam and the column transverse steel was increased to prevent early degradation of the beam and
column, forcing a shear mode of failure in the joint. There is no transverse reinforcement within
the joint core, and the beam longitudinal bottom bars did not have adequate embedment into the
joint. In addition, the confining reinforcement details are inadequate according to current criteria
(ACI 352, 1991).
2.2 MATERIAL PROPERTIES
2.2.1 Concrete
The original design of the test units called for a concrete compressive strength of 4000 psi (27.6
MPa). Test units with identical reinforcement were cast from the same batch to eliminate
variations between them. Care was taken to ensure that each batch met the mix design such that
all six test units had comparable strengths. Table 2.1 shows the concrete compressive strength of
each test unit obtained from the average of three 6x12 in. cylinders; in addition, the test units are
identified according to the level of axial compressive load, P, in the columns, expressed as a
fraction of the axial load capacity, f′c Ag.
10
Table 2.1 Concrete compressive strength of test units and level of axial load
Test Unit
F′c psi (Mpa)
gc AfP'
1 4794 (33.1) 0.10 2 4794 (30.2) 0.25 3 4934 (34.0) 0.10 4 4934 (31.6) 0.25 5 4596 (31.7) 0.10 6 4596 (31.0) 0.25
2.2.2 Steel Reinforcement
Three sizes of deformed steel rebar were used for reinforcement in the test units. The column
steel included #8 bars as longitudinal reinforcement with #3 hoops. The beam used #9
longitudinal bars as well as #3 bars for stirrups. The ultimate (Fu) and yield (Fy) strengths of
reinforcement used in the tests are shown in Table 2.2 below.
Table 2.2 Steel reinforcement strength Reinforcement Type Bar Size Fu (ksi) Fy (ksi) Beam longitudinal 9 110.4 66.5
Column longitudinal 8 107.6 68.1 Stirrups/ties 3 94.9 62.0
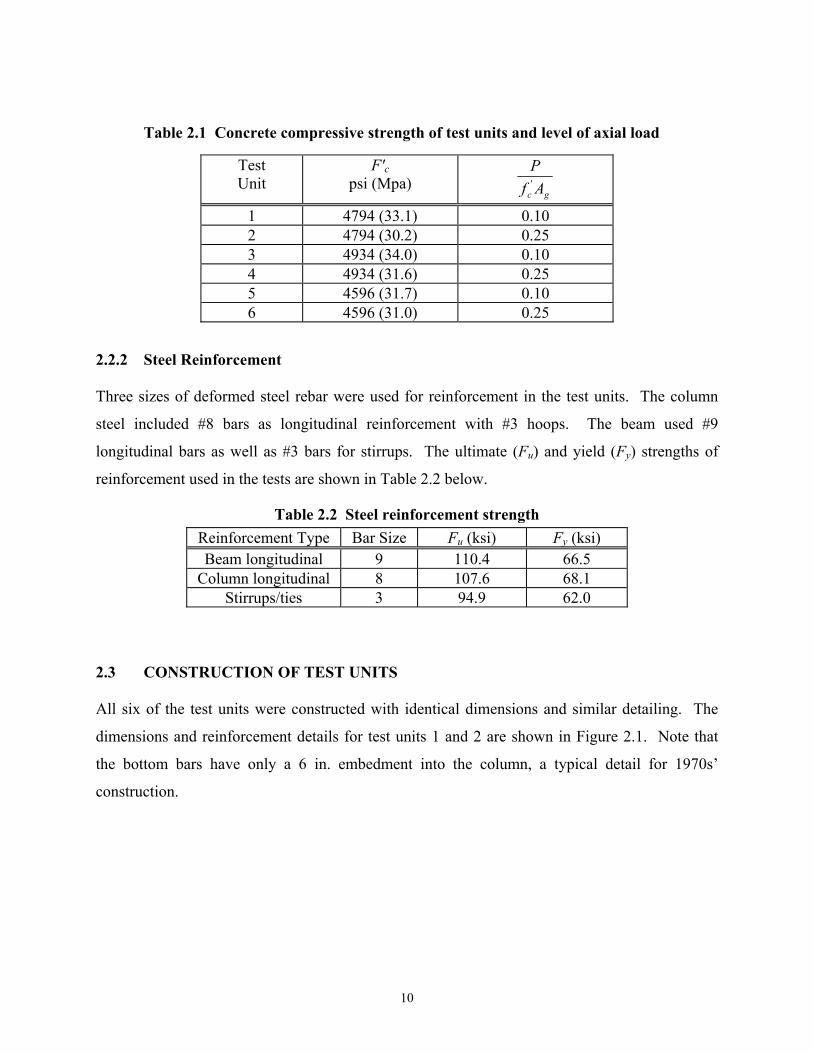
2.3 CONSTRUCTION OF TEST UNITS
All six of the test units were constructed with identical dimensions and similar detailing. The
dimensions and reinforcement details for test units 1 and 2 are shown in Figure 2.1. Note that
the bottom bars have only a 6 in. embedment into the column, a typical detail for 1970s’
construction.
11
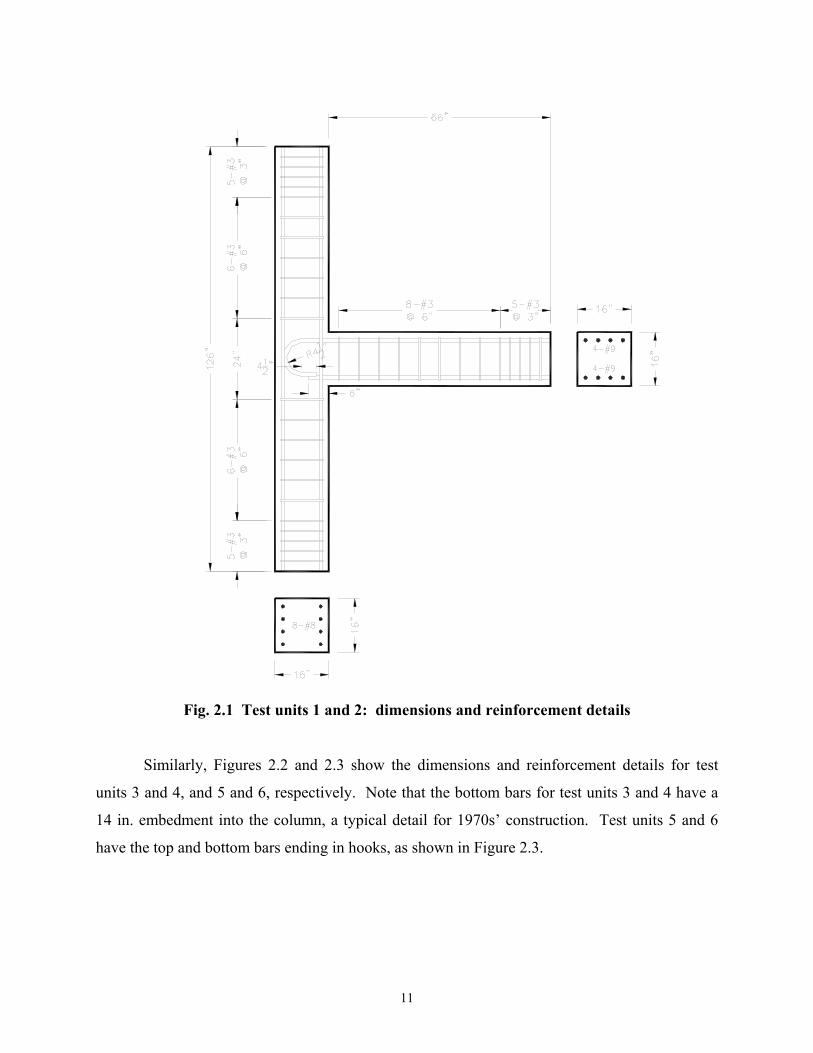
Fig. 2.1 Test units 1 and 2: dimensions and reinforcement details
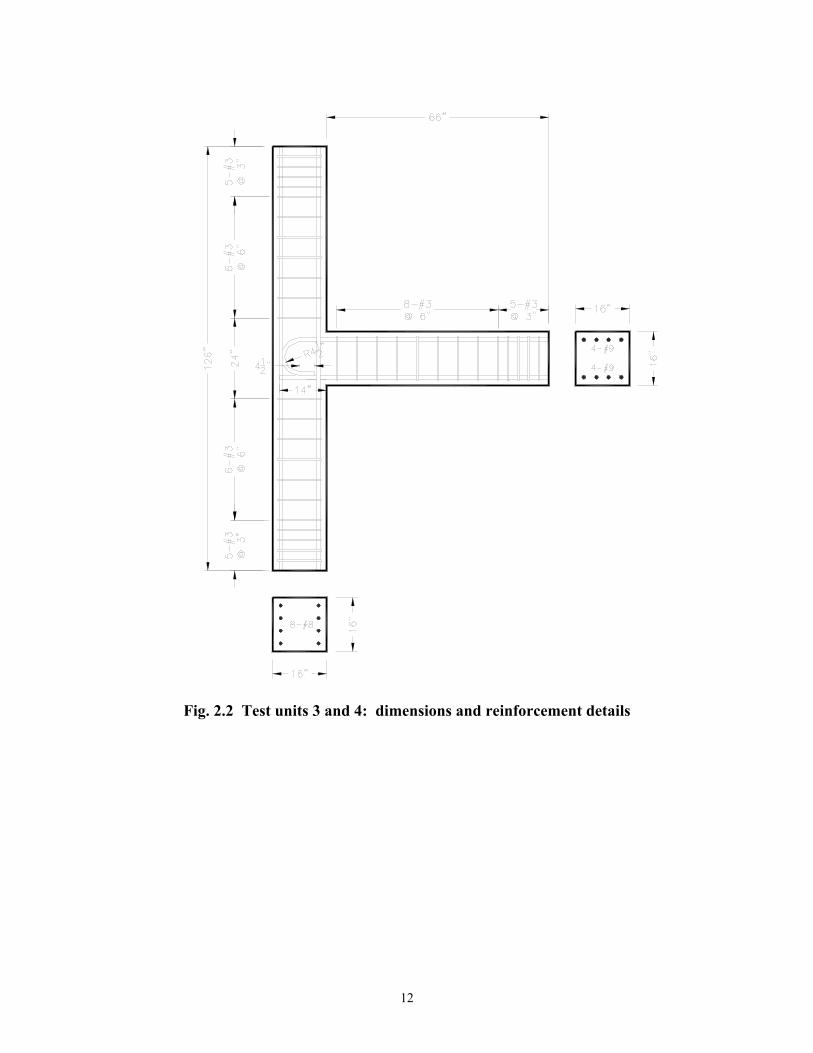
Similarly, Figures 2.2 and 2.3 show the dimensions and reinforcement details for test
units 3 and 4, and 5 and 6, respectively. Note that the bottom bars for test units 3 and 4 have a
14 in. embedment into the column, a typical detail for 1970s’ construction. Test units 5 and 6
have the top and bottom bars ending in hooks, as shown in Figure 2.3.
12
Fig. 2.2 Test units 3 and 4: dimensions and reinforcement details
13
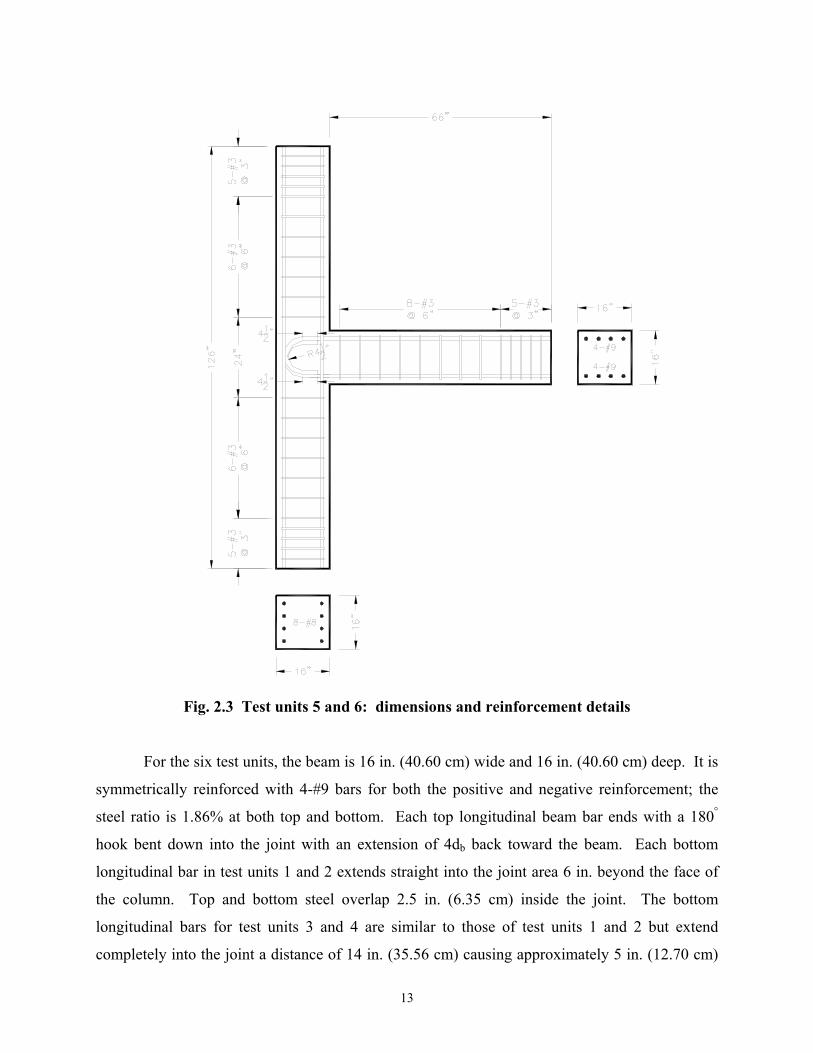
Fig. 2.3 Test units 5 and 6: dimensions and reinforcement details
For the six test units, the beam is 16 in. (40.60 cm) wide and 16 in. (40.60 cm) deep. It is
symmetrically reinforced with 4-#9 bars for both the positive and negative reinforcement; the
steel ratio is 1.86% at both top and bottom. Each top longitudinal beam bar ends with a 180°
hook bent down into the joint with an extension of 4db back toward the beam. Each bottom
longitudinal bar in test units 1 and 2 extends straight into the joint area 6 in. beyond the face of
the column. Top and bottom steel overlap 2.5 in. (6.35 cm) inside the joint. The bottom
longitudinal bars for test units 3 and 4 are similar to those of test units 1 and 2 but extend
completely into the joint a distance of 14 in. (35.56 cm) causing approximately 5 in. (12.70 cm)

14
of overlap. The bottom longitudinal bars in test units 5 and 6 end with a 180° hook bent up into
the joint with an extension of 4db back toward the beam. This allows complete overlapping of
hooks and extensions inside the joint. The transverse reinforcement in the beam consists of two
stirrups. A #3 bar closed stirrup encloses the four corner bars and ends with a 145° bend and a
2.5 in. (6.35 cm) extension for both ends. A #3 bar open stirrup wraps around the four inside
bars and ends with a 180° bend and a 2.5 in. (6.35 cm) extension for both ends as shown in
Figure 2.4. These two stirrups are tied together and are spaced at 6 in. (15.24 cm) along the
beam except within 15 in. (38.10 cm) of the beam end where the spacing is reduced by half to 3
in. (7.62 cm). The closer spacing is intended to give adequate strength at the location where the
force is applied during the test.
Fig. 2.4 Beam cross section
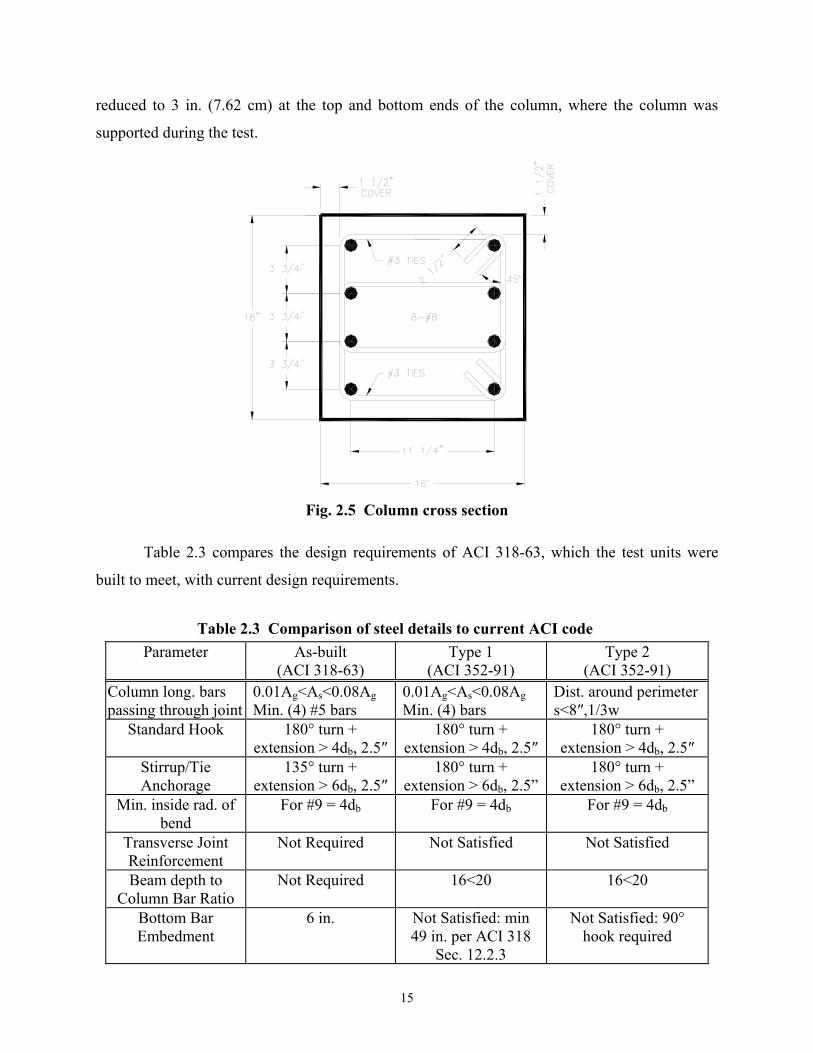
For the six test units, the column is 16 in. (40.60 cm) wide and 16 in. (40.60 cm) deep. It
is reinforced with 4-#8 longitudinal bars on the beam-column face and another 4-#8 bars on the
opposite face, giving a steel ratio of 2.47%. The longitudinal steel extends continuously from
bottom to top of column. The transverse reinforcement in the column consists of 2-#3 bar closed
stirrups each ending with 145° bends and 2.5 in. (6.35 cm) extensions for both ends, as shown in
Figure 2.5. The stirrups are spaced at 6 in. (15.24 cm) along the height of the column except
within the joint region where no transverse steel is present. Spacing of the transverse steel is
15
reduced to 3 in. (7.62 cm) at the top and bottom ends of the column, where the column was
supported during the test.
Fig. 2.5 Column cross section
Table 2.3 compares the design requirements of ACI 318-63, which the test units were
built to meet, with current design requirements.
Table 2.3 Comparison of steel details to current ACI code Parameter As-built
(ACI 318-63) Type 1
(ACI 352-91) Type 2
(ACI 352-91) Column long. bars passing through joint
0.01Ag<As<0.08Ag Min. (4) #5 bars
0.01Ag<As<0.08Ag Min. (4) bars
Dist. around perimeter s<8″,1/3w
Standard Hook 180° turn + extension > 4db, 2.5″
180° turn + extension > 4db, 2.5″
180° turn + extension > 4db, 2.5″
Stirrup/Tie Anchorage
135° turn + extension > 6db, 2.5″
180° turn + extension > 6db, 2.5”
180° turn + extension > 6db, 2.5”
Min. inside rad. of bend
For #9 = 4db For #9 = 4db For #9 = 4db
Transverse Joint Reinforcement
Not Required Not Satisfied Not Satisfied
Beam depth to Column Bar Ratio
Not Required 16<20 16<20
Bottom Bar Embedment
6 in. Not Satisfied: min 49 in. per ACI 318
Sec. 12.2.3
Not Satisfied: 90° hook required

16
The standard 180° hooks in the 1963 code currently have identical requirements. The
joints have no transverse hoop reinforcement, which was not required according to the 1963 ACI
Code, but which violates recommendations according to the 1991 ACI 352 recommendations. In
addition, the beam depth to column bar ratio is substandard according to the 1991 ACI 352
recommendation of being at least equal to 20. It should also be noted from Figure 2.5 that the
column has inferior detailing regarding the distribution of the column bars, since two of the faces
of the joint do not contain any column bars. This affects the confinement of the joint concrete in
an adverse manner.
The test unit reinforcement cages were constructed according to Figures 2.1 through 2.5
over a period of several weeks and cast in place in pairs within two weeks. A high-frequency
vibrator was used to consolidate the concrete, and trowels were used to finish the concrete
allowing a smooth surface for crack mapping. Each test unit was allowed to cure for at least 72
hours before they were removed from the forms.
3 Test Setup
3.1 INSTRUMENTATION
3.1.1 Strain Gages
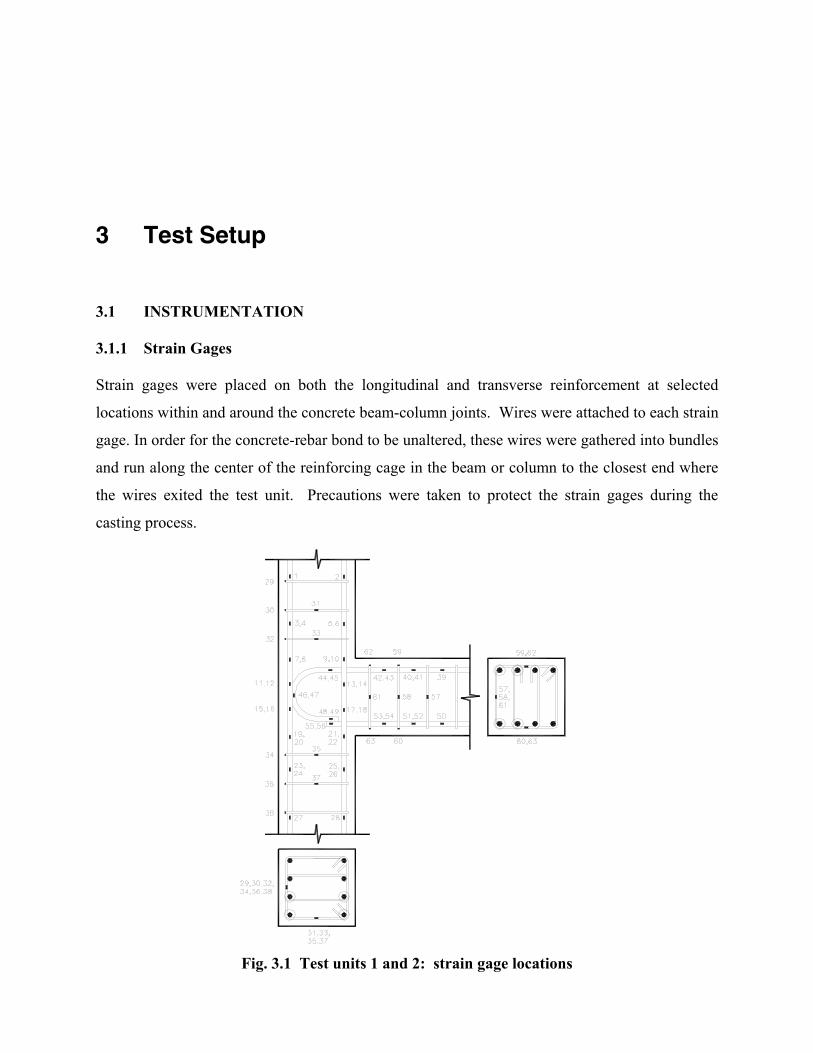
Strain gages were placed on both the longitudinal and transverse reinforcement at selected
locations within and around the concrete beam-column joints. Wires were attached to each strain
gage. In order for the concrete-rebar bond to be unaltered, these wires were gathered into bundles
and run along the center of the reinforcing cage in the beam or column to the closest end where
the wires exited the test unit. Precautions were taken to protect the strain gages during the
casting process.
Fig. 3.1 Test units 1 and 2: strain gage locations
18
Figure 3.1 shows the locations of the strain gages for test units 1 and 2. A total of 63
strain gages were applied to each of these test units. Most of the strain gages were applied on the
longitudinal bars closest to the front face of the test unit. A few were applied on the second set
of longitudinal bars to add redundancy. The numbering pattern for all test units begins on the top
of the column on the longitudinal bars and works its way down to the bottom of the column. It
then starts again from the top of the column on the horizontal hoops and continues to the bottom
of the column. Next, the numbering goes to the top longitudinal beam bars, from outside the
joint toward the end of the bar inside the joint.
Fig. 3.2 Test units 3 and 4: strain gage locations
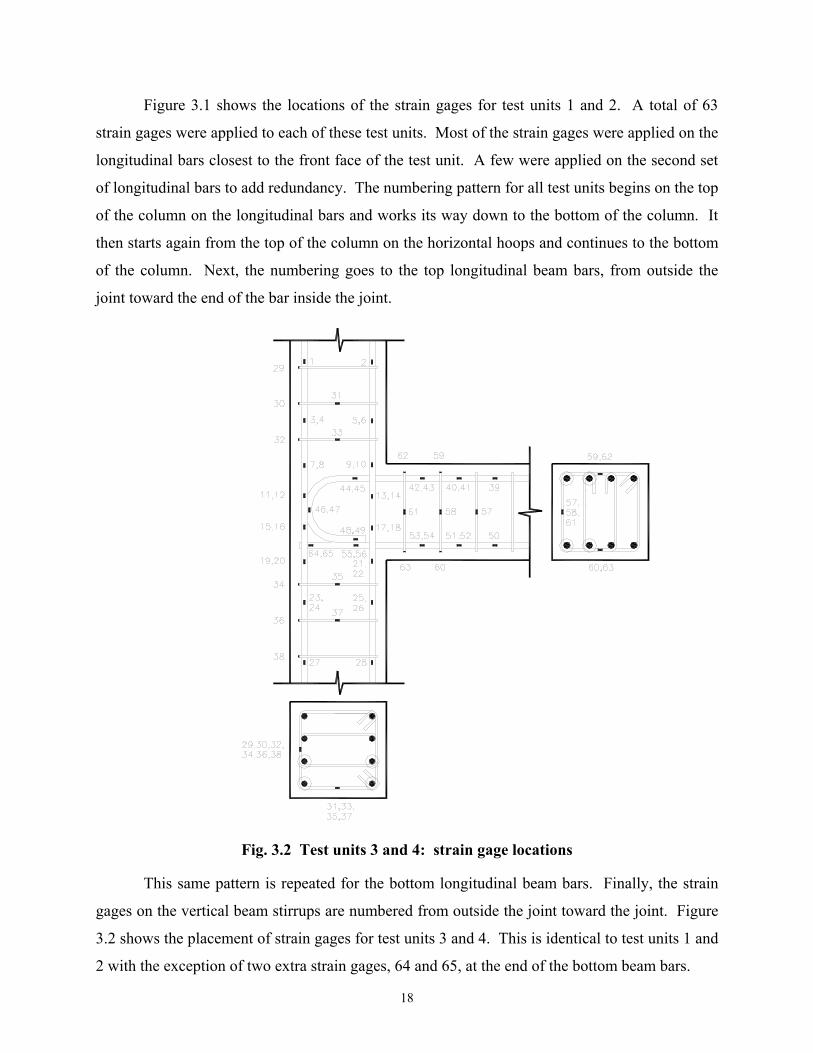
This same pattern is repeated for the bottom longitudinal beam bars. Finally, the strain
gages on the vertical beam stirrups are numbered from outside the joint toward the joint. Figure
3.2 shows the placement of strain gages for test units 3 and 4. This is identical to test units 1 and
2 with the exception of two extra strain gages, 64 and 65, at the end of the bottom beam bars.
19
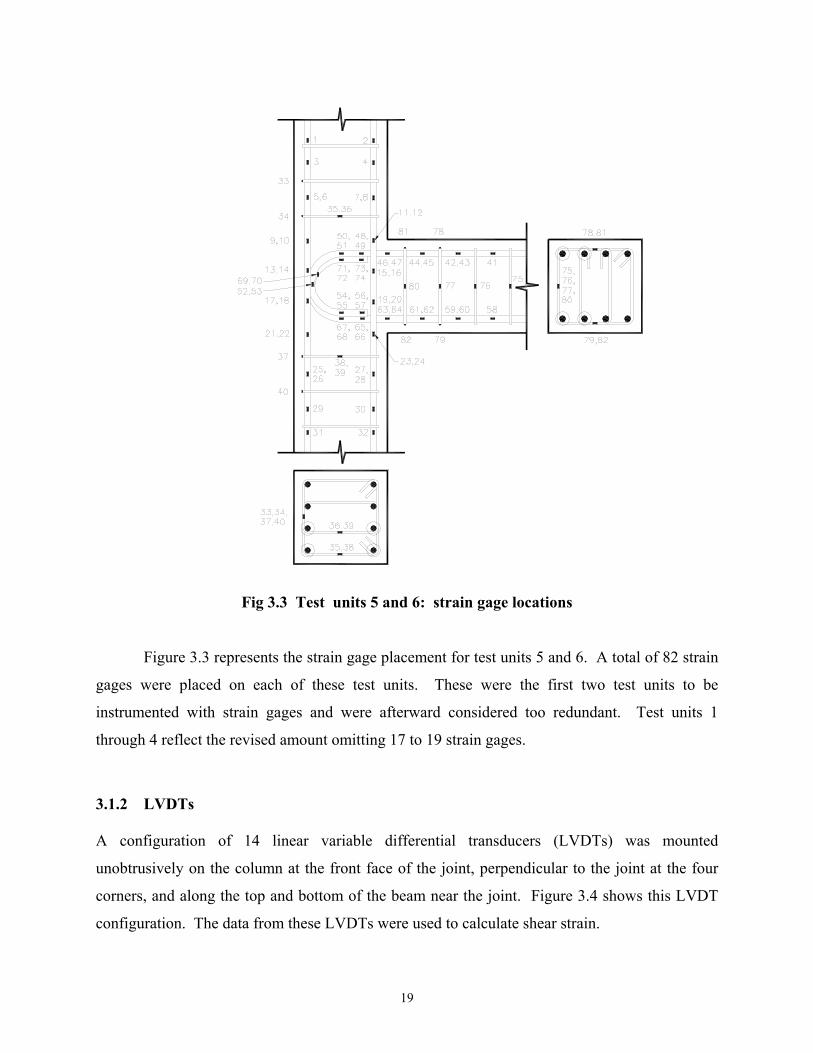
Fig 3.3 Test units 5 and 6: strain gage locations
Figure 3.3 represents the strain gage placement for test units 5 and 6. A total of 82 strain
gages were placed on each of these test units. These were the first two test units to be
instrumented with strain gages and were afterward considered too redundant. Test units 1
through 4 reflect the revised amount omitting 17 to 19 strain gages.
3.1.2 LVDTs
A configuration of 14 linear variable differential transducers (LVDTs) was mounted
unobtrusively on the column at the front face of the joint, perpendicular to the joint at the four
corners, and along the top and bottom of the beam near the joint. Figure 3.4 shows this LVDT
configuration. The data from these LVDTs were used to calculate shear strain.
20
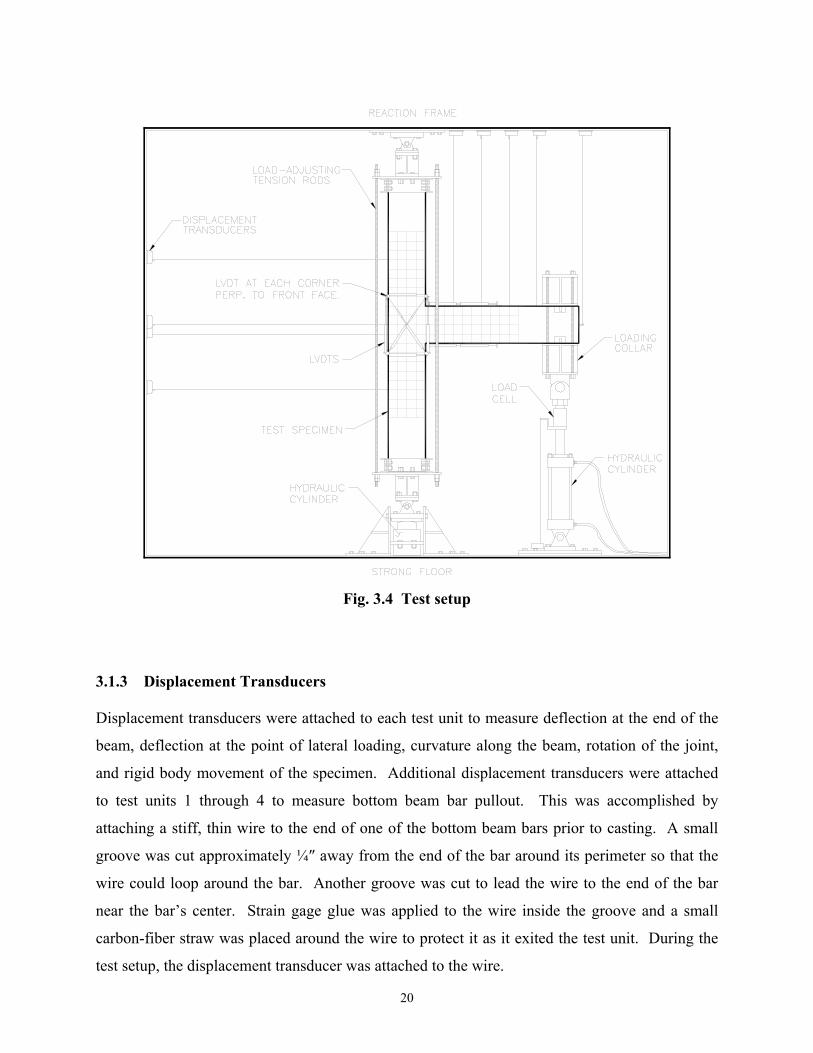
Fig. 3.4 Test setup
3.1.3 Displacement Transducers
Displacement transducers were attached to each test unit to measure deflection at the end of the
beam, deflection at the point of lateral loading, curvature along the beam, rotation of the joint,
and rigid body movement of the specimen. Additional displacement transducers were attached
to test units 1 through 4 to measure bottom beam bar pullout. This was accomplished by
attaching a stiff, thin wire to the end of one of the bottom beam bars prior to casting. A small
groove was cut approximately ¼″ away from the end of the bar around its perimeter so that the
wire could loop around the bar. Another groove was cut to lead the wire to the end of the bar
near the bar’s center. Strain gage glue was applied to the wire inside the groove and a small
carbon-fiber straw was placed around the wire to protect it as it exited the test unit. During the
test setup, the displacement transducer was attached to the wire.
21
3.2 LOADING APPARATUS
A schematic of the loading apparatus is shown in Figure 3.4. The column was mounted
vertically with pinned supports at both ends. The axial load was applied using a small hydraulic
cylinder and transferred to the column from the reaction against the loading frame and floor.
Eight strain gages, one on each face of the column both top and bottom, were used to measure
the axial load. Four threaded rods at each corner around the test unit were used to balance the
applied axial load. The average of the eight strain gages was used as the axial load. The lateral
load was applied at the end of the beam through a loading collar. A load cell situated between
the hydraulic actuator and the loading collar measured the quasi-static cyclic load applied to the
beam. The actuator was pinned at the end to allow rotation during the test. This loading device
was manually operated.
3.3 TEST PROCEDURE
Before beginning each test, the axial load was slowly applied to the column and balanced in
steps until the appropriate level was achieved. An axial compressive load equal to 0.1f’c was
applied to test units 1, 3, and 5. Test units 2, 4, and 6 received an axial compressive load equal
to 0.25f’c. During each test, the appropriate level of axial compression was maintained by
manually adjusting the small hydraulic cylinder after each load step. The lateral load was
applied cyclically through the loading collar, in a quasi-static fashion, at the end of the beam, as
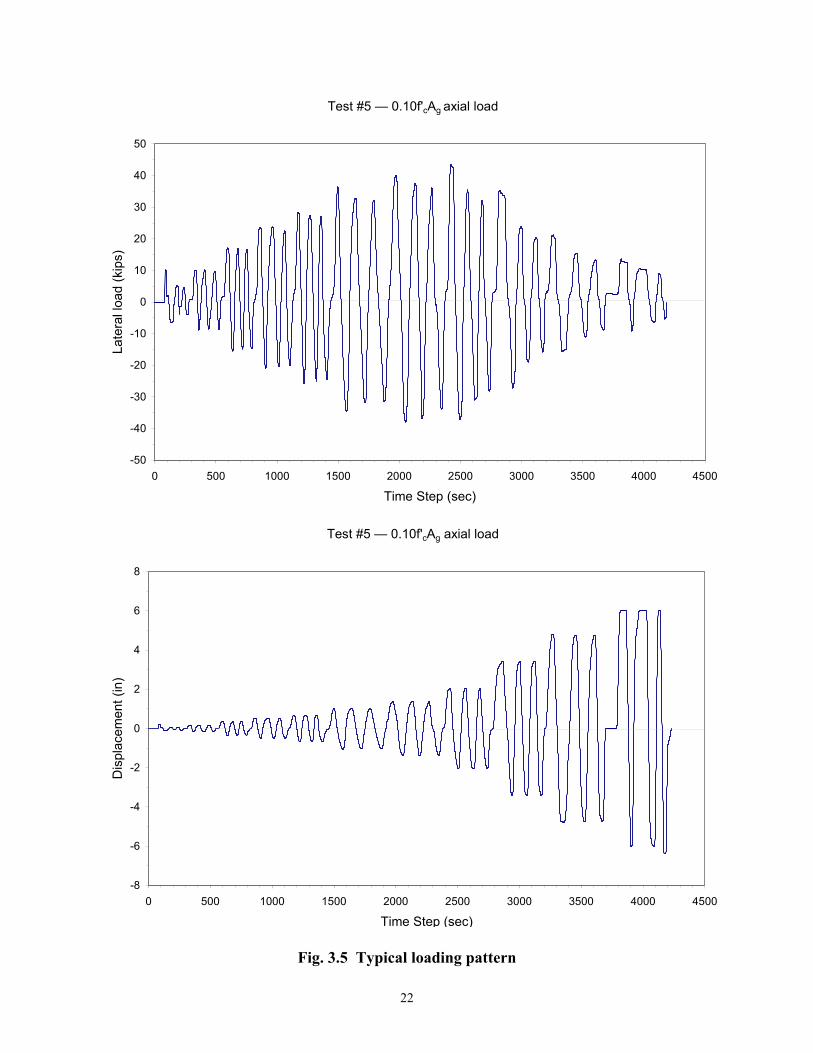
shown in Figure 3.4. The loading procedure outlined by PEER was followed. This consisted of
displacement-controlled steps beginning at a 0.1% drift followed by steps of 0.25%, 0.50%,
0.75%, 1.0%, 1.5%, 2.0%, 3.0%, 5.0%, 7.0%, and 10.0% drift. Owing to the limits of stroke in
the actuator, 10.0% drift was not achievable. An alternate step of approximately 9.0% was used
instead of 10.0%. Each drift step consisted of 3 cycles of push and pull, or up and down,
respectively. The test concluded when the 9.0% drift step was completed, or the column was
unable to maintain the axial load. The loading procedure for test 4, shown in Figure 3.5, is
typical of all six tests.
22
Test #5 — 0.10f'cAg axial load
-50
-40
-30
-20
-10
0
10
20
30
40
50
0 500 1000 1500 2000 2500 3000 3500 4000 4500
Time Step (sec)
Late
ral l
oad
(kip
s)
Test #5 — 0.10f'cAg axial load
-8
-6
-4
-2
0
2
4
6
8
0 500 1000 1500 2000 2500 3000 3500 4000 4500
Time Step (sec)
Dis
plac
emen
t (in
)
Fig. 3.5 Typical loading pattern
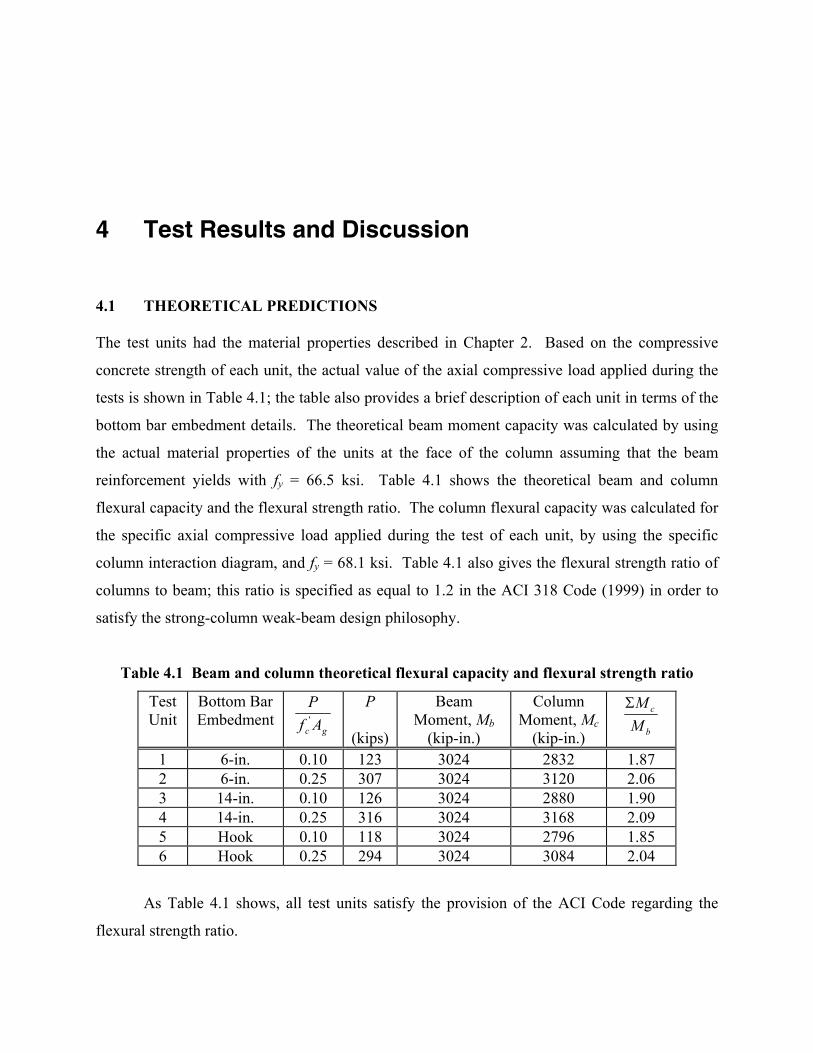
4 Test Results and Discussion
4.1 THEORETICAL PREDICTIONS
The test units had the material properties described in Chapter 2. Based on the compressive
concrete strength of each unit, the actual value of the axial compressive load applied during the
tests is shown in Table 4.1; the table also provides a brief description of each unit in terms of the
bottom bar embedment details. The theoretical beam moment capacity was calculated by using
the actual material properties of the units at the face of the column assuming that the beam
reinforcement yields with fy = 66.5 ksi. Table 4.1 shows the theoretical beam and column
flexural capacity and the flexural strength ratio. The column flexural capacity was calculated for
the specific axial compressive load applied during the test of each unit, by using the specific
column interaction diagram, and fy = 68.1 ksi. Table 4.1 also gives the flexural strength ratio of
columns to beam; this ratio is specified as equal to 1.2 in the ACI 318 Code (1999) in order to
satisfy the strong-column weak-beam design philosophy.
Table 4.1 Beam and column theoretical flexural capacity and flexural strength ratio
Test Unit
Bottom Bar Embedment
gc AfP'
P
(kips)
Beam Moment, Mb
(kip-in.)
Column Moment, Mc
(kip-in.) b
c
MMΣ
1 6-in. 0.10 123 3024 2832 1.87 2 6-in. 0.25 307 3024 3120 2.06 3 14-in. 0.10 126 3024 2880 1.90 4 14-in. 0.25 316 3024 3168 2.09 5 Hook 0.10 118 3024 2796 1.85 6 Hook 0.25 294 3024 3084 2.04
As Table 4.1 shows, all test units satisfy the provision of the ACI Code regarding the
flexural strength ratio.
24
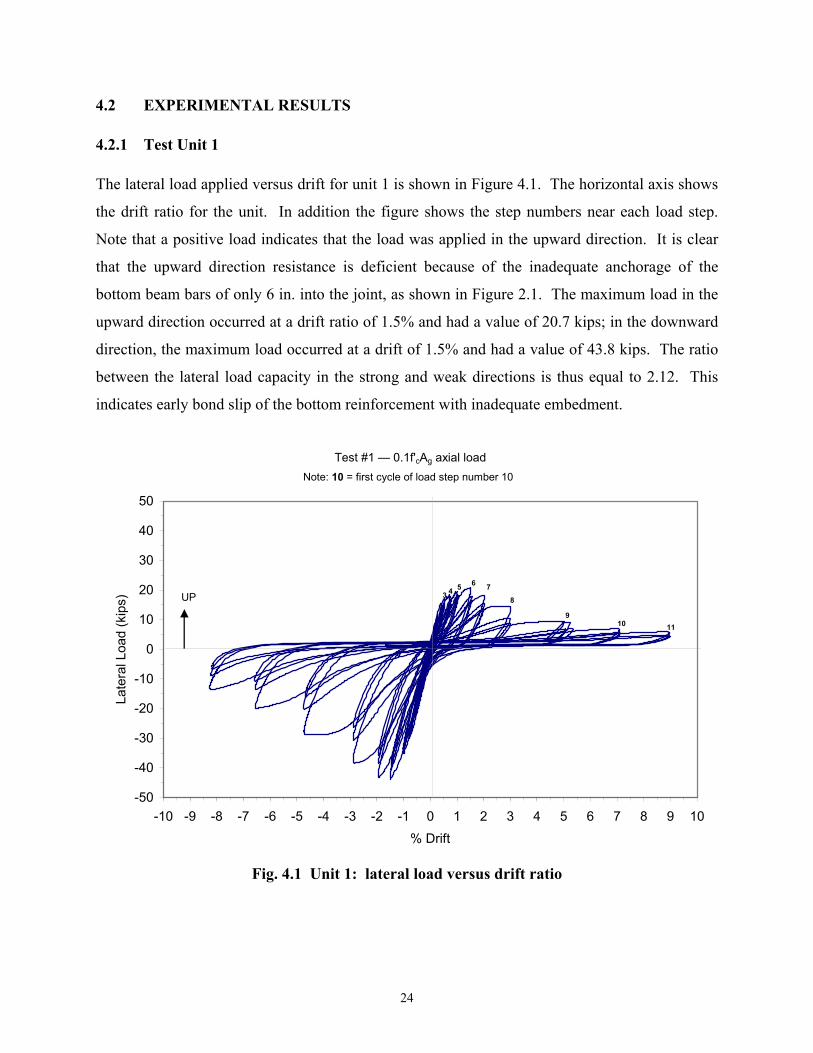
4.2 EXPERIMENTAL RESULTS
4.2.1 Test Unit 1
The lateral load applied versus drift for unit 1 is shown in Figure 4.1. The horizontal axis shows
the drift ratio for the unit. In addition the figure shows the step numbers near each load step.
Note that a positive load indicates that the load was applied in the upward direction. It is clear
that the upward direction resistance is deficient because of the inadequate anchorage of the
bottom beam bars of only 6 in. into the joint, as shown in Figure 2.1. The maximum load in the
upward direction occurred at a drift ratio of 1.5% and had a value of 20.7 kips; in the downward
direction, the maximum load occurred at a drift of 1.5% and had a value of 43.8 kips. The ratio
between the lateral load capacity in the strong and weak directions is thus equal to 2.12. This
indicates early bond slip of the bottom reinforcement with inadequate embedment.
Test #1 — 0.1f'cAg axial load
-50
-40
-30
-20
-10
0
10
20
30
40
50
-10 -9 -8 -7 -6 -5 -4 -3 -2 -1 0 1 2 3 4 5 6 7 8 9 10% Drift
Late
ral L
oad
(kip
s)
11109
8
76543
Note: 10 = first cycle of load step number 10
UP
Fig. 4.1 Unit 1: lateral load versus drift ratio

25
The flexural moment applied is compared to the theoretical moment capacity in Table 4.2
for all test units. Test unit 1 had an actual beam moment capacity 41% of the theoretical in the
upward direction and 86% in the downward direction. Figure 4.2 shows the moment-rotation
and the moment-plastic-rotation curves. The plastic rotation at the peak moment in the upward
direction was 0.005 radian, and at the peak moment in the downward direction it was 0.006
radian; the plastic rotation at 80% of the peak moment was 0.015 radian in the upward direction
and 0.020 radian in the downward direction.
Test #1 — 0.1f'cAg axial load
-3000
-2000
-1000
0
1000
2000
3000
-0.10 -0.08 -0.06 -0.04 -0.02 0.00 0.02 0.04 0.06 0.08 0.10
Rotation (radians)
Mom
ent (
kip-
in)
Rotation
Plastic Rotation
UP
Fig. 4.2 Unit 1: moment-rotation and moment-plastic-rotation envelopes
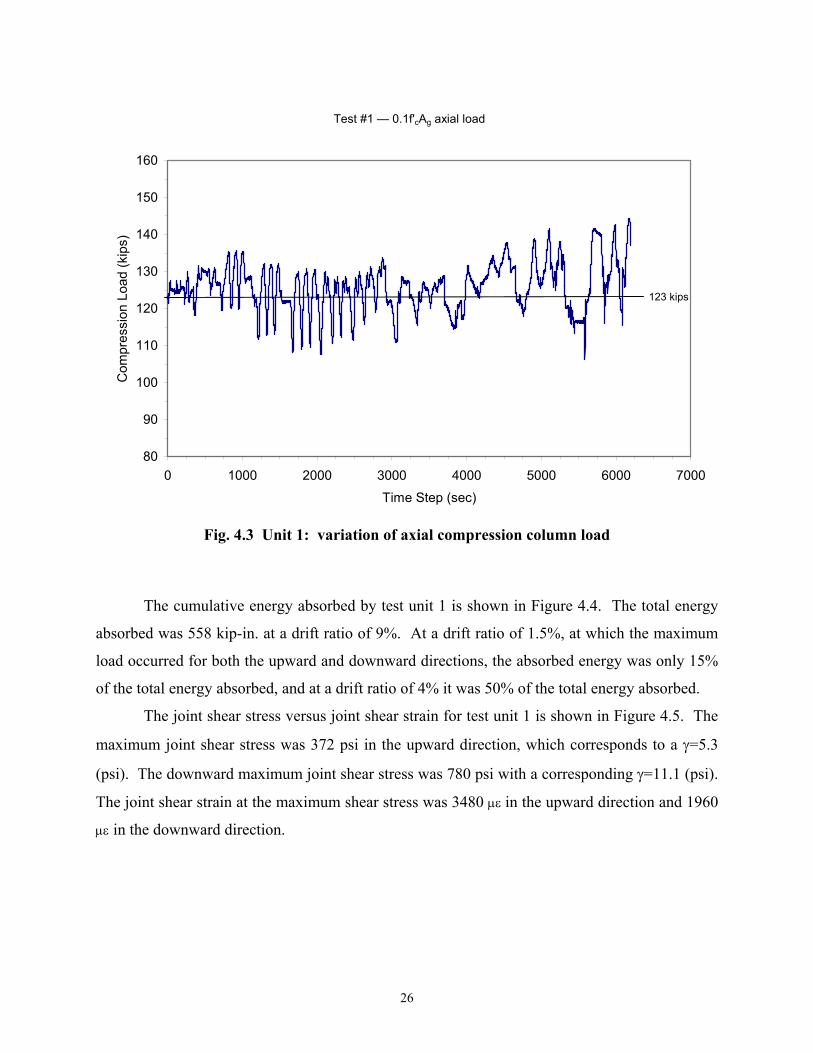
The column axial load for test unit 1 was set at a level of 0.1 f’cAg, which corresponds to
a 123 kips compression load. Although every effort was made to maintain the axial load at this
level throughout the test, variations were unavoidable. As shown in Figure 4.3, the axial load
varied from 106 to 144 kips, or a range of 86% to 117%. However, there was no indication that
test unit 1 reached its capacity because it could not support the axial compression load.
26
Test #1 — 0.1f'cAg axial load
80
90
100
110
120
130
140
150
160
0 1000 2000 3000 4000 5000 6000 7000Time Step (sec)
Com
pres
sion
Loa
d (k
ips)
123 kips
Fig. 4.3 Unit 1: variation of axial compression column load
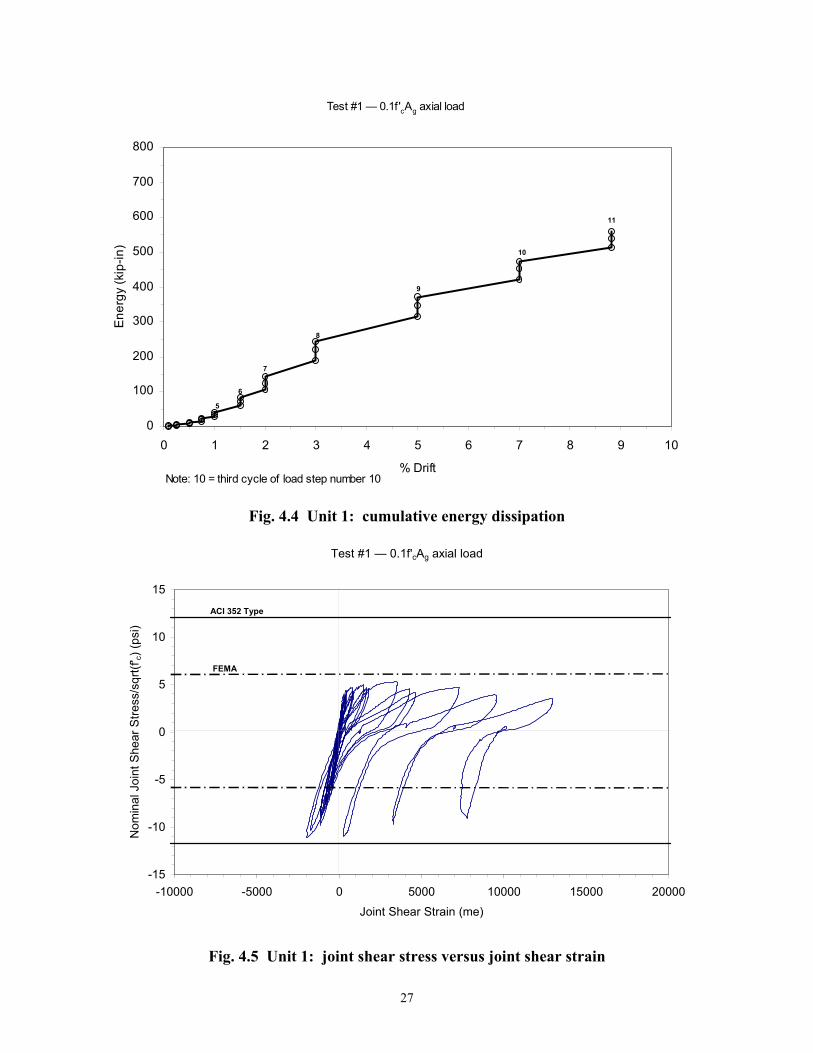
The cumulative energy absorbed by test unit 1 is shown in Figure 4.4. The total energy
absorbed was 558 kip-in. at a drift ratio of 9%. At a drift ratio of 1.5%, at which the maximum
load occurred for both the upward and downward directions, the absorbed energy was only 15%
of the total energy absorbed, and at a drift ratio of 4% it was 50% of the total energy absorbed.
The joint shear stress versus joint shear strain for test unit 1 is shown in Figure 4.5. The
maximum joint shear stress was 372 psi in the upward direction, which corresponds to a γ=5.3
(psi). The downward maximum joint shear stress was 780 psi with a corresponding γ=11.1 (psi).
The joint shear strain at the maximum shear stress was 3480 µε in the upward direction and 1960
µε in the downward direction.
27
Test #1 — 0.1f'cAg axial load
0
100
200
300
400
500
600
700
800
0 1 2 3 4 5 6 7 8 9 10
% Drift
Ener
gy (k
ip-in
)
11
10
9
8
7
6
5
Note: 10 = third cycle of load step number 10
Fig. 4.4 Unit 1: cumulative energy dissipation
Test #1 — 0.1f'cAg axial load
-15
-10
-5
0
5
10
15
-10000 -5000 0 5000 10000 15000 20000Joint Shear Strain (me)
Nom
inal
Joi
nt S
hear
Stre
ss/s
qrt(f
' c) (p
si)
ACI 352 Type
FEMA
Fig. 4.5 Unit 1: joint shear stress versus joint shear strain
28
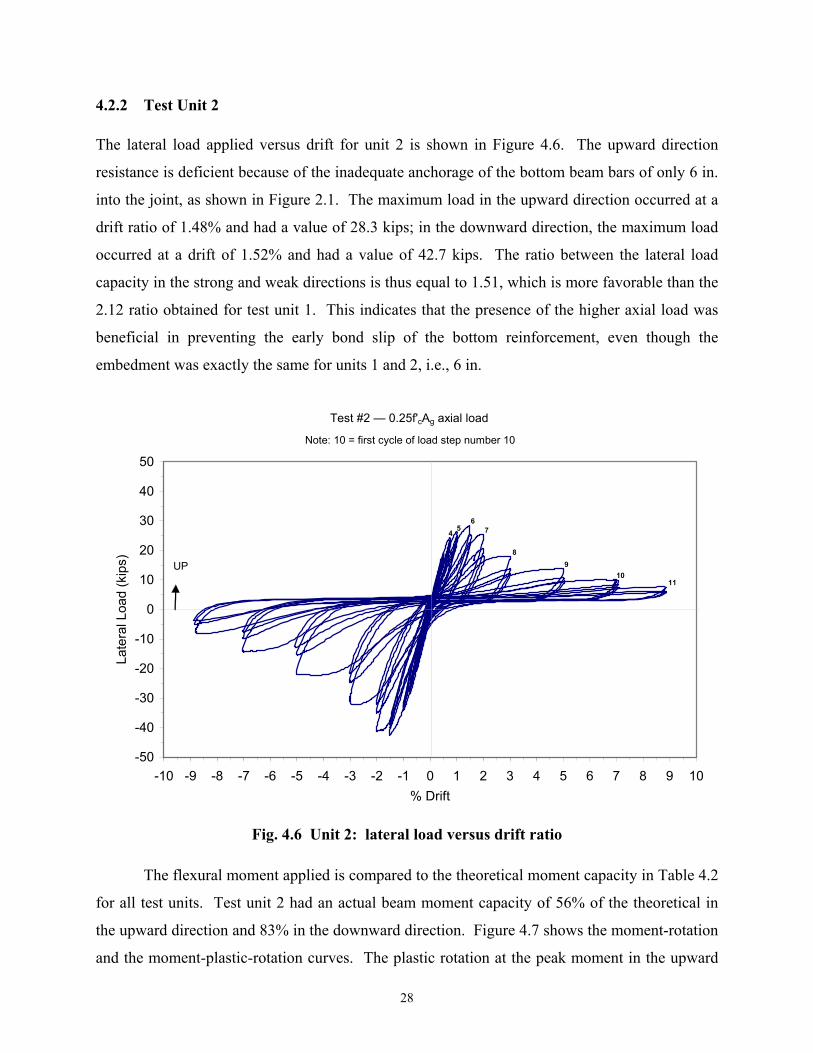
4.2.2 Test Unit 2
The lateral load applied versus drift for unit 2 is shown in Figure 4.6. The upward direction
resistance is deficient because of the inadequate anchorage of the bottom beam bars of only 6 in.
into the joint, as shown in Figure 2.1. The maximum load in the upward direction occurred at a
drift ratio of 1.48% and had a value of 28.3 kips; in the downward direction, the maximum load
occurred at a drift of 1.52% and had a value of 42.7 kips. The ratio between the lateral load
capacity in the strong and weak directions is thus equal to 1.51, which is more favorable than the
2.12 ratio obtained for test unit 1. This indicates that the presence of the higher axial load was
beneficial in preventing the early bond slip of the bottom reinforcement, even though the
embedment was exactly the same for units 1 and 2, i.e., 6 in.
Test #2 — 0.25f'cAg axial load
-50
-40
-30
-20
-10
0
10
20
30
40
50
-10 -9 -8 -7 -6 -5 -4 -3 -2 -1 0 1 2 3 4 5 6 7 8 9 10% Drift
Late
ral L
oad
(kip
s)
1110
98
76
54
Note: 10 = first cycle of load step number 10
UP
Fig. 4.6 Unit 2: lateral load versus drift ratio
The flexural moment applied is compared to the theoretical moment capacity in Table 4.2
for all test units. Test unit 2 had an actual beam moment capacity of 56% of the theoretical in
the upward direction and 83% in the downward direction. Figure 4.7 shows the moment-rotation
and the moment-plastic-rotation curves. The plastic rotation at the peak moment in the upward
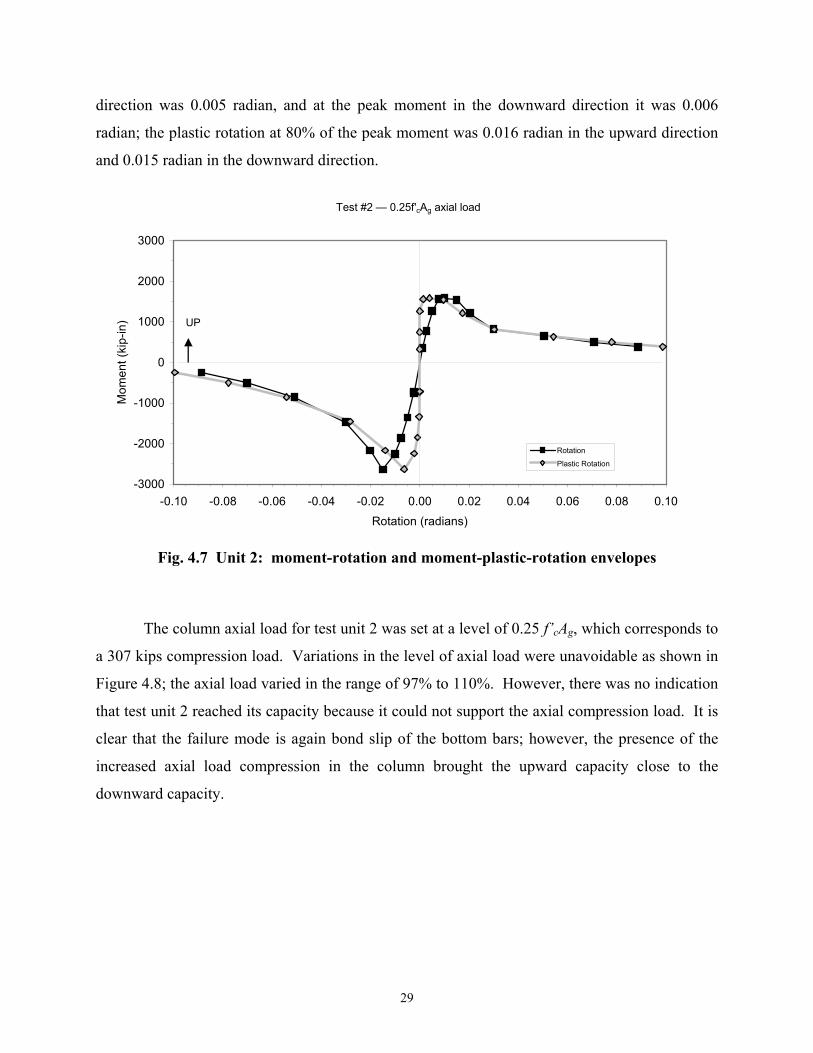
29
direction was 0.005 radian, and at the peak moment in the downward direction it was 0.006
radian; the plastic rotation at 80% of the peak moment was 0.016 radian in the upward direction
and 0.015 radian in the downward direction.
Test #2 — 0.25f'cAg axial load
-3000
-2000
-1000
0
1000
2000
3000
-0.10 -0.08 -0.06 -0.04 -0.02 0.00 0.02 0.04 0.06 0.08 0.10Rotation (radians)
Mom
ent (
kip-
in)
Rotation
Plastic Rotation
UP
Fig. 4.7 Unit 2: moment-rotation and moment-plastic-rotation envelopes
The column axial load for test unit 2 was set at a level of 0.25 f’cAg, which corresponds to
a 307 kips compression load. Variations in the level of axial load were unavoidable as shown in
Figure 4.8; the axial load varied in the range of 97% to 110%. However, there was no indication
that test unit 2 reached its capacity because it could not support the axial compression load. It is
clear that the failure mode is again bond slip of the bottom bars; however, the presence of the
increased axial load compression in the column brought the upward capacity close to the
downward capacity.

30
Test #2 — 0.25f'cAg axial load
280
290
300
310
320
330
340
350
360
0 1000 2000 3000 4000 5000Time Step (sec)
Com
pres
sion
Loa
d (k
ips)
307 kips
Fig. 4.8 Unit 2: variation of axial compression column load
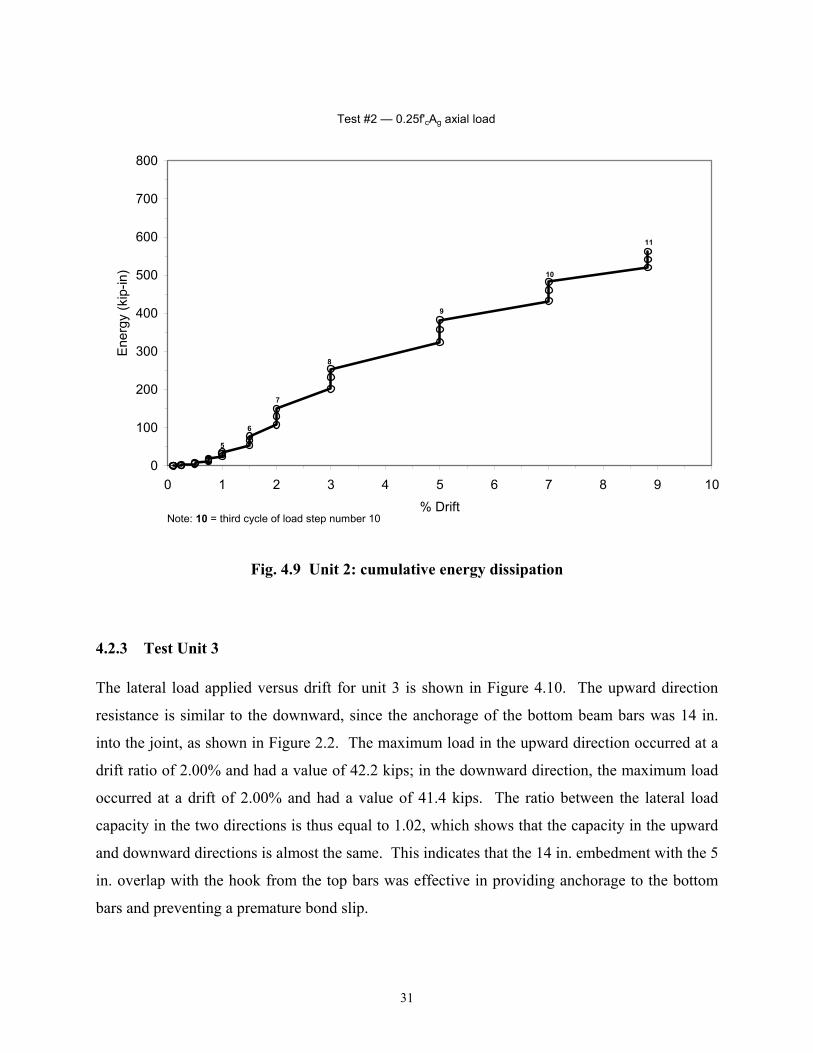
The cumulative energy absorbed by test unit 2 is shown in Figure 4.9. The total energy
absorbed was 563 kip-in. at a drift ratio of 9%. At a drift ratio of 1.5%, at which the maximum
load occurred for both the upward and downward directions, the absorbed energy was only 14%
of the total energy absorbed, and at a drift ratio of 4% it was 50% of the total energy absorbed.
The energy absorption behavior is very similar to that of test unit 1.
The joint shear stress versus joint shear strain for test unit 2 was not able to be
determined due to the LVDTs malfunctioning during the test.
31
Test #2 — 0.25f'cAg axial load
0
100
200
300
400
500
600
700
800
0 1 2 3 4 5 6 7 8 9 10% Drift
Ener
gy (k
ip-in
)
11
10
9
8
7
6
5
Note: 10 = third cycle of load step number 10
Fig. 4.9 Unit 2: cumulative energy dissipation
4.2.3 Test Unit 3
The lateral load applied versus drift for unit 3 is shown in Figure 4.10. The upward direction
resistance is similar to the downward, since the anchorage of the bottom beam bars was 14 in.
into the joint, as shown in Figure 2.2. The maximum load in the upward direction occurred at a
drift ratio of 2.00% and had a value of 42.2 kips; in the downward direction, the maximum load
occurred at a drift of 2.00% and had a value of 41.4 kips. The ratio between the lateral load
capacity in the two directions is thus equal to 1.02, which shows that the capacity in the upward
and downward directions is almost the same. This indicates that the 14 in. embedment with the 5
in. overlap with the hook from the top bars was effective in providing anchorage to the bottom
bars and preventing a premature bond slip.

32
Test #3 — 0.1f'cAg axial load
-50
-40
-30
-20
-10
0
10
20
30
40
50
-10 -9 -8 -7 -6 -5 -4 -3 -2 -1 0 1 2 3 4 5 6 7 8 9 10% Drift
Late
ral L
oad
(kip
s)
11
10
9
876
5
4
3
Note: 10 = first cycle of load step number 10
Fig. 4.10 Unit 3: lateral load versus drift ratio
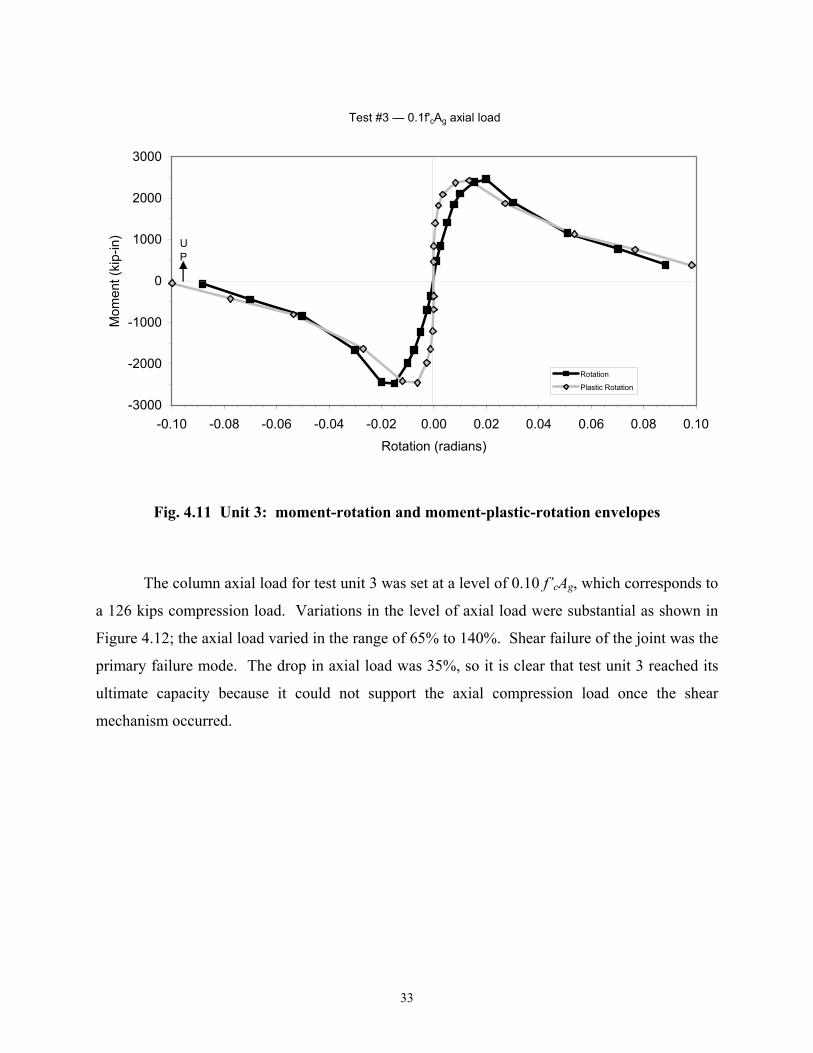
The flexural moment applied is compared to the theoretical moment capacity in Table 4.2
for all test units. Test unit 3 had an actual beam moment capacity of 83% of the theoretical in
the upward direction and 81% in the downward direction. Figure 4.11 shows the moment-
rotation and the moment-plastic-rotation curves. The plastic rotation at the peak moment in the
upward direction was 0.013 radian, and at the peak moment in the downward direction it was
0.006 radian; the plastic rotation at 80% of the peak moment was 0.025 radian in the upward
direction and 0.020 radian in the downward direction.
33
Test #3 — 0.1f'cAg axial load
-3000
-2000
-1000
0
1000
2000
3000
-0.10 -0.08 -0.06 -0.04 -0.02 0.00 0.02 0.04 0.06 0.08 0.10Rotation (radians)
Mom
ent (
kip-
in)
Rotation
Plastic Rotation
UP
Fig. 4.11 Unit 3: moment-rotation and moment-plastic-rotation envelopes
The column axial load for test unit 3 was set at a level of 0.10 f’cAg, which corresponds to
a 126 kips compression load. Variations in the level of axial load were substantial as shown in
Figure 4.12; the axial load varied in the range of 65% to 140%. Shear failure of the joint was the
primary failure mode. The drop in axial load was 35%, so it is clear that test unit 3 reached its
ultimate capacity because it could not support the axial compression load once the shear
mechanism occurred.
34
Test #3 — 0.1f'cAg axial load
60
70
80
90
100
110
120
130
140
150
160
170
180
190
0 1000 2000 3000 4000
Time Step (sec)
Com
pres
sion
Loa
d (k
ips)
126 kips
Fig. 4.12 Unit 3: variation of axial compression column load
The cumulative energy absorbed by test unit 3 is shown in Figure 4.13. The total energy
absorbed was 683 kip-in. at a drift ratio of 9%. At a drift ratio of 2.0%, at which the maximum
load occurred for both the upward and downward directions, the absorbed energy was 21% of the
total energy absorbed, and at a drift ratio of 4.5% it was 50% of the total energy absorbed. The
energy absorption is 22% higher compared to test unit 1.
The joint shear stress versus joint shear strain for test unit 3 is shown in Figure 4.14. The
maximum joint shear stress was 734 psi in the upward direction, which corresponds to a γ=10.6
(psi). The downward maximum joint shear stress was 720 psi with a corresponding γ=10.4 (psi).
The joint shear strain at the maximum shear stress was 3250 µε in the upward direction and
4270 µε in the downward direction.
35
Test #3 - 0.1f 'cAg axial load
0
100
200
300
400
500
600
700
800
0 2 4 6 8 10
% Drift
Ener
gy (k
ip-in
)
11
10
9
8
7
65
Note: 10 = third cycle of load step number 10
Fig. 4.13 Unit 3: cumulative energy dissipation
Test #3 — 0.1f'cAg axial load
-15
-10
-5
0
5
10
15
-20000 -10000 0 10000 20000 30000 40000 50000 60000Joint Shear Strain (ue)
Nom
inal
Joi
nt S
hear
Stre
ss/s
qrt(f
' c) (p
si)
ACI 352
FEMA 273
Fig. 4.14 Unit 3: joint shear stress versus joint shear strain
36
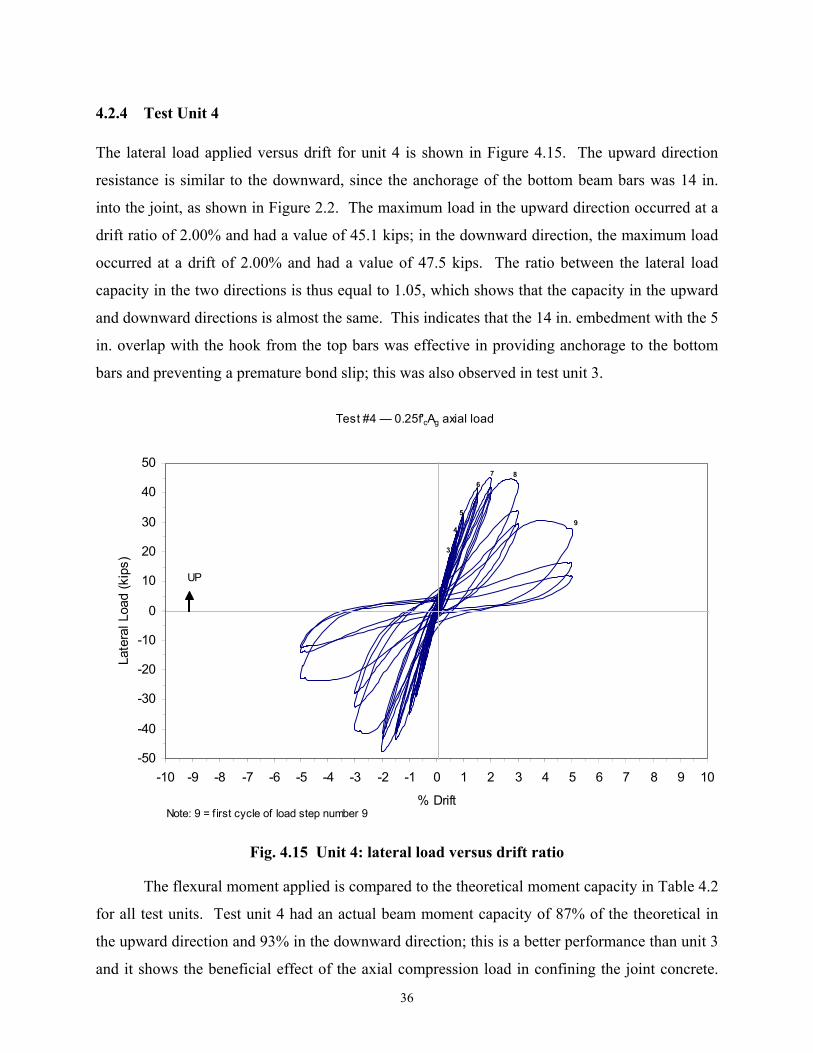
4.2.4 Test Unit 4
The lateral load applied versus drift for unit 4 is shown in Figure 4.15. The upward direction
resistance is similar to the downward, since the anchorage of the bottom beam bars was 14 in.
into the joint, as shown in Figure 2.2. The maximum load in the upward direction occurred at a
drift ratio of 2.00% and had a value of 45.1 kips; in the downward direction, the maximum load
occurred at a drift of 2.00% and had a value of 47.5 kips. The ratio between the lateral load
capacity in the two directions is thus equal to 1.05, which shows that the capacity in the upward
and downward directions is almost the same. This indicates that the 14 in. embedment with the 5
in. overlap with the hook from the top bars was effective in providing anchorage to the bottom
bars and preventing a premature bond slip; this was also observed in test unit 3.
Test #4 — 0.25f'cAg axial load
-50
-40
-30
-20
-10
0
10
20
30
40
50
-10 -9 -8 -7 -6 -5 -4 -3 -2 -1 0 1 2 3 4 5 6 7 8 9 10
% Drift
Late
ral L
oad
(kip
s)
9
876
5
4
3
Note: 9 = first cycle of load step number 9
UP
Fig. 4.15 Unit 4: lateral load versus drift ratio
The flexural moment applied is compared to the theoretical moment capacity in Table 4.2
for all test units. Test unit 4 had an actual beam moment capacity of 87% of the theoretical in
the upward direction and 93% in the downward direction; this is a better performance than unit 3
and it shows the beneficial effect of the axial compression load in confining the joint concrete.
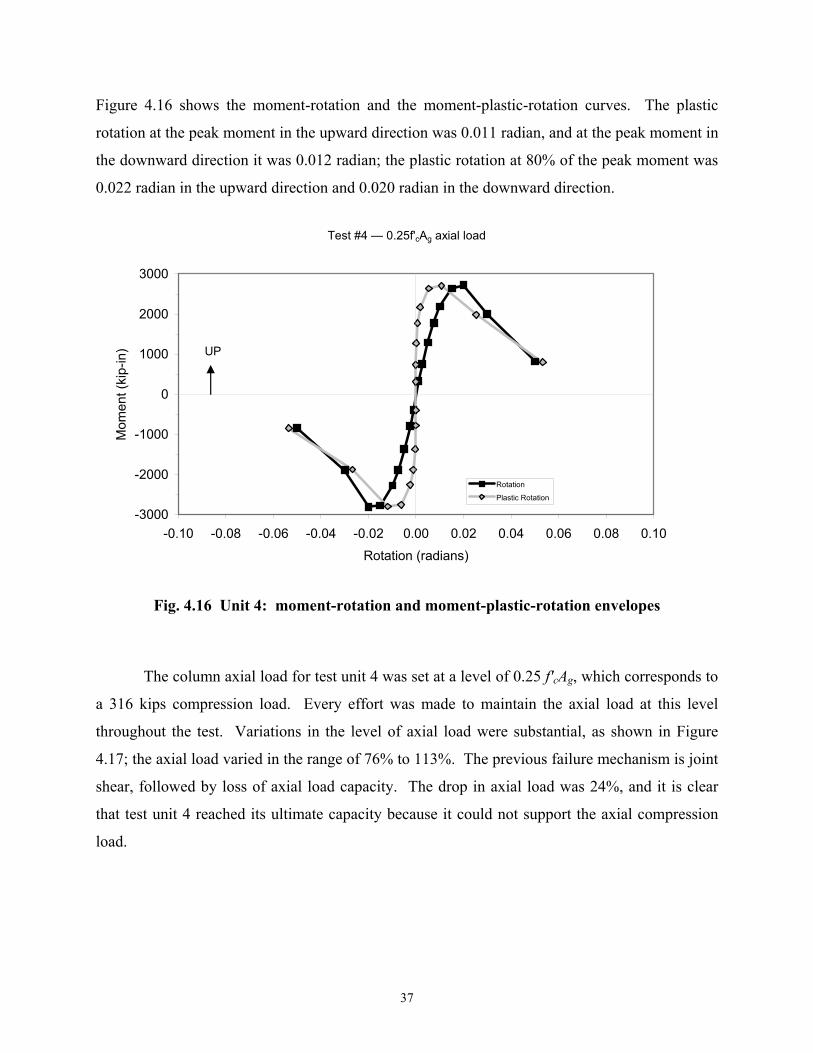
37
Figure 4.16 shows the moment-rotation and the moment-plastic-rotation curves. The plastic
rotation at the peak moment in the upward direction was 0.011 radian, and at the peak moment in
the downward direction it was 0.012 radian; the plastic rotation at 80% of the peak moment was
0.022 radian in the upward direction and 0.020 radian in the downward direction.
Test #4 — 0.25f'cAg axial load
-3000
-2000
-1000
0
1000
2000
3000
-0.10 -0.08 -0.06 -0.04 -0.02 0.00 0.02 0.04 0.06 0.08 0.10Rotation (radians)
Mom
ent (
kip-
in)
Rotation
Plastic Rotation
UP
Fig. 4.16 Unit 4: moment-rotation and moment-plastic-rotation envelopes
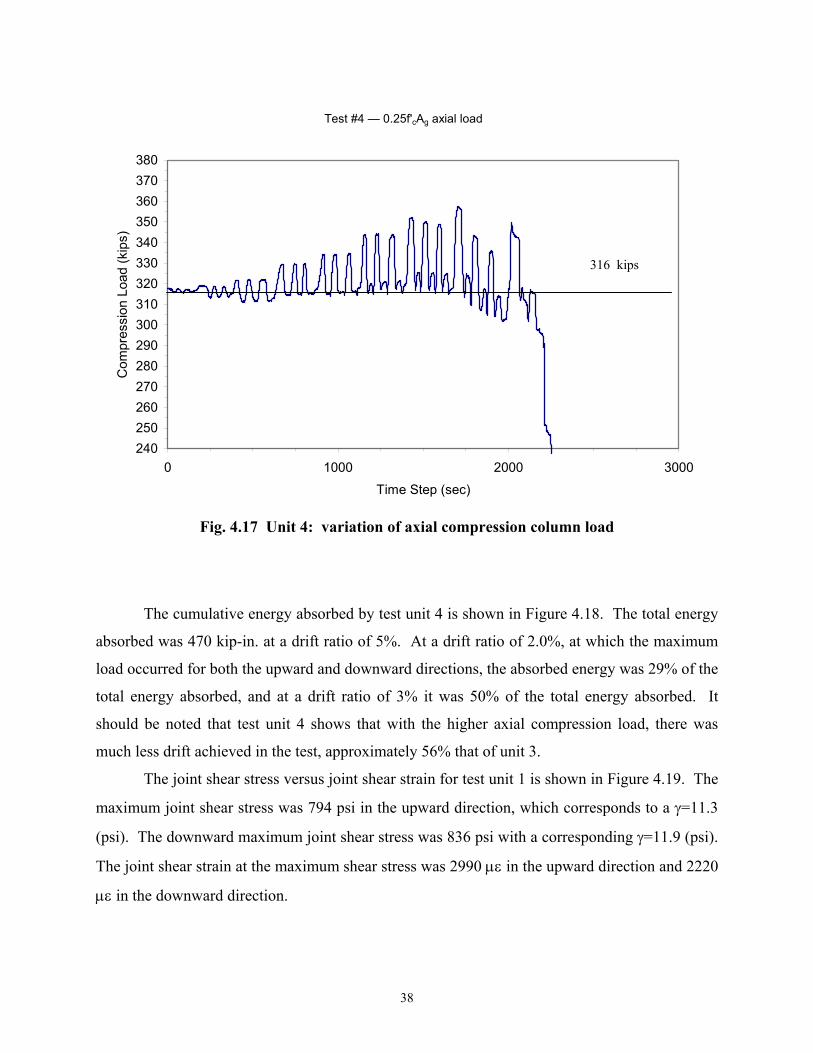
The column axial load for test unit 4 was set at a level of 0.25 f′cAg, which corresponds to
a 316 kips compression load. Every effort was made to maintain the axial load at this level
throughout the test. Variations in the level of axial load were substantial, as shown in Figure
4.17; the axial load varied in the range of 76% to 113%. The previous failure mechanism is joint
shear, followed by loss of axial load capacity. The drop in axial load was 24%, and it is clear
that test unit 4 reached its ultimate capacity because it could not support the axial compression
load.
38
Test #4 — 0.25f'cAg axial load
240250260270280290300310320330340350360370380
0 1000 2000 3000Time Step (sec)
Com
pres
sion
Loa
d (k
ips)
Fig. 4.17 Unit 4: variation of axial compression column load
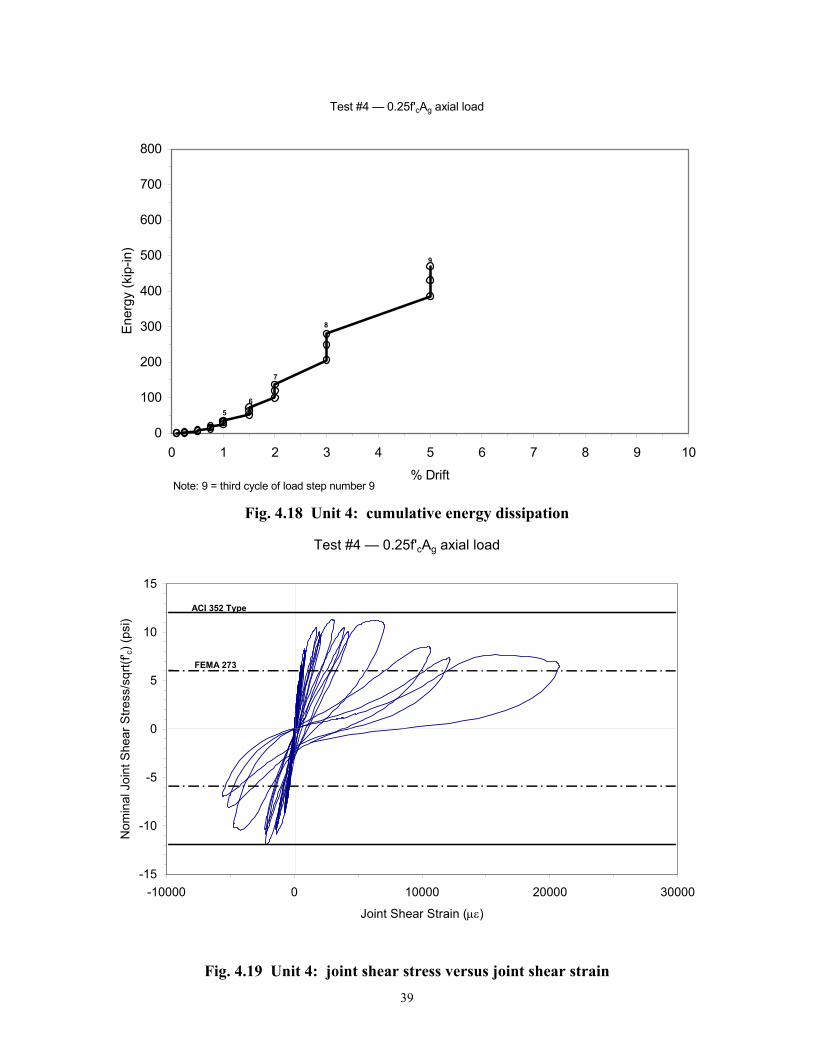
The cumulative energy absorbed by test unit 4 is shown in Figure 4.18. The total energy
absorbed was 470 kip-in. at a drift ratio of 5%. At a drift ratio of 2.0%, at which the maximum
load occurred for both the upward and downward directions, the absorbed energy was 29% of the
total energy absorbed, and at a drift ratio of 3% it was 50% of the total energy absorbed. It
should be noted that test unit 4 shows that with the higher axial compression load, there was
much less drift achieved in the test, approximately 56% that of unit 3.
The joint shear stress versus joint shear strain for test unit 1 is shown in Figure 4.19. The
maximum joint shear stress was 794 psi in the upward direction, which corresponds to a γ=11.3
(psi). The downward maximum joint shear stress was 836 psi with a corresponding γ=11.9 (psi).
The joint shear strain at the maximum shear stress was 2990 µε in the upward direction and 2220
µε in the downward direction.
316 kips
39
Test #4 — 0.25f'cAg axial load
0
100
200
300
400
500
600
700
800
0 1 2 3 4 5 6 7 8 9 10
% Drift
Ener
gy (k
ip-in
)
9
8
7
65
Note: 9 = third cycle of load step number 9
Fig. 4.18 Unit 4: cumulative energy dissipation
Test #4 — 0.25f'cAg axial load
-15
-10
-5
0
5
10
15
-10000 0 10000 20000 30000
Joint Shear Strain (µε)
Nom
inal
Joi
nt S
hear
Stre
ss/s
qrt(f
' c) (p
si)
ACI 352 Type 2
FEMA 273
Fig. 4.19 Unit 4: joint shear stress versus joint shear strain
40
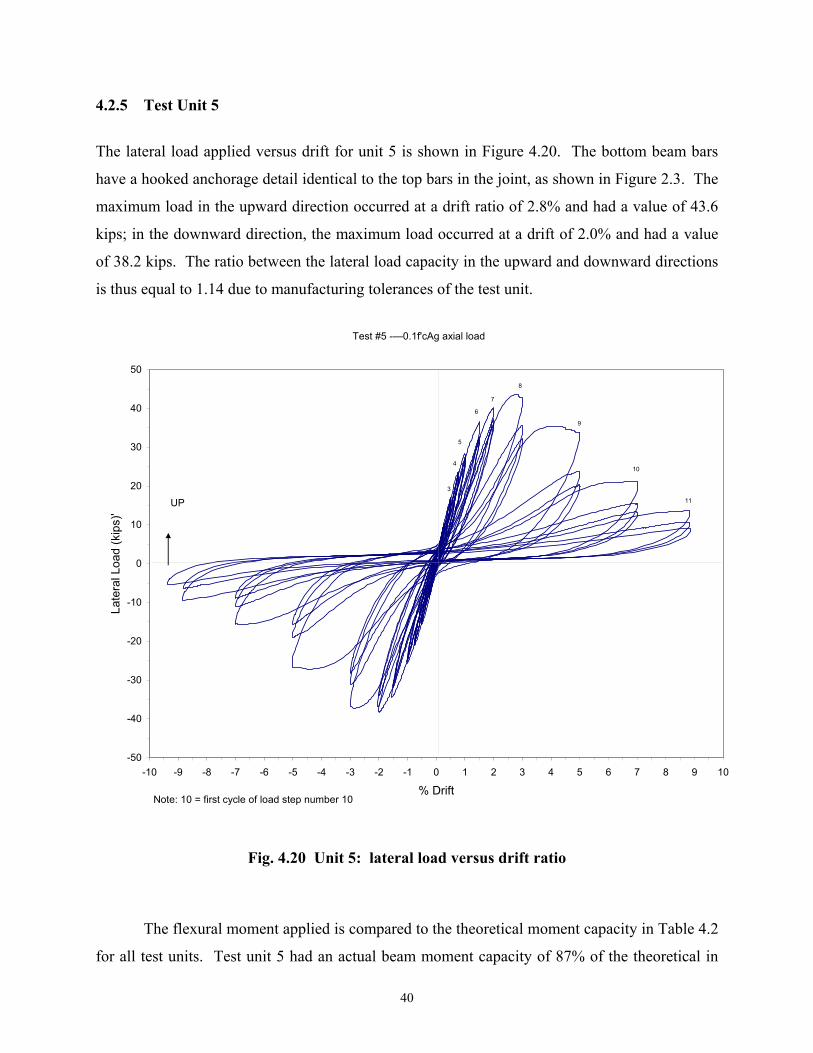
4.2.5 Test Unit 5
The lateral load applied versus drift for unit 5 is shown in Figure 4.20. The bottom beam bars
have a hooked anchorage detail identical to the top bars in the joint, as shown in Figure 2.3. The
maximum load in the upward direction occurred at a drift ratio of 2.8% and had a value of 43.6
kips; in the downward direction, the maximum load occurred at a drift of 2.0% and had a value
of 38.2 kips. The ratio between the lateral load capacity in the upward and downward directions
is thus equal to 1.14 due to manufacturing tolerances of the test unit.
Test #5 -—0.1f'cAg axial load
-50
-40
-30
-20
-10
0
10
20
30
40
50
-10 -9 -8 -7 -6 -5 -4 -3 -2 -1 0 1 2 3 4 5 6 7 8 9 10
% Drift
Late
ral L
oad
(kip
s)'
11
10
9
8
7
6
5
4
3
Note: 10 = first cycle of load step number 10
UP
Fig. 4.20 Unit 5: lateral load versus drift ratio
The flexural moment applied is compared to the theoretical moment capacity in Table 4.2
for all test units. Test unit 5 had an actual beam moment capacity of 87% of the theoretical in
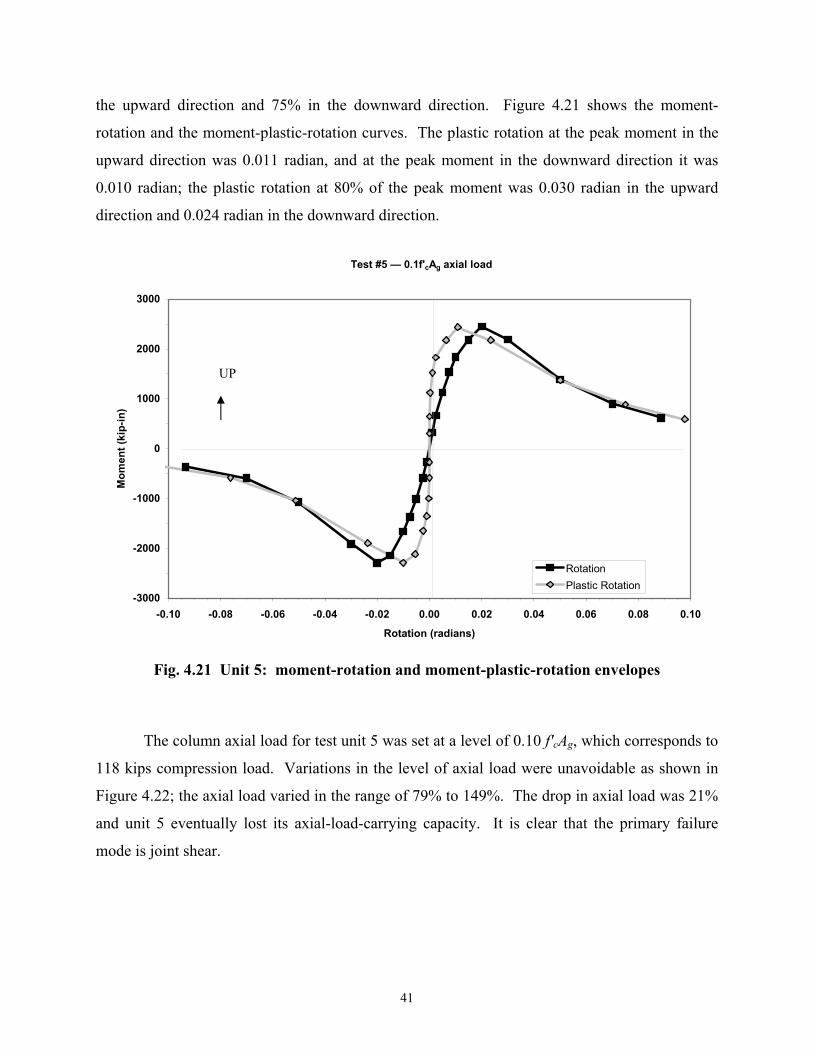
41
the upward direction and 75% in the downward direction. Figure 4.21 shows the moment-
rotation and the moment-plastic-rotation curves. The plastic rotation at the peak moment in the
upward direction was 0.011 radian, and at the peak moment in the downward direction it was
0.010 radian; the plastic rotation at 80% of the peak moment was 0.030 radian in the upward
direction and 0.024 radian in the downward direction.
Test #5 — 0.1f'cAg axial load
-3000
-2000
-1000
0
1000
2000
3000
-0.10 -0.08 -0.06 -0.04 -0.02 0.00 0.02 0.04 0.06 0.08 0.10
Rotation (radians)
Mom
ent (
kip-
in)
RotationPlastic Rotation
Fig. 4.21 Unit 5: moment-rotation and moment-plastic-rotation envelopes
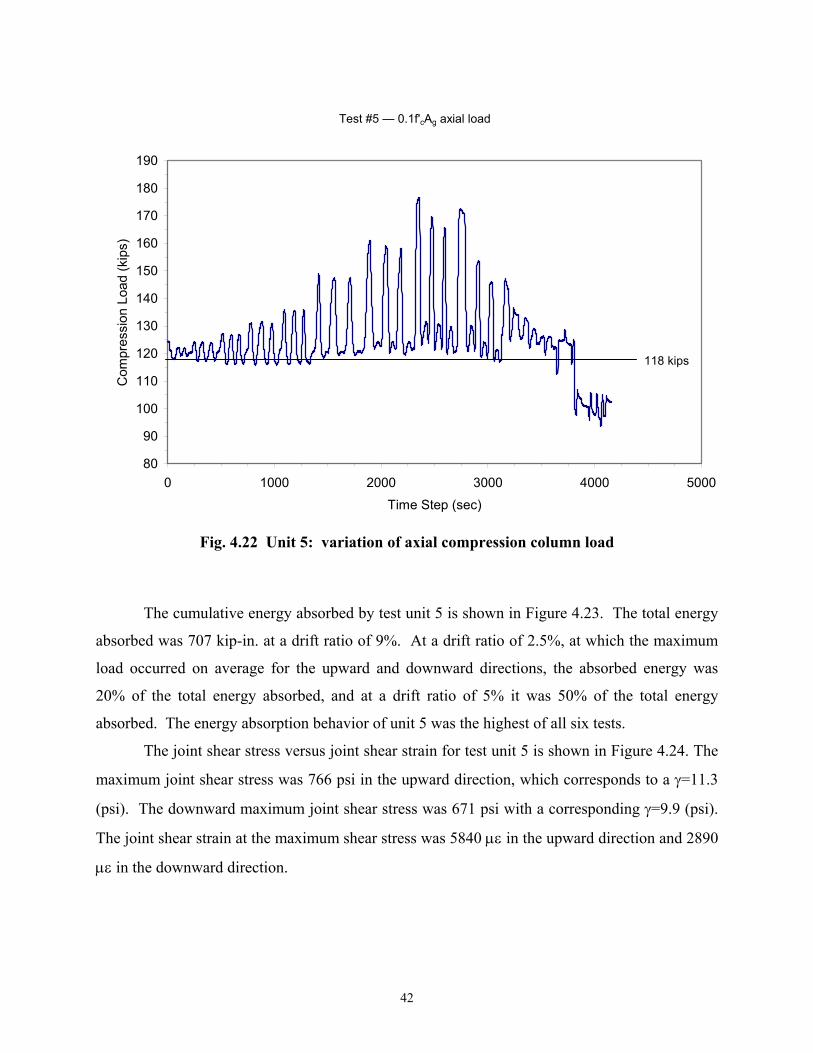
The column axial load for test unit 5 was set at a level of 0.10 f′cAg, which corresponds to
118 kips compression load. Variations in the level of axial load were unavoidable as shown in
Figure 4.22; the axial load varied in the range of 79% to 149%. The drop in axial load was 21%
and unit 5 eventually lost its axial-load-carrying capacity. It is clear that the primary failure
mode is joint shear.
UP
42
Test #5 — 0.1f'cAg axial load
80
90
100
110
120
130
140
150
160
170
180
190
0 1000 2000 3000 4000 5000Time Step (sec)
Com
pres
sion
Loa
d (k
ips)
118 kips
Fig. 4.22 Unit 5: variation of axial compression column load
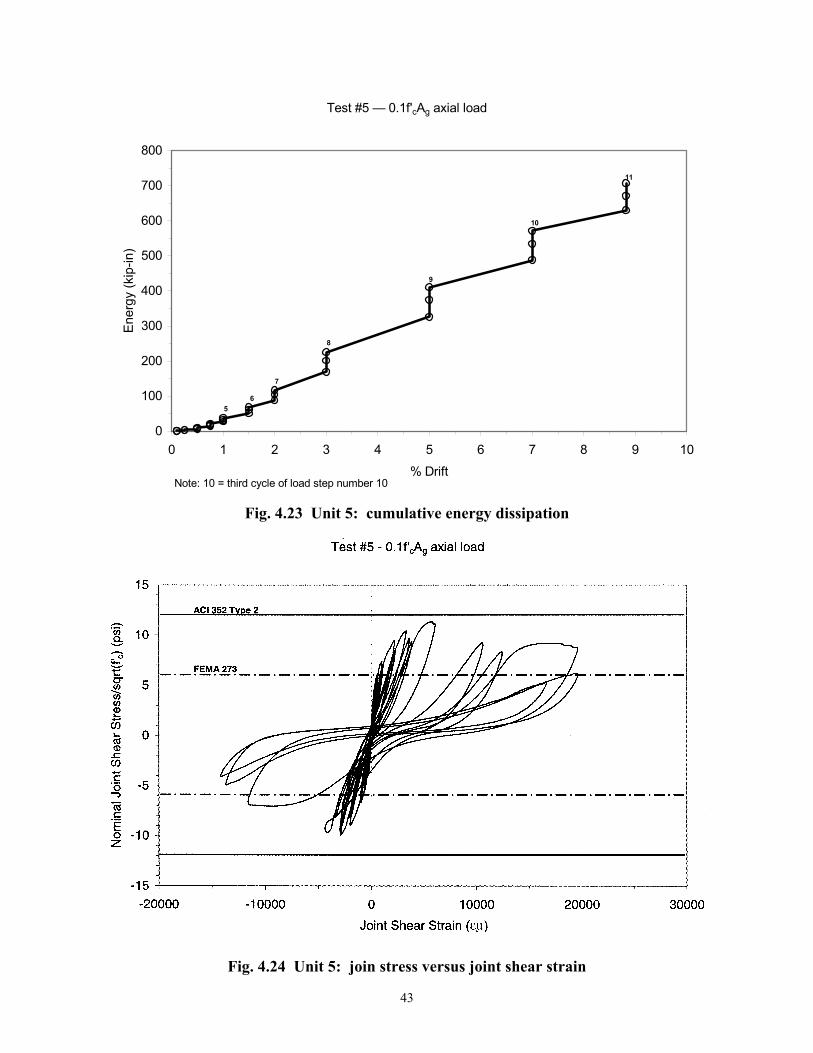
The cumulative energy absorbed by test unit 5 is shown in Figure 4.23. The total energy
absorbed was 707 kip-in. at a drift ratio of 9%. At a drift ratio of 2.5%, at which the maximum
load occurred on average for the upward and downward directions, the absorbed energy was
20% of the total energy absorbed, and at a drift ratio of 5% it was 50% of the total energy
absorbed. The energy absorption behavior of unit 5 was the highest of all six tests.
The joint shear stress versus joint shear strain for test unit 5 is shown in Figure 4.24. The
maximum joint shear stress was 766 psi in the upward direction, which corresponds to a γ=11.3
(psi). The downward maximum joint shear stress was 671 psi with a corresponding γ=9.9 (psi).
The joint shear strain at the maximum shear stress was 5840 µε in the upward direction and 2890
µε in the downward direction.
43
Test #5 — 0.1f'cAg axial load
0
100
200
300
400
500
600
700
800
0 1 2 3 4 5 6 7 8 9 10% Drift
Ener
gy (k
ip-in
)
11
10
9
8
7
65
Note: 10 = third cycle of load step number 10
Fig. 4.23 Unit 5: cumulative energy dissipation
Fig. 4.24 Unit 5: join stress versus joint shear strain
44
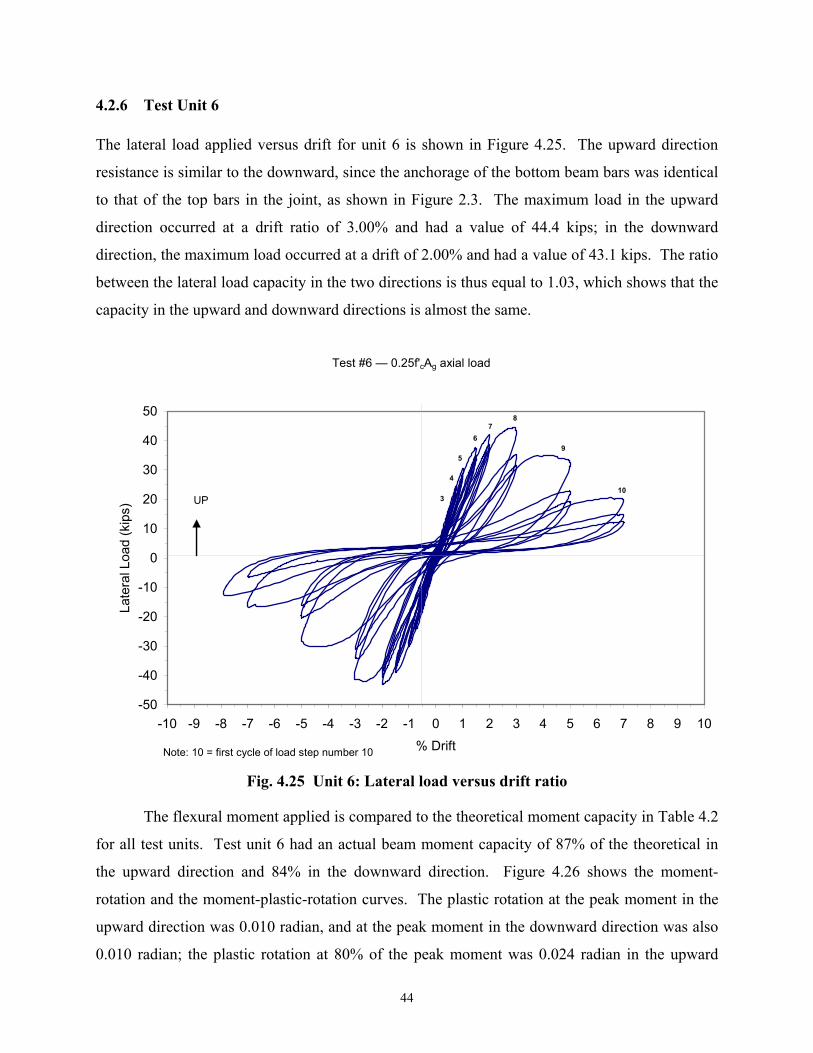
4.2.6 Test Unit 6
The lateral load applied versus drift for unit 6 is shown in Figure 4.25. The upward direction
resistance is similar to the downward, since the anchorage of the bottom beam bars was identical
to that of the top bars in the joint, as shown in Figure 2.3. The maximum load in the upward
direction occurred at a drift ratio of 3.00% and had a value of 44.4 kips; in the downward
direction, the maximum load occurred at a drift of 2.00% and had a value of 43.1 kips. The ratio
between the lateral load capacity in the two directions is thus equal to 1.03, which shows that the
capacity in the upward and downward directions is almost the same.
Test #6 — 0.25f'cAg axial load
-50
-40
-30
-20
-10
0
10
20
30
40
50
-10 -9 -8 -7 -6 -5 -4 -3 -2 -1 0 1 2 3 4 5 6 7 8 9 10% Drift
Late
ral L
oad
(kip
s)
10
9
87
6
5
4
3
Note: 10 = first cycle of load step number 10
UP
Fig. 4.25 Unit 6: Lateral load versus drift ratio
The flexural moment applied is compared to the theoretical moment capacity in Table 4.2
for all test units. Test unit 6 had an actual beam moment capacity of 87% of the theoretical in
the upward direction and 84% in the downward direction. Figure 4.26 shows the moment-
rotation and the moment-plastic-rotation curves. The plastic rotation at the peak moment in the
upward direction was 0.010 radian, and at the peak moment in the downward direction was also
0.010 radian; the plastic rotation at 80% of the peak moment was 0.024 radian in the upward

45
direction and 0.024 radian in the downward direction as well. Thus the upward and downward
capacities and performance are very close.
Test #6 — 0.25f'cAg axial load
-3000
-2000
-1000
0
1000
2000
3000
-0.10 -0.08 -0.06 -0.04 -0.02 0.00 0.02 0.04 0.06 0.08 0.10Rotation (radians)
Mom
ent (
kip-
in)
Rotation
Plastic Rotation
UP
Fig. 4.26 Unit 6: Moment-rotation and moment-plastic-rotation envelopes
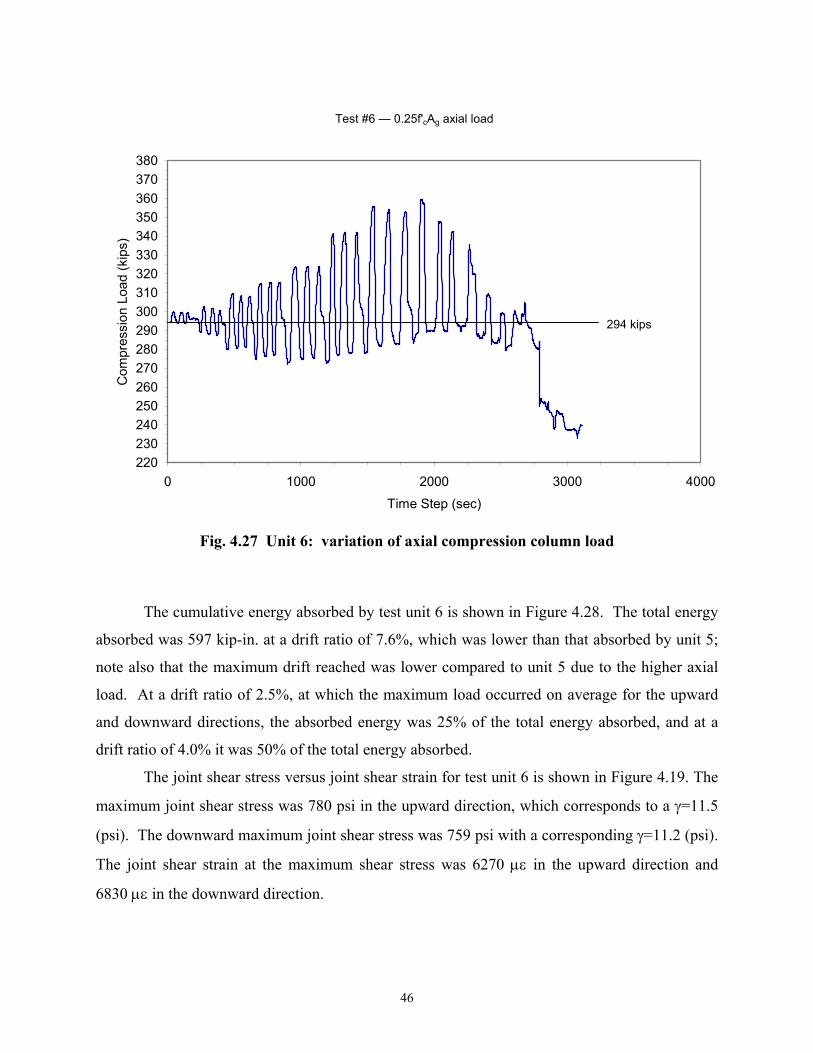
The column axial load for test unit 6 was set at a level of 0.25 f′cAg, which corresponds to
a 294 kips compression load. Variations in the level of axial load were substantial as shown in
Figure 4.27; the axial load varied in the range of 79% to 122%. The drop in axial load was 21%;
unit 6 eventually lost its axial-load-carrying capacity. It is clear that the primary failure mode is
joint shear.
46
Test #6 — 0.25f'cAg axial load
220230240250260270280290300310320330340350360370380
0 1000 2000 3000 4000Time Step (sec)
Com
pres
sion
Loa
d (k
ips)
294 kips
Fig. 4.27 Unit 6: variation of axial compression column load
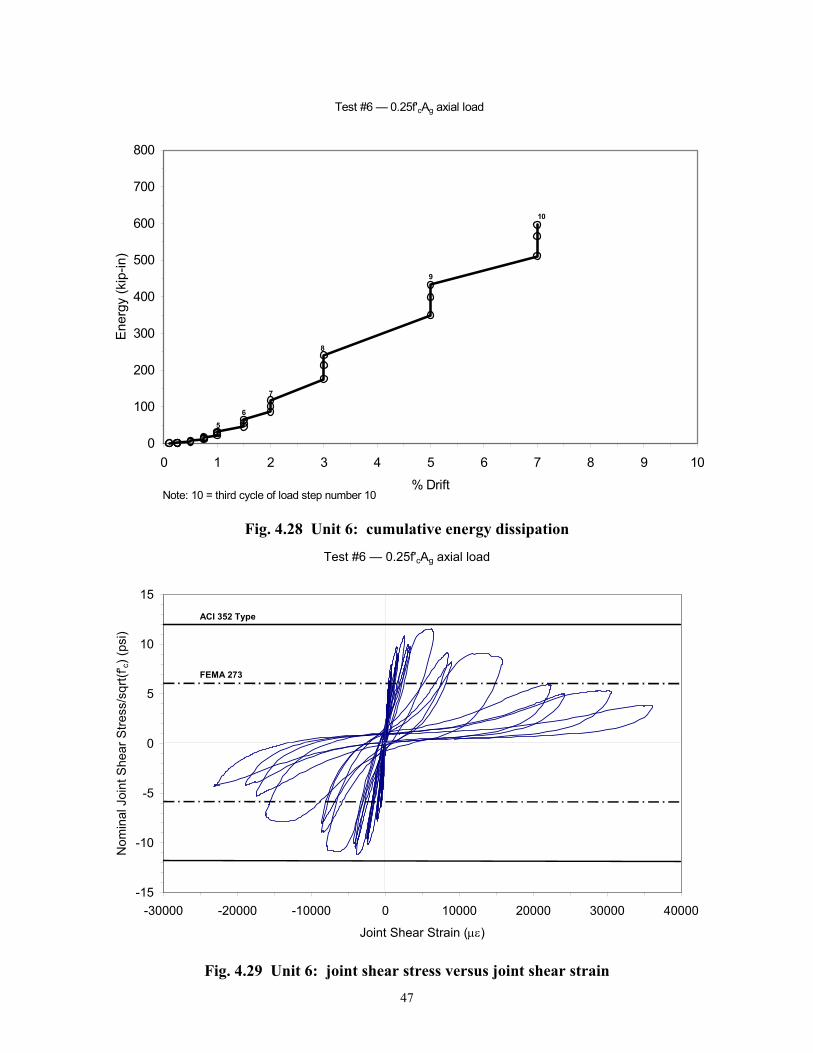
The cumulative energy absorbed by test unit 6 is shown in Figure 4.28. The total energy
absorbed was 597 kip-in. at a drift ratio of 7.6%, which was lower than that absorbed by unit 5;
note also that the maximum drift reached was lower compared to unit 5 due to the higher axial
load. At a drift ratio of 2.5%, at which the maximum load occurred on average for the upward
and downward directions, the absorbed energy was 25% of the total energy absorbed, and at a
drift ratio of 4.0% it was 50% of the total energy absorbed.
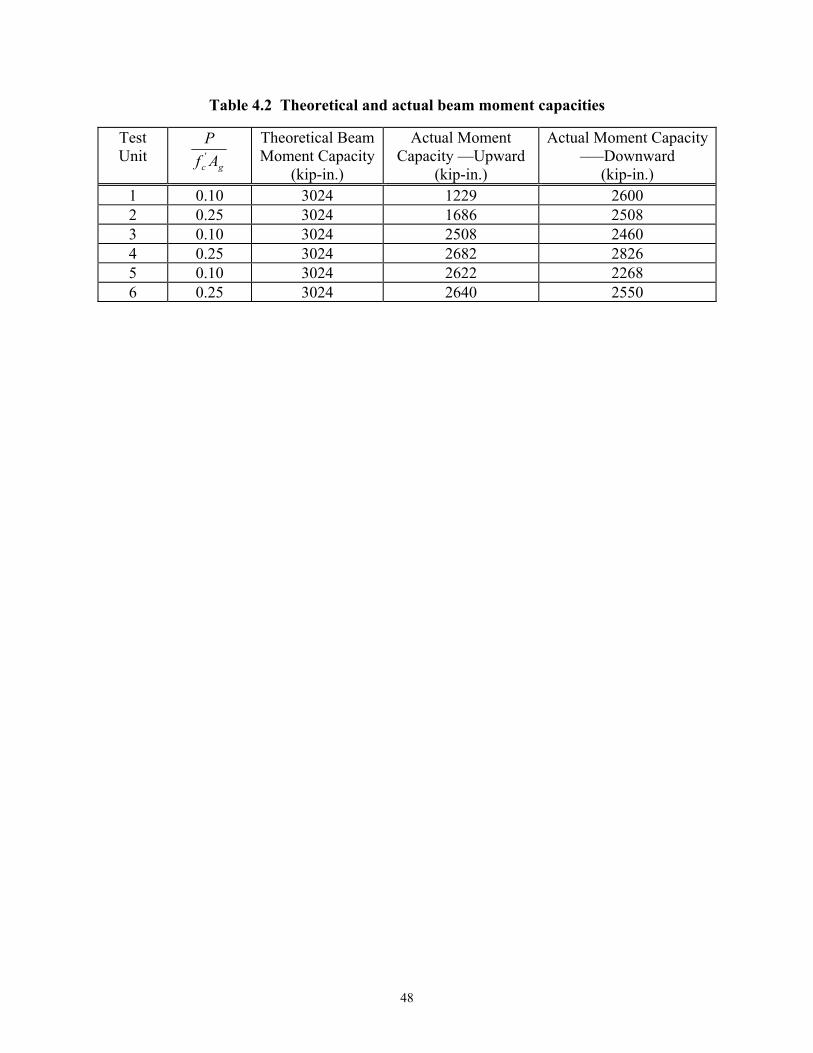
The joint shear stress versus joint shear strain for test unit 6 is shown in Figure 4.19. The
maximum joint shear stress was 780 psi in the upward direction, which corresponds to a γ=11.5
(psi). The downward maximum joint shear stress was 759 psi with a corresponding γ=11.2 (psi).
The joint shear strain at the maximum shear stress was 6270 µε in the upward direction and
6830 µε in the downward direction.
47
Test #6 — 0.25f'cAg axial load
0
100
200
300
400
500
600
700
800
0 1 2 3 4 5 6 7 8 9 10% Drift
Ener
gy (k
ip-in
)
10
9
8
7
65
Note: 10 = third cycle of load step number 10
Fig. 4.28 Unit 6: cumulative energy dissipation
Test #6 — 0.25f'cAg axial load
-15
-10
-5
0
5
10
15
-30000 -20000 -10000 0 10000 20000 30000 40000
Joint Shear Strain (µε)
Nom
inal
Joi
nt S
hear
Stre
ss/s
qrt(f
' c) (p
si)
FEMA 273
ACI 352 Type
Fig. 4.29 Unit 6: joint shear stress versus joint shear strain
48
Table 4.2 Theoretical and actual beam moment capacities
Test Unit
gc AfP'
Theoretical Beam Moment Capacity
(kip-in.)
Actual Moment Capacity —Upward
(kip-in.)
Actual Moment Capacity –—Downward
(kip-in.) 1 0.10 3024 1229 2600 2 0.25 3024 1686 2508 3 0.10 3024 2508 2460 4 0.25 3024 2682 2826 5 0.10 3024 2622 2268 6 0.25 3024 2640 2550
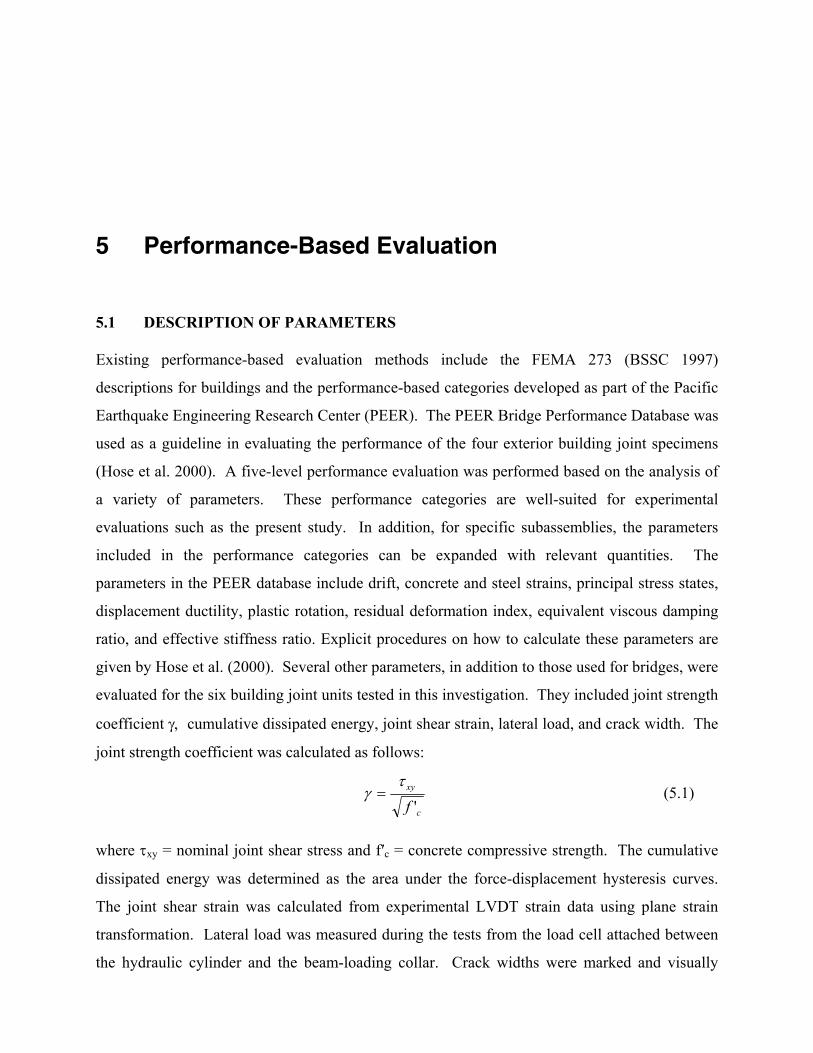
5 Performance-Based Evaluation
5.1 DESCRIPTION OF PARAMETERS
Existing performance-based evaluation methods include the FEMA 273 (BSSC 1997)
descriptions for buildings and the performance-based categories developed as part of the Pacific
Earthquake Engineering Research Center (PEER). The PEER Bridge Performance Database was
used as a guideline in evaluating the performance of the four exterior building joint specimens
(Hose et al. 2000). A five-level performance evaluation was performed based on the analysis of
a variety of parameters. These performance categories are well-suited for experimental
evaluations such as the present study. In addition, for specific subassemblies, the parameters
included in the performance categories can be expanded with relevant quantities. The
parameters in the PEER database include drift, concrete and steel strains, principal stress states,
displacement ductility, plastic rotation, residual deformation index, equivalent viscous damping
ratio, and effective stiffness ratio. Explicit procedures on how to calculate these parameters are
given by Hose et al. (2000). Several other parameters, in addition to those used for bridges, were
evaluated for the six building joint units tested in this investigation. They included joint strength
coefficient γ, cumulative dissipated energy, joint shear strain, lateral load, and crack width. The
joint strength coefficient was calculated as follows:
c
xy
f 'τ
γ = (5.1)
where τxy = nominal joint shear stress and f′c = concrete compressive strength. The cumulative
dissipated energy was determined as the area under the force-displacement hysteresis curves.
The joint shear strain was calculated from experimental LVDT strain data using plane strain
transformation. Lateral load was measured during the tests from the load cell attached between
the hydraulic cylinder and the beam-loading collar. Crack widths were marked and visually
50
measured during the tests. A peak value for each parameter was calculated or measured for each
cycle of each load step with the exception of crack width, which was measured only at the end of
each load step. These parameters were prepared for each test with the up and down loading
directions considered separately. These results are presented in Tables 5.1 through 5.12. The
values of the various parameters were used to delineate the five performance levels.
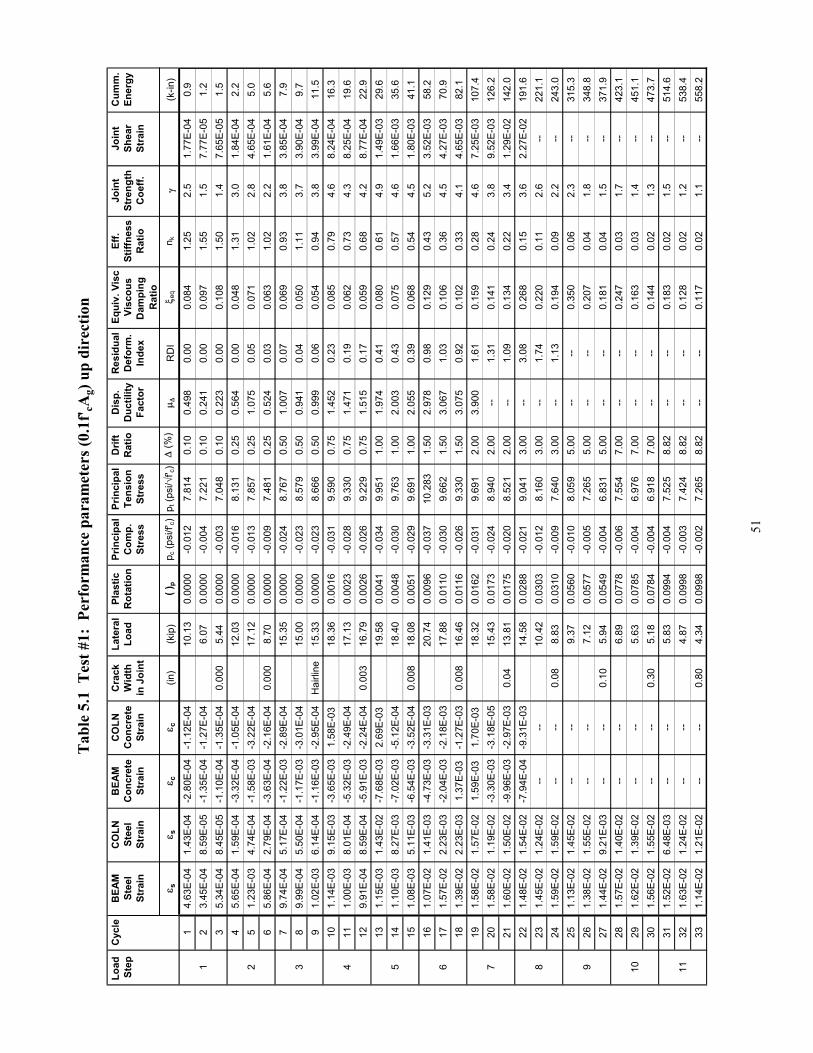
51
Load
C
ycle
BEA
MC
OLN
BEA
MC
OLN
Cra
ckLa
tera
lPl
astic
Prin
cipa
lPr
inci
pal
Drif
tD
isp.
Res
idua
lEq
uiv.
Vis
cEf
f.Jo
int
Join
tC
umm
.St
epSt
eel
Stee
lC
oncr
ete
Con
cret
eW
idth
Load
Rot
atio
nC
omp.
Tens
ion
Rat
ioD
uctil
ityD
efor
m.
Visc
ous
Stiff
ness
Stre
ngth
Shea
rEn
ergy
Stra
inSt
rain
Stra
inSt
rain
in J
oint
Stre
ssSt
ress
Fact
orIn
dex
Dam
ping
R
atio
Coe
ff.St
rain
Rat
ioε s
ε sε c
ε c(in
)(k
ip)
( )p
p c (p
si/f'
c)p t
(psi
/√f' c
)∆
(%)
µ ∆R
DI
ξ eq
n kγ
(k-in
)1
4.63
E-04
1.43
E-04
-2.8
0E-0
4-1
.12E
-04
10.1
30.
0000
-0.0
127.
814
0.10
0.49
80.
000.
084
1.25
2.5
1.77
E-04
0.9
12
3.45
E-04
8.59
E-05
-1.3
5E-0
4-1
.27E
-04
6.07
0.00
00-0
.004
7.22
10.
100.
241
0.00
0.09
71.
551.
57.
77E-
051.
23
5.34
E-04
8.45
E-05
-1.1
0E-0
4-1
.35E
-04
0.00
05.
440.
0000
-0.0
037.
048
0.10
0.22
30.
000.
108
1.50
1.4
7.65
E-05
1.5
45.
65E-
041.
59E-
04-3
.32E
-04
-1.0
5E-0
412
.03
0.00
00-0
.016
8.13
10.
250.
564
0.00
0.04
81.
313.
01.
84E-
042.
22
51.
23E-
034.
74E-
04-1
.58E
-03
-3.2
2E-0
417
.12
0.00
00-0
.013
7.85
70.
251.
075
0.05
0.07
11.
022.
84.
65E-
045.
06
5.86
E-04
2.79
E-04
-3.6
3E-0
4-2
.16E
-04
0.00
08.
700.
0000
-0.0
097.
481
0.25
0.52
40.
030.
063
1.02
2.2
1.61
E-04
5.6
79.
74E-
045.
17E-
04-1
.22E
-03
-2.8
9E-0
415
.35
0.00
00-0
.024
8.76
70.
501.
007
0.07
0.06
90.
933.
83.
85E-
047.
93
89.
99E-
045.
50E-
04-1
.17E
-03
-3.0
1E-0
415
.00
0.00
00-0
.023
8.57
90.
500.
941
0.04
0.05
01.
113.
73.
90E-
049.
79
1.02
E-03
6.14
E-04
-1.1
6E-0
3-2
.95E
-04
Hai
rline
15.3
30.
0000
-0.0
238.
666
0.50
0.99
90.
060.
054
0.94
3.8
3.99
E-04
11.5
101.
14E-
039.
15E-
03-3
.65E
-03
1.58
E-03
18.3
60.
0016
-0.0
319.
590
0.75
1.45
20.
230.
085
0.79
4.6
8.24
E-04
16.3
411
1.00
E-03
8.01
E-04
-5.3
2E-0
3-2
.49E
-04
17.1
30.
0023
-0.0
289.
330
0.75
1.47
10.
190.
062
0.73
4.3
8.25
E-04
19.6
129.
91E-
048.
59E-
04-5
.91E
-03
-2.2
4E-0
40.
003
16.7
90.
0026
-0.0
269.
229
0.75
1.51
50.
170.
059
0.68
4.2
8.77
E-04
22.9
131.
15E-
031.
43E-
02-7
.68E
-03
2.69
E-03
19.5
80.
0041
-0.0
349.
951
1.00
1.97
40.
410.
080
0.61
4.9
1.49
E-03
29.6
514
1.10
E-03
8.27
E-03
-7.0
2E-0
3-5
.12E
-04
18.4
00.
0048
-0.0
309.
763
1.00
2.00
30.
430.
075
0.57
4.6
1.66
E-03
35.6
151.
08E-
035.
11E-
03-6
.54E
-03
-3.5
2E-0
40.
008
18.0
80.
0051
-0.0
299.
691
1.00
2.05
50.
390.
068
0.54
4.5
1.80
E-03
41.1
161.
07E-
021.
41E-
03-4
.73E
-03
-3.3
1E-0
320
.74
0.00
96-0
.037
10.2
831.
502.
978
0.98
0.12
90.
435.
23.
52E-
0358
.26
171.
57E-
022.
23E-
03-2
.04E
-03
-2.1
8E-0
317
.88
0.01
10-0
.030
9.66
21.
503.
067
1.03
0.10
60.
364.
54.
27E-
0370
.918
1.39
E-02
2.23
E-03
1.37
E-03
-1.2
7E-0
30.
008
16.4
60.
0116
-0.0
269.
330
1.50
3.07
50.
920.
102
0.33
4.1
4.65
E-03
82.1
191.
58E-
021.
57E-
021.
59E-
031.
70E-
0318
.32
0.01
62-0
.031
9.69
12.
003.
900
1.61
0.15
90.
284.
67.
25E-
0310
7.4
720
1.58
E-02
1.19
E-02
-3.3
0E-0
3-3
.18E
-05
15.4
30.
0173
-0.0
248.
940
2.00
--1.
310.
141
0.24
3.8
9.52
E-03
126.
221
1.60
E-02
1.50
E-02
-9.9
6E-0
3-2
.97E
-03
0.04
13.8
10.
0175
-0.0
208.
521
2.00
--1.
090.
134
0.22
3.4
1.29
E-02
142.
022
1.48
E-02
1.54
E-02
-7.9
4E-0
4-9
.31E
-03
14.5
80.
0288
-0.0
219.
041
3.00
--3.
080.
268
0.15
3.6
2.27
E-02
191.
68
231.
45E-
021.
24E-
02--
--10
.42
0.03
03-0
.012
8.16
03.
00--
1.74
0.22
00.
112.
6--
221.
124
1.59
E-02
1.59
E-02
----
0.08
8.83
0.03
10-0
.009
7.64
03.
00--
1.13
0.19
40.
092.
2--
243.
025
1.13
E-02
1.45
E-02
----
9.37
0.05
60-0
.010
8.05
95.
00--
--0.
350
0.06
2.3
--31
5.3
926
1.38
E-02
1.55
E-02
----
7.12
0.05
77-0
.005
7.26
55.
00--
--0.
207
0.04
1.8
--34
8.8
271.
44E-
029.
21E-
03--
--0.
105.
940.
0549
-0.0
046.
831
5.00
----
0.18
10.
041.
5--
371.
928
1.57
E-02
1.40
E-02
----
6.89
0.07
78-0
.006
7.55
47.
00--
--0.
247
0.03
1.7
--42
3.1
1029
1.62
E-02
1.39
E-02
----
5.63
0.07
85-0
.004
6.97
67.
00--
--0.
163
0.03
1.4
--45
1.1
301.
56E-
021.
55E-
02--
--0.
305.
180.
0784
-0.0
046.
918
7.00
----
0.14
40.
021.
3--
473.
731
1.52
E-02
6.48
E-03
----
5.83
0.09
94-0
.004
7.52
58.
82--
--0.
183
0.02
1.5
--51
4.6
1132
1.63
E-02
1.24
E-02
----
4.87
0.09
98-0
.003
7.42
48.
82--
--0.
128
0.02
1.2
--53
8.4
331.
14E-
021.
21E-
02--
--0.
804.
340.
0998
-0.0
027.
265
8.82
----
0.11
70.
021.
1--
558.
2
Tab
le 5
.1 T
est #
1: P
erfo
rman
ce p
aram
eter
s (0.
1f' cA
g) u
p di
rect
ion
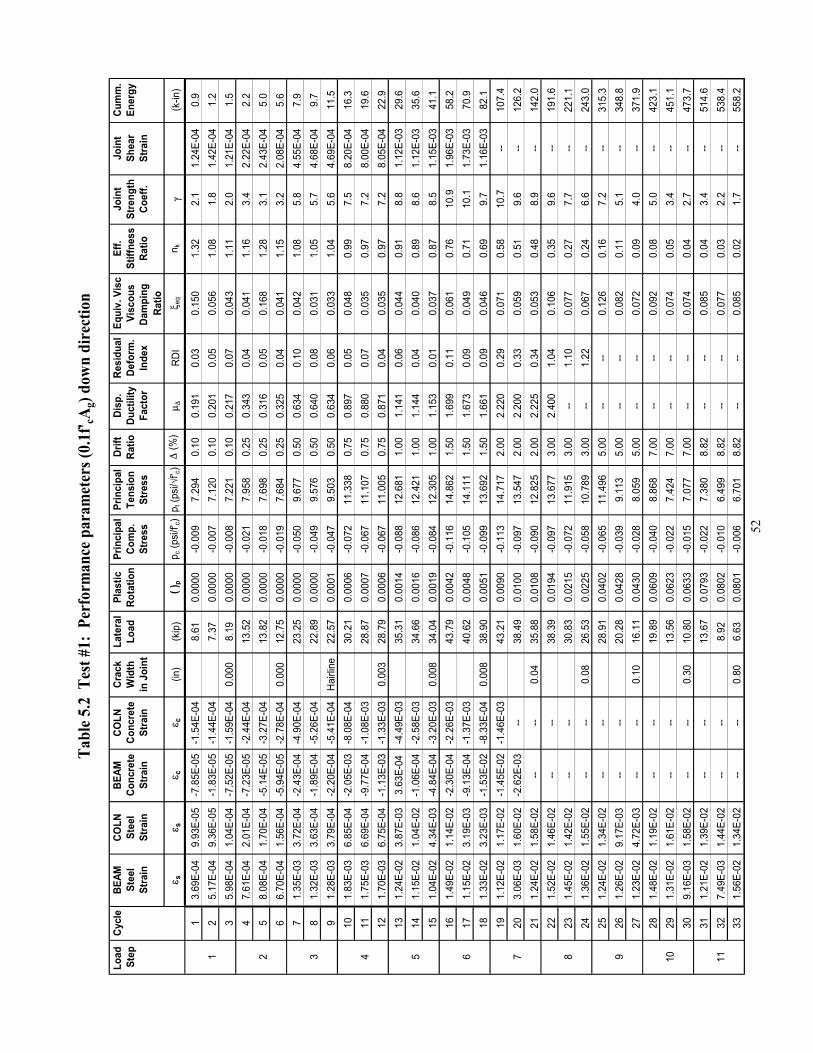
52
Load
Cy
cle
BEAM
COLN
BEAM
COLN
Crac
kLa
tera
lPl
astic
Prin
cipa
lPr
inci
pal
Drift
Disp
.Re
sidu
alEq
uiv.
Vis
cEf
f.Jo
int
Join
tCu
mm
.St
epSt
eel
Stee
lCo
ncre
teCo
ncre
teW
idth
Load
Rota
tion
Com
p.Te
nsio
nRa
tioDu
ctili
tyDe
form
.Vi
scou
sSt
iffne
ssSt
reng
thSh
ear
Ener
gySt
rain
Stra
inSt
rain
Stra
inin
Joi
ntSt
ress
Stre
ssFa
ctor
Inde
xDa
mpi
ng
Ratio
Coef
f.St
rain
Ratio
ε sε s
ε cε c
(in)
(kip
)( )
pp c
(psi/
f' c)
p t (p
si/√f
' c)∆
(%)
µ ∆RD
Iξ e
qn k
γ(k
-in)
13.
69E-
049.
93E-
05-7
.85E
-05
-1.5
4E-0
48.
610.
0000
-0.0
097.
294
0.10
0.19
10.
030.
150
1.32
2.1
1.24
E-04
0.9
12
5.17
E-04
9.36
E-05
-1.8
3E-0
5-1
.44E
-04
7.37
0.00
00-0
.007
7.12
00.
100.
201
0.05
0.05
61.
081.
81.
42E-
041.
23
5.98
E-04
1.04
E-04
-7.5
2E-0
5-1
.59E
-04
0.00
08.
190.
0000
-0.0
087.
221
0.10
0.21
70.
070.
043
1.11
2.0
1.21
E-04
1.5
47.
61E-
042.
01E-
04-7
.23E
-05
-2.4
4E-0
413
.52
0.00
00-0
.021
7.95
80.
250.
343
0.04
0.04
11.
163.
42.
22E-
042.
22
58.
08E-
041.
70E-
04-5
.14E
-05
-3.2
7E-0
413
.82
0.00
00-0
.018
7.69
80.
250.
316
0.05
0.16
81.
283.
12.
43E-
045.
06
6.70
E-04
1.56
E-04
-5.9
4E-0
5-2
.78E
-04
0.00
012
.75
0.00
00-0
.019
7.68
40.
250.
325
0.04
0.04
11.
153.
22.
08E-
045.
67
1.35
E-03
3.72
E-04
-2.4
3E-0
4-4
.90E
-04
23.2
50.
0000
-0.0
509.
677
0.50
0.63
40.
100.
042
1.08
5.8
4.55
E-04
7.9
38
1.32
E-03
3.63
E-04
-1.8
9E-0
4-5
.26E
-04
22.8
90.
0000
-0.0
499.
576
0.50
0.64
00.
080.
031
1.05
5.7
4.68
E-04
9.7
91.
28E-
033.
79E-
04-2
.20E
-04
-5.4
1E-0
4Ha
irlin
e22
.57
0.00
01-0
.047
9.50
30.
500.
634
0.06
0.03
31.
045.
64.
69E-
0411
.510
1.83
E-03
6.85
E-04
-2.0
5E-0
3-8
.08E
-04
30.2
10.
0006
-0.0
7211
.338
0.75
0.89
70.
050.
048
0.99
7.5
8.20
E-04
16.3
411
1.75
E-03
6.69
E-04
-9.7
7E-0
4-1
.08E
-03
28.8
70.
0007
-0.0
6711
.107
0.75
0.88
00.
070.
035
0.97
7.2
8.00
E-04
19.6
121.
70E-
036.
75E-
04-1
.13E
-03
-1.3
3E-0
30.
003
28.7
90.
0006
-0.0
6711
.005
0.75
0.87
10.
040.
035
0.97
7.2
8.05
E-04
22.9
131.
24E-
023.
87E-
033.
63E-
04-4
.49E
-03
35.3
10.
0014
-0.0
8812
.681
1.00
1.14
10.
060.
044
0.91
8.8
1.12
E-03
29.6
514
1.15
E-02
1.04
E-02
-1.0
6E-0
4-2
.58E
-03
34.6
60.
0016
-0.0
8612
.421
1.00
1.14
40.
040.
040
0.89
8.6
1.12
E-03
35.6
151.
04E-
024.
34E-
03-4
.84E
-04
-3.2
0E-0
30.
008
34.0
40.
0019
-0.0
8412
.305
1.00
1.15
30.
010.
037
0.87
8.5
1.15
E-03
41.1
161.
49E-
021.
14E-
02-2
.30E
-04
-2.2
6E-0
343
.79
0.00
42-0
.116
14.8
621.
501.
699
0.11
0.06
10.
7610
.91.
96E-
0358
.26
171.
15E-
023.
19E-
03-9
.13E
-04
-1.3
7E-0
340
.62
0.00
48-0
.105
14.1
111.
501.
673
0.09
0.04
90.
7110
.11.
73E-
0370
.918
1.33
E-02
3.23
E-03
-1.5
3E-0
2-8
.33E
-04
0.00
838
.90
0.00
51-0
.099
13.6
921.
501.
661
0.09
0.04
60.
699.
71.
16E-
0382
.119
1.12
E-02
1.17
E-02
-1.4
5E-0
2-1
.46E
-03
43.2
10.
0090
-0.1
1314
.717
2.00
2.22
00.
290.
071
0.58
10.7
--10
7.4
720
3.06
E-03
1.60
E-02
-2.6
2E-0
3--
38.4
90.
0100
-0.0
9713
.547
2.00
2.20
00.
330.
059
0.51
9.6
--12
6.2
211.
24E-
021.
58E-
02--
--0.
0435
.88
0.01
08-0
.090
12.8
252.
002.
225
0.34
0.05
30.
488.
9--
142.
022
1.52
E-02
1.46
E-02
----
38.3
90.
0194
-0.0
9713
.677
3.00
2.40
01.
040.
106
0.35
9.6
--19
1.6
823
1.45
E-02
1.42
E-02
----
30.8
30.
0215
-0.0
7211
.915
3.00
--1.
100.
077
0.27
7.7
--22
1.1
241.
36E-
021.
55E-
02--
--0.
0826
.53
0.02
25-0
.058
10.7
893.
00--
1.22
0.06
70.
246.
6--
243.
025
1.24
E-02
1.34
E-02
----
28.9
10.
0402
-0.0
6511
.496
5.00
----
0.12
60.
167.
2--
315.
39
261.
26E-
029.
17E-
03--
--20
.28
0.04
28-0
.039
9.11
35.
00--
--0.
082
0.11
5.1
--34
8.8
271.
23E-
024.
72E-
03--
--0.
1016
.11
0.04
30-0
.028
8.05
95.
00--
--0.
072
0.09
4.0
--37
1.9
281.
48E-
021.
19E-
02--
--19
.89
0.06
09-0
.040
8.86
87.
00--
--0.
092
0.08
5.0
--42
3.1
1029
1.31
E-02
1.61
E-02
----
13.5
60.
0623
-0.0
227.
424
7.00
----
0.07
40.
053.
4--
451.
130
9.16
E-03
1.58
E-02
----
0.30
10.8
00.
0633
-0.0
157.
077
7.00
----
0.07
40.
042.
7--
473.
731
1.21
E-02
1.39
E-02
----
13.6
70.
0793
-0.0
227.
380
8.82
----
0.08
50.
043.
4--
514.
611
327.
49E-
031.
44E-
02--
--8.
920.
0802
-0.0
106.
499
8.82
----
0.07
70.
032.
2--
538.
433
1.56
E-02
1.34
E-02
----
0.80
6.63
0.08
01-0
.006
6.70
18.
82--
--0.
085
0.02
1.7
--55
8.2
Tabl
e 5.2
Tes
t #1:
Per
form
ance
par
amet
ers (
0.1f
' cAg)
dow
n di
rect
ion
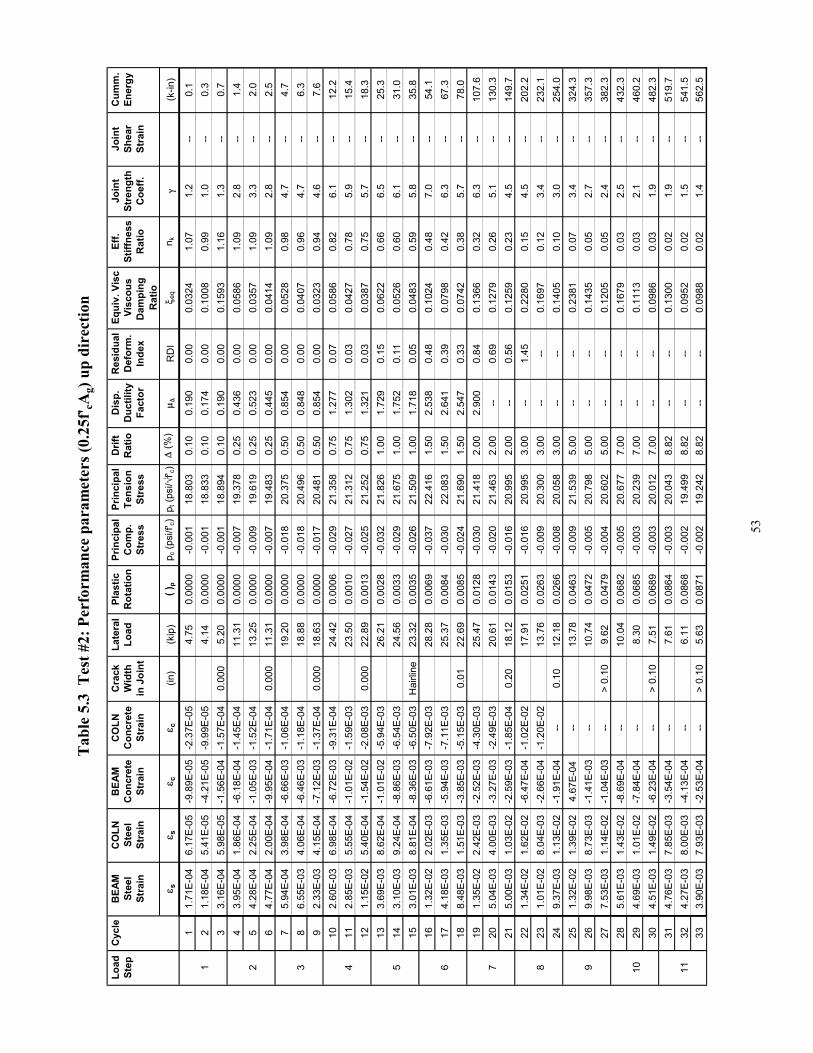
53
Load
Cyc
leB
EAM
CO
LNB
EAM
CO
LNC
rack
Late
ral
Plas
ticPr
inci
pal
Prin
cipa
lD
rift
Dis
p.R
esid
ual
Equi
v. V
isc
Eff.
Join
tJo
int
Cum
m.
Step
Stee
lSt
eel
Con
cret
eC
oncr
ete
Wid
thLo
adR
otat
ion
Com
p.Te
nsio
nR
atio
Duc
tility
Def
orm
.Vi
scou
sSt
iffne
ssSt
reng
thSh
ear
Ener
gySt
rain
Stra
inSt
rain
Stra
inin
Joi
ntSt
ress
Stre
ssFa
ctor
Inde
xD
ampi
ng
Rat
ioC
oeff.
Stra
inR
atio
ε sε s
ε cε c
(in)
(kip
)( )
pp c
(psi
/f'c)
p t (p
si/√
f' c)
∆ (%
)µ ∆
RD
Iξ e
qn k
γ(k
-in)
11.
71E-
046.
17E-
05-9
.89E
-05
-2.3
7E-0
54.
750.
0000
-0.0
0118
.803
0.10
0.19
00.
000.
0324
1.07
1.2
--0.
11
21.
18E-
045.
41E-
05-4
.21E
-05
-9.9
9E-0
54.
140.
0000
-0.0
0118
.833
0.10
0.17
40.
000.
1008
0.99
1.0
--0.
33
3.16
E-04
5.98
E-05
-1.5
6E-0
4-1
.57E
-04
0.00
05.
200.
0000
-0.0
0118
.894
0.10
0.19
00.
000.
1593
1.16
1.3
--0.
74
3.95
E-04
1.86
E-04
-6.1
8E-0
4-1
.45E
-04
11.3
10.
0000
-0.0
0719
.378
0.25
0.43
60.
000.
0586
1.09
2.8
--1.
42
54.
28E-
042.
25E-
04-1
.05E
-03
-1.5
2E-0
413
.25
0.00
00-0
.009
19.6
190.
250.
523
0.00
0.03
571.
093.
3--
2.0
64.
77E-
042.
00E-
04-9
.95E
-04
-1.7
1E-0
40.
000
11.3
10.
0000
-0.0
0719
.483
0.25
0.44
50.
000.
0414
1.09
2.8
--2.
57
5.94
E-04
3.98
E-04
-6.6
6E-0
3-1
.06E
-04
19.2
00.
0000
-0.0
1820
.375
0.50
0.85
40.
000.
0528
0.98
4.7
--4.
73
86.
55E-
034.
06E-
04-6
.46E
-03
-1.1
8E-0
418
.88
0.00
00-0
.018
20.4
960.
500.
848
0.00
0.04
070.
964.
7--
6.3
92.
33E-
034.
15E-
04-7
.12E
-03
-1.3
7E-0
40.
000
18.6
30.
0000
-0.0
1720
.481
0.50
0.85
40.
000.
0323
0.94
4.6
--7.
610
2.60
E-03
6.98
E-04
-6.7
2E-0
3-9
.31E
-04
24.4
20.
0006
-0.0
2921
.358
0.75
1.27
70.
070.
0586
0.82
6.1
--12
.24
112.
85E-
035.
55E-
04-1
.01E
-02
-1.5
9E-0
323
.50
0.00
10-0
.027
21.3
120.
751.
302
0.03
0.04
270.
785.
9--
15.4
121.
15E-
025.
40E-
04-1
.54E
-02
-2.0
8E-0
30.
000
22.8
90.
0013
-0.0
2521
.252
0.75
1.32
10.
030.
0387
0.75
5.7
--18
.313
3.69
E-03
8.62
E-04
-1.0
1E-0
2-5
.94E
-03
26.2
10.
0028
-0.0
3221
.826
1.00
1.72
90.
150.
0622
0.66
6.5
--25
.35
143.
10E-
039.
24E-
04-8
.86E
-03
-6.5
4E-0
324
.56
0.00
33-0
.029
21.6
751.
001.
752
0.11
0.05
260.
606.
1--
31.0
153.
01E-
038.
81E-
04-8
.36E
-03
-6.5
0E-0
3H
airli
ne23
.32
0.00
35-0
.026
21.5
091.
001.
718
0.05
0.04
830.
595.
8--
35.8
161.
32E-
022.
02E-
03-6
.61E
-03
-7.9
2E-0
328
.28
0.00
69-0
.037
22.4
161.
502.
538
0.48
0.10
240.
487.
0--
54.1
617
4.18
E-03
1.35
E-03
-5.9
4E-0
3-7
.11E
-03
25.3
70.
0084
-0.0
3022
.083
1.50
2.64
10.
390.
0798
0.42
6.3
--67
.318
8.48
E-03
1.51
E-03
-3.8
5E-0
3-5
.15E
-03
0.01
22.6
90.
0085
-0.0
2421
.690
1.50
2.54
70.
330.
0742
0.38
5.7
--78
.019
1.35
E-02
2.42
E-03
-2.5
2E-0
3-4
.30E
-03
25.4
70.
0128
-0.0
3021
.418
2.00
2.90
00.
840.
1366
0.32
6.3
--10
7.6
720
5.04
E-03
4.00
E-03
-3.2
7E-0
3-2
.49E
-03
20.6
10.
0143
-0.0
2021
.463
2.00
--0.
690.
1279
0.26
5.1
--13
0.3
215.
00E-
031.
03E-
02-2
.59E
-03
-1.8
5E-0
40.
2018
.12
0.01
53-0
.016
20.9
952.
00--
0.56
0.12
590.
234.
5--
149.
722
1.34
E-02
1.62
E-02
-6.4
7E-0
4-1
.02E
-02
17.9
10.
0251
-0.0
1620
.995
3.00
--1.
450.
2280
0.15
4.5
--20
2.2
823
1.01
E-02
8.04
E-03
-2.6
6E-0
4-1
.20E
-02
13.7
60.
0263
-0.0
0920
.300
3.00
----
0.16
970.
123.
4--
232.
124
9.37
E-03
1.13
E-02
-1.9
1E-0
4--
0.10
12.1
80.
0266
-0.0
0820
.058
3.00
----
0.14
050.
103.
0--
254.
025
1.32
E-02
1.39
E-02
4.67
E-04
--13
.78
0.04
63-0
.009
21.5
395.
00--
--0.
2381
0.07
3.4
--32
4.3
926
9.98
E-03
8.73
E-03
-1.4
1E-0
3--
10.7
40.
0472
-0.0
0520
.798
5.00
----
0.14
350.
052.
7--
357.
327
7.53
E-03
1.14
E-02
-1.0
4E-0
3--
> 0.
109.
620.
0479
-0.0
0420
.602
5.00
----
0.12
050.
052.
4--
382.
328
5.61
E-03
1.43
E-02
-8.6
9E-0
4--
10.0
40.
0682
-0.0
0520
.677
7.00
----
0.16
790.
032.
5--
432.
310
294.
69E-
031.
01E-
02-7
.84E
-04
--8.
300.
0685
-0.0
0320
.239
7.00
----
0.11
130.
032.
1--
460.
230
4.51
E-03
1.49
E-02
-6.2
3E-0
4--
> 0.
107.
510.
0689
-0.0
0320
.012
7.00
----
0.09
860.
031.
9--
482.
331
4.76
E-03
7.85
E-03
-3.5
4E-0
4--
7.61
0.08
64-0
.003
20.0
438.
82--
--0.
1300
0.02
1.9
--51
9.7
1132
4.27
E-03
8.00
E-03
-4.1
3E-0
4--
6.11
0.08
68-0
.002
19.4
998.
82--
--0.
0952
0.02
1.5
--54
1.5
333.
90E-
037.
93E-
03-2
.53E
-04
-->
0.10
5.63
0.08
71-0
.002
19.2
428.
82--
--0.
0988
0.02
1.4
--56
2.5
Tab
le 5
.3 T
est #
2: P
erfo
rman
ce p
aram
eter
s (0.
25f' c
Ag)
up
dire
ctio
n
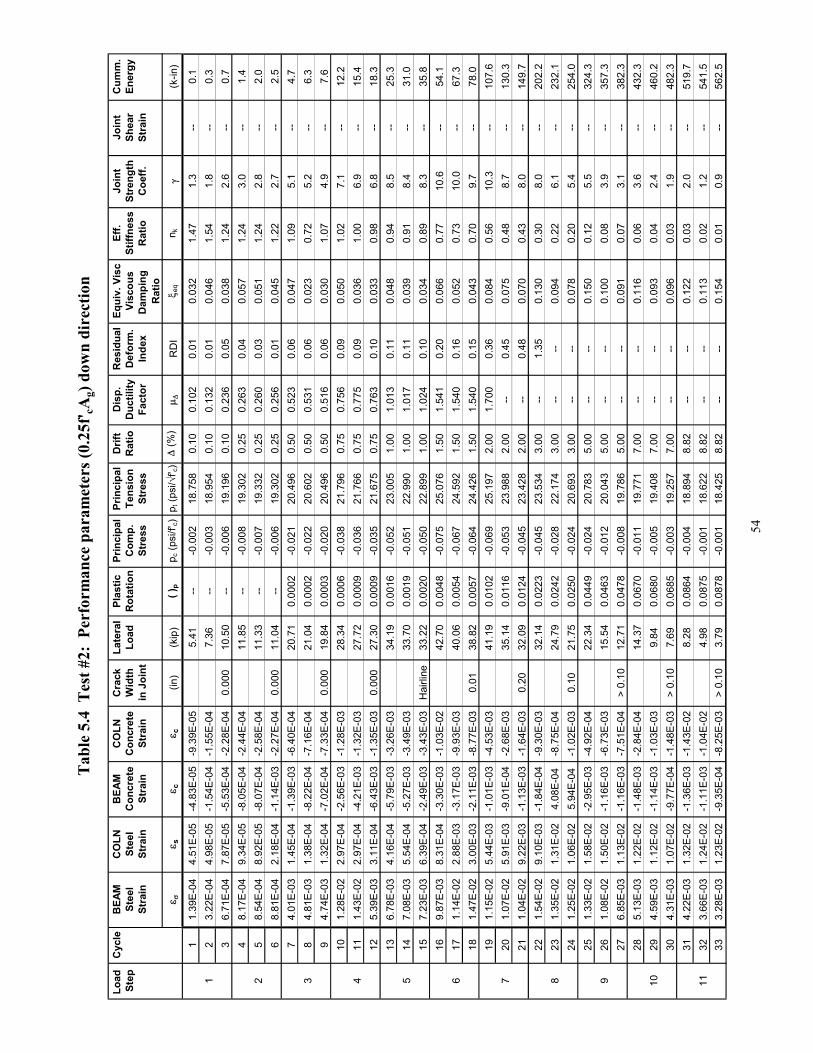
54
Load
C
ycle
BEA
MC
OLN
BEA
MC
OLN
Cra
ckLa
tera
lPl
astic
Prin
cipa
lPr
inci
pal
Drif
tD
isp.
Res
idua
lEq
uiv.
Vis
cEf
f.Jo
int
Join
tC
umm
.St
epSt
eel
Stee
lC
oncr
ete
Con
cret
eW
idth
Load
Rot
atio
nC
omp.
Tens
ion
Rat
ioD
uctil
it yD
efor
m.
Visc
ous
Stiff
ness
Stre
ngth
Shea
rEn
ergy
Stra
inSt
rain
Stra
inSt
rain
in J
oint
Stre
ssSt
ress
Fact
orIn
dex
Dam
ping
R
atio
Coe
ff.St
rain
Rat
ioε σ
ε sε c
ε c(in
)(k
ip)
( )p
p c (p
si/f'
c)p t
(psi
/√f' c
)∆
(%)
µ ∆R
DI
ξ eq
n kγ
(k-in
)
11.
39E-
044.
51E-
05-4
.83E
-05
-9.3
9E-0
55.
41--
-0.0
0218
.758
0.10
0.10
20.
010.
032
1.47
1.3
--0.
11
23.
22E-
044.
98E-
05-1
.54E
-04
-1.5
5E-0
47.
36--
-0.0
0318
.954
0.10
0.13
20.
010.
046
1.54
1.8
--0.
33
6.71
E-04
7.87
E-05
-5.5
3E-0
4-2
.28E
-04
0.00
010
.50
---0
.006
19.1
960.
100.
236
0.05
0.03
81.
242.
6--
0.7
48.
17E-
049.
34E-
05-8
.05E
-04
-2.4
4E-0
411
.85
---0
.008
19.3
020.
250.
263
0.04
0.05
71.
243.
0--
1.4
25
8.54
E-04
8.92
E-05
-8.0
7E-0
4-2
.58E
-04
11.3
3--
-0.0
0719
.332
0.25
0.26
00.
030.
051
1.24
2.8
--2.
06
8.81
E-04
2.18
E-04
-1.1
4E-0
3-2
.27E
-04
0.00
011
.04
---0
.006
19.3
020.
250.
256
0.01
0.04
51.
222.
7--
2.5
74.
01E-
031.
45E-
04-1
.39E
-03
-6.4
0E-0
420
.71
0.00
02-0
.021
20.4
960.
500.
523
0.06
0.04
71.
095.
1--
4.7
38
4.81
E-03
1.38
E-04
-8.2
2E-0
4-7
.16E
-04
21.0
40.
0002
-0.0
2220
.602
0.50
0.53
10.
060.
023
0.72
5.2
--6.
39
4.74
E-03
1.32
E-04
-7.0
2E-0
4-7
.33E
-04
0.00
019
.84
0.00
03-0
.020
20.4
960.
500.
516
0.06
0.03
01.
074.
9--
7.6
101.
28E-
022.
97E-
04-2
.56E
-03
-1.2
8E-0
328
.34
0.00
06-0
.038
21.7
960.
750.
756
0.09
0.05
01.
027.
1--
12.2
411
1.43
E-02
2.97
E-04
-4.2
1E-0
3-1
.32E
-03
27.7
20.
0009
-0.0
3621
.766
0.75
0.77
50.
090.
036
1.00
6.9
--15
.412
5.39
E-03
3.11
E-04
-6.4
3E-0
3-1
.35E
-03
0.00
027
.30
0.00
09-0
.035
21.6
750.
750.
763
0.10
0.03
30.
986.
8--
18.3
136.
78E-
034.
16E-
04-5
.79E
-03
-3.2
6E-0
334
.19
0.00
16-0
.052
23.0
051.
001.
013
0.11
0.04
80.
948.
5--
25.3
514
7.08
E-03
5.54
E-04
-5.2
7E-0
3-3
.49E
-03
33.7
00.
0019
-0.0
5122
.990
1.00
1.01
70.
110.
039
0.91
8.4
--31
.015
7.23
E-03
6.39
E-04
-2.4
9E-0
3-3
.43E
-03
Hai
rline
33.2
20.
0020
-0.0
5022
.899
1.00
1.02
40.
100.
034
0.89
8.3
--35
.816
9.87
E-03
8.31
E-04
-3.3
0E-0
3-1
.03E
-02
42.7
00.
0048
-0.0
7525
.076
1.50
1.54
10.
200.
066
0.77
10.6
--54
.16
171.
14E-
022.
88E-
03-3
.17E
-03
-9.9
3E-0
340
.06
0.00
54-0
.067
24.5
921.
501.
540
0.16
0.05
20.
7310
.0--
67.3
181.
47E-
023.
00E-
03-2
.11E
-03
-8.7
7E-0
30.
0138
.82
0.00
57-0
.064
24.4
261.
501.
540
0.15
0.04
30.
709.
7--
78.0
191.
15E-
025.
44E-
03-1
.01E
-03
-4.5
3E-0
341
.19
0.01
02-0
.069
25.1
972.
001.
700
0.36
0.08
40.
5610
.3--
107.
67
201.
07E-
025.
91E-
03-9
.01E
-04
-2.6
8E-0
335
.14
0.01
16-0
.053
23.9
882.
00--
0.45
0.07
50.
488.
7--
130.
321
1.04
E-02
9.22
E-03
-1.1
3E-0
3-1
.64E
-03
0.20
32.0
90.
0124
-0.0
4523
.428
2.00
--0.
480.
070
0.43
8.0
--14
9.7
221.
54E-
029.
10E-
03-1
.84E
-04
-9.3
0E-0
332
.14
0.02
23-0
.045
23.5
343.
00--
1.35
0.13
00.
308.
0--
202.
28
231.
35E-
021.
31E-
024.
08E-
04-8
.75E
-04
24.7
90.
0242
-0.0
2822
.174
3.00
----
0.09
40.
226.
1--
232.
124
1.25
E-02
1.06
E-02
5.94
E-04
-1.0
2E-0
30.
1021
.75
0.02
50-0
.024
20.6
933.
00--
--0.
078
0.20
5.4
--25
4.0
251.
33E-
021.
58E-
02-2
.95E
-03
-4.9
2E-0
422
.34
0.04
49-0
.024
20.7
835.
00--
--0.
150
0.12
5.5
--32
4.3
926
1.08
E-02
1.50
E-02
-1.1
6E-0
3-6
.73E
-03
15.5
40.
0463
-0.0
1220
.043
5.00
----
0.10
00.
083.
9--
357.
327
6.85
E-03
1.13
E-02
-1.1
6E-0
3-7
.51E
-04
> 0.
1012
.71
0.04
78-0
.008
19.7
865.
00--
--0.
091
0.07
3.1
--38
2.3
285.
13E-
031.
22E-
02-1
.48E
-03
-2.8
4E-0
414
.37
0.06
70-0
.011
19.7
717.
00--
--0.
116
0.06
3.6
--43
2.3
1029
4.59
E-03
1.12
E-02
-1.1
4E-0
3-1
.03E
-03
9.84
0.06
80-0
.005
19.4
087.
00--
--0.
093
0.04
2.4
--46
0.2
304.
31E-
031.
07E-
02-9
.77E
-04
-1.4
8E-0
3>
0.10
7.69
0.06
85-0
.003
19.2
577.
00--
--0.
096
0.03
1.9
--48
2.3
314.
22E-
031.
32E-
02-1
.36E
-03
-1.4
3E-0
28.
280.
0864
-0.0
0418
.894
8.82
----
0.12
20.
032.
0--
519.
711
323.
66E-
031.
24E-
02-1
.11E
-03
-1.0
4E-0
24.
980.
0875
-0.0
0118
.622
8.82
----
0.11
30.
021.
2--
541.
533
3.28
E-03
1.23
E-02
-9.3
5E-0
4-8
.25E
-03
> 0.
103.
790.
0878
-0.0
0118
.425
8.82
----
0.15
40.
010.
9--
562.
5
Tab
le 5
.4 T
est #
2: P
erfo
rman
ce p
aram
eter
s (0.
25f' c
Ag)
dow
n di
rect
ion
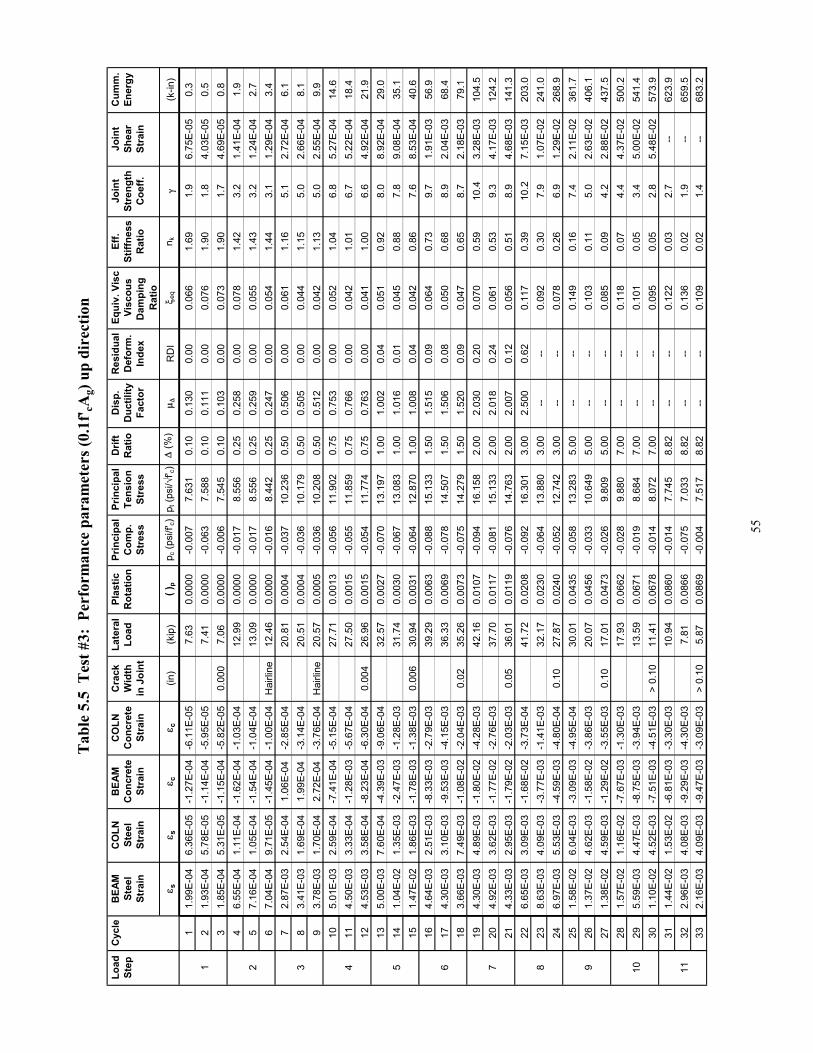
55
Load
Cyc
leB
EAM
CO
LNB
EAM
CO
LNC
rack
Late
ral
Plas
ticPr
inci
pal
Prin
cipa
lD
rift
Dis
p.R
esid
ual
Equi
v. V
isc
Eff.
Join
tJo
int
Cum
m.
Step
Stee
lSt
eel
Con
cret
eC
oncr
ete
Wid
thLo
adR
otat
ion
Com
p.Te
nsio
nR
atio
Duc
tility
Def
orm
.Vi
scou
sSt
iffne
ssSt
reng
thSh
ear
Ener
gySt
rain
Stra
inSt
rain
Stra
inin
Joi
ntSt
ress
Stre
ssFa
ctor
Inde
xD
ampi
ng
Rat
ioC
oeff.
Stra
inR
atio
ε sε s
ε cε c
(in)
(kip
)( )
pp c
(psi
/f'c)
p t (p
si/√
f' c)
∆ (%
)µ ∆
RD
Iξ e
qn k
γ(k
-in)
11.
99E-
046.
36E-
05-1
.27E
-04
-6.1
1E-0
57.
630.
0000
-0.0
077.
631
0.10
0.13
00.
000.
066
1.69
1.9
6.75
E-05
0.3
12
1.93
E-04
5.78
E-05
-1.1
4E-0
4-5
.95E
-05
7.41
0.00
00-0
.063
7.58
80.
100.
111
0.00
0.07
61.
901.
84.
03E-
050.
53
1.85
E-04
5.31
E-05
-1.1
5E-0
4-5
.82E
-05
0.00
07.
060.
0000
-0.0
067.
545
0.10
0.10
30.
000.
073
1.90
1.7
4.69
E-05
0.8
46.
55E-
041.
11E-
04-1
.62E
-04
-1.0
3E-0
412
.99
0.00
00-0
.017
8.55
60.
250.
258
0.00
0.07
81.
423.
21.
41E-
041.
92
57.
16E-
041.
05E-
04-1
.54E
-04
-1.0
4E-0
413
.09
0.00
00-0
.017
8.55
60.
250.
259
0.00
0.05
51.
433.
21.
24E-
042.
76
7.04
E-04
9.71
E-05
-1.4
5E-0
4-1
.00E
-04
Hai
rline
12.4
60.
0000
-0.0
168.
442
0.25
0.24
70.
000.
054
1.44
3.1
1.29
E-04
3.4
72.
87E-
032.
54E-
041.
06E-
04-2
.85E
-04
20.8
10.
0004
-0.0
3710
.236
0.50
0.50
60.
000.
061
1.16
5.1
2.72
E-04
6.1
38
3.41
E-03
1.69
E-04
1.99
E-04
-3.1
4E-0
420
.51
0.00
04-0
.036
10.1
790.
500.
505
0.00
0.04
41.
155.
02.
66E-
048.
19
3.78
E-03
1.70
E-04
2.72
E-04
-3.7
6E-0
4H
airli
ne20
.57
0.00
05-0
.036
10.2
080.
500.
512
0.00
0.04
21.
135.
02.
55E-
049.
910
5.01
E-03
2.59
E-04
-7.4
1E-0
4-5
.15E
-04
27.7
10.
0013
-0.0
5611
.902
0.75
0.75
30.
000.
052
1.04
6.8
5.27
E-04
14.6
411
4.50
E-03
3.33
E-04
-1.2
8E-0
3-5
.67E
-04
27.5
00.
0015
-0.0
5511
.859
0.75
0.76
60.
000.
042
1.01
6.7
5.22
E-04
18.4
124.
53E-
033.
58E-
04-8
.23E
-04
-6.3
0E-0
40.
004
26.9
60.
0015
-0.0
5411
.774
0.75
0.76
30.
000.
041
1.00
6.6
4.92
E-04
21.9
135.
00E-
037.
60E-
04-4
.39E
-03
-9.0
6E-0
432
.57
0.00
27-0
.070
13.1
971.
001.
002
0.04
0.05
10.
928.
08.
92E-
0429
.05
141.
04E-
021.
35E-
03-2
.47E
-03
-1.2
8E-0
331
.74
0.00
30-0
.067
13.0
831.
001.
016
0.01
0.04
50.
887.
89.
08E-
0435
.115
1.47
E-02
1.86
E-03
-1.7
8E-0
3-1
.38E
-03
0.00
630
.94
0.00
31-0
.064
12.8
701.
001.
008
0.04
0.04
20.
867.
68.
53E-
0440
.616
4.64
E-03
2.51
E-03
-8.3
3E-0
3-2
.79E
-03
39.2
90.
0063
-0.0
8815
.133
1.50
1.51
50.
090.
064
0.73
9.7
1.91
E-03
56.9
617
4.30
E-03
3.10
E-03
-9.5
3E-0
3-4
.15E
-03
36.3
30.
0069
-0.0
7814
.507
1.50
1.50
60.
080.
050
0.68
8.9
2.04
E-03
68.4
183.
66E-
037.
49E-
03-1
.08E
-02
-2.0
4E-0
30.
0235
.26
0.00
73-0
.075
14.2
791.
501.
520
0.09
0.04
70.
658.
72.
18E-
0379
.119
4.30
E-03
4.89
E-03
-1.8
0E-0
2-4
.28E
-03
42.1
60.
0107
-0.0
9416
.158
2.00
2.03
00.
200.
070
0.59
10.4
3.28
E-03
104.
57
204.
92E-
033.
62E-
03-1
.77E
-02
-2.7
6E-0
337
.70
0.01
17-0
.081
15.1
332.
002.
018
0.24
0.06
10.
539.
34.
17E-
0312
4.2
214.
33E-
032.
95E-
03-1
.79E
-02
-2.0
3E-0
30.
0536
.01
0.01
19-0
.076
14.7
632.
002.
007
0.12
0.05
60.
518.
94.
68E-
0314
1.3
226.
65E-
033.
09E-
03-1
.68E
-02
-3.7
3E-0
441
.72
0.02
08-0
.092
16.3
013.
002.
500
0.62
0.11
70.
3910
.27.
15E-
0320
3.0
823
8.63
E-03
4.09
E-03
-3.7
7E-0
3-1
.41E
-03
32.1
70.
0230
-0.0
6413
.880
3.00
----
0.09
20.
307.
91.
07E-
0224
1.0
246.
97E-
035.
53E-
03-4
.59E
-03
-4.8
0E-0
40.
1027
.87
0.02
40-0
.052
12.7
423.
00--
--0.
078
0.26
6.9
1.29
E-02
268.
925
1.58
E-02
6.04
E-03
-3.0
9E-0
3-4
.95E
-04
30.0
10.
0435
-0.0
5813
.283
5.00
----
0.14
90.
167.
42.
11E-
0236
1.7
926
1.37
E-02
4.62
E-03
-1.5
8E-0
2-3
.86E
-03
20.0
70.
0456
-0.0
3310
.649
5.00
----
0.10
30.
115.
02.
63E-
0240
6.1
271.
38E-
024.
59E-
03-1
.29E
-02
-3.5
5E-0
30.
1017
.01
0.04
73-0
.026
9.80
95.
00--
--0.
085
0.09
4.2
2.88
E-02
437.
528
1.57
E-02
1.16
E-02
-7.6
7E-0
3-1
.30E
-03
17.9
30.
0662
-0.0
289.
880
7.00
----
0.11
80.
074.
44.
37E-
0250
0.2
1029
5.59
E-03
4.47
E-03
-8.7
5E-0
3-3
.94E
-03
13.5
90.
0671
-0.0
198.
684
7.00
----
0.10
10.
053.
45.
00E-
0254
1.4
301.
10E-
024.
52E-
03-7
.51E
-03
-4.5
1E-0
3>
0.10
11.4
10.
0678
-0.0
148.
072
7.00
----
0.09
50.
052.
85.
48E-
0257
3.9
311.
44E-
021.
53E-
02-6
.81E
-03
-3.3
0E-0
310
.94
0.08
60-0
.014
7.74
58.
82--
--0.
122
0.03
2.7
--62
3.9
1132
2.96
E-03
4.08
E-03
-9.2
9E-0
3-4
.30E
-03
7.81
0.08
66-0
.075
7.03
38.
82--
--0.
136
0.02
1.9
--65
9.5
332.
16E-
034.
09E-
03-9
.47E
-03
-3.0
9E-0
3>
0.10
5.87
0.08
69-0
.004
7.51
78.
82--
--0.
109
0.02
1.4
--68
3.2
Tab
le 5
.5 T
est #
3: P
erfo
rman
ce p
aram
eter
s (0.
1f' cA
g) u
p di
rect
ion

56
Load
Cycl
eBE
AMCO
LNBE
AMCO
LNCr
ack
Late
ral
Plas
ticPr
inci
pal
Prin
cipa
lDr
iftDi
sp.
Resi
dual
Equi
v. V
isc
Eff.
Join
tJo
int
Cum
m.
Step
Stee
lSt
eel
Conc
rete
Conc
rete
Wid
thLo
adRo
tatio
nCo
mp.
Tens
ion
Ratio
Duct
ility
Defo
rm.
Visc
ous
Stiff
ness
Stre
ngth
Shea
rEn
ergy
Stra
inSt
rain
Stra
inSt
rain
in J
oint
Stre
ssSt
ress
Fact
orIn
dex
Dam
ping
Ra
tioCo
eff.
Stra
inRa
tioε s
ε sε c
ε c(in
)(k
ip)
( ) p
p c (p
si/f' c
)p t
(psi/√f
' c)∆
(%)
µ ∆RD
Iξ e
qn k
γ(k
-in)
11.
56E-
045.
39E-
05-1
.48E
-04
-4.5
8E-0
55.
680.
0000
-0.0
047.
147
0.10
0.09
80.
030.
107
1.68
1.4
1.23
E-04
0.3
12
1.58
E-04
5.20
E-05
-1.4
5E-0
4-4
.42E
-05
5.45
0.00
00-0
.004
7.13
20.
100.
098
0.03
0.10
71.
601.
31.
27E-
040.
53
1.60
E-04
5.06
E-05
-1.4
4E-0
4-4
.54E
-05
0.00
05.
420.
0000
-0.0
037.
118
0.10
0.09
80.
030.
091
1.57
1.3
1.26
E-04
0.8
44.
42E-
041.
08E-
04-1
.92E
-04
-8.5
8E-0
510
.70
0.00
00-0
.013
7.61
60.
250.
233
0.06
0.09
61.
352.
62.
39E-
041.
92
54.
93E-
041.
05E-
04-1
.81E
-04
-8.7
1E-0
510
.41
0.00
00-0
.012
7.57
40.
250.
233
0.06
0.07
01.
302.
52.
40E-
042.
76
4.70
E-04
1.05
E-04
-1.8
9E-0
4-8
.43E
-05
Hairl
ine
10.2
40.
0000
-0.0
127.
560
0.25
0.23
40.
050.
063
1.26
2.5
2.41
E-04
3.4
71.
29E-
036.
33E-
04-3
.36E
-04
-5.8
1E-0
519
.03
0.00
02-0
.035
8.94
00.
500.
464
0.08
0.06
71.
184.
64.
86E-
046.
13
81.
49E-
036.
05E-
04-2
.60E
-04
-1.1
5E-0
418
.32
0.00
02-0
.033
8.81
20.
500.
462
0.09
0.04
91.
144.
55.
09E-
048.
19
1.22
E-03
6.03
E-04
-3.3
1E-0
4-1
.01E
-04
Hairl
ine
18.1
20.
0004
-0.0
328.
798
0.50
0.46
40.
070.
048
1.13
4.4
5.13
E-04
9.9
103.
15E-
032.
22E-
03-6
.87E
-04
-2.0
0E-0
525
.59
0.00
09-0
.055
10.2
930.
750.
695
0.12
0.05
61.
066.
39.
48E-
0414
.64
113.
22E-
032.
48E-
03-8
.09E
-04
-8.7
6E-0
624
.68
0.00
11-0
.052
10.1
080.
750.
691
0.11
0.04
81.
036.
19.
86E-
0418
.412
2.66
E-03
2.67
E-03
-7.1
4E-0
4-1
.19E
-04
0.00
424
.32
0.00
11-0
.051
10.0
790.
750.
691
0.11
0.04
51.
026.
01.
03E-
0321
.913
1.51
E-02
5.78
E-03
-1.0
5E-0
5-2
.77E
-04
30.7
40.
0020
-0.0
7111
.517
1.00
0.91
70.
160.
054
0.96
7.6
1.62
E-03
29.0
514
1.48
E-02
6.52
E-03
-1.0
2E-0
4-2
.36E
-04
30.0
60.
0023
-0.0
6811
.403
1.00
0.92
50.
160.
048
0.93
7.4
1.74
E-03
35.1
152.
12E-
036.
81E-
03-2
.36E
-03
-7.6
1E-0
40.
006
29.2
00.
0024
-0.0
6511
.233
1.00
0.92
00.
170.
044
0.92
7.2
1.79
E-03
40.6
163.
43E-
031.
56E-
02-6
.43E
-03
-6.8
2E-0
439
.12
0.00
48-0
.096
13.6
671.
501.
376
0.20
0.06
50.
829.
63.
00E-
0356
.96
176.
67E-
031.
60E-
02-7
.61E
-03
-7.9
7E-0
537
.92
0.00
52-0
.092
13.4
961.
501.
382
0.17
0.04
70.
799.
33.
07E-
0368
.418
3.15
E-03
1.40
E-02
-5.5
0E-0
3-8
.55E
-04
0.02
36.4
20.
0055
-0.0
8613
.211
1.50
1.37
70.
160.
046
0.76
8.9
3.11
E-03
79.1
193.
17E-
031.
16E-
02-1
.33E
-02
-3.1
1E-0
341
.40
0.00
92-0
.101
14.6
072.
001.
832
0.30
0.07
20.
6610
.24.
29E-
0310
4.5
720
3.38
E-03
5.35
E-03
-1.4
8E-0
2-2
.36E
-03
38.3
30.
0100
-0.0
9113
.937
2.00
1.83
00.
190.
060
0.60
9.4
4.27
E-03
124.
221
3.82
E-03
4.76
E-03
-1.3
3E-0
2-1
.67E
-03
0.05
36.0
80.
0106
-0.0
8413
.468
2.00
1.83
20.
340.
055
0.57
8.8
4.26
E-03
141.
322
7.50
E-03
4.97
E-03
-1.7
1E-0
2-5
.51E
-04
36.4
20.
0207
-0.0
8613
.695
3.00
1.90
00.
920.
136
0.37
9.1
8.08
E-03
203.
08
231.
06E-
021.
09E-
02-1
.09E
-02
-5.9
4E-0
428
.77
0.02
28-0
.060
11.7
743.
00--
--0.
104
0.30
7.1
7.77
E-03
241.
024
1.62
E-02
5.85
E-03
-6.1
7E-0
3-3
.14E
-04
0.10
24.4
80.
0238
-0.0
4810
.791
3.00
----
0.08
80.
266.
07.
09E-
0326
8.9
251.
56E-
029.
72E-
03-1
.54E
-02
-4.7
5E-0
423
.12
0.04
41-0
.045
10.2
645.
00--
--0.
191
0.14
5.7
1.56
E-02
361.
79
268.
99E-
031.
27E-
02-1
.67E
-02
-5.8
4E-0
415
.40
0.04
61-0
.025
8.47
15.
00--
--0.
134
0.10
3.8
1.37
E-02
406.
127
1.24
E-02
9.00
E-03
-1.1
7E-0
2-4
.02E
-04
0.10
12.4
20.
0472
-0.0
177.
844
5.00
----
0.11
80.
083.
11.
41E-
0243
7.5
287.
78E-
036.
05E-
03-9
.34E
-03
-1.3
9E-0
313
.05
0.06
67-0
.020
7.56
07.
00--
--0.
162
0.06
3.2
1.37
E-02
500.
210
297.
04E-
035.
23E-
03-8
.59E
-03
-1.7
6E-0
38.
790.
0678
-0.0
106.
663
7.00
----
0.15
90.
042.
2--
541.
430
9.14
E-03
7.04
E-03
-7.9
7E-0
3-9
.21E
-04
> 0.
106.
490.
0684
-0.0
066.
250
7.00
----
0.16
30.
031.
7--
573.
931
1.07
E-02
1.09
E-02
-7.8
1E-0
3-3
.93E
-03
6.59
0.08
67-0
.007
5.58
18.
82--
--0.
207
0.02
1.6
--62
3.9
1132
1.35
E-02
8.53
E-03
-6.9
4E-0
3-4
.31E
-03
3.62
0.08
75-0
.002
4.69
88.
82--
--0.
281
0.01
0.9
--65
9.5
337.
94E-
035.
21E-
03-8
.25E
-03
-7.2
0E-0
3>
0.10
1.25
0.08
810.
000
4.78
38.
82--
--0.
605
0.00
0.3
--68
3.2
Tabl
e 5.6
Tes
t #3:
Per
form
ance
par
amet
ers (
0.1f
' cAg)
dow
n di
rect
ion
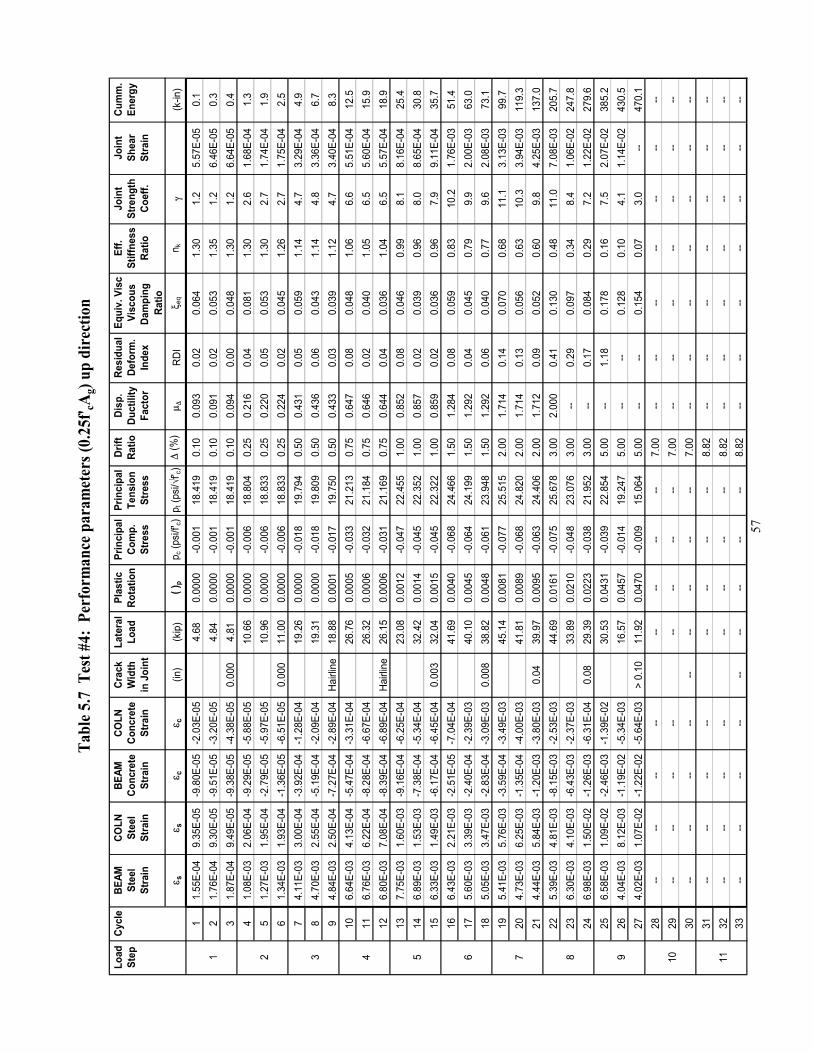
57
Load
Cycl
eBE
AMCO
LNBE
AMCO
LNCr
ack
Late
ral
Plas
ticPr
inci
pal
Prin
cipa
lDr
iftDi
sp.
Resi
dual
Equi
v. V
isc
Eff.
Join
tJo
int
Cum
m.
Step
Stee
lSt
eel
Conc
rete
Conc
rete
Wid
thLo
adRo
tatio
nCo
mp.
Tens
ion
Ratio
Duct
ility
Defo
rm.
Visc
ous
Stiff
ness
Stre
ngth
Shea
rEn
ergy
Stra
inSt
rain
Stra
inSt
rain
in J
oint
Stre
ssSt
ress
Fact
orIn
dex
Dam
ping
Ra
tioCo
eff.
Stra
inRa
tioε s
ε sε c
ε c(in
)(k
ip)
( )p
p c (p
si/f' c
)p t
(psi/√f
' c)∆
(%)
µ ∆RD
Iξ e
qn k
γ(k
-in)
11.
55E-
049.
35E-
05-9
.80E
-05
-2.0
3E-0
54.
680.
0000
-0.0
0118
.419
0.10
0.09
30.
020.
064
1.30
1.2
5.57
E-05
0.1
12
1.76
E-04
9.30
E-05
-9.5
1E-0
5-3
.20E
-05
4.84
0.00
00-0
.001
18.4
190.
100.
091
0.02
0.05
31.
351.
26.
46E-
050.
33
1.87
E-04
9.49
E-05
-9.3
8E-0
5-4
.38E
-05
0.00
04.
810.
0000
-0.0
0118
.419
0.10
0.09
40.
000.
048
1.30
1.2
6.64
E-05
0.4
41.
08E-
032.
06E-
04-9
.29E
-05
-5.8
8E-0
510
.66
0.00
00-0
.006
18.8
040.
250.
216
0.04
0.08
11.
302.
61.
68E-
041.
32
51.
27E-
031.
95E-
04-2
.79E
-05
-5.9
7E-0
510
.96
0.00
00-0
.006
18.8
330.
250.
220
0.05
0.05
31.
302.
71.
74E-
041.
96
1.34
E-03
1.93
E-04
-1.3
6E-0
5-6
.51E
-05
0.00
011
.00
0.00
00-0
.006
18.8
330.
250.
224
0.02
0.04
51.
262.
71.
75E-
042.
57
4.11
E-03
3.00
E-04
-3.9
2E-0
4-1
.28E
-04
19.2
60.
0000
-0.0
1819
.794
0.50
0.43
10.
050.
059
1.14
4.7
3.29
E-04
4.9
38
4.70
E-03
2.55
E-04
-5.1
9E-0
4-2
.09E
-04
19.3
10.
0000
-0.0
1819
.809
0.50
0.43
60.
060.
043
1.14
4.8
3.36
E-04
6.7
94.
84E-
032.
50E-
04-7
.27E
-04
-2.8
9E-0
4Ha
irlin
e18
.88
0.00
01-0
.017
19.7
500.
500.
433
0.03
0.03
91.
124.
73.
40E-
048.
310
6.64
E-03
4.13
E-04
-5.4
7E-0
4-3
.31E
-04
26.7
60.
0005
-0.0
3321
.213
0.75
0.64
70.
080.
048
1.06
6.6
5.51
E-04
12.5
411
6.76
E-03
6.22
E-04
-8.2
8E-0
4-6
.67E
-04
26.3
20.
0006
-0.0
3221
.184
0.75
0.64
60.
020.
040
1.05
6.5
5.60
E-04
15.9
126.
80E-
037.
08E-
04-8
.39E
-04
-6.8
9E-0
4Ha
irlin
e26
.15
0.00
06-0
.031
21.1
690.
750.
644
0.04
0.03
61.
046.
55.
57E-
0418
.913
7.75
E-03
1.60
E-03
-9.1
6E-0
4-6
.25E
-04
23.0
80.
0012
-0.0
4722
.455
1.00
0.85
20.
080.
046
0.99
8.1
8.16
E-04
25.4
514
6.89
E-03
1.53
E-03
-7.3
8E-0
4-5
.34E
-04
32.4
20.
0014
-0.0
4522
.352
1.00
0.85
70.
020.
039
0.96
8.0
8.65
E-04
30.8
156.
33E-
031.
49E-
03-6
.17E
-04
-6.4
5E-0
40.
003
32.0
40.
0015
-0.0
4522
.322
1.00
0.85
90.
020.
036
0.96
7.9
9.11
E-04
35.7
166.
43E-
032.
21E-
03-2
.51E
-05
-7.0
4E-0
441
.69
0.00
40-0
.068
24.4
661.
501.
284
0.08
0.05
90.
8310
.21.
76E-
0351
.46
175.
60E-
033.
39E-
03-2
.40E
-04
-2.3
9E-0
340
.10
0.00
45-0
.064
24.1
991.
501.
292
0.04
0.04
50.
799.
92.
00E-
0363
.018
5.05
E-03
3.47
E-03
-2.8
3E-0
4-3
.09E
-03
0.00
838
.82
0.00
48-0
.061
23.9
481.
501.
292
0.06
0.04
00.
779.
62.
08E-
0373
.119
5.41
E-03
5.76
E-03
-3.5
9E-0
4-3
.49E
-03
45.1
40.
0081
-0.0
7725
.515
2.00
1.71
40.
140.
070
0.68
11.1
3.13
E-03
99.7
720
4.73
E-03
6.25
E-03
-1.3
5E-0
4-4
.00E
-03
41.8
10.
0089
-0.0
6824
.820
2.00
1.71
40.
130.
056
0.63
10.3
3.94
E-03
119.
321
4.44
E-03
5.84
E-03
-1.2
0E-0
3-3
.80E
-03
0.04
39.9
70.
0095
-0.0
6324
.406
2.00
1.71
20.
090.
052
0.60
9.8
4.25
E-03
137.
022
5.39
E-03
4.81
E-03
-8.1
5E-0
3-2
.53E
-03
44.6
90.
0161
-0.0
7525
.678
3.00
2.00
00.
410.
130
0.48
11.0
7.08
E-03
205.
78
236.
30E-
034.
10E-
03-6
.43E
-03
-2.3
7E-0
333
.89
0.02
10-0
.048
23.0
763.
00--
0.29
0.09
70.
348.
41.
06E-
0224
7.8
246.
98E-
031.
50E-
02-1
.26E
-03
-6.3
1E-0
40.
0829
.39
0.02
23-0
.038
21.9
523.
00--
0.17
0.08
40.
297.
21.
22E-
0227
9.6
256.
58E-
031.
09E-
02-2
.46E
-03
-1.3
9E-0
230
.53
0.04
31-0
.039
22.8
545.
00--
1.18
0.17
80.
167.
52.
07E-
0238
5.2
926
4.04
E-03
8.12
E-03
-1.1
9E-0
2-5
.34E
-03
16.5
70.
0457
-0.0
1419
.247
5.00
----
0.12
80.
104.
11.
14E-
0243
0.5
274.
02E-
031.
07E-
02-1
.22E
-02
-5.6
4E-0
3>
0.10
11.9
20.
0470
-0.0
0915
.064
5.00
----
0.15
40.
073.
0--
470.
128
----
----
----
----
7.00
----
----
----
--10
29--
----
----
----
--7.
00--
----
----
----
30--
----
----
----
----
7.00
----
----
----
--31
----
----
----
----
8.82
----
----
----
--11
32--
----
----
----
--8.
82--
----
----
----
33--
----
----
----
----
8.82
----
----
----
--
Tabl
e 5.7
Tes
t #4:
Per
form
ance
par
amet
ers (
0.25
f' cA
g) up
dir
ectio
n
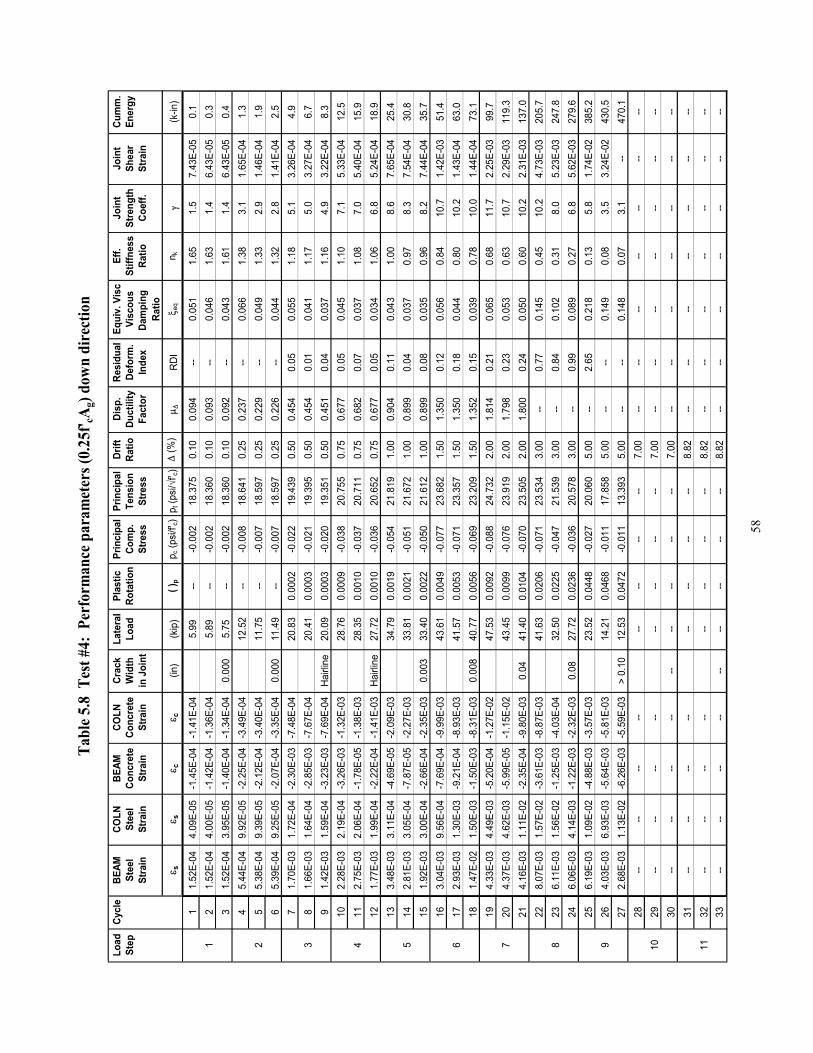
58
Load
Cycl
eBE
AMCO
LNBE
AMCO
LNCr
ack
Late
ral
Plas
ticPr
inci
pal
Prin
cipa
lDr
iftDi
sp.
Resi
dual
Equi
v. V
isc
Eff.
Join
tJo
int
Cum
m.
Step
Stee
lSt
eel
Conc
rete
Conc
rete
Wid
thLo
adRo
tatio
nCo
mp.
Tens
ion
Ratio
Duct
ility
Defo
rm.
Visc
ous
Stiff
ness
Stre
ngth
Shea
rEn
ergy
Stra
inSt
rain
Stra
inSt
rain
in J
oint
Stre
ssSt
ress
Fact
orIn
dex
Dam
ping
Ra
tioCo
eff.
Stra
inRa
tioε s
ε sε c
ε c(in
)(k
ip)
( )p
p c (p
si/f' c
)p t
(psi/√f
' c)∆
(%)
µ ∆RD
Iξ e
qn k
γ(k
-in)
11.
52E-
044.
09E-
05-1
.45E
-04
-1.4
1E-0
45.
99--
-0.0
0218
.375
0.10
0.09
4--
0.05
11.
651.
57.
43E-
050.
11
21.
52E-
044.
00E-
05-1
.42E
-04
-1.3
6E-0
45.
89--
-0.0
0218
.360
0.10
0.09
3--
0.04
61.
631.
46.
43E-
050.
33
1.52
E-04
3.95
E-05
-1.4
0E-0
4-1
.34E
-04
0.00
05.
75--
-0.0
0218
.360
0.10
0.09
2--
0.04
31.
611.
46.
43E-
050.
44
5.44
E-04
9.92
E-05
-2.2
5E-0
4-3
.49E
-04
12.5
2--
-0.0
0818
.641
0.25
0.23
7--
0.06
61.
383.
11.
65E-
041.
32
55.
38E-
049.
39E-
05-2
.12E
-04
-3.4
0E-0
411
.75
---0
.007
18.5
970.
250.
229
--0.
049
1.33
2.9
1.46
E-04
1.9
65.
39E-
049.
25E-
05-2
.07E
-04
-3.3
5E-0
40.
000
11.4
9--
-0.0
0718
.597
0.25
0.22
6--
0.04
41.
322.
81.
41E-
042.
57
1.70
E-03
1.72
E-04
-2.3
0E-0
3-7
.48E
-04
20.8
30.
0002
-0.0
2219
.439
0.50
0.45
40.
050.
055
1.18
5.1
3.26
E-04
4.9
38
1.66
E-03
1.64
E-04
-2.8
5E-0
3-7
.67E
-04
20.4
10.
0003
-0.0
2119
.395
0.50
0.45
40.
010.
041
1.17
5.0
3.27
E-04
6.7
91.
42E-
031.
59E-
04-3
.23E
-03
-7.6
9E-0
4Ha
irlin
e20
.09
0.00
03-0
.020
19.3
510.
500.
451
0.04
0.03
71.
164.
93.
22E-
048.
310
2.28
E-03
2.19
E-04
-3.2
6E-0
3-1
.32E
-03
28.7
60.
0009
-0.0
3820
.755
0.75
0.67
70.
050.
045
1.10
7.1
5.33
E-04
12.5
411
2.75
E-03
2.06
E-04
-1.7
8E-0
5-1
.38E
-03
28.3
50.
0010
-0.0
3720
.711
0.75
0.68
20.
070.
037
1.08
7.0
5.40
E-04
15.9
121.
77E-
031.
99E-
04-2
.22E
-04
-1.4
1E-0
3Ha
irlin
e27
.72
0.00
10-0
.036
20.6
520.
750.
677
0.05
0.03
41.
066.
85.
24E-
0418
.913
3.48
E-03
3.11
E-04
-4.6
9E-0
5-2
.09E
-03
34.7
90.
0019
-0.0
5421
.819
1.00
0.90
40.
110.
043
1.00
8.6
7.65
E-04
25.4
514
2.81
E-03
3.05
E-04
-7.8
7E-0
5-2
.27E
-03
33.8
10.
0021
-0.0
5121
.672
1.00
0.89
90.
040.
037
0.97
8.3
7.54
E-04
30.8
151.
92E-
033.
00E-
04-2
.66E
-04
-2.3
5E-0
30.
003
33.4
00.
0022
-0.0
5021
.612
1.00
0.89
90.
080.
035
0.96
8.2
7.44
E-04
35.7
163.
04E-
039.
56E-
04-7
.69E
-04
-9.9
9E-0
343
.61
0.00
49-0
.077
23.6
821.
501.
350
0.12
0.05
60.
8410
.71.
42E-
0351
.46
172.
93E-
031.
30E-
03-9
.21E
-04
-8.9
3E-0
341
.57
0.00
53-0
.071
23.3
571.
501.
350
0.18
0.04
40.
8010
.21.
43E-
0463
.018
1.47
E-02
1.50
E-03
-1.5
0E-0
3-8
.31E
-03
0.00
840
.77
0.00
56-0
.069
23.2
091.
501.
352
0.15
0.03
90.
7810
.01.
44E-
0473
.119
4.33
E-03
4.49
E-03
-5.2
0E-0
4-1
.27E
-02
47.5
30.
0092
-0.0
8824
.732
2.00
1.81
40.
210.
065
0.68
11.7
2.25
E-03
99.7
720
4.37
E-03
4.62
E-03
-5.9
9E-0
5-1
.15E
-02
43.4
50.
0099
-0.0
7623
.919
2.00
1.79
80.
230.
053
0.63
10.7
2.29
E-03
119.
321
4.16
E-03
1.11
E-02
-2.3
5E-0
4-9
.80E
-03
0.04
41.4
00.
0104
-0.0
7023
.505
2.00
1.80
00.
240.
050
0.60
10.2
2.31
E-03
137.
022
8.07
E-03
1.57
E-02
-3.6
1E-0
3-8
.87E
-03
41.6
30.
0206
-0.0
7123
.534
3.00
--0.
770.
145
0.45
10.2
4.73
E-03
205.
78
236.
11E-
031.
56E-
02-1
.25E
-03
-4.0
3E-0
432
.50
0.02
25-0
.047
21.5
393.
00--
0.84
0.10
20.
318.
05.
23E-
0324
7.8
246.
06E-
034.
14E-
03-1
.22E
-03
-2.3
2E-0
30.
0827
.72
0.02
36-0
.036
20.5
783.
00--
0.99
0.08
90.
276.
85.
62E-
0327
9.6
256.
19E-
031.
09E-
02-4
.88E
-03
-3.5
7E-0
323
.52
0.04
48-0
.027
20.0
605.
00--
2.65
0.21
80.
135.
81.
74E-
0238
5.2
926
4.03
E-03
6.93
E-03
-5.6
4E-0
3-5
.81E
-03
14.2
10.
0468
-0.0
1117
.858
5.00
----
0.14
90.
083.
53.
24E-
0243
0.5
272.
68E-
031.
13E-
02-6
.26E
-03
-5.5
9E-0
3>
0.10
12.5
30.
0472
-0.0
1113
.393
5.00
----
0.14
80.
073.
1--
470.
128
----
----
----
----
7.00
----
----
----
--10
29--
----
----
----
--7.
00--
----
----
----
30--
----
----
----
----
7.00
----
----
----
--31
----
----
----
----
8.82
----
----
----
--11
32--
----
----
----
--8.
82--
----
----
----
33--
----
----
----
----
8.82
----
----
----
--
Tabl
e 5.8
Tes
t #4:
Per
form
ance
par
amet
ers (
0.25
f' cA
g) do
wn
dire
ctio
n
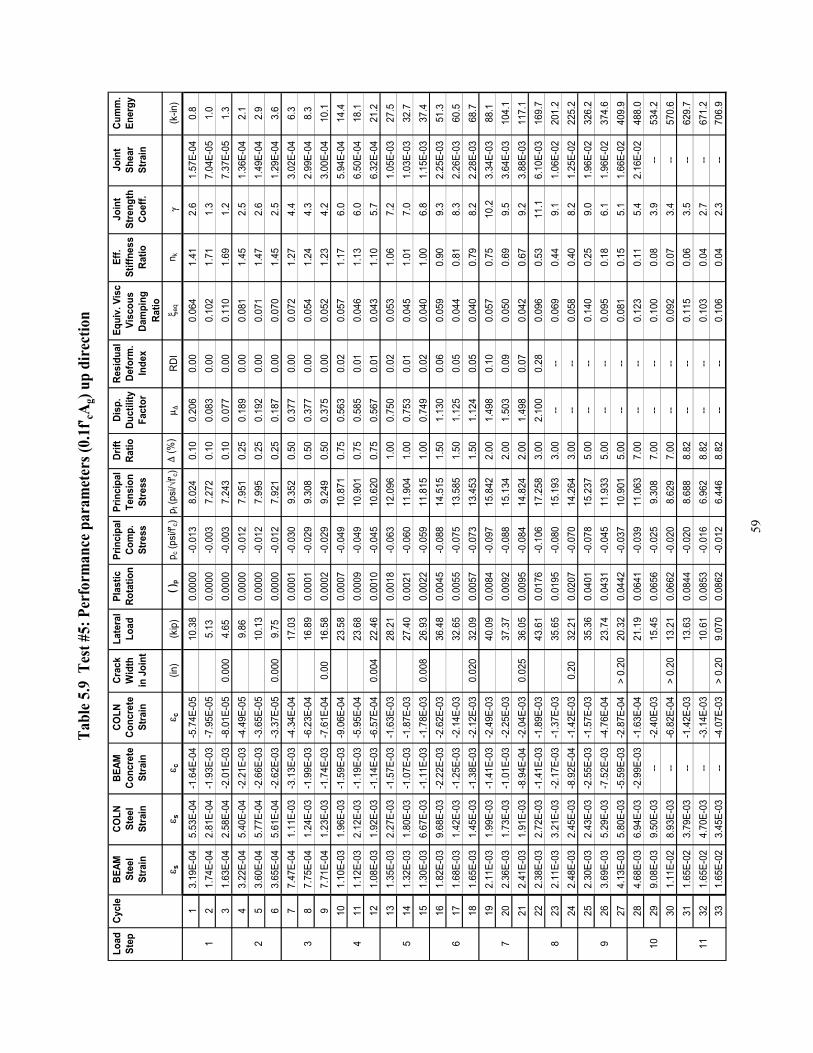
59
Load
Cycl
eBE
AMCO
LNBE
AMCO
LNCr
ack
Late
ral
Plas
ticPr
inci
pal
Prin
cipa
lDr
iftDi
sp.
Resi
dual
Equi
v. V
isc
Eff.
Join
tJo
int
Cum
m.
Step
Stee
lSt
eel
Conc
rete
Conc
rete
Wid
thLo
adRo
tatio
nCo
mp.
Tens
ion
Ratio
Duct
ility
Defo
rm.
Visc
ous
Stiff
ness
Stre
ngth
Shea
rEn
ergy
Stra
inSt
rain
Stra
inSt
rain
in J
oint
Stre
ssSt
ress
Fact
orIn
dex
Dam
ping
Ra
tioCo
eff.
Stra
inRa
tioε s
ε sε c
ε c(in
)(k
ip)
( )p
p c (p
si/f' c
)p t
(psi/√f
' c)∆
(%)
µ ∆RD
Iξ e
qn k
γ(k
-in)
13.
19E-
045.
53E-
04-1
.64E
-04
-5.7
4E-0
510
.38
0.00
00-0
.013
8.02
40.
100.
206
0.00
0.06
41.
412.
61.
57E-
040.
81
21.
74E-
042.
81E-
04-1
.93E
-03
-7.9
5E-0
55.
130.
0000
-0.0
037.
272
0.10
0.08
30.
000.
102
1.71
1.3
7.04
E-05
1.0
31.
63E-
042.
58E-
04-2
.01E
-03
-8.0
1E-0
50.
000
4.65
0.00
00-0
.003
7.24
30.
100.
077
0.00
0.11
01.
691.
27.
37E-
051.
34
3.22
E-04
5.40
E-04
-2.2
1E-0
3-4
.49E
-05
9.86
0.00
00-0
.012
7.95
10.
250.
189
0.00
0.08
11.
452.
51.
36E-
042.
12
53.
60E-
045.
77E-
04-2
.66E
-03
-3.6
5E-0
510
.13
0.00
00-0
.012
7.99
50.
250.
192
0.00
0.07
11.
472.
61.
49E-
042.
96
3.65
E-04
5.61
E-04
-2.6
2E-0
3-3
.37E
-05
0.00
09.
750.
0000
-0.0
127.
921
0.25
0.18
70.
000.
070
1.45
2.5
1.29
E-04
3.6
77.
47E-
041.
11E-
03-3
.13E
-03
-4.3
4E-0
417
.03
0.00
01-0
.030
9.35
20.
500.
377
0.00
0.07
21.
274.
43.
02E-
046.
33
87.
75E-
041.
24E-
03-1
.99E
-03
-6.2
3E-0
416
.89
0.00
01-0
.029
9.30
80.
500.
377
0.00
0.05
41.
244.
32.
99E-
048.
39
7.71
E-04
1.23
E-03
-1.7
4E-0
3-7
.61E
-04
0.00
16.5
80.
0002
-0.0
299.
249
0.50
0.37
50.
000.
052
1.23
4.2
3.00
E-04
10.1
101.
10E-
031.
96E-
03-1
.59E
-03
-9.0
6E-0
423
.58
0.00
07-0
.049
10.8
710.
750.
563
0.02
0.05
71.
176.
05.
94E-
0414
.44
111.
12E-
032.
12E-
03-1
.19E
-03
-5.9
5E-0
423
.68
0.00
09-0
.049
10.9
010.
750.
585
0.01
0.04
61.
136.
06.
50E-
0418
.112
1.08
E-03
1.92
E-03
-1.1
4E-0
3-6
.57E
-04
0.00
422
.46
0.00
10-0
.045
10.6
200.
750.
567
0.01
0.04
31.
105.
76.
32E-
0421
.213
1.35
E-03
2.27
E-03
-1.5
7E-0
3-1
.63E
-03
28.2
10.
0018
-0.0
6312
.096
1.00
0.75
00.
020.
053
1.06
7.2
1.05
E-03
27.5
514
1.32
E-03
1.80
E-03
-1.0
7E-0
3-1
.87E
-03
27.4
00.
0021
-0.0
6011
.904
1.00
0.75
30.
010.
045
1.01
7.0
1.03
E-03
32.7
151.
30E-
036.
67E-
03-1
.11E
-03
-1.7
8E-0
30.
008
26.9
30.
0022
-0.0
5911
.815
1.00
0.74
90.
020.
040
1.00
6.8
1.15
E-03
37.4
161.
82E-
039.
68E-
03-2
.22E
-03
-2.6
2E-0
336
.48
0.00
45-0
.088
14.5
151.
501.
130
0.06
0.05
90.
909.
32.
25E-
0351
.36
171.
68E-
031.
42E-
03-1
.25E
-03
-2.1
4E-0
332
.65
0.00
55-0
.075
13.5
851.
501.
125
0.05
0.04
40.
818.
32.
26E-
0360
.518
1.65
E-03
1.45
E-03
-1.3
8E-0
3-2
.12E
-03
0.02
032
.09
0.00
57-0
.073
13.4
531.
501.
124
0.05
0.04
00.
798.
22.
28E-
0368
.719
2.11
E-03
1.99
E-03
-1.4
1E-0
3-2
.49E
-03
40.0
90.
0084
-0.0
9715
.842
2.00
1.49
80.
100.
057
0.75
10.2
3.34
E-03
88.1
720
2.36
E-03
1.73
E-03
-1.0
1E-0
3-2
.25E
-03
37.3
70.
0092
-0.0
8815
.134
2.00
1.50
30.
090.
050
0.69
9.5
3.64
E-03
104.
121
2.41
E-03
1.91
E-03
-8.9
4E-0
4-2
.04E
-03
0.02
536
.05
0.00
95-0
.084
14.8
242.
001.
498
0.07
0.04
20.
679.
23.
88E-
0311
7.1
222.
38E-
032.
72E-
03-1
.41E
-03
-1.8
9E-0
343
.61
0.01
76-0
.106
17.2
583.
002.
100
0.28
0.09
60.
5311
.16.
10E-
0316
9.7
823
2.11
E-03
3.21
E-03
-2.1
7E-0
3-1
.37E
-03
35.6
50.
0195
-0.0
8015
.193
3.00
----
0.06
90.
449.
11.
06E-
0220
1.2
242.
48E-
032.
45E-
03-8
.92E
-04
-1.4
2E-0
30.
2032
.21
0.02
07-0
.070
14.2
643.
00--
--0.
058
0.40
8.2
1.25
E-02
225.
225
2.30
E-03
2.43
E-03
-2.5
5E-0
3-1
.57E
-03
35.3
60.
0401
-0.0
7815
.237
5.00
----
0.14
00.
259.
01.
96E-
0232
6.2
926
3.69
E-03
5.29
E-03
-7.5
2E-0
3-4
.76E
-04
23.7
40.
0431
-0.0
4511
.933
5.00
----
0.09
50.
186.
11.
96E-
0237
4.6
274.
13E-
035.
80E-
03-5
.59E
-03
-2.8
7E-0
4>
0.20
20.3
20.
0442
-0.0
3710
.901
5.00
----
0.08
10.
155.
11.
66E-
0240
9.9
284.
68E-
036.
94E-
03-2
.99E
-03
-1.6
3E-0
421
.19
0.06
41-0
.039
11.0
637.
00--
--0.
123
0.11
5.4
2.16
E-02
488.
010
299.
08E-
039.
50E-
03--
-2.4
0E-0
315
.45
0.06
56-0
.025
9.30
87.
00--
--0.
100
0.08
3.9
--53
4.2
301.
11E-
028.
93E-
03--
-6.8
2E-0
4>
0.20
13.2
10.
0662
-0.0
208.
629
7.00
----
0.09
20.
073.
4--
570.
631
1.65
E-02
3.79
E-03
---1
.42E
-03
13.6
30.
0844
-0.0
208.
688
8.82
----
0.11
50.
063.
5--
629.
711
321.
65E-
024.
70E-
03--
-3.1
4E-0
310
.61
0.08
53-0
.016
6.96
28.
82--
--0.
103
0.04
2.7
--67
1.2
331.
65E-
023.
45E-
03--
-4.0
7E-0
3>
0.20
9.07
00.
0862
-0.0
126.
446
8.82
----
0.10
60.
042.
3--
706.
9
Tabl
e 5.9
Tes
t #5:
Per
form
ance
par
amet
ers (
0.1f
' cAg)
up d
irec
tion
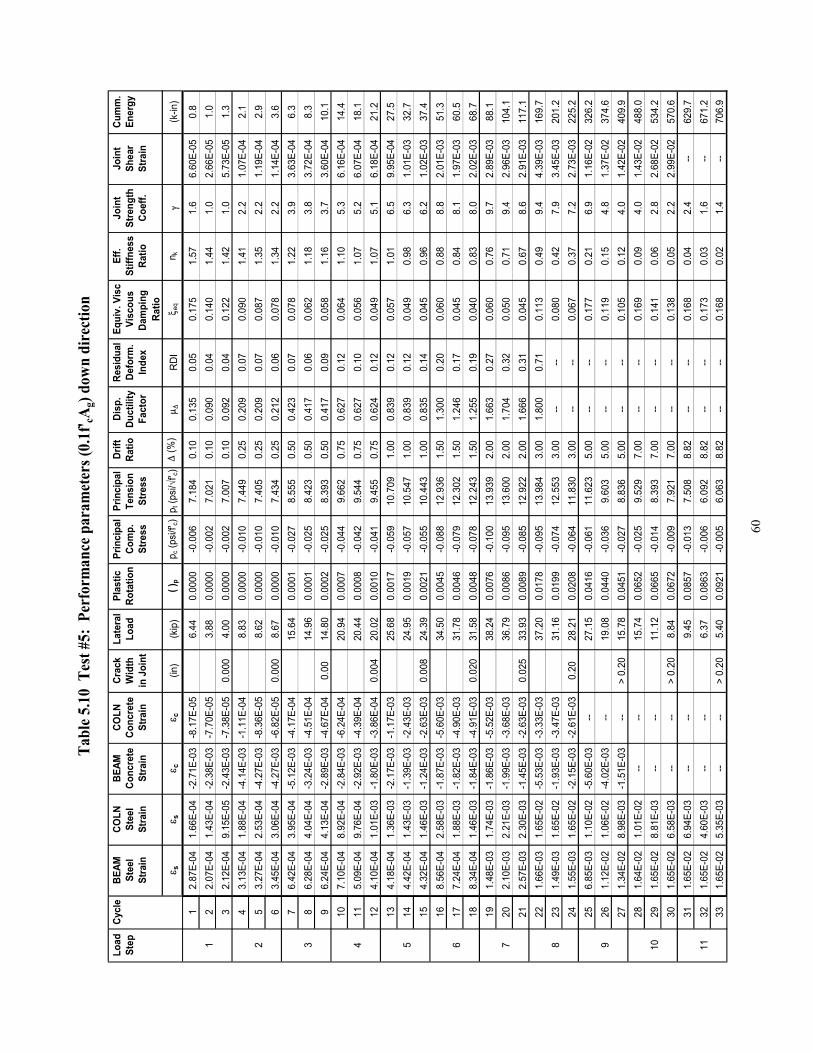
60
Load
Cycl
eBE
AMCO
LNBE
AMCO
LNCr
ack
Late
ral
Plas
ticPr
inci
pal
Prin
cipa
lDr
iftDi
sp.
Resi
dual
Equi
v. V
isc
Eff.
Join
tJo
int
Cum
m.
Step
Stee
lSt
eel
Conc
rete
Conc
rete
Wid
thLo
adRo
tatio
nCo
mp.
Tens
ion
Ratio
Duct
ility
Defo
rm.
Visc
ous
Stiff
ness
Stre
ngth
Shea
rEn
ergy
Stra
inSt
rain
Stra
inSt
rain
in J
oint
Stre
ssSt
ress
Fact
orIn
dex
Dam
ping
Ra
tioCo
eff.
Stra
inRa
tioε s
ε sε c
ε c(in
)(k
ip)
( )p
p c (p
si/f' c
)p t
(psi/√f
' c)∆
(%)
µ ∆RD
Iξ e
qn k
γ(k
-in)
12.
87E-
041.
66E-
04-2
.71E
-03
-8.1
7E-0
56.
440.
0000
-0.0
067.
184
0.10
0.13
50.
050.
175
1.57
1.6
6.60
E-05
0.8
12
2.07
E-04
1.43
E-04
-2.3
8E-0
3-7
.70E
-05
3.88
0.00
00-0
.002
7.02
10.
100.
090
0.04
0.14
01.
441.
02.
66E-
051.
03
2.12
E-04
9.15
E-05
-2.4
3E-0
3-7
.38E
-05
0.00
04.
000.
0000
-0.0
027.
007
0.10
0.09
20.
040.
122
1.42
1.0
5.73
E-05
1.3
43.
13E-
041.
88E-
04-4
.14E
-03
-1.1
1E-0
48.
830.
0000
-0.0
107.
449
0.25
0.20
90.
070.
090
1.41
2.2
1.07
E-04
2.1
25
3.27
E-04
2.53
E-04
-4.2
7E-0
3-8
.36E
-05
8.62
0.00
00-0
.010
7.40
50.
250.
209
0.07
0.08
71.
352.
21.
19E-
042.
96
3.45
E-04
3.06
E-04
-4.2
7E-0
3-6
.82E
-05
0.00
08.
670.
0000
-0.0
107.
434
0.25
0.21
20.
060.
078
1.34
2.2
1.14
E-04
3.6
76.
42E-
043.
95E-
04-5
.12E
-03
-4.1
7E-0
415
.64
0.00
01-0
.027
8.55
50.
500.
423
0.07
0.07
81.
223.
93.
63E-
046.
33
86.
28E-
044.
04E-
04-3
.24E
-03
-4.5
1E-0
414
.96
0.00
01-0
.025
8.42
30.
500.
417
0.06
0.06
21.
183.
83.
72E-
048.
39
6.24
E-04
4.13
E-04
-2.8
9E-0
3-4
.67E
-04
0.00
14.8
00.
0002
-0.0
258.
393
0.50
0.41
70.
090.
058
1.16
3.7
3.60
E-04
10.1
107.
10E-
048.
92E-
04-2
.84E
-03
-6.2
4E-0
420
.94
0.00
07-0
.044
9.66
20.
750.
627
0.12
0.06
41.
105.
36.
16E-
0414
.44
115.
09E-
049.
76E-
04-2
.92E
-03
-4.3
9E-0
420
.44
0.00
08-0
.042
9.54
40.
750.
627
0.10
0.05
61.
075.
26.
07E-
0418
.112
4.10
E-04
1.01
E-03
-1.8
0E-0
3-3
.86E
-04
0.00
420
.02
0.00
10-0
.041
9.45
50.
750.
624
0.12
0.04
91.
075.
16.
18E-
0421
.213
4.18
E-04
1.36
E-03
-2.1
7E-0
3-1
.17E
-03
25.6
80.
0017
-0.0
5910
.709
1.00
0.83
90.
120.
057
1.01
6.5
9.95
E-04
27.5
514
4.42
E-04
1.43
E-03
-1.3
9E-0
3-2
.43E
-03
24.9
50.
0019
-0.0
5710
.547
1.00
0.83
90.
120.
049
0.98
6.3
1.01
E-03
32.7
154.
32E-
041.
46E-
03-1
.24E
-03
-2.6
3E-0
30.
008
24.3
90.
0021
-0.0
5510
.443
1.00
0.83
50.
140.
045
0.96
6.2
1.02
E-03
37.4
168.
56E-
042.
58E-
03-1
.87E
-03
-5.6
0E-0
334
.50
0.00
45-0
.088
12.9
361.
501.
300
0.20
0.06
00.
888.
82.
01E-
0351
.36
177.
24E-
041.
88E-
03-1
.82E
-03
-4.9
0E-0
331
.78
0.00
46-0
.079
12.3
021.
501.
246
0.17
0.04
50.
848.
11.
97E-
0360
.518
8.34
E-04
1.46
E-03
-1.8
4E-0
3-4
.91E
-03
0.02
031
.58
0.00
48-0
.078
12.2
431.
501.
255
0.19
0.04
00.
838.
02.
02E-
0368
.719
1.48
E-03
1.74
E-03
-1.8
6E-0
3-5
.52E
-03
38.2
40.
0076
-0.1
0013
.939
2.00
1.66
30.
270.
060
0.76
9.7
2.89
E-03
88.1
720
2.10
E-03
2.21
E-03
-1.9
9E-0
3-3
.68E
-03
36.7
90.
0086
-0.0
9513
.600
2.00
1.70
40.
320.
050
0.71
9.4
2.96
E-03
104.
121
2.57
E-03
2.30
E-03
-1.4
5E-0
3-2
.63E
-03
0.02
533
.93
0.00
89-0
.085
12.9
222.
001.
666
0.31
0.04
50.
678.
62.
91E-
0311
7.1
221.
66E-
031.
65E-
02-5
.53E
-03
-3.3
3E-0
337
.20
0.01
78-0
.095
13.9
843.
001.
800
0.71
0.11
30.
499.
44.
39E-
0316
9.7
823
1.49
E-03
1.65
E-02
-1.9
3E-0
3-3
.47E
-03
31.1
60.
0199
-0.0
7412
.553
3.00
----
0.08
00.
427.
93.
45E-
0320
1.2
241.
55E-
031.
65E-
02-2
.15E
-03
-2.6
1E-0
30.
2028
.21
0.02
08-0
.064
11.8
303.
00--
--0.
067
0.37
7.2
2.73
E-03
225.
225
6.85
E-03
1.10
E-02
-5.6
0E-0
3--
27.1
50.
0416
-0.0
6111
.623
5.00
----
0.17
70.
216.
91.
16E-
0232
6.2
926
1.12
E-02
1.06
E-02
-4.0
2E-0
3--
19.0
80.
0440
-0.0
369.
603
5.00
----
0.11
90.
154.
81.
37E-
0237
4.6
271.
34E-
028.
98E-
03-1
.51E
-03
-->
0.20
15.7
80.
0451
-0.0
278.
836
5.00
----
0.10
50.
124.
01.
42E-
0240
9.9
281.
64E-
021.
01E-
02--
--15
.74
0.06
52-0
.025
9.52
97.
00--
--0.
169
0.09
4.0
1.43
E-02
488.
010
291.
65E-
028.
81E-
03--
--11
.12
0.06
65-0
.014
8.39
37.
00--
--0.
141
0.06
2.8
2.68
E-02
534.
230
1.65
E-02
6.58
E-03
----
> 0.
208.
840.
0672
-0.0
097.
921
7.00
----
0.13
80.
052.
22.
99E-
0257
0.6
311.
65E-
026.
94E-
03--
--9.
450.
0857
-0.0
137.
508
8.82
----
0.16
80.
042.
4--
629.
711
321.
65E-
024.
60E-
03--
--6.
370.
0863
-0.0
066.
092
8.82
----
0.17
30.
031.
6--
671.
233
1.65
E-02
5.35
E-03
----
> 0.
205.
400.
0921
-0.0
056.
063
8.82
----
0.16
80.
021.
4--
706.
9
Tabl
e 5.1
0 T
est #
5: P
erfo
rman
ce p
aram
eter
s (0.
1f' cA
g) do
wn
dire
ctio
n
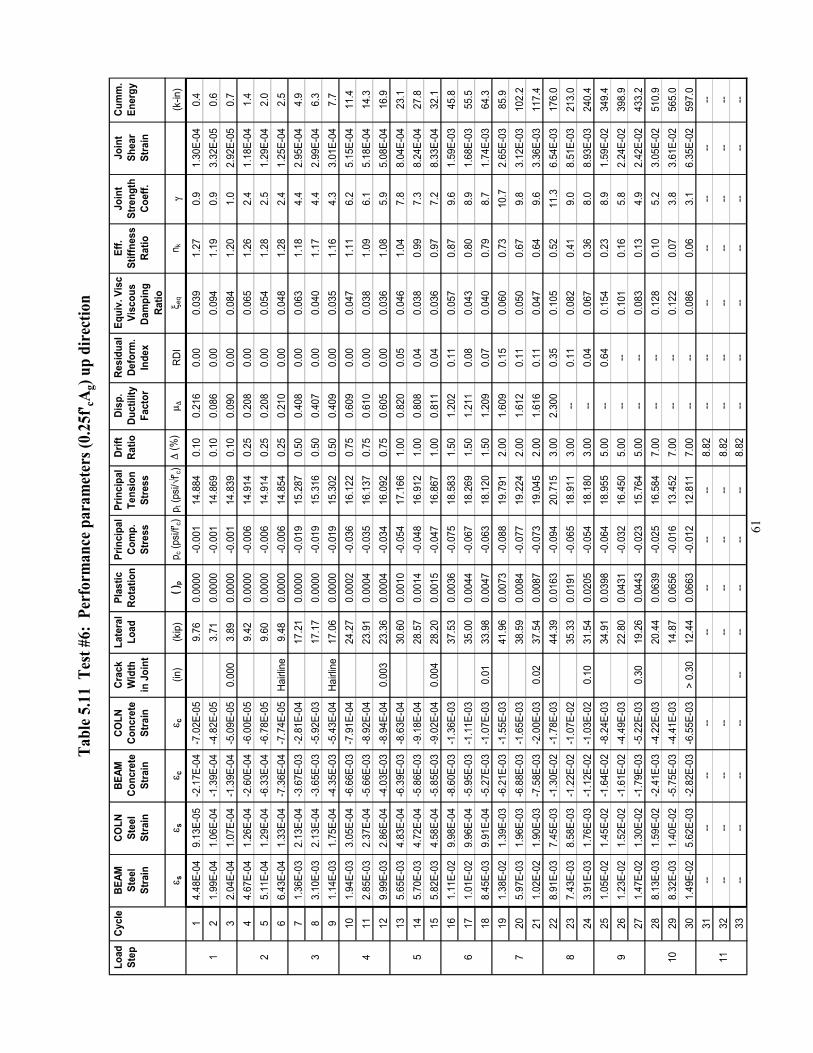
61
Load
Cycl
eBE
AMCO
LNBE
AMCO
LNCr
ack
Late
ral
Plas
ticPr
inci
pal
Prin
cipa
lDr
iftDi
sp.
Resi
dual
Equi
v. V
isc
Eff.
Join
tJo
int
Cum
m.
Step
Stee
lSt
eel
Conc
rete
Conc
rete
Wid
thLo
adRo
tatio
nCo
mp.
Tens
ion
Ratio
Duct
ility
Defo
rm.
Visc
ous
Stiff
ness
Stre
ngth
Shea
rEn
ergy
Stra
inSt
rain
Stra
inSt
rain
in J
oint
Stre
ssSt
ress
Fact
orIn
dex
Dam
ping
Ra
tioCo
eff.
Stra
inRa
tioε s
ε sε c
ε c(in
)(k
ip)
( )p
p c (p
si/f' c
)p t
(psi/√f
' c)∆
(%)
µ ∆RD
Iξ e
qn k
γ(k
-in)
14.
48E-
049.
13E-
05-2
.17E
-04
-7.0
2E-0
59.
760.
0000
-0.0
0114
.884
0.10
0.21
60.
000.
039
1.27
0.9
1.30
E-04
0.4
12
1.99
E-04
1.06
E-04
-1.3
9E-0
4-4
.82E
-05
3.71
0.00
00-0
.001
14.8
690.
100.
086
0.00
0.09
41.
190.
93.
32E-
050.
63
2.04
E-04
1.07
E-04
-1.3
9E-0
4-5
.09E
-05
0.00
03.
890.
0000
-0.0
0114
.839
0.10
0.09
00.
000.
084
1.20
1.0
2.92
E-05
0.7
44.
67E-
041.
26E-
04-2
.60E
-04
-6.0
0E-0
59.
420.
0000
-0.0
0614
.914
0.25
0.20
80.
000.
065
1.26
2.4
1.18
E-04
1.4
25
5.11
E-04
1.29
E-04
-6.3
3E-0
4-6
.78E
-05
9.60
0.00
00-0
.006
14.9
140.
250.
208
0.00
0.05
41.
282.
51.
29E-
042.
06
6.43
E-04
1.33
E-04
-7.3
6E-0
4-7
.74E
-05
Hairl
ine
9.48
0.00
00-0
.006
14.8
540.
250.
210
0.00
0.04
81.
282.
41.
25E-
042.
57
1.36
E-03
2.13
E-04
-3.6
7E-0
3-2
.81E
-04
17.2
10.
0000
-0.0
1915
.287
0.50
0.40
80.
000.
063
1.18
4.4
2.95
E-04
4.9
38
3.10
E-03
2.13
E-04
-3.6
5E-0
3-5
.92E
-03
17.1
70.
0000
-0.0
1915
.316
0.50
0.40
70.
000.
040
1.17
4.4
2.99
E-04
6.3
91.
14E-
031.
75E-
04-4
.35E
-03
-5.4
3E-0
4Ha
irlin
e17
.06
0.00
00-0
.019
15.3
020.
500.
409
0.00
0.03
51.
164.
33.
01E-
047.
710
1.94
E-03
3.05
E-04
-6.6
6E-0
3-7
.91E
-04
24.2
70.
0002
-0.0
3616
.122
0.75
0.60
90.
000.
047
1.11
6.2
5.15
E-04
11.4
411
2.85
E-03
2.37
E-04
-5.6
6E-0
3-8
.92E
-04
23.9
10.
0004
-0.0
3516
.137
0.75
0.61
00.
000.
038
1.09
6.1
5.18
E-04
14.3
129.
99E-
032.
86E-
04-4
.03E
-03
-8.9
4E-0
40.
003
23.3
60.
0004
-0.0
3416
.092
0.75
0.60
50.
000.
036
1.08
5.9
5.08
E-04
16.9
135.
65E-
034.
83E-
04-6
.39E
-03
-8.6
3E-0
430
.60
0.00
10-0
.054
17.1
661.
000.
820
0.05
0.04
61.
047.
88.
04E-
0423
.15
145.
70E-
034.
72E-
04-5
.86E
-03
-9.1
8E-0
428
.57
0.00
14-0
.048
16.9
121.
000.
808
0.04
0.03
80.
997.
38.
24E-
0427
.815
5.82
E-03
4.58
E-04
-5.8
5E-0
3-9
.02E
-04
0.00
428
.20
0.00
15-0
.047
16.8
671.
000.
811
0.04
0.03
60.
977.
28.
33E-
0432
.116
1.11
E-02
9.98
E-04
-8.6
0E-0
3-1
.36E
-03
37.5
30.
0036
-0.0
7518
.583
1.50
1.20
20.
110.
057
0.87
9.6
1.59
E-03
45.8
617
1.01
E-02
9.96
E-04
-5.9
5E-0
3-1
.11E
-03
35.0
00.
0044
-0.0
6718
.269
1.50
1.21
10.
080.
043
0.80
8.9
1.68
E-03
55.5
188.
45E-
039.
91E-
04-5
.27E
-03
-1.0
7E-0
30.
0133
.98
0.00
47-0
.063
18.1
201.
501.
209
0.07
0.04
00.
798.
71.
74E-
0364
.319
1.38
E-02
1.39
E-03
-6.2
1E-0
3-1
.55E
-03
41.9
60.
0073
-0.0
8819
.791
2.00
1.60
90.
150.
060
0.73
10.7
2.65
E-03
85.9
720
5.97
E-03
1.96
E-03
-6.8
8E-0
3-1
.65E
-03
38.5
90.
0084
-0.0
7719
.224
2.00
1.61
20.
110.
050
0.67
9.8
3.12
E-03
102.
221
1.02
E-02
1.90
E-03
-7.5
8E-0
3-2
.00E
-03
0.02
37.5
40.
0087
-0.0
7319
.045
2.00
1.61
60.
110.
047
0.64
9.6
3.36
E-03
117.
422
8.91
E-03
7.45
E-03
-1.3
0E-0
2-1
.78E
-03
44.3
90.
0163
-0.0
9420
.715
3.00
2.30
00.
350.
105
0.52
11.3
6.54
E-03
176.
08
237.
43E-
038.
58E-
03-1
.22E
-02
-1.0
7E-0
235
.33
0.01
91-0
.065
18.9
113.
00--
0.11
0.08
20.
419.
08.
51E-
0321
3.0
243.
91E-
031.
76E-
03-1
.12E
-02
-1.0
3E-0
20.
1031
.54
0.02
05-0
.054
18.1
803.
00--
0.04
0.06
70.
368.
08.
93E-
0324
0.4
251.
05E-
021.
45E-
02-1
.64E
-02
-8.2
4E-0
334
.91
0.03
98-0
.064
18.9
555.
00--
0.64
0.15
40.
238.
91.
59E-
0234
9.4
926
1.23
E-02
1.52
E-02
-1.6
1E-0
2-4
.49E
-03
22.8
00.
0431
-0.0
3216
.450
5.00
----
0.10
10.
165.
82.
24E-
0239
8.9
271.
47E-
021.
30E-
02-1
.79E
-03
-5.2
2E-0
30.
3019
.26
0.04
43-0
.023
15.7
645.
00--
--0.
083
0.13
4.9
2.42
E-02
433.
228
8.13
E-03
1.59
E-02
-2.4
1E-0
3-4
.22E
-03
20.4
40.
0639
-0.0
2516
.584
7.00
----
0.12
80.
105.
23.
05E-
0251
0.9
1029
8.32
E-03
1.40
E-02
-5.7
5E-0
3-4
.41E
-03
14.8
70.
0656
-0.0
1613
.452
7.00
----
0.12
20.
073.
83.
61E-
0256
5.0
301.
49E-
025.
62E-
03-2
.82E
-03
-6.5
5E-0
3>
0.30
12.4
40.
0663
-0.0
1212
.811
7.00
----
0.08
60.
063.
16.
35E-
0259
7.0
31--
----
----
----
--8.
82--
----
----
----
1132
----
----
----
----
8.82
----
----
----
--33
----
----
----
----
--8.
82--
----
----
----
Tabl
e 5.1
1 T
est #
6: P
erfo
rman
ce p
aram
eter
s (0.
25f' c
Ag)
up d
irec
tion
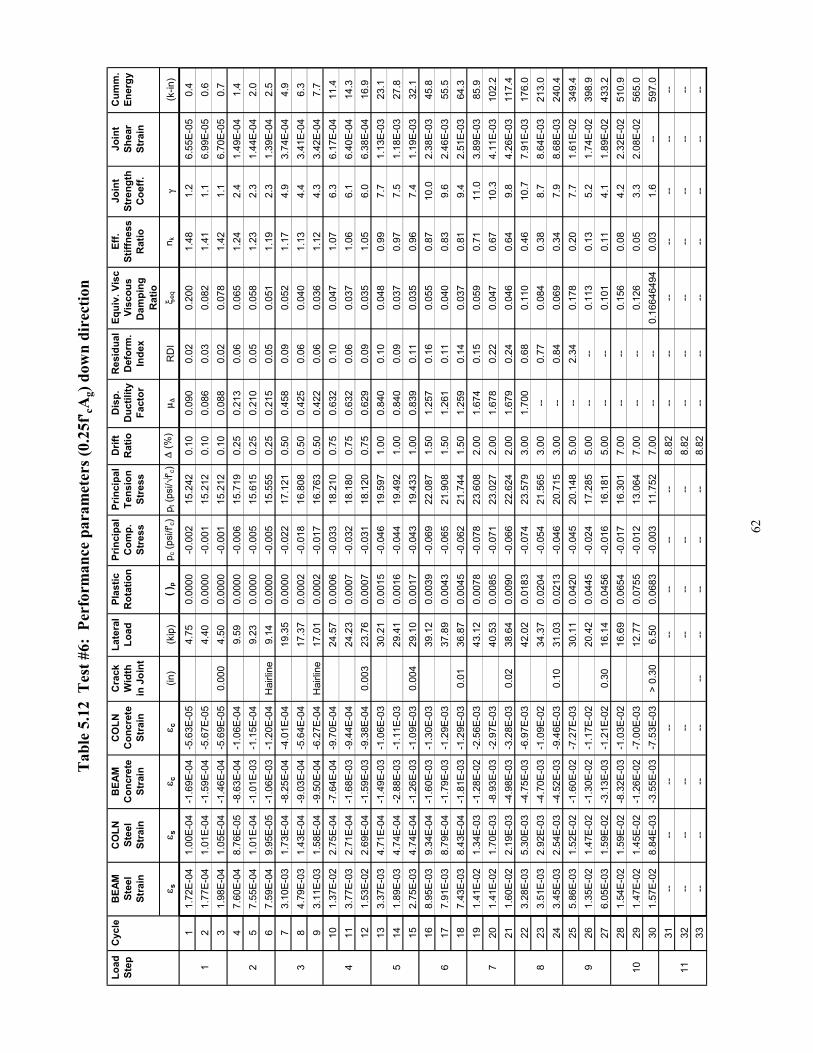
62
Load
Cyc
leB
EAM
CO
LNB
EAM
CO
LNC
rack
Late
ral
Plas
ticPr
inci
pal
Prin
cipa
lD
rift
Dis
p.R
esid
ual
Equi
v. V
isc
Eff.
Join
tJo
int
Cum
m.
Step
Stee
lSt
eel
Con
cret
eC
oncr
ete
Wid
thLo
adR
otat
ion
Com
p.Te
nsio
nR
atio
Duc
tility
Def
orm
.Vi
scou
sSt
iffne
ssSt
reng
thSh
ear
Ener
gySt
rain
Stra
inSt
rain
Stra
inin
Joi
ntSt
ress
Stre
ssFa
ctor
Inde
xD
ampi
ng
Rat
ioC
oeff.
Stra
inR
atio
ε sε s
ε cε c
(in)
(kip
)( )
pp c
(psi
/f'c)
p t (p
si/√
f' c)
∆ (%
)µ ∆
RD
Iξ e
qn k
γ(k
-in)
11.
72E-
041.
00E-
04-1
.69E
-04
-5.6
3E-0
54.
750.
0000
-0.0
0215
.242
0.10
0.09
00.
020.
200
1.48
1.2
6.55
E-05
0.4
12
1.77
E-04
1.01
E-04
-1.5
9E-0
4-5
.67E
-05
4.40
0.00
00-0
.001
15.2
120.
100.
086
0.03
0.08
21.
411.
16.
99E-
050.
63
1.98
E-04
1.05
E-04
-1.4
6E-0
4-5
.69E
-05
0.00
04.
500.
0000
-0.0
0115
.212
0.10
0.08
80.
020.
078
1.42
1.1
6.70
E-05
0.7
47.
60E-
048.
76E-
05-8
.63E
-04
-1.0
6E-0
49.
590.
0000
-0.0
0615
.719
0.25
0.21
30.
060.
065
1.24
2.4
1.49
E-04
1.4
25
7.55
E-04
1.01
E-04
-1.0
1E-0
3-1
.15E
-04
9.23
0.00
00-0
.005
15.6
150.
250.
210
0.05
0.05
81.
232.
31.
44E-
042.
06
7.59
E-04
9.95
E-05
-1.0
6E-0
3-1
.20E
-04
Hai
rline
9.14
0.00
00-0
.005
15.5
550.
250.
215
0.05
0.05
11.
192.
31.
39E-
042.
57
3.10
E-03
1.73
E-04
-8.2
5E-0
4-4
.01E
-04
19.3
50.
0000
-0.0
2217
.121
0.50
0.45
80.
090.
052
1.17
4.9
3.74
E-04
4.9
38
4.79
E-03
1.43
E-04
-9.0
3E-0
4-5
.64E
-04
17.3
70.
0002
-0.0
1816
.808
0.50
0.42
50.
060.
040
1.13
4.4
3.41
E-04
6.3
93.
11E-
031.
58E-
04-9
.50E
-04
-6.2
7E-0
4H
airli
ne17
.01
0.00
02-0
.017
16.7
630.
500.
422
0.06
0.03
61.
124.
33.
42E-
047.
710
1.37
E-02
2.75
E-04
-7.6
4E-0
4-9
.70E
-04
24.5
70.
0006
-0.0
3318
.210
0.75
0.63
20.
100.
047
1.07
6.3
6.17
E-04
11.4
411
3.77
E-03
2.71
E-04
-1.6
8E-0
3-9
.44E
-04
24.2
30.
0007
-0.0
3218
.180
0.75
0.63
20.
060.
037
1.06
6.1
6.40
E-04
14.3
121.
53E-
022.
69E-
04-1
.59E
-03
-9.3
8E-0
40.
003
23.7
60.
0007
-0.0
3118
.120
0.75
0.62
90.
090.
035
1.05
6.0
6.38
E-04
16.9
133.
37E-
034.
71E-
04-1
.49E
-03
-1.0
6E-0
330
.21
0.00
15-0
.046
19.5
971.
000.
840
0.10
0.04
80.
997.
71.
13E-
0323
.15
141.
89E-
034.
74E-
04-2
.88E
-03
-1.1
1E-0
329
.41
0.00
16-0
.044
19.4
921.
000.
840
0.09
0.03
70.
977.
51.
18E-
0327
.815
2.75
E-03
4.74
E-04
-1.2
6E-0
3-1
.09E
-03
0.00
429
.10
0.00
17-0
.043
19.4
331.
000.
839
0.11
0.03
50.
967.
41.
19E-
0332
.116
8.95
E-03
9.34
E-04
-1.6
0E-0
3-1
.30E
-03
39.1
20.
0039
-0.0
6922
.087
1.50
1.25
70.
160.
055
0.87
10.0
2.38
E-03
45.8
617
7.91
E-03
8.79
E-04
-1.7
9E-0
3-1
.29E
-03
37.8
90.
0043
-0.0
6521
.908
1.50
1.26
10.
110.
040
0.83
9.6
2.46
E-03
55.5
187.
43E-
038.
43E-
04-1
.81E
-03
-1.2
9E-0
30.
0136
.87
0.00
45-0
.062
21.7
441.
501.
259
0.14
0.03
70.
819.
42.
51E-
0364
.319
1.41
E-02
1.34
E-03
-1.2
8E-0
2-2
.56E
-03
43.1
20.
0078
-0.0
7823
.608
2.00
1.67
40.
150.
059
0.71
11.0
3.89
E-03
85.9
720
1.41
E-02
1.70
E-03
-8.9
3E-0
3-2
.97E
-03
40.5
30.
0085
-0.0
7123
.027
2.00
1.67
80.
220.
047
0.67
10.3
4.11
E-03
102.
221
1.60
E-02
2.19
E-03
-4.9
8E-0
3-3
.28E
-03
0.02
38.6
40.
0090
-0.0
6622
.624
2.00
1.67
90.
240.
046
0.64
9.8
4.26
E-03
117.
422
3.28
E-03
5.30
E-03
-4.7
5E-0
3-6
.97E
-03
42.0
20.
0183
-0.0
7423
.579
3.00
1.70
00.
680.
110
0.46
10.7
7.91
E-03
176.
08
233.
51E-
032.
92E-
03-4
.70E
-03
-1.0
9E-0
234
.37
0.02
04-0
.054
21.5
653.
00--
0.77
0.08
40.
388.
78.
64E-
0321
3.0
243.
45E-
032.
54E-
03-4
.52E
-03
-9.4
6E-0
30.
1031
.03
0.02
13-0
.046
20.7
153.
00--
0.84
0.06
90.
347.
98.
68E-
0324
0.4
255.
86E-
031.
52E-
02-1
.60E
-02
-7.2
7E-0
330
.11
0.04
20-0
.045
20.1
485.
00--
2.34
0.17
80.
207.
71.
61E-
0234
9.4
926
1.35
E-02
1.47
E-02
-1.3
0E-0
2-1
.17E
-02
20.4
20.
0445
-0.0
2417
.285
5.00
----
0.11
30.
135.
21.
74E-
0239
8.9
276.
05E-
031.
59E-
02-3
.13E
-03
-1.2
1E-0
20.
3016
.14
0.04
56-0
.016
16.1
815.
00--
--0.
101
0.11
4.1
1.89
E-02
433.
228
1.54
E-02
1.59
E-02
-8.3
2E-0
3-1
.03E
-02
16.6
90.
0654
-0.0
1716
.301
7.00
----
0.15
60.
084.
22.
32E-
0251
0.9
1029
1.47
E-02
1.45
E-02
-1.2
6E-0
2-7
.00E
-03
12.7
70.
0755
-0.0
1213
.064
7.00
----
0.12
60.
053.
32.
08E-
0256
5.0
301.
57E-
028.
84E-
03-3
.55E
-03
-7.5
3E-0
3>
0.30
6.50
0.06
83-0
.003
11.7
527.
00--
--0.
1664
6494
0.03
1.6
--59
7.0
31--
----
----
----
--8.
82--
----
----
----
1132
----
----
----
----
8.82
----
----
----
--33
----
----
----
----
--8.
82--
----
----
----
Tab
le 5
.12
Tes
t #6:
Per
form
ance
par
amet
ers (
0.25
f' cA
g) d
own
dire
ctio
n
63
5.2 PERFORMANCE LEVELS
Five levels of performance were used to characterize the exterior joints. These levels were
determined based on the evaluation and comparison of the previously tabulated parameters.
After analysis of the six joint test units, the governing parameters for delineating between
performance levels were found to be drift, plastic rotation, joint crack width, and the joint
strength coefficient γ. The type and extent of damage in the joint associated with each step was
also used as a parameter for determining the performance levels. The difference in axial
compression load caused slight differences but did not affect the order or description of the
performance levels. The most significant factor was the difference in the detailing of test units 1
and 2 versus 3, 4, 5, and 6, which caused different modes of failure. Owing to the different
modes of failure, two sets of performance levels were developed.
For test units 1 and 2, Level I is the first yielding of longitudinal reinforcement, which
was characterized by barely visible, initial cracking in the joint or no cracking at all. Level II
represents the full development of the bond-slip mechanism of the bottom beam bars in the joint.
This level occurred at the peak lateral load and was characterized by cracking in the joint less
than 0.01 in. wide. Level III represents significant diagonal cracking in the joint ( > 0.02 in.
wide) and the extension of these cracks into the column. Level IV was characterized by the
spalling of concrete at the corner of the joint where the bottom beam bars were slipping. Level
V is total loss of lateral-load-carrying capacity.
For test units 3, 4, 5, and 6, Level I is also the first yielding of longitudinal reinforcement
and was characterized by barely visible, initial cracking in the joint or no cracking at all. Level
II represents significant diagonal cracking in the joint ( > 0.02 in. wide) and the extension of
these cracks into the column. Level III represents the full development of the joint shear
mechanism. This level occurred at the peak lateral load and was characterized by extensive
cracking in the joint and the extension of diagonal joint cracks into the column. Level IV was
characterized by the spalling of concrete in the core of the joint. Level V is total loss of gravity-
load-carrying capacity.
The performance levels with detailed descriptions are shown for each beam-column joint
test unit in Tables 5.13 through 5.18. Accompanying these tables are Figures 5.1 through 5.12,

64
which include performance levels marked on each joint’s respective hysteretic-envelope curve
and photographic documentation of each joint at all five performance levels.
It should be noted that these performance levels are based on only six joint tests. The
parameters are average values. Further studies are needed to generalize the findings of this
investigation and to determine the performance levels for higher axial load levels.
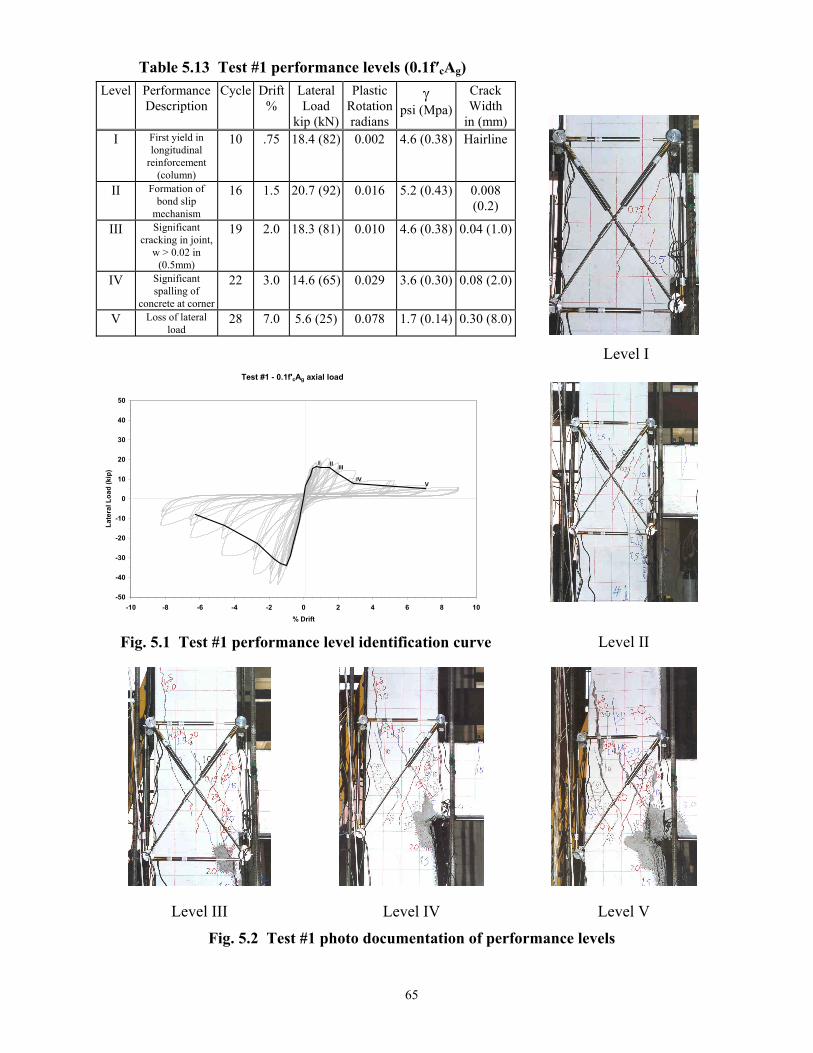
65
Table 5.13 Test #1 performance levels (0.1f′cAg) Level Performance
Description Cycle Drift
% Lateral Load
kip (kN)
Plastic Rotationradians
γ psi (Mpa)
Crack Width
in (mm) I First yield in
longitudinal reinforcement
(column)
10 .75 18.4 (82) 0.002 4.6 (0.38) Hairline
II Formation of bond slip
mechanism
16 1.5 20.7 (92) 0.016 5.2 (0.43) 0.008 (0.2)
III Significant cracking in joint,
w > 0.02 in (0.5mm)
19 2.0 18.3 (81) 0.010 4.6 (0.38) 0.04 (1.0)
IV Significant spalling of
concrete at corner
22 3.0 14.6 (65) 0.029 3.6 (0.30) 0.08 (2.0)
V Loss of lateral load
28 7.0 5.6 (25) 0.078 1.7 (0.14) 0.30 (8.0)
Level I
Test #1 - 0.1f'cAg axial load
-50
-40
-30
-20
-10
0
10
20
30
40
50
-10 -8 -6 -4 -2 0 2 4 6 8 10% Drift
Late
ral L
oad
(kip
)
VIV
IIIIII
Fig. 5.1 Test #1 performance level identification curve Level II
Level III Level IV Level V
Fig. 5.2 Test #1 photo documentation of performance levels
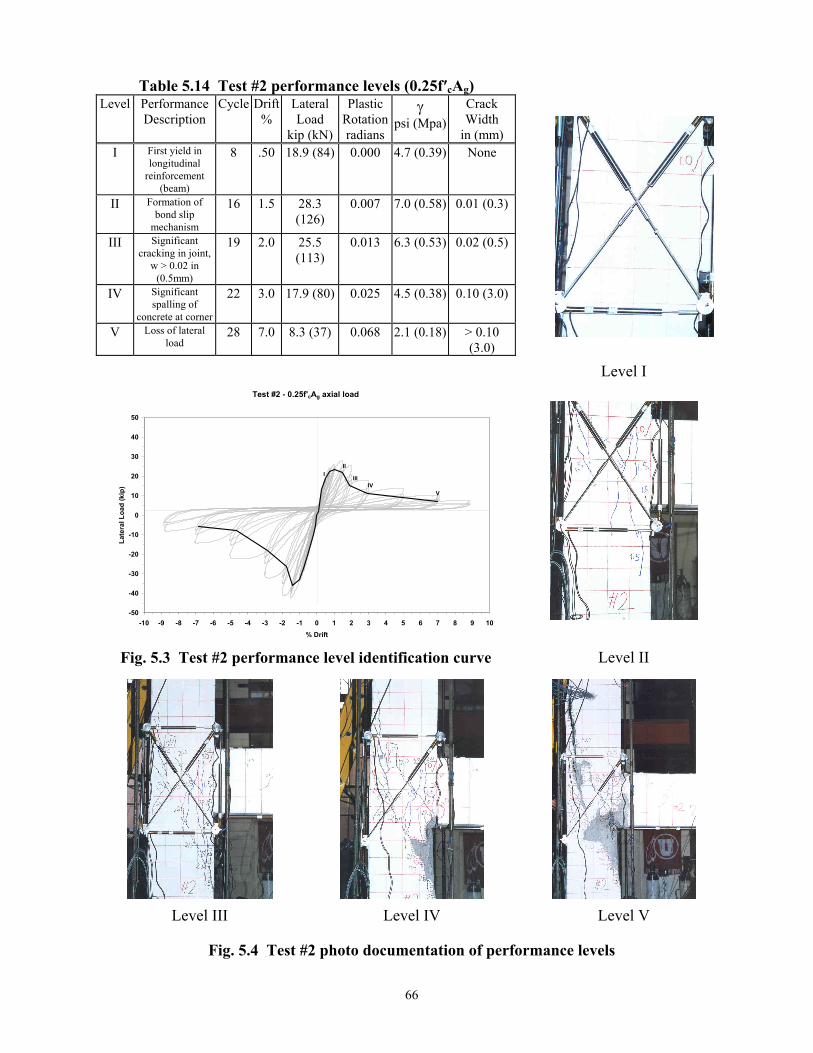
66
Table 5.14 Test #2 performance levels (0.25f′cAg)
Level Performance Description
Cycle Drift %
Lateral Load
kip (kN)
Plastic Rotationradians
γ psi (Mpa)
Crack Width
in (mm) I First yield in
longitudinal reinforcement
(beam)
8 .50 18.9 (84) 0.000 4.7 (0.39) None
II Formation of bond slip
mechanism
16 1.5 28.3 (126)
0.007 7.0 (0.58) 0.01 (0.3)
III Significant cracking in joint,
w > 0.02 in (0.5mm)
19 2.0 25.5 (113)
0.013 6.3 (0.53) 0.02 (0.5)
IV Significant spalling of
concrete at corner
22 3.0 17.9 (80) 0.025 4.5 (0.38) 0.10 (3.0)
V Loss of lateral load
28 7.0 8.3 (37) 0.068 2.1 (0.18) > 0.10 (3.0)
Level I Test #2 - 0.25f'cAg axial load
-50
-40
-30
-20
-10
0
10
20
30
40
50
-10 -9 -8 -7 -6 -5 -4 -3 -2 -1 0 1 2 3 4 5 6 7 8 9 10% Drift
Late
ral L
oad
(kip
)
VIV
III
III
Fig. 5.3 Test #2 performance level identification curve Level II
Level III Level IV Level V
Fig. 5.4 Test #2 photo documentation of performance levels
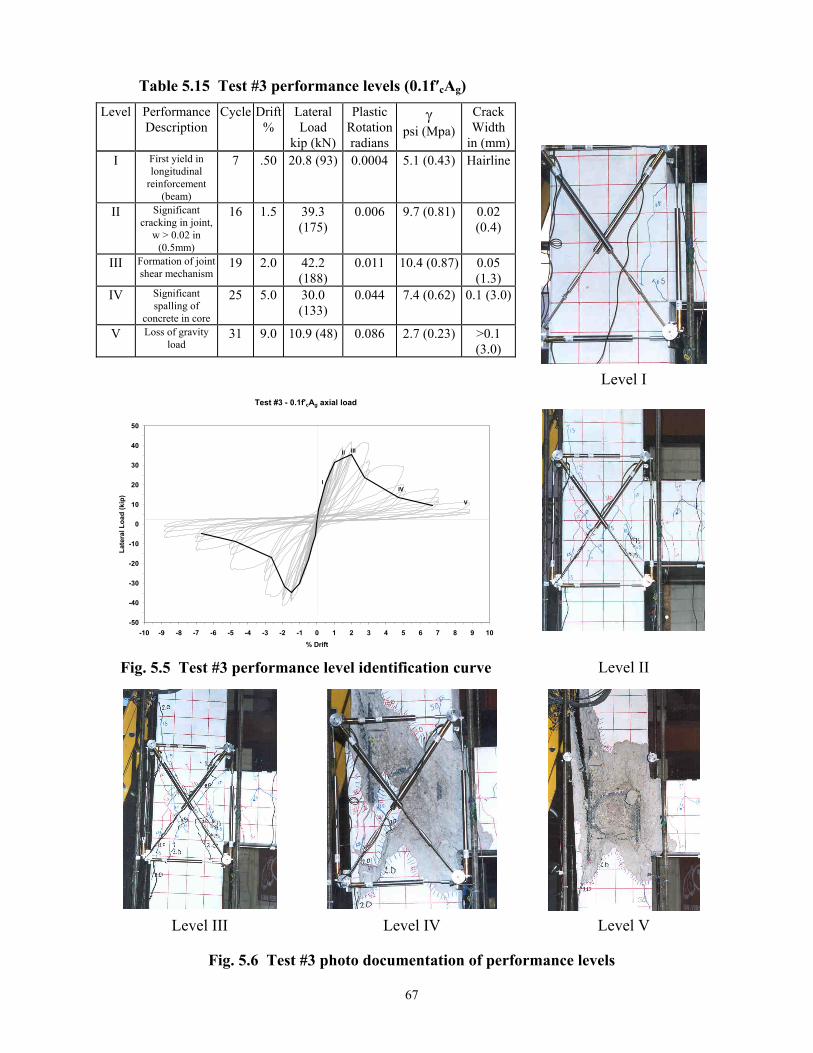
67
Table 5.15 Test #3 performance levels (0.1f′cAg)
Level Performance Description
Cycle Drift %
Lateral Load
kip (kN)
Plastic Rotationradians
γ psi (Mpa)
Crack Width
in (mm)I First yield in
longitudinal reinforcement
(beam)
7 .50 20.8 (93) 0.0004 5.1 (0.43) Hairline
II Significant cracking in joint,
w > 0.02 in (0.5mm)
16 1.5 39.3 (175)
0.006 9.7 (0.81) 0.02 (0.4)
III Formation of joint shear mechanism
19 2.0 42.2 (188)
0.011 10.4 (0.87) 0.05 (1.3)
IV Significant spalling of
concrete in core
25 5.0 30.0 (133)
0.044 7.4 (0.62) 0.1 (3.0)
V Loss of gravity load
31 9.0 10.9 (48) 0.086 2.7 (0.23) >0.1 (3.0)
Level I Test #3 - 0.1f'cAg axial load
-50
-40
-30
-20
-10
0
10
20
30
40
50
-10 -9 -8 -7 -6 -5 -4 -3 -2 -1 0 1 2 3 4 5 6 7 8 9 10% Drift
Late
ral L
oad
(kip
)
V
IV
IIIII
I
Fig. 5.5 Test #3 performance level identification curve Level II
Level III Level IV Level V
Fig. 5.6 Test #3 photo documentation of performance levels
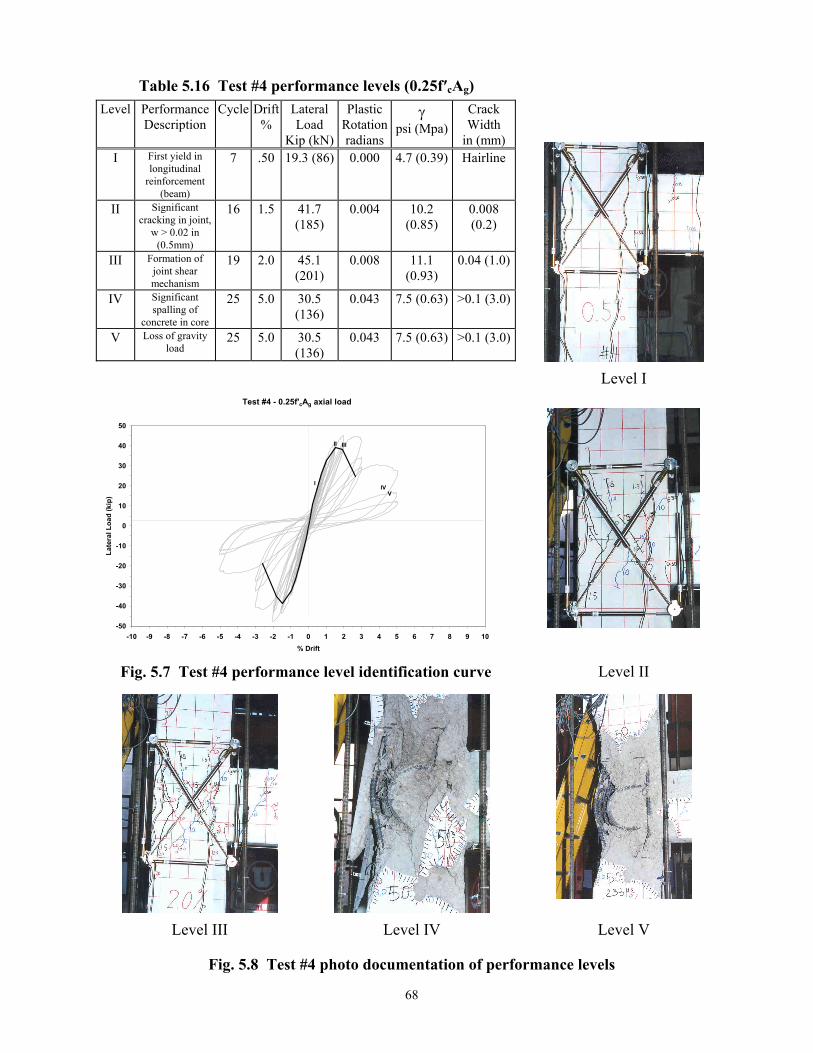
68
Table 5.16 Test #4 performance levels (0.25f′cAg)
Level Performance Description
Cycle Drift %
Lateral Load
Kip (kN)
Plastic Rotationradians
γ psi (Mpa)
Crack Width
in (mm) I First yield in
longitudinal reinforcement
(beam)
7 .50 19.3 (86) 0.000 4.7 (0.39) Hairline
II Significant cracking in joint,
w > 0.02 in (0.5mm)
16 1.5 41.7 (185)
0.004 10.2 (0.85)
0.008 (0.2)
III Formation of joint shear mechanism
19 2.0 45.1 (201)
0.008 11.1 (0.93)
0.04 (1.0)
IV Significant spalling of
concrete in core
25 5.0 30.5 (136)
0.043 7.5 (0.63) >0.1 (3.0)
V Loss of gravity load
25 5.0 30.5 (136)
0.043 7.5 (0.63) >0.1 (3.0) Level I
Test #4 - 0.25f'cAg axial load
-50
-40
-30
-20
-10
0
10
20
30
40
50
-10 -9 -8 -7 -6 -5 -4 -3 -2 -1 0 1 2 3 4 5 6 7 8 9 10% Drift
Late
ral L
oad
(kip
) VIV
I
II III
Fig. 5.7 Test #4 performance level identification curve Level II
Level III Level IV Level V
Fig. 5.8 Test #4 photo documentation of performance levels
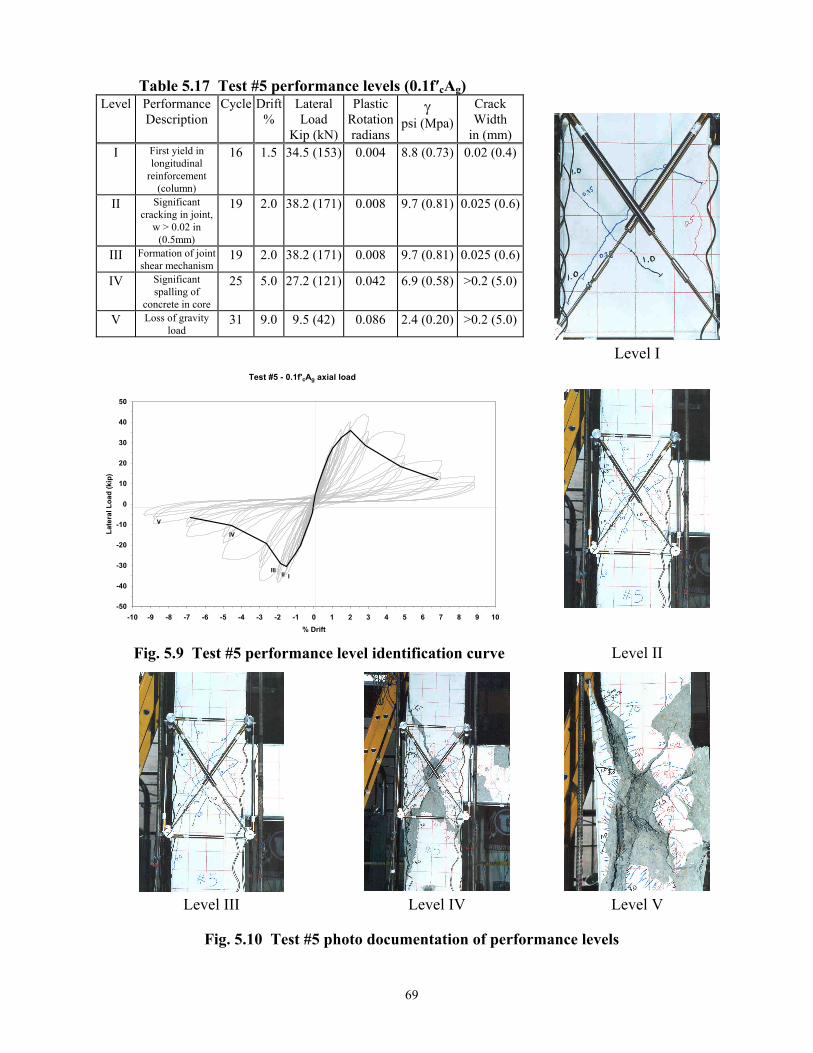
69
Table 5.17 Test #5 performance levels (0.1f′cAg)
Level Performance Description
Cycle Drift %
Lateral Load
Kip (kN)
Plastic Rotationradians
γ psi (Mpa)
Crack Width
in (mm) I First yield in
longitudinal reinforcement
(column)
16 1.5 34.5 (153) 0.004 8.8 (0.73) 0.02 (0.4)
II Significant cracking in joint,
w > 0.02 in (0.5mm)
19 2.0 38.2 (171) 0.008 9.7 (0.81) 0.025 (0.6)
III Formation of joint shear mechanism
19 2.0 38.2 (171) 0.008 9.7 (0.81) 0.025 (0.6)
IV Significant spalling of
concrete in core
25 5.0 27.2 (121) 0.042 6.9 (0.58) >0.2 (5.0)
V Loss of gravity load
31 9.0 9.5 (42) 0.086 2.4 (0.20) >0.2 (5.0) Level I
Test #5 - 0.1f'cAg axial load
-50
-40
-30
-20
-10
0
10
20
30
40
50
-10 -9 -8 -7 -6 -5 -4 -3 -2 -1 0 1 2 3 4 5 6 7 8 9 10% Drift
Late
ral L
oad
(kip
)
IIIIII
IV
V
Fig. 5.9 Test #5 performance level identification curve Level II
Level III Level IV Level V
Fig. 5.10 Test #5 photo documentation of performance levels
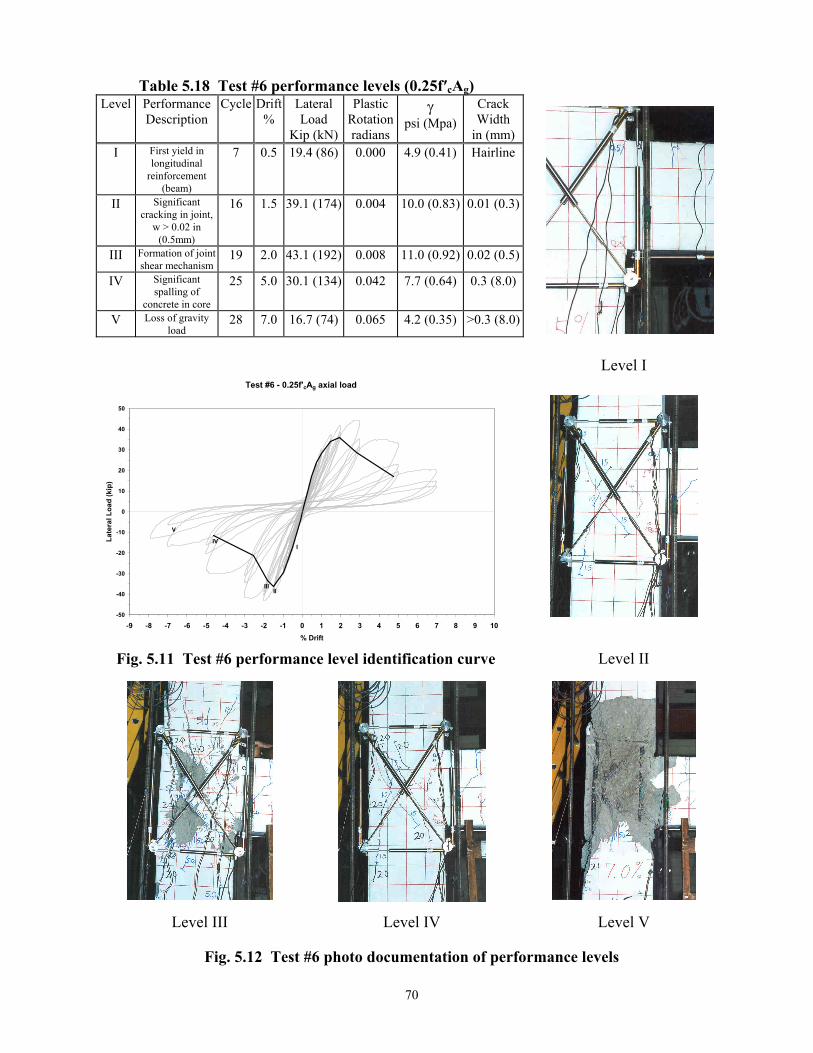
70
Table 5.18 Test #6 performance levels (0.25f′cAg)
Level Performance Description
Cycle Drift %
Lateral Load
Kip (kN)
Plastic Rotationradians
γ psi (Mpa)
Crack Width
in (mm) I First yield in
longitudinal reinforcement
(beam)
7 0.5 19.4 (86) 0.000 4.9 (0.41) Hairline
II Significant cracking in joint,
w > 0.02 in (0.5mm)
16 1.5 39.1 (174) 0.004 10.0 (0.83) 0.01 (0.3)
III Formation of joint shear mechanism
19 2.0 43.1 (192) 0.008 11.0 (0.92) 0.02 (0.5)
IV Significant spalling of
concrete in core
25 5.0 30.1 (134) 0.042 7.7 (0.64) 0.3 (8.0)
V Loss of gravity load
28 7.0 16.7 (74) 0.065 4.2 (0.35) >0.3 (8.0)
Level I Test #6 - 0.25f'cAg axial load
-50
-40
-30
-20
-10
0
10
20
30
40
50
-9 -8 -7 -6 -5 -4 -3 -2 -1 0 1 2 3 4 5 6 7 8 9 10% Drift
Late
ral L
oad
(kip
)
I
IIIII
IV
V
Fig. 5.11 Test #6 performance level identification curve Level II
Level III Level IV Level V
Fig. 5.12 Test #6 photo documentation of performance levels
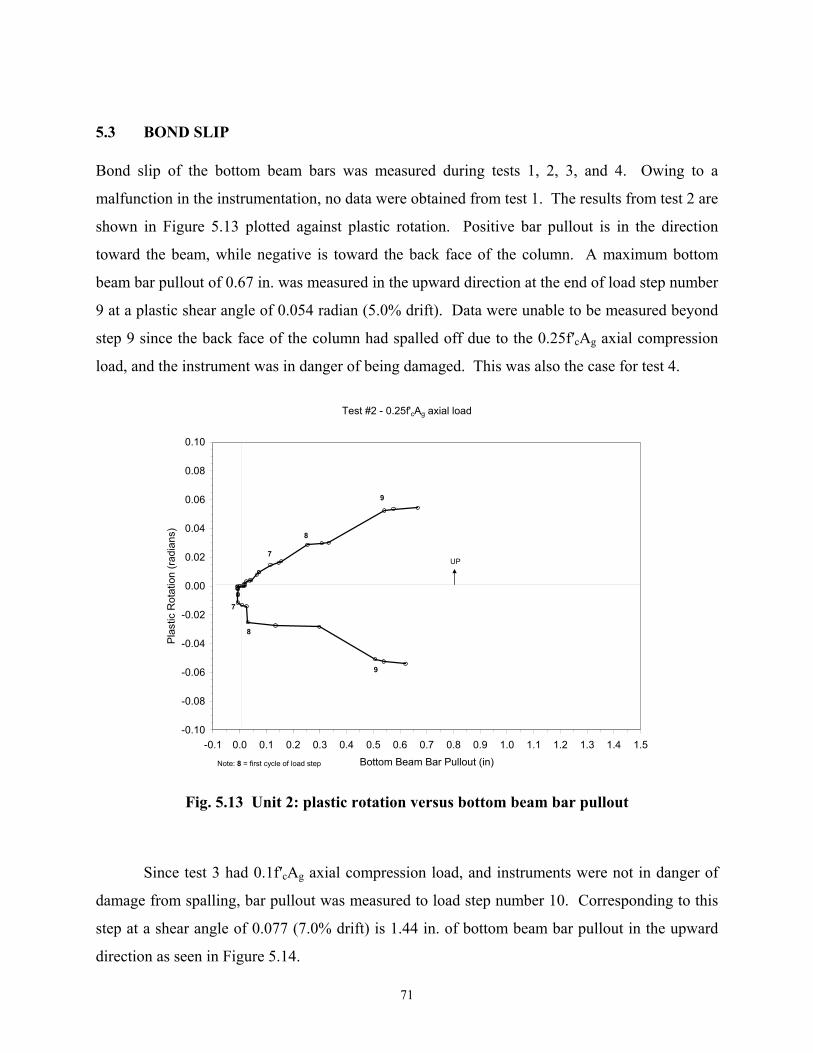
71
5.3 BOND SLIP
Bond slip of the bottom beam bars was measured during tests 1, 2, 3, and 4. Owing to a
malfunction in the instrumentation, no data were obtained from test 1. The results from test 2 are
shown in Figure 5.13 plotted against plastic rotation. Positive bar pullout is in the direction
toward the beam, while negative is toward the back face of the column. A maximum bottom
beam bar pullout of 0.67 in. was measured in the upward direction at the end of load step number
9 at a plastic shear angle of 0.054 radian (5.0% drift). Data were unable to be measured beyond
step 9 since the back face of the column had spalled off due to the 0.25f′cAg axial compression
load, and the instrument was in danger of being damaged. This was also the case for test 4.
Test #2 - 0.25f'cAg axial load
-0.10
-0.08
-0.06
-0.04
-0.02
0.00
0.02
0.04
0.06
0.08
0.10
-0.1 0.0 0.1 0.2 0.3 0.4 0.5 0.6 0.7 0.8 0.9 1.0 1.1 1.2 1.3 1.4 1.5Bottom Beam Bar Pullout (in)
Plas
tic R
otat
ion
(radi
ans)
9
9
8
8
7
7
Note: 8 = first cycle of load step
UP
Fig. 5.13 Unit 2: plastic rotation versus bottom beam bar pullout
Since test 3 had 0.1f′cAg axial compression load, and instruments were not in danger of
damage from spalling, bar pullout was measured to load step number 10. Corresponding to this
step at a shear angle of 0.077 (7.0% drift) is 1.44 in. of bottom beam bar pullout in the upward
direction as seen in Figure 5.14.
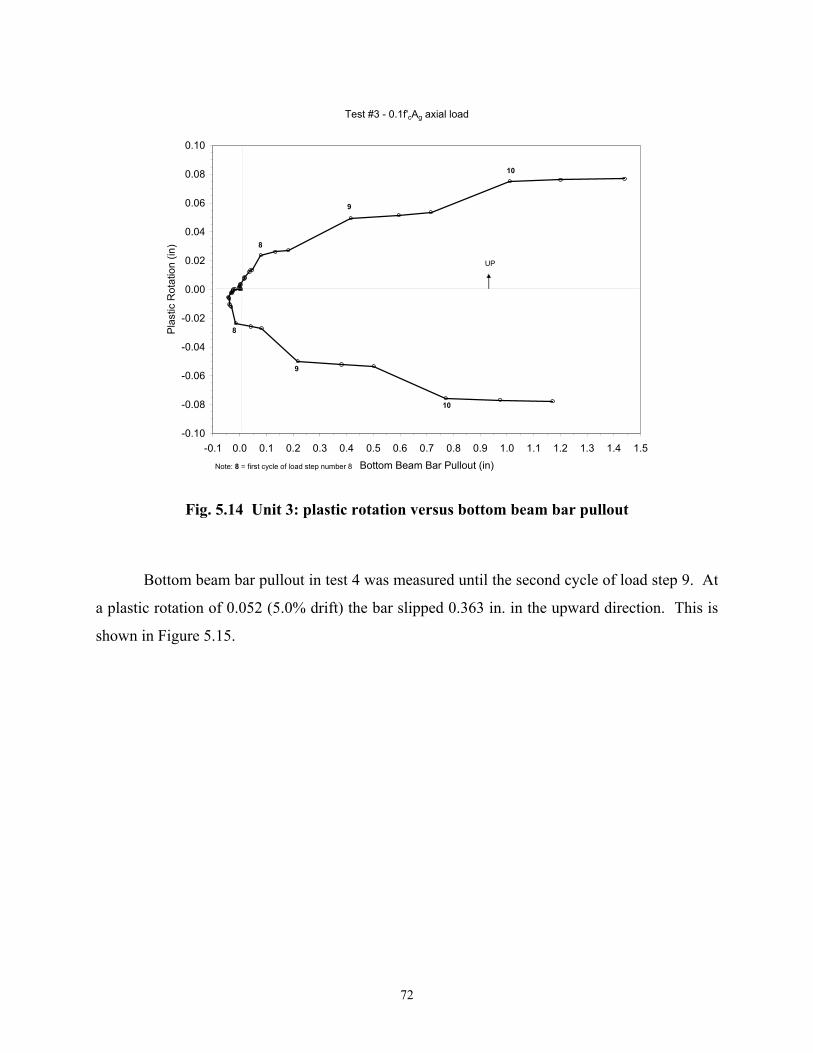
72
Test #3 - 0.1f'cAg axial load
-0.10
-0.08
-0.06
-0.04
-0.02
0.00
0.02
0.04
0.06
0.08
0.10
-0.1 0.0 0.1 0.2 0.3 0.4 0.5 0.6 0.7 0.8 0.9 1.0 1.1 1.2 1.3 1.4 1.5Bottom Beam Bar Pullout (in)
Plas
tic R
otat
ion
(in)
10
9
8
10
9
8
Note: 8 = first cycle of load step number 8
UP
Fig. 5.14 Unit 3: plastic rotation versus bottom beam bar pullout
Bottom beam bar pullout in test 4 was measured until the second cycle of load step 9. At
a plastic rotation of 0.052 (5.0% drift) the bar slipped 0.363 in. in the upward direction. This is
shown in Figure 5.15.
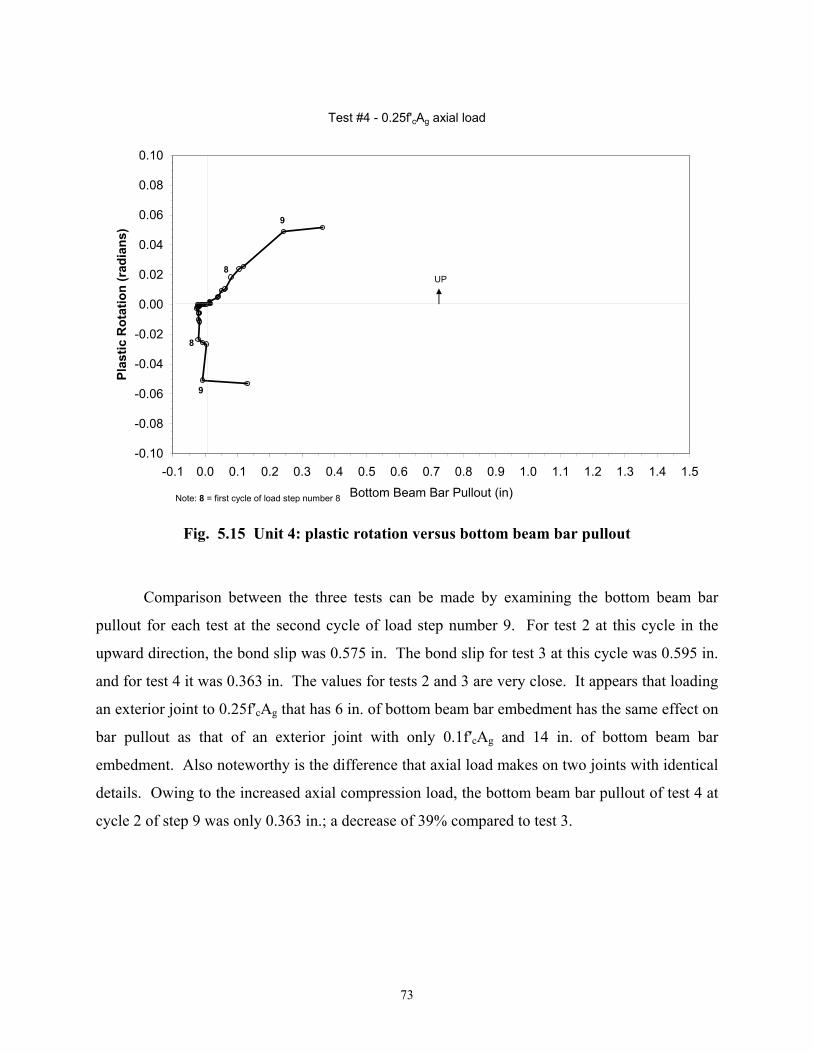
73
Test #4 - 0.25f'cAg axial load
-0.10
-0.08
-0.06
-0.04
-0.02
0.00
0.02
0.04
0.06
0.08
0.10
-0.1 0.0 0.1 0.2 0.3 0.4 0.5 0.6 0.7 0.8 0.9 1.0 1.1 1.2 1.3 1.4 1.5Bottom Beam Bar Pullout (in)
Plas
tic R
otat
ion
(rad
ians
)
9
9
8
8
Note: 8 = first cycle of load step number 8
UP
Fig. 5.15 Unit 4: plastic rotation versus bottom beam bar pullout
Comparison between the three tests can be made by examining the bottom beam bar
pullout for each test at the second cycle of load step number 9. For test 2 at this cycle in the
upward direction, the bond slip was 0.575 in. The bond slip for test 3 at this cycle was 0.595 in.
and for test 4 it was 0.363 in. The values for tests 2 and 3 are very close. It appears that loading
an exterior joint to 0.25f′cAg that has 6 in. of bottom beam bar embedment has the same effect on
bar pullout as that of an exterior joint with only 0.1f′cAg and 14 in. of bottom beam bar
embedment. Also noteworthy is the difference that axial load makes on two joints with identical
details. Owing to the increased axial compression load, the bottom beam bar pullout of test 4 at
cycle 2 of step 9 was only 0.363 in.; a decrease of 39% compared to test 3.

74
5.4 COMPARISON WITH FEMA 273 AND ACI 352
The test results were compared with the FEMA 273 (BSSC 1997) modeling parameters for RC
beam-column joints. Specifically, the shear deformation angle parameters at the end of the peak
strength, d, and at the collapse level, e, and the residual strength ratio, c, as defined in Figure
5.16, were compared to Table 6-8 of FEMA 273. FEMA 273 parameters do not exist for an
axial load ratio of 0.25 f′cAg; however, Table 5.19 shows that for an axial load ratio of 0.1f’cAg,
the FEMA Guidelines are conservative.
Shear Angle
Q/Q
CE
de
c
1.0
Fig. 5.16 FEMA modeling parameters
Table 5.19 Modeling parameters for specimens in comparison with FEMA 273
Test # P/f’cAg 1 Transverse
Reinforcement V/Vn 2 d e c 5
1 0.10 NC 3 0.88 0.010 0.030 0.488 2 0.25 NC 3 1.20 0.010 0.030 0.514
FEMA 273 ≤ 0.1 NC 4 ≤ 1.2 0.005 0.010 0.200 3 0.10 NC 1.73 0.015 0.050 0.341 4 0.25 NC 1.89 0.020 0.050 0.300 5 0.10 NC 1.65 0.020 0.084 0.200 6 0.25 NC 1.87 0.020 0.067 0.200
FEMA 273 ≤ 0.1 NC 4 ≥ 1.5 0.005 0.010 0.200 1 ratio of the axial column load to the cross-sectional area of the joint and concrete compressive strength 2 ratio of the design shear force to the shear strength for the joint: Vn is calculated using Equation 6-4 in FEMA 273 Section 5.5.2.3 3 nonconforming details; no hoops within the joint 4 nonconforming details; see Table 6-8 footnote 1 of FEMA 273
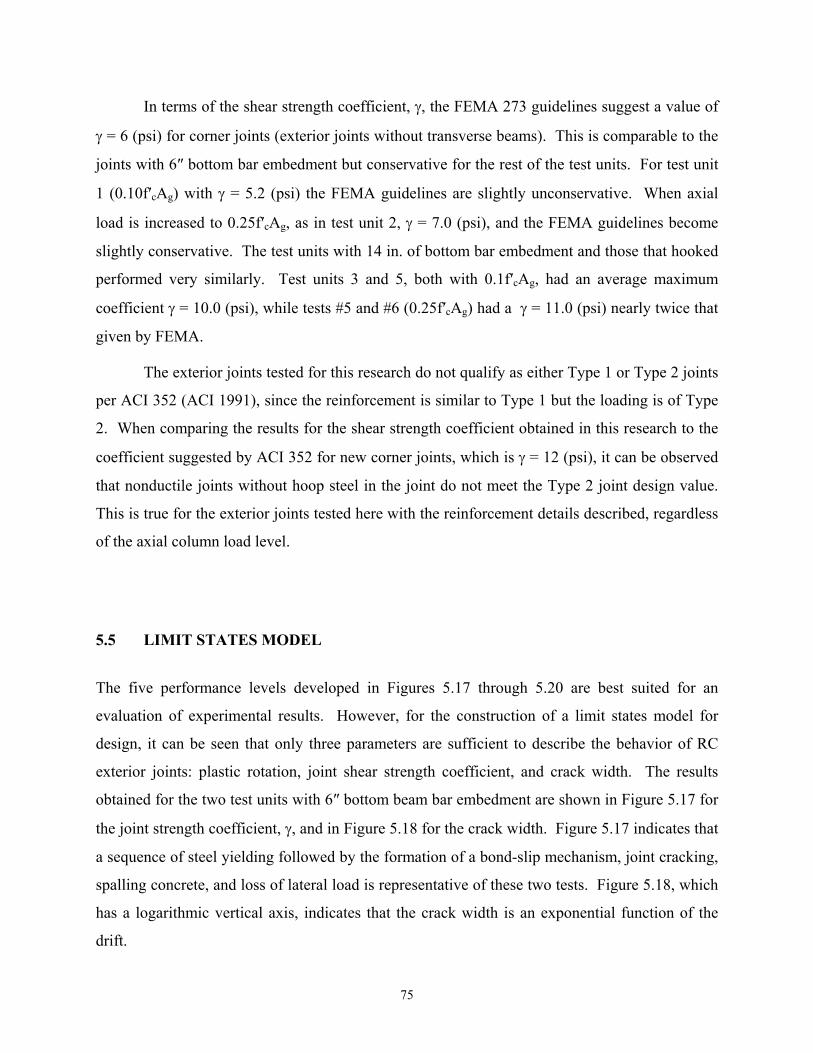
75
In terms of the shear strength coefficient, γ, the FEMA 273 guidelines suggest a value of
γ = 6 (psi) for corner joints (exterior joints without transverse beams). This is comparable to the
joints with 6″ bottom bar embedment but conservative for the rest of the test units. For test unit
1 (0.10f′cAg) with γ = 5.2 (psi) the FEMA guidelines are slightly unconservative. When axial
load is increased to 0.25f′cAg, as in test unit 2, γ = 7.0 (psi), and the FEMA guidelines become
slightly conservative. The test units with 14 in. of bottom bar embedment and those that hooked
performed very similarly. Test units 3 and 5, both with 0.1f′cAg, had an average maximum
coefficient γ = 10.0 (psi), while tests #5 and #6 (0.25f′cAg) had a γ = 11.0 (psi) nearly twice that
given by FEMA.
The exterior joints tested for this research do not qualify as either Type 1 or Type 2 joints
per ACI 352 (ACI 1991), since the reinforcement is similar to Type 1 but the loading is of Type
2. When comparing the results for the shear strength coefficient obtained in this research to the
coefficient suggested by ACI 352 for new corner joints, which is γ = 12 (psi), it can be observed
that nonductile joints without hoop steel in the joint do not meet the Type 2 joint design value.
This is true for the exterior joints tested here with the reinforcement details described, regardless
of the axial column load level.
5.5 LIMIT STATES MODEL
The five performance levels developed in Figures 5.17 through 5.20 are best suited for an
evaluation of experimental results. However, for the construction of a limit states model for
design, it can be seen that only three parameters are sufficient to describe the behavior of RC
exterior joints: plastic rotation, joint shear strength coefficient, and crack width. The results
obtained for the two test units with 6″ bottom beam bar embedment are shown in Figure 5.17 for
the joint strength coefficient, γ, and in Figure 5.18 for the crack width. Figure 5.17 indicates that
a sequence of steel yielding followed by the formation of a bond-slip mechanism, joint cracking,
spalling concrete, and loss of lateral load is representative of these two tests. Figure 5.18, which
has a logarithmic vertical axis, indicates that the crack width is an exponential function of the
drift.
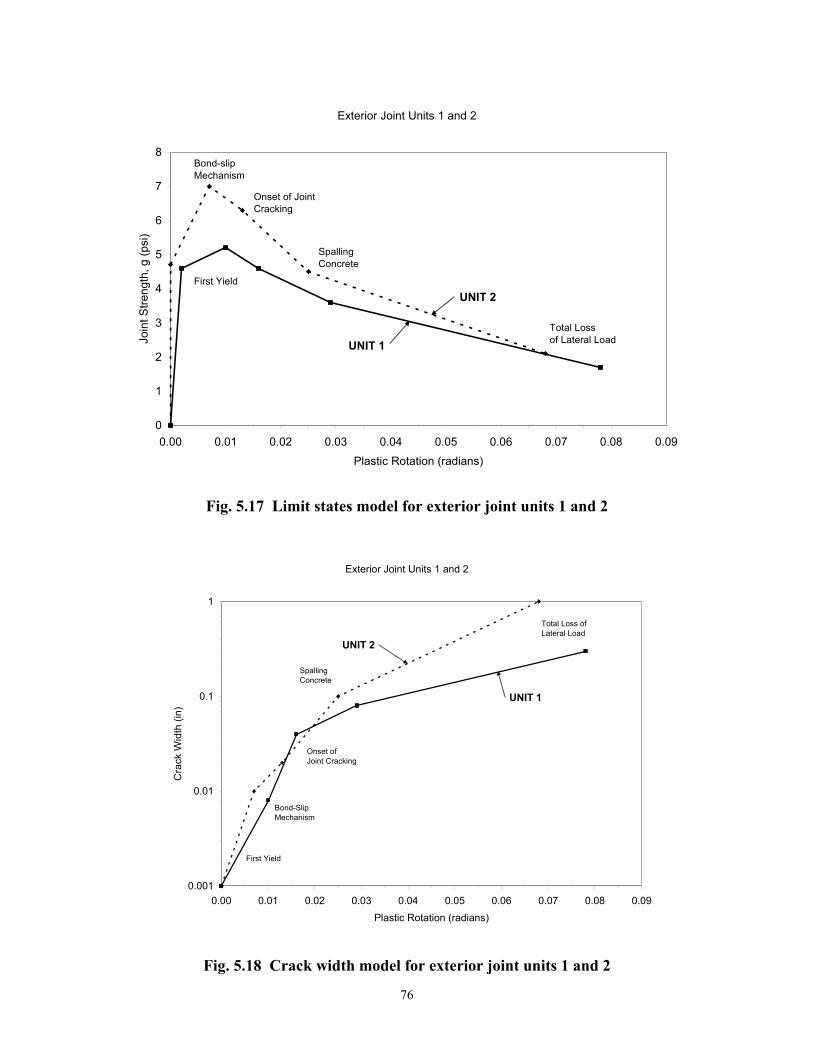
76
Exterior Joint Units 1 and 2
0
1
2
3
4
5
6
7
8
0.00 0.01 0.02 0.03 0.04 0.05 0.06 0.07 0.08 0.09Plastic Rotation (radians)
Join
t Stre
ngth
, g (p
si)
UNIT 1
UNIT 2First Yield
Bond-slipMechanism
Onset of JointCracking
SpallingConcrete
Total Lossof Lateral Load
Fig. 5.17 Limit states model for exterior joint units 1 and 2
Exterior Joint Units 1 and 2
0.001
0.01
0.1
1
0.00 0.01 0.02 0.03 0.04 0.05 0.06 0.07 0.08 0.09Plastic Rotation (radians)
Cra
ck W
idth
(in)
UNIT 1
UNIT 2
First Yield
Bond-SlipMechanism
Onset ofJoint Cracking
SpallingConcrete
Total Loss of Lateral Load
Fig. 5.18 Crack width model for exterior joint units 1 and 2
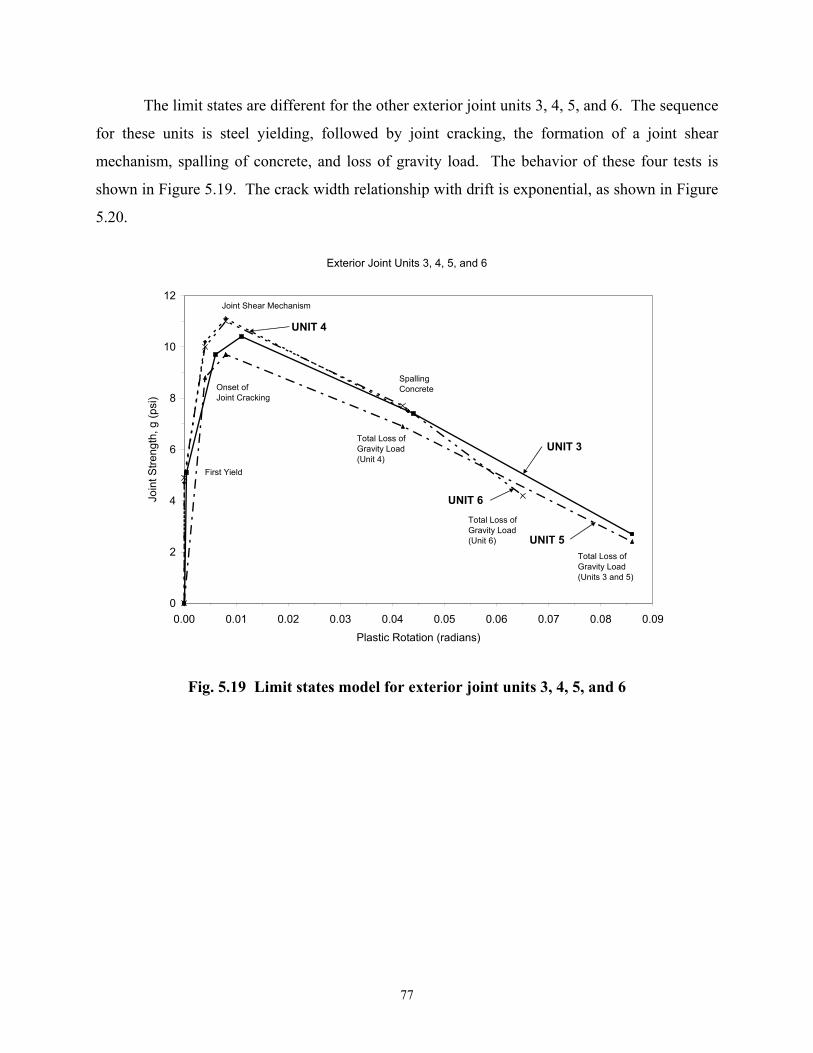
77
The limit states are different for the other exterior joint units 3, 4, 5, and 6. The sequence
for these units is steel yielding, followed by joint cracking, the formation of a joint shear
mechanism, spalling of concrete, and loss of gravity load. The behavior of these four tests is
shown in Figure 5.19. The crack width relationship with drift is exponential, as shown in Figure
5.20.
Exterior Joint Units 3, 4, 5, and 6
0
2
4
6
8
10
12
0.00 0.01 0.02 0.03 0.04 0.05 0.06 0.07 0.08 0.09Plastic Rotation (radians)
Join
t Stre
ngth
, g (p
si)
UNIT 3
UNIT 5
UNIT 4
First Yield
Total Loss ofGravity Load(Units 3 and 5)
SpallingConcrete
Total Loss ofGravity Load(Unit 4)
Joint Shear Mechanism
Onset ofJoint Cracking
UNIT 6Total Loss of Gravity Load(Unit 6)
Fig. 5.19 Limit states model for exterior joint units 3, 4, 5, and 6
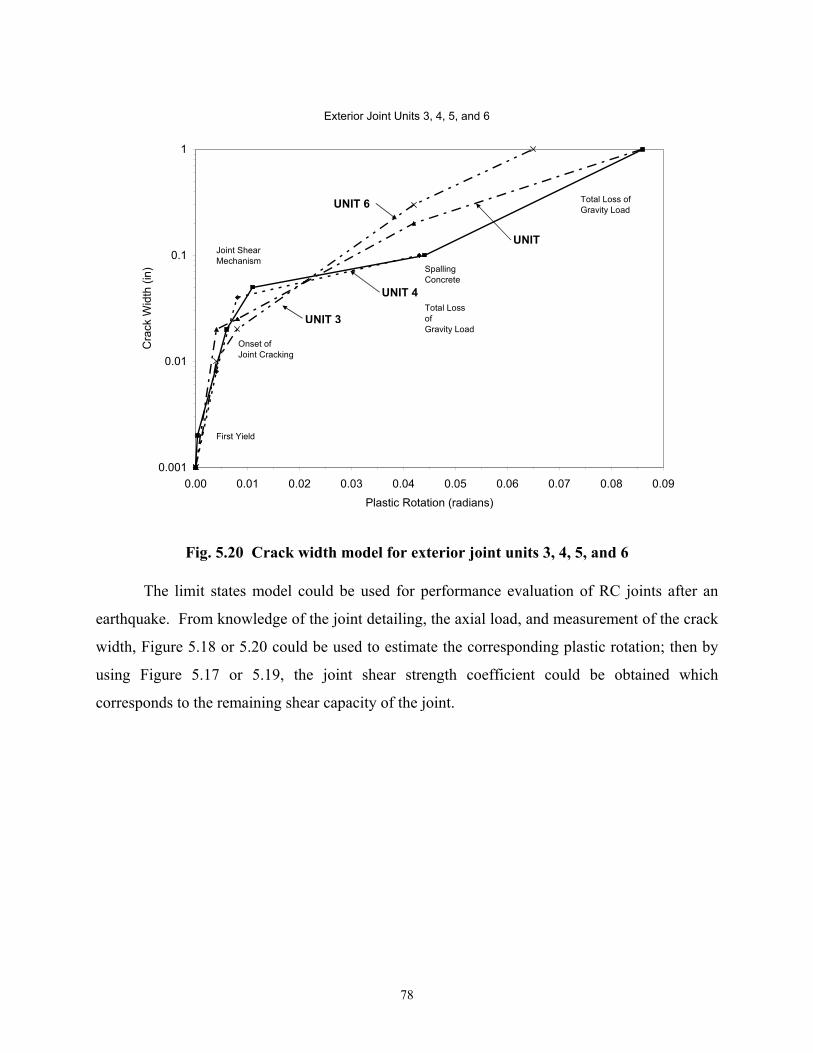
78
Exterior Joint Units 3, 4, 5, and 6
0.001
0.01
0.1
1
0.00 0.01 0.02 0.03 0.04 0.05 0.06 0.07 0.08 0.09Plastic Rotation (radians)
Cra
ck W
idth
(in)
UNIT 3
UNIT 4
UNIT 6
First Yield
Onset ofJoint Cracking
SpallingConcrete
Total Loss of Gravity Load
Joint ShearMechanism
UNIT
Total Loss ofGravity Load
Fig. 5.20 Crack width model for exterior joint units 3, 4, 5, and 6
The limit states model could be used for performance evaluation of RC joints after an
earthquake. From knowledge of the joint detailing, the axial load, and measurement of the crack
width, Figure 5.18 or 5.20 could be used to estimate the corresponding plastic rotation; then by
using Figure 5.17 or 5.19, the joint shear strength coefficient could be obtained which
corresponds to the remaining shear capacity of the joint.
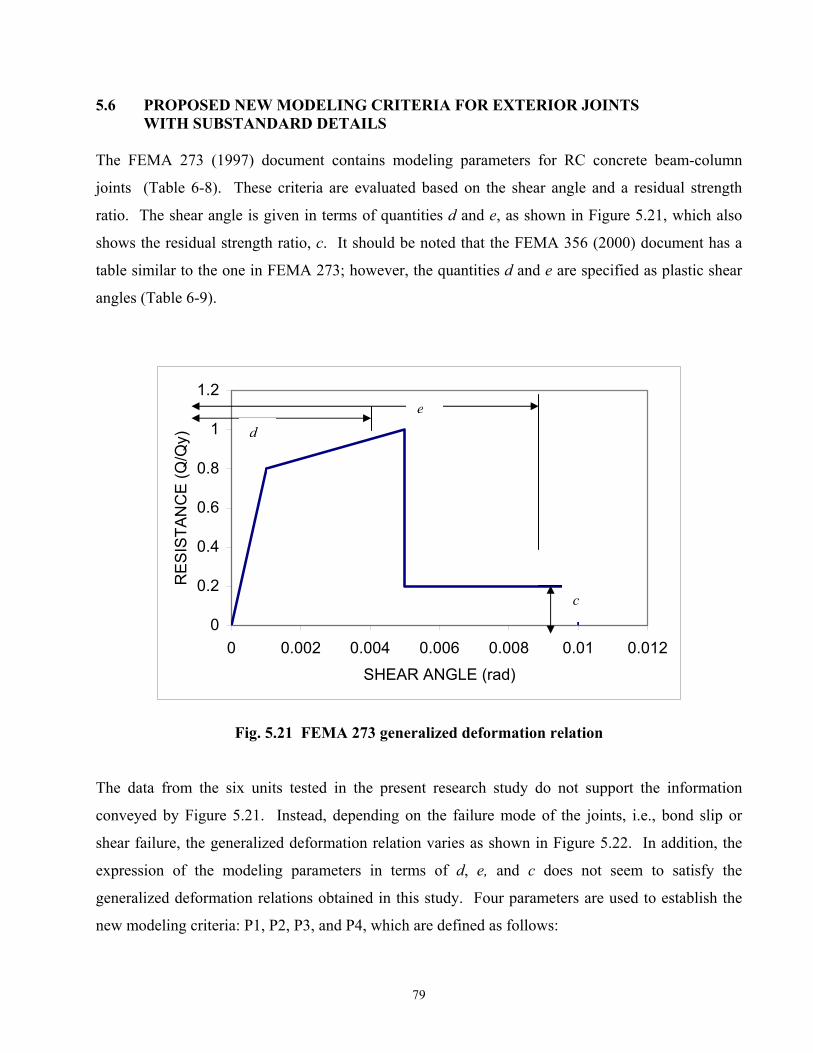
79
5.6 PROPOSED NEW MODELING CRITERIA FOR EXTERIOR JOINTS WITH SUBSTANDARD DETAILS
The FEMA 273 (1997) document contains modeling parameters for RC concrete beam-column
joints (Table 6-8). These criteria are evaluated based on the shear angle and a residual strength
ratio. The shear angle is given in terms of quantities d and e, as shown in Figure 5.21, which also
shows the residual strength ratio, c. It should be noted that the FEMA 356 (2000) document has a
table similar to the one in FEMA 273; however, the quantities d and e are specified as plastic shear
angles (Table 6-9).
0
0.2
0.4
0.6
0.8
1
1.2
0 0.002 0.004 0.006 0.008 0.01 0.012SHEAR ANGLE (rad)
RES
ISTA
NC
E (Q
/Qy)
Fig. 5.21 FEMA 273 generalized deformation relation The data from the six units tested in the present research study do not support the information
conveyed by Figure 5.21. Instead, depending on the failure mode of the joints, i.e., bond slip or
shear failure, the generalized deformation relation varies as shown in Figure 5.22. In addition, the
expression of the modeling parameters in terms of d, e, and c does not seem to satisfy the
generalized deformation relations obtained in this study. Four parameters are used to establish the
new modeling criteria: P1, P2, P3, and P4, which are defined as follows:
de
c
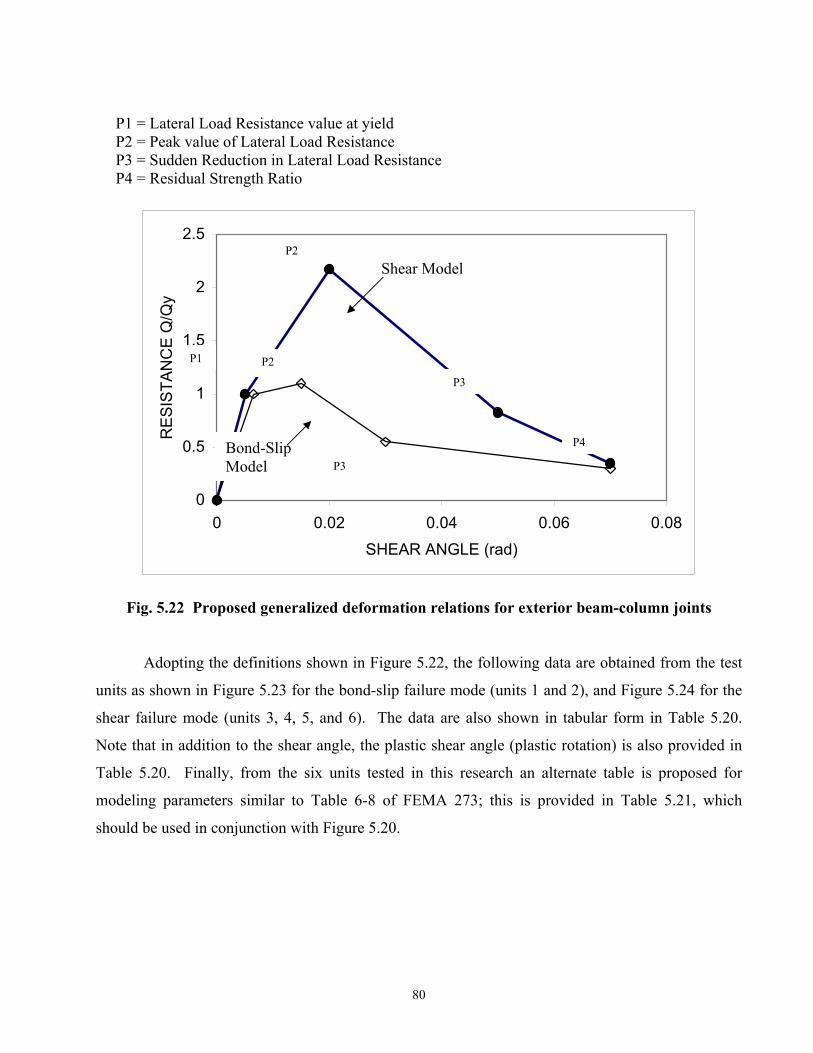
80
P1 = Lateral Load Resistance value at yield P2 = Peak value of Lateral Load Resistance P3 = Sudden Reduction in Lateral Load Resistance P4 = Residual Strength Ratio
0
0.5
1
1.5
2
2.5
0 0.02 0.04 0.06 0.08SHEAR ANGLE (rad)
RES
ISTA
NC
E Q
/Qy
Fig. 5.22 Proposed generalized deformation relations for exterior beam-column joints
Adopting the definitions shown in Figure 5.22, the following data are obtained from the test
units as shown in Figure 5.23 for the bond-slip failure mode (units 1 and 2), and Figure 5.24 for the
shear failure mode (units 3, 4, 5, and 6). The data are also shown in tabular form in Table 5.20.
Note that in addition to the shear angle, the plastic shear angle (plastic rotation) is also provided in
Table 5.20. Finally, from the six units tested in this research an alternate table is proposed for
modeling parameters similar to Table 6-8 of FEMA 273; this is provided in Table 5.21, which
should be used in conjunction with Figure 5.20.
P1
P2
P2
P3
P3
P4 Bond-Slip Model
Shear Model
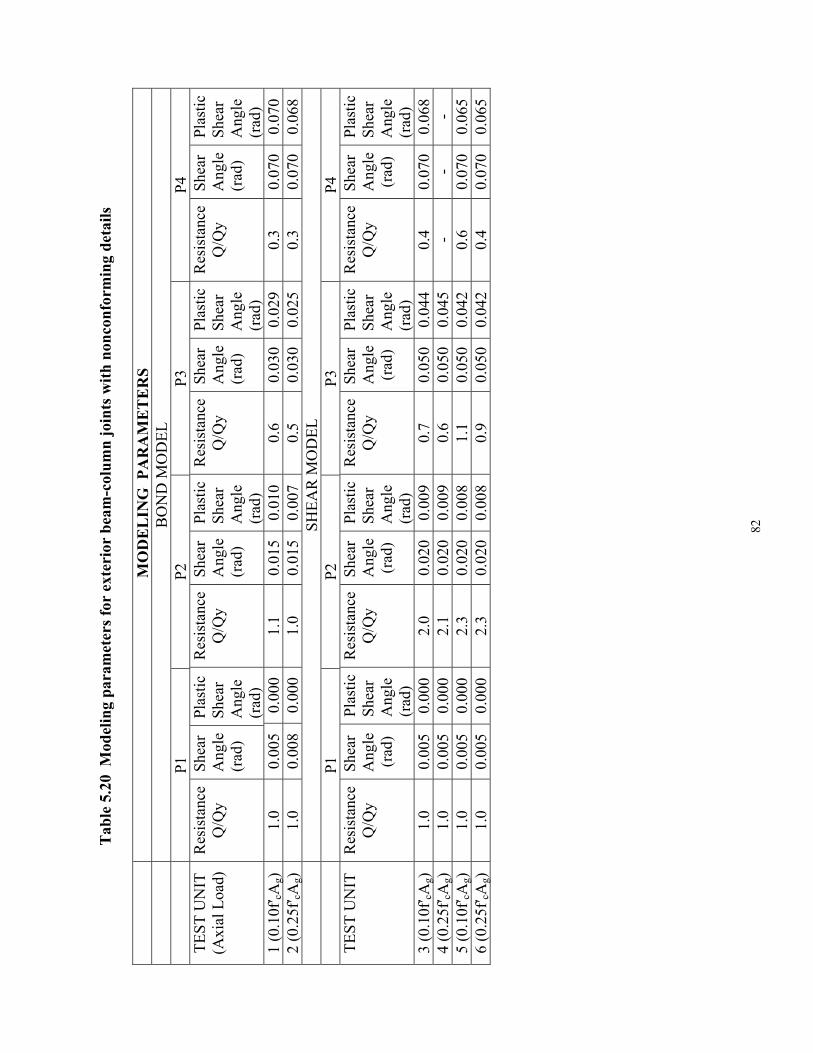
82
Tab
le 5
.20
Mod
elin
g pa
ram
eter
s for
ext
erio
r be
am-c
olum
n jo
ints
with
non
conf
orm
ing
deta
ils
MO
DE
LIN
G P
AR
AM
ET
ER
S
BO
ND
MO
DEL
P1
P2
P3
P4
TEST
UN
IT
(Axi
al L
oad)
R
esis
tanc
e Q
/Qy
Shea
r A
ngle
(r
ad)
Plas
tic
Shea
r A
ngle
(r
ad)
Res
ista
nce
Q/Q
y Sh
ear
Ang
le(r
ad)
Plas
ticSh
ear
Ang
le
(rad
)
Res
ista
nce
Q/Q
y Sh
ear
Ang
le(r
ad)
Plas
ticSh
ear
Ang
le
(rad
)
Res
ista
nce
Q/Q
y Sh
ear
Ang
le(r
ad)
Plas
ticSh
ear
Ang
le
(rad
) 1
(0.1
0f′ cA
g)
1.0
0.00
5 0.
000
1.1
0.01
5 0.
010
0.6
0.03
0 0.
029
0.3
0.07
0 0.
070
2 (0
.25f′ cA
g)
1.0
0.00
8 0.
000
1.0
0.01
5 0.
007
0.5
0.03
0 0.
025
0.3
0.07
0 0.
068
SH
EAR
MO
DEL
P1
P2
P3
P4
TEST
UN
IT
Res
ista
nce
Q/Q
y Sh
ear
Ang
le
(rad
)
Plas
ticSh
ear
Ang
le
(rad
)
Res
ista
nce
Q/Q
y Sh
ear
Ang
le(r
ad)
Plas
ticSh
ear
Ang
le
(rad
)
Res
ista
nce
Q/Q
y Sh
ear
Ang
le(r
ad)
Plas
ticSh
ear
Ang
le
(rad
)
Res
ista
nce
Q/Q
y Sh
ear
Ang
le(r
ad)
Plas
ticSh
ear
Ang
le
(rad
) 3
(0.1
0f′ cA
g)
1.0
0.00
5 0.
000
2.0
0.02
0 0.
009
0.7
0.05
0 0.
044
0.4
0.07
0 0.
068
4 (0
.25f′ cA
g)
1.0
0.00
5 0.
000
2.1
0.02
0 0.
009
0.6
0.05
0 0.
045
- -
- 5
(0.1
0f′ cA
g)
1.0
0.00
5 0.
000
2.3
0.02
0 0.
008
1.1
0.05
0 0.
042
0.6
0.07
0 0.
065
6 (0
.25f′ cA
g)
1.0
0.00
5 0.
000
2.3
0.02
0 0.
008
0.9
0.05
0 0.
042
0.4
0.07
0 0.
065
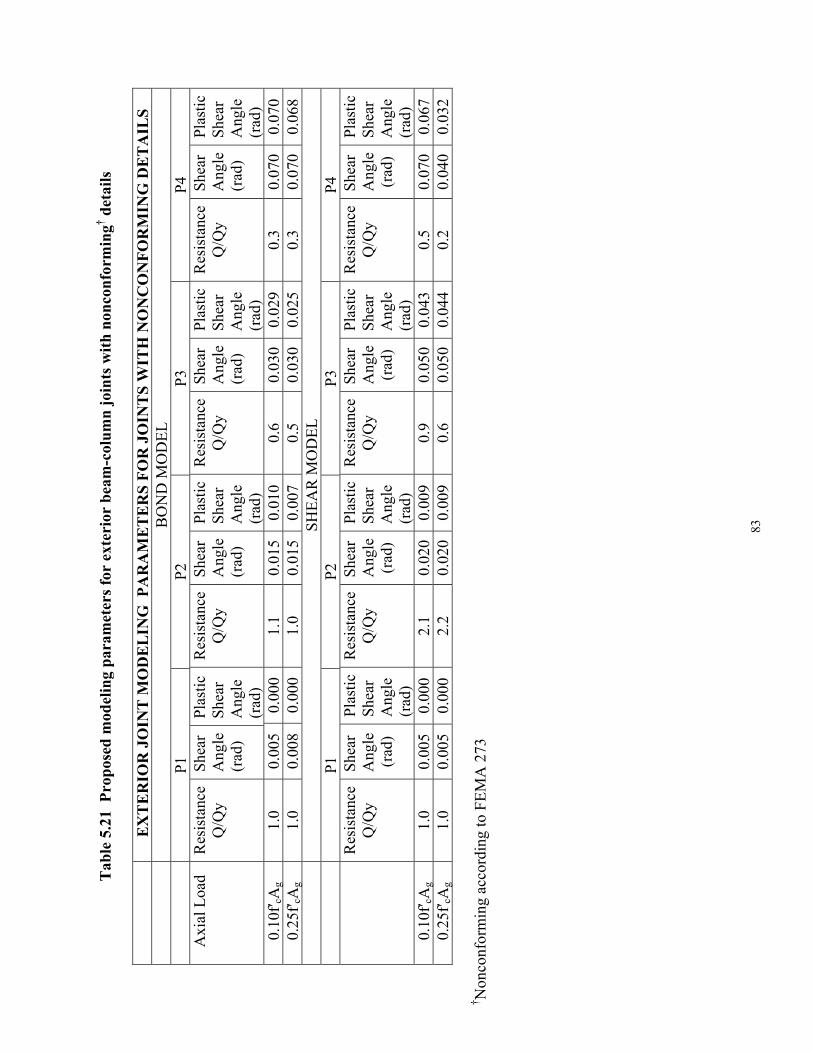
83
Tab
le 5
.21
Pro
pose
d m
odel
ing
para
met
ers f
or e
xter
ior
beam
-col
umn
join
ts w
ith n
onco
nfor
min
g† det
ails
E
XT
ER
IOR
JO
INT
MO
DE
LIN
G P
AR
AM
ET
ER
S FO
R J
OIN
TS
WIT
H N
ON
CO
NFO
RM
ING
DE
TA
ILS
B
ON
D M
OD
EL
P1
P2
P3
P4
A
xial
Loa
d R
esis
tanc
e Q
/Qy
Shea
r A
ngle
(r
ad)
Plas
tic
Shea
r A
ngle
(r
ad)
Res
ista
nce
Q/Q
y Sh
ear
Ang
le(r
ad)
Plas
ticSh
ear
Ang
le
(rad
)
Res
ista
nce
Q/Q
y Sh
ear
Ang
le(r
ad)
Plas
ticSh
ear
Ang
le
(rad
)
Res
ista
nce
Q/Q
y Sh
ear
Ang
le(r
ad)
Plas
ticSh
ear
Ang
le
(rad
) 0
.10f′ cA
g 1.
0 0.
005
0.00
0 1.
1 0.
015
0.01
0 0.
6 0.
030
0.02
9 0.
3 0.
070
0.07
0 0
.25f′ cA
g 1.
0 0.
008
0.00
0 1.
0 0.
015
0.00
7 0.
5 0.
030
0.02
5 0.
3 0.
070
0.06
8
SHEA
R M
OD
EL
P1
P2
P3
P4
Res
ista
nce
Q/Q
y Sh
ear
Ang
le
(rad
)
Plas
ticSh
ear
Ang
le
(rad
)
Res
ista
nce
Q/Q
y Sh
ear
Ang
le(r
ad)
Plas
ticSh
ear
Ang
le
(rad
)
Res
ista
nce
Q/Q
y Sh
ear
Ang
le(r
ad)
Plas
ticSh
ear
Ang
le
(rad
)
Res
ista
nce
Q/Q
y Sh
ear
Ang
le(r
ad)
Plas
ticSh
ear
Ang
le
(rad
) 0
.10f′ cA
g 1.
0 0.
005
0.00
0 2.
1 0.
020
0.00
9 0.
9 0.
050
0.04
3 0.
5 0.
070
0.06
7 0
.25f′ cA
g 1.
0 0.
005
0.00
0 2.
2 0.
020
0.00
9 0.
6 0.
050
0.04
4 0.
2 0.
040
0.03
2 † N
onco
nfor
min
g ac
cord
ing
to F
EMA
273
6 Strut-and-Tie-Model
Over the past few decades the design of concrete structures has changed dramatically.
Improvements to codes were implemented for the design of concrete structures based on
extensive testing, including the effects of seismic loading. The design of concrete structures in
the 1960s did not consider these effects in the details that are currently required by codes. One
big difference in the 1960s’ design is the absence of steel hoops in the beam-column
connections. Several types of buildings were built with no steel hoops through the joint in this
era, and with various vertical and horizontal reinforcement details through the joint. It is now
important to re-evaluate these buildings to determine their adequacy in a seismic event.
The design of RC joints is very difficult to model using traditional stress-strain
relationships, or even using finite element analysis techniques. However, strut-and-tie models, a
relatively new design method, may provide a much more accurate model of the joint. Recently,
several strut-and-tie models have been developed for various types of beam-column concrete
joints (Ali and White 2001, Lowes and Moehle 1999, Hwang and Lee 1999). These models have
been developed for joints designed to meet current codes, which consider the benefit of steel
hoops in the joint; thus they are not suitable for the evaluation of existing joints with substandard
reinforcement details. In these cases, there is a need for a somewhat different strut-and-tie model
to be developed. The strut-and-tie model developed here is verified by the experimental results
obtained in the present study.
6.1 OBJECTIVE
The purpose of this chapter is to develop a strut-and-tie model for one of the beam-column joints
tested in the present research. Six beam-column joints with three different reinforcement details
based on 1960’s construction were tested. Each of the three different joint types was tested at
levels of 10% and 25% of the axial load capacity of the column section. A strut-and-tie model
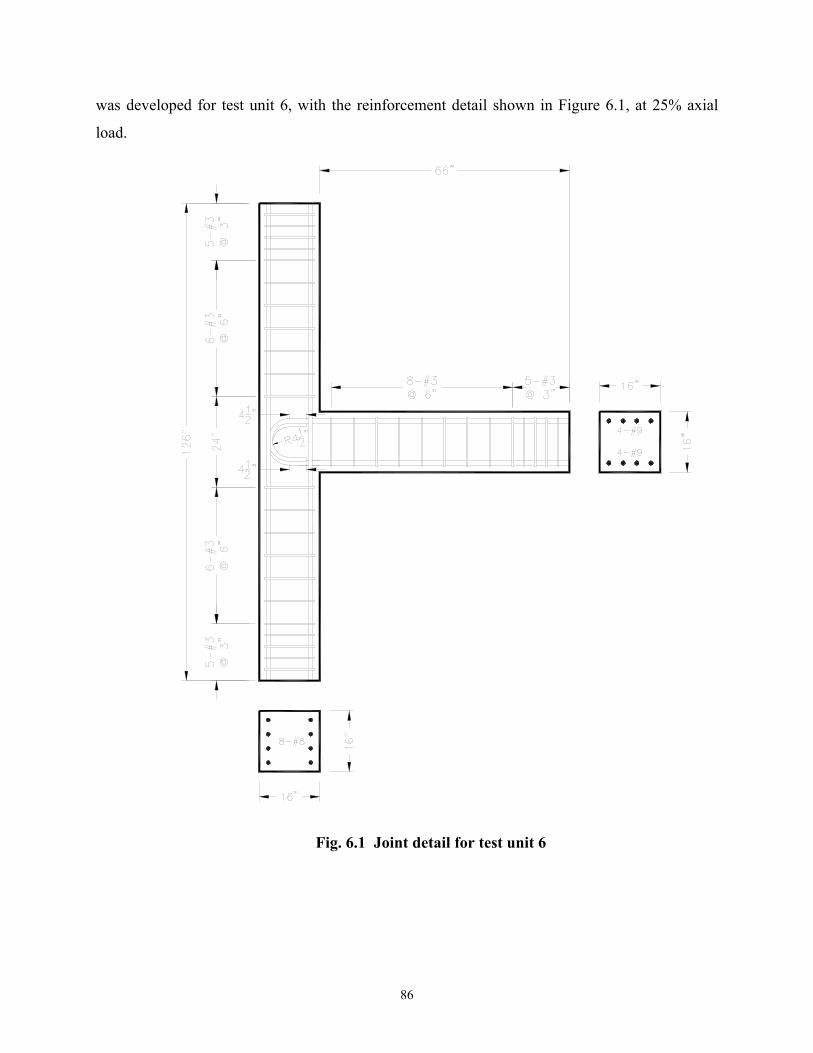
86
was developed for test unit 6, with the reinforcement detail shown in Figure 6.1, at 25% axial
load.
Fig. 6.1 Joint detail for test unit 6
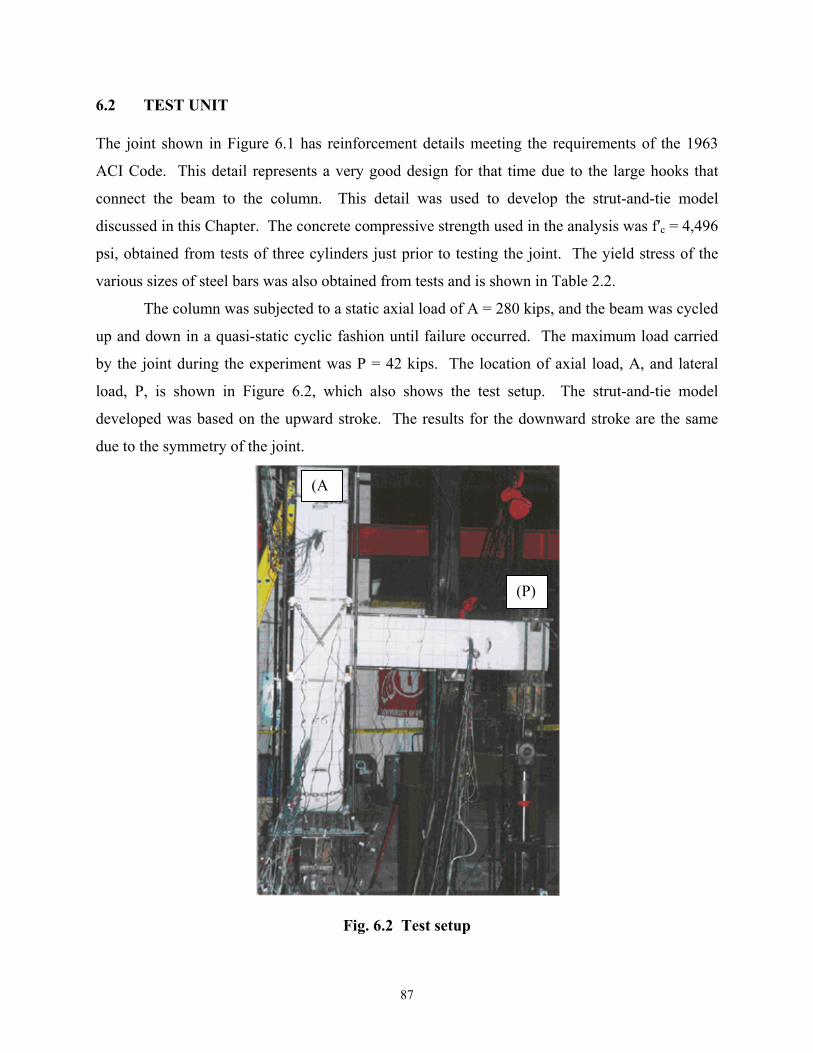
87
6.2 TEST UNIT
The joint shown in Figure 6.1 has reinforcement details meeting the requirements of the 1963
ACI Code. This detail represents a very good design for that time due to the large hooks that
connect the beam to the column. This detail was used to develop the strut-and-tie model
discussed in this Chapter. The concrete compressive strength used in the analysis was f′c = 4,496
psi, obtained from tests of three cylinders just prior to testing the joint. The yield stress of the
various sizes of steel bars was also obtained from tests and is shown in Table 2.2.
The column was subjected to a static axial load of A = 280 kips, and the beam was cycled
up and down in a quasi-static cyclic fashion until failure occurred. The maximum load carried
by the joint during the experiment was P = 42 kips. The location of axial load, A, and lateral
load, P, is shown in Figure 6.2, which also shows the test setup. The strut-and-tie model
developed was based on the upward stroke. The results for the downward stroke are the same
due to the symmetry of the joint.
Fig. 6.2 Test setup
(P)
(A
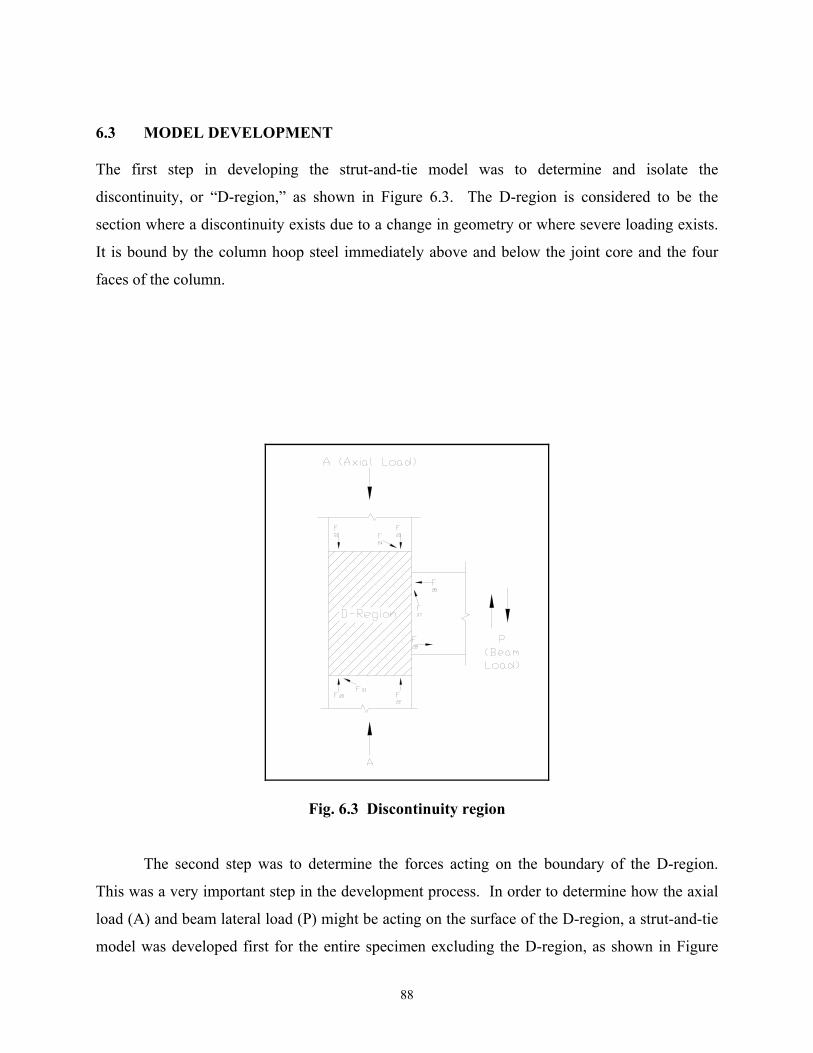
88
6.3 MODEL DEVELOPMENT The first step in developing the strut-and-tie model was to determine and isolate the
discontinuity, or “D-region,” as shown in Figure 6.3. The D-region is considered to be the
section where a discontinuity exists due to a change in geometry or where severe loading exists.
It is bound by the column hoop steel immediately above and below the joint core and the four
faces of the column.
Fig. 6.3 Discontinuity region
The second step was to determine the forces acting on the boundary of the D-region.
This was a very important step in the development process. In order to determine how the axial
load (A) and beam lateral load (P) might be acting on the surface of the D-region, a strut-and-tie
model was developed first for the entire specimen excluding the D-region, as shown in Figure
P

89
6.4. This model was simple to develop due to the continuity of stresses outside the D-region. It
also gave a good idea of how the loads (A) and (P) were acting on the D-region, as shown in
Figure 6.3. Once the boundary conditions were defined, that is the forces acting on the boundary
of the D-Region in terms of (A) and (P), the truss for the strut-and-tie model of the joint could
be drawn.
A+P
A
.429 P
D-Region
.429 P
StrutsTies
P
Fig. 6.4 Truss model
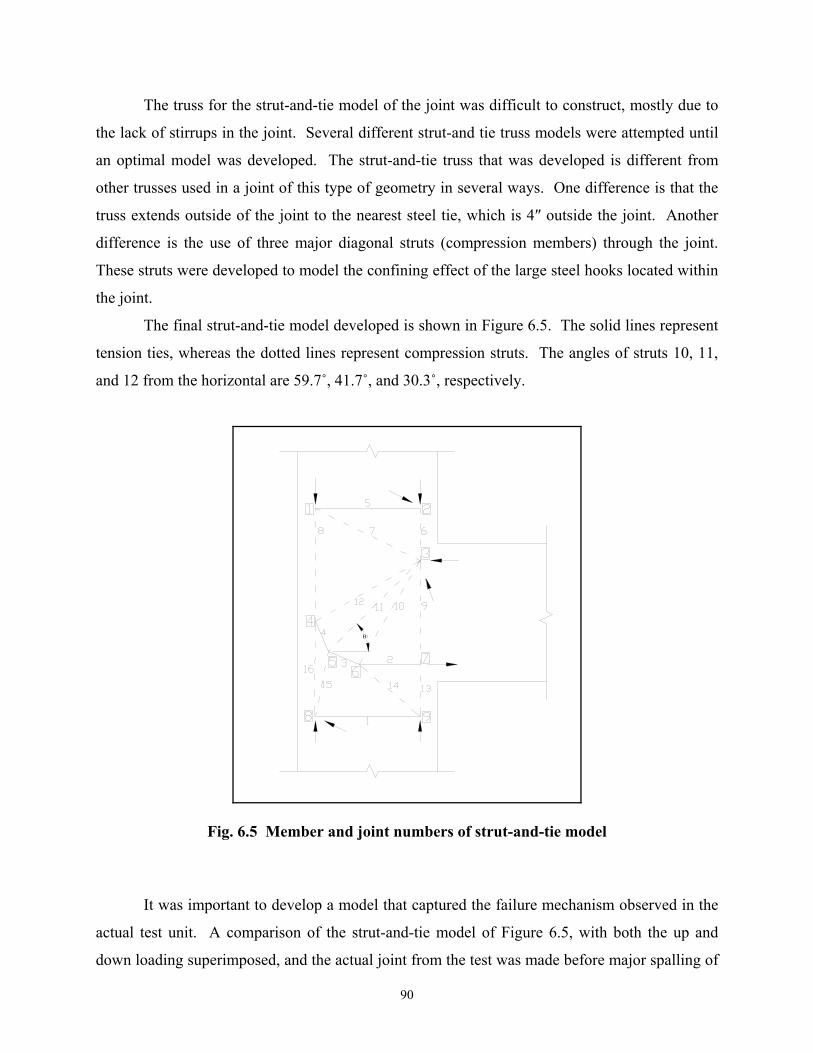
90
The truss for the strut-and-tie model of the joint was difficult to construct, mostly due to
the lack of stirrups in the joint. Several different strut-and tie truss models were attempted until
an optimal model was developed. The strut-and-tie truss that was developed is different from
other trusses used in a joint of this type of geometry in several ways. One difference is that the
truss extends outside of the joint to the nearest steel tie, which is 4″ outside the joint. Another
difference is the use of three major diagonal struts (compression members) through the joint.
These struts were developed to model the confining effect of the large steel hooks located within
the joint.
The final strut-and-tie model developed is shown in Figure 6.5. The solid lines represent
tension ties, whereas the dotted lines represent compression struts. The angles of struts 10, 11,
and 12 from the horizontal are 59.7˚, 41.7˚, and 30.3˚, respectively.
θ2
Fig. 6.5 Member and joint numbers of strut-and-tie model
It was important to develop a model that captured the failure mechanism observed in the
actual test unit. A comparison of the strut-and-tie model of Figure 6.5, with both the up and
down loading superimposed, and the actual joint from the test was made before major spalling of
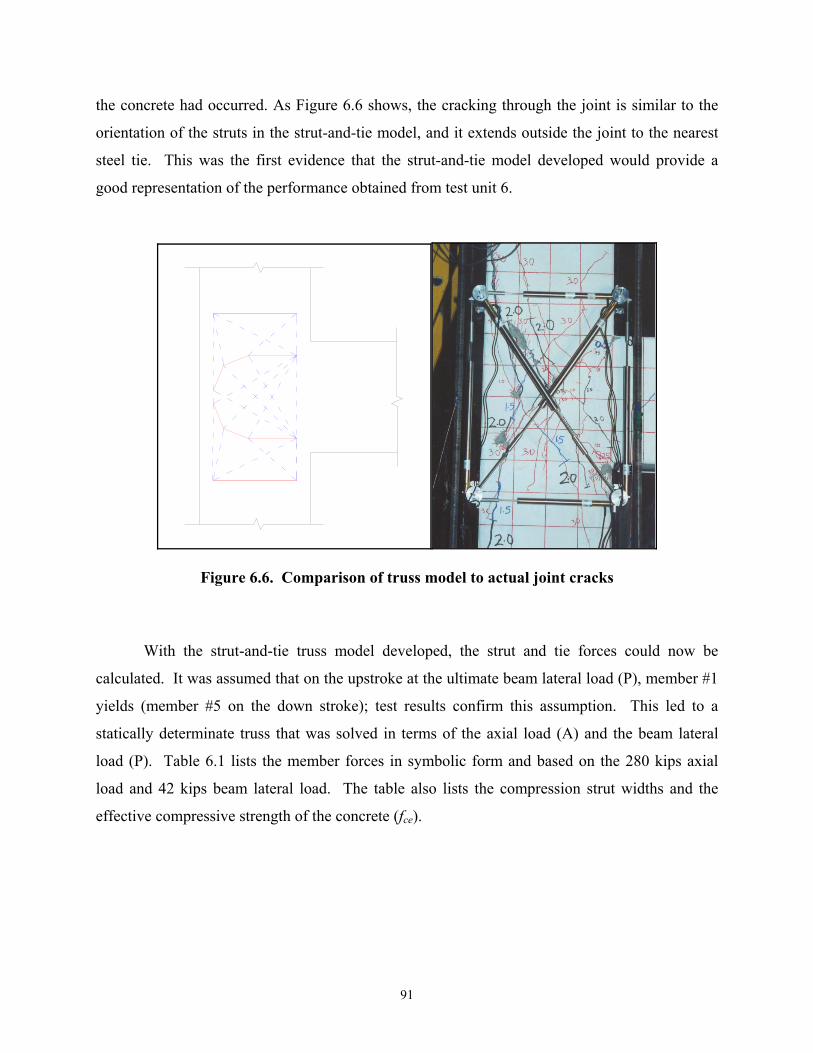
91
the concrete had occurred. As Figure 6.6 shows, the cracking through the joint is similar to the
orientation of the struts in the strut-and-tie model, and it extends outside the joint to the nearest
steel tie. This was the first evidence that the strut-and-tie model developed would provide a
good representation of the performance obtained from test unit 6.
Figure 6.6. Comparison of truss model to actual joint cracks
With the strut-and-tie truss model developed, the strut and tie forces could now be
calculated. It was assumed that on the upstroke at the ultimate beam lateral load (P), member #1
yields (member #5 on the down stroke); test results confirm this assumption. This led to a
statically determinate truss that was solved in terms of the axial load (A) and the beam lateral
load (P). Table 6.1 lists the member forces in symbolic form and based on the 280 kips axial
load and 42 kips beam lateral load. The table also lists the compression strut widths and the
effective compressive strength of the concrete (fce).
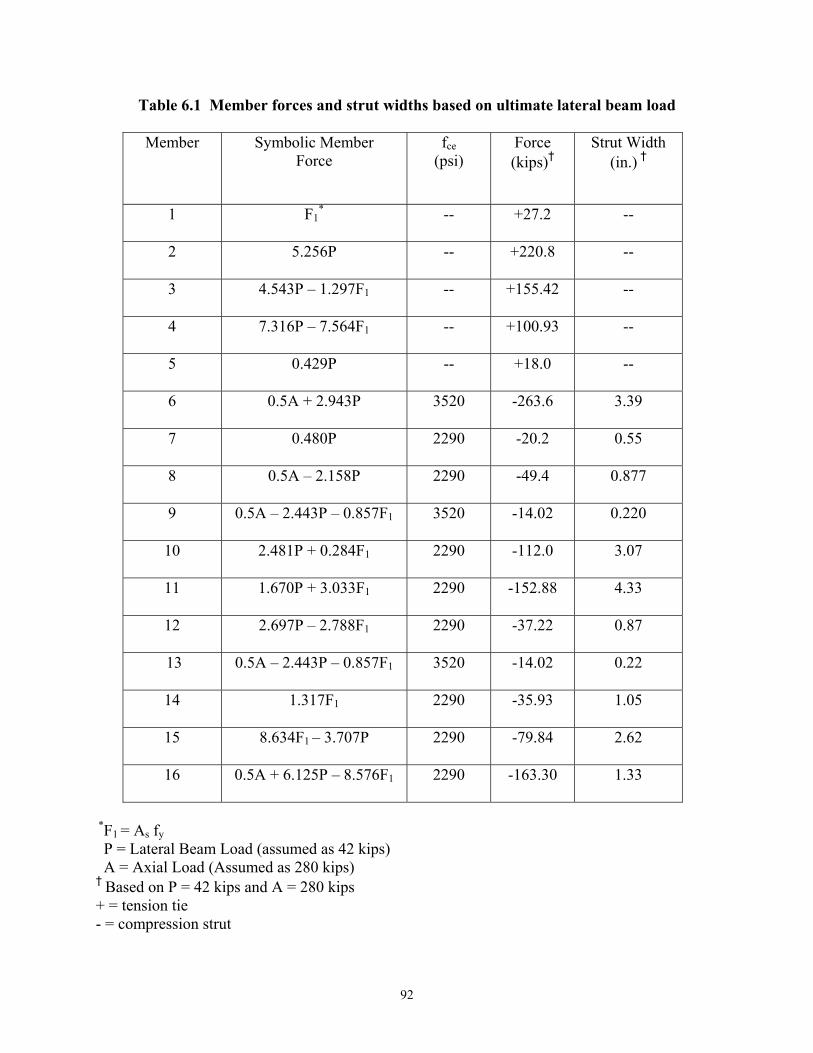
92
Table 6.1 Member forces and strut widths based on ultimate lateral beam load
Member Symbolic Member Force
fce (psi)
Force (kips)†
Strut Width (in.) †
1 F1* -- +27.2 --
2 5.256P -- +220.8 --
3 4.543P – 1.297F1 -- +155.42 --
4 7.316P – 7.564F1 -- +100.93 --
5 0.429P -- +18.0 --
6 0.5A + 2.943P 3520 -263.6 3.39
7 0.480P 2290 -20.2 0.55
8 0.5A – 2.158P 2290 -49.4 0.877
9 0.5A – 2.443P – 0.857F1 3520 -14.02 0.220
10 2.481P + 0.284F1 2290 -112.0 3.07
11 1.670P + 3.033F1 2290 -152.88 4.33
12 2.697P – 2.788F1 2290 -37.22 0.87
13 0.5A – 2.443P – 0.857F1 3520 -14.02 0.22
14 1.317F1 2290 -35.93 1.05
15 8.634F1 – 3.707P 2290 -79.84 2.62
16 0.5A + 6.125P – 8.576F1 2290 -163.30 1.33
*F1 = As fy P = Lateral Beam Load (assumed as 42 kips) A = Axial Load (Assumed as 280 kips) † Based on P = 42 kips and A = 280 kips + = tension tie - = compression strut
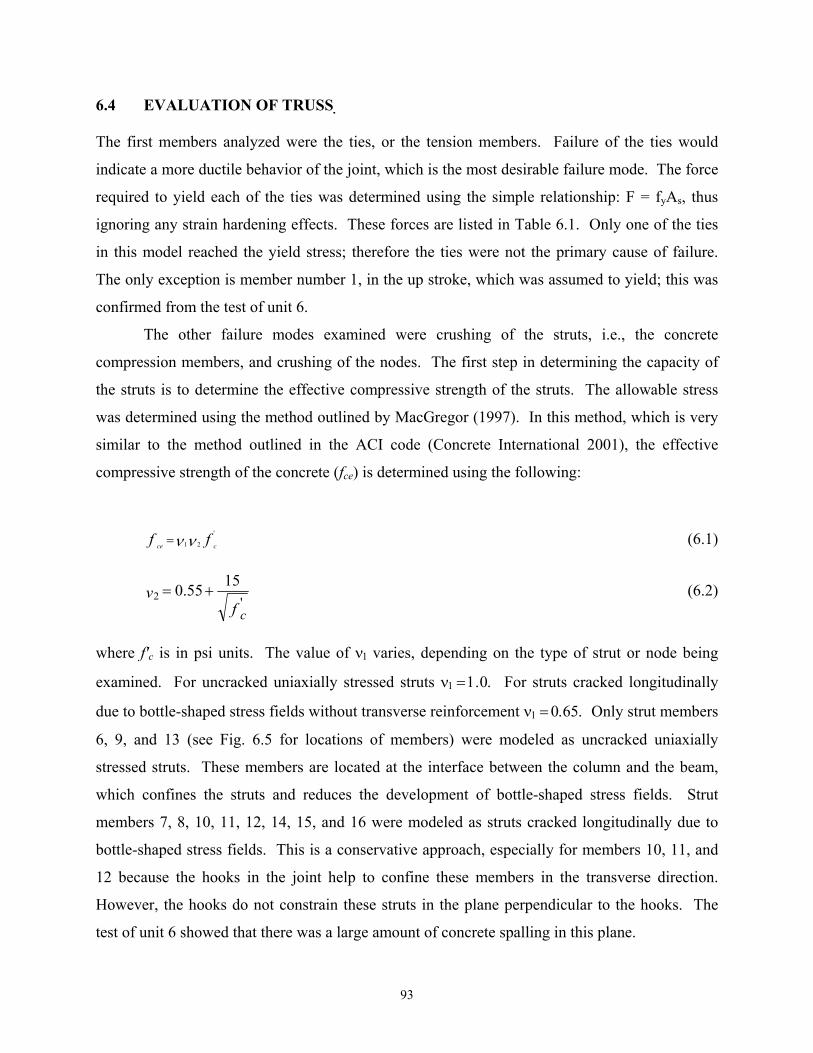
93
6.4 EVALUATION OF TRUSS The first members analyzed were the ties, or the tension members. Failure of the ties would
indicate a more ductile behavior of the joint, which is the most desirable failure mode. The force
required to yield each of the ties was determined using the simple relationship: F = fyAs, thus
ignoring any strain hardening effects. These forces are listed in Table 6.1. Only one of the ties
in this model reached the yield stress; therefore the ties were not the primary cause of failure.
The only exception is member number 1, in the up stroke, which was assumed to yield; this was
confirmed from the test of unit 6.
The other failure modes examined were crushing of the struts, i.e., the concrete
compression members, and crushing of the nodes. The first step in determining the capacity of
the struts is to determine the effective compressive strength of the struts. The allowable stress
was determined using the method outlined by MacGregor (1997). In this method, which is very
similar to the method outlined in the ACI code (Concrete International 2001), the effective
compressive strength of the concrete (fce) is determined using the following:
ff cce '
21νν= (6.1)
f
νc'
1555.02 += (6.2)
where f′c is in psi units. The value of ν1 varies, depending on the type of strut or node being
examined. For uncracked uniaxially stressed struts ν1 = 1.0. For struts cracked longitudinally
due to bottle-shaped stress fields without transverse reinforcement ν1 = 0.65. Only strut members
6, 9, and 13 (see Fig. 6.5 for locations of members) were modeled as uncracked uniaxially
stressed struts. These members are located at the interface between the column and the beam,
which confines the struts and reduces the development of bottle-shaped stress fields. Strut
members 7, 8, 10, 11, 12, 14, 15, and 16 were modeled as struts cracked longitudinally due to
bottle-shaped stress fields. This is a conservative approach, especially for members 10, 11, and
12 because the hooks in the joint help to confine these members in the transverse direction.
However, the hooks do not constrain these struts in the plane perpendicular to the hooks. The
test of unit 6 showed that there was a large amount of concrete spalling in this plane.
94
For the node calculations, ν1 = 1.0 for nodes with only compression struts (node 3 in Fig.
6.5), 0.85 for nodes with two or more struts and one tie (nodes 1, 2, 4, 8, and 9 in Fig. 6.5), and
0.75 for nodes with two or more ties (nodes 5, 6, and 7 in Fig. 6.5). Based on these values for
ν1 and the value of ν2 from equation (6.2), the effective compressive strength, (fce), of each node
and compression strut was calculated, as shown in Table 6.1.
Once the strut widths have been calculated, a detailed drawing of the model can be drawn
to determine the size of the nodes, and also areas of the joint where the struts fail due to
overlapping. As can be seen in Figure 6.7, compression struts 10, 11, and 12 overlap each other
when drawn to scale. The same overlapping can be seen between compression struts 15 and 16.
In these overlapping areas we know the effective concrete strength is exceeded and the concrete
will crush.
It can also be seen in Figure 6.7 that node 3 has the most critical loading on the diagonal
face, where the three diagonal compression struts (10, 11, and 12) come together. In order to
determine the stress on this node, the forces from compression struts 10 and 12 were resolved
into components parallel and perpendicular to strut 11. The forces acting on the diagonal face of
joint 3 were then calculated as the sum of the forces of the three diagonal members acting in the
direction of strut 11. The net force acting on the diagonal face of node 3 was determined to be
296 kips, which results in a stress of 4490 psi. The effective compression strength of this node is
3522 psi, based on equations (6.1) and (6.2), which clearly indicates that the node fails by
crushing of the concrete.
95
Fig. 6.7 Strut-and-tie model failure mode showing strut widths
Based on the initial analysis outlined in this paper the critical areas are nodes 3, 4, 5, and
6, and struts 10, 11, 12, 15, and 16. By using the experimental lateral load of 42 kips, it can be
observed from Figure 6.7 that struts 10, 11, and 12 overlap and that nodes 4, 5, and 6 also
overlap. It is therefore likely that crushing of the struts within the hooks caused failure.
The strut-and-tie model shown in Figure 6.7 is a good representation of the joint and
simulates the results for test unit 6 in a satisfactory manner. The failure zones shown in Figure
6.7 correlate well with the failure zones of the actual joint. It was also observed that massive
spalling of the concrete occurred within the hooks, and as much as 3 in. of concrete fell from the
joint within the area of the hooks on each side of the beam.
7 Conclusions
The present investigation is concerned with the assessment of RC building exterior joints with
substandard details. The six test units were full-scale models of typical exterior beam-column
joints in RC buildings built in the United States and other countries prior to 1970. The joint
details were substandard compared to current seismic codes in the following areas: (a) there was
no transverse reinforcement in the joints, (b) the beam depth to column bar ratio was less than
the recommended value, (c) the development length for the bottom beam bars was less than the
required length for four of the test units, and (d) column bars were present only on two faces of
the joint and were not distributed around the joint perimeter. However, all units satisfied the
requirement for column to beam flexural ratio, and the top beam reinforcement into the joint
satisfied bar anchorage requirements.
The research has shown that there are primarily two failure modes related to joints with
the substandard details described above: (a) a bond-slip failure mode, and (b) a joint shear failure
mode. Two of the units tested (units 1 and 2) exhibited a bond slip failure mode and the
remaining four units (units 3 to 6) exhibited a joint shear failure mode.
One of the findings of this study is that the joint strength coefficient, γ, changes with the
variation of the column compressive axial load. For unit 1 with a bond-slip failure mode and an
axial column load of 0.1f′cAg,the value of γ was 5.2 (psi); for unit 2 with an axial column load of
0.25f′cAg,the value of γ was 7.0 (psi), an increase of 35 percent. For units 3 and 5 with a joint
shear failure mode and an axial column load of 0.1f’cAg, the value of γ was 10.2 (psi) and 9.7
(psi) respectively; for units 4 and 6 with an axial column load of 0.25f′cAg,the value of γ was
11.7 (psi), and 11.0 (psi), respectively; this is an increase of 15 percent for the units with the
higher axial column load. The FEMA 273 (BSSC 1997) joint shear strength coefficient is given
as γ = 6 (psi) for existing exterior joints without transverse beams, which is seen to be very
conservative except for unit 1 with the lower column axial load and the bond-slip failure mode.
98
The ACI 352 (1991) joint shear strength coefficient for new Type II exterior joints is given as γ =
12 (psi), which was not reached by any of the units tested in this research regardless of the level
of column axial load.
The average value of the joint shear strain for units 1 and 2, exhibiting the bond-slip
failure mode, at the peak lateral load was 0.0035; the maximum measured joint shear strain was
0.0227. The average value of the joint shear strain for units 3-6, exhibiting the joint shear failure
mode, at the peak lateral load was 0.0033; the maximum measured joint shear strain was 0.0242.
The principal tensile stress in the joint for unit 1 with a bond-slip failure mode and axial
column load of 0.1f′cAg was 10.3√f′c (psi); for unit 2 with an axial column load of 0.25f′cAg the
principal tensile stress was 22.4√f′c (psi), an increase of 117 percent. For units 3 and 5 with a
joint shear failure mode and an axial column load of 0.1f′cAg,the average value of the principal
tensile stress was 14.3√f′c (psi); for units 4 and 6 with an axial column load of 0.25f′cAg,the
average value of the principal tensile stress was 24.2√f′c (psi); this is an increase of 69 percent
for the units with the higher axial column load.
The plastic shear angle at peak lateral load for the joint for all units tested was 0.01 (rad);
for unit 1 with a bond-slip failure mode and axial column load of 0.1f′cAg, the plastic shear angle
after sudden reduction of the lateral load was 0.03 (rad); for unit 2 with an axial column load of
0.25f′cAg the corresponding plastic shear angle was 0.02 (rad). For units 3 to 6 with a joint shear
failure mode, regardless of the level of the axial column load, the average value of the plastic
shear angle after sudden reduction of the lateral load was 0.04 (rad).
The displacement ductility ratios of unit 1 (0.1f′cAg) and unit 2 (0.25f′cAg) with the bond-
lip failure mode were 3.9 and 2.9, respectively; for units 3 and 5 with the joint shear failure mode
and axial column load of 0.1f′cAg, the displacement ductility ratio was 1.9, and for units 4 and 6
with axial column load of 0.25f′cAg, the displacement ductility ratio was 1.8. In addition, units 3
to 6 with the joint shear failure mode had a cumulative displacement ductility of 31% to 39%
smaller than units 1 and 2 with the bond-slip failure mode.
The units with 0.10f′cAg column axial load that failed by joint shear had a 24% higher
hysteretic energy dissipation compared to unit 1 that failed by a bond-slip mechanism. The units
with 0.25f′cAg column axial load that failed by joint shear had the same hysteretic energy
dissipation compared to unit 2 that failed by a bond-slip mechanism.
For each of the two failure modes of bond slip and joint shear five performance levels
were identified. For units 1 and 2 with the bond-slip failure mode the following performance

99
levels were identified: (I) first yield of the reinforcement, (II) formation of the bond-slip
mechanism, (III) cracking in the joint, (IV) spalling of concrete at the corner of the joint where
bond slip occurs, and (V) loss of lateral load capacity. For units 3 to 6 with the joint shear failure
mode the following performance levels were identified: (I) first yield of the reinforcement, (II)
cracking in the joint, (III) formation of the joint shear mechanism, (IV) spalling of concrete at the
joint core, and (V) loss of gravity load capacity. The above performance levels were used to
identify corresponding limit states, which were delineated in terms of joint strength coefficient
versus plastic rotation and crack width versus plastic rotation for both the bond-slip failure mode
and the joint shear failure mode.
It can be observed that the presence of the higher axial load was beneficial in terms of the
joint strength coefficient and principal tensile stress, but was detrimental for displacement
ductility and energy dissipation. The four units (units 3 to 6) with the joint shear failure mode
failed at the end of the test due to loss of the column axial compression load capacity. The
remaining two units (units 1 and 2) with the bond-slip failure mode failed at the end of the test
due to the loss of lateral load capacity. The units that had a bond-slip failure mode had a lower
joint strength coefficient, ultimate plastic shear angle, principal tensile stress, and energy
dissipation than the units with the joint shear failure mode.
A strut-and-tie model was developed for units 5 and 6 of the experimental program. The
analytical model is unique in that it incorporates bent bars in the beam-column joint. The tensile
tie elements that were used to represent the bent bars in the beam-column joint were idealized by
linear chord segments. Correlation with experimental values of the lateral load and column
compression axial load was excellent.
This research has resulted in a recommendation for new modeling criteria for exterior
concrete joints with substandard details based on either a bond-slip failure model or a joint shear
failure model. In the opinion of the authors, the proposed modeling criteria for exterior joints
that are prone to either bond-slip or shear failure modes capture the characteristics of the units
tested in this research in a more satisfactory manner than do the current FEMA 273 (1997)
modeling criteria.
REFERENCES
ACI Standard 318-63. 1963. Building code requirements for reinforced concrete (ACI 318-63). American Concrete Institute, Detroit, MI.
ACI Committee 352. 1991. Recommendations for design of beam-column joints in monolithic reinforced concrete structures (ACI 352R-91). American Concrete Institute, Farmington Hills, MI. ACI Committee 318. 1999. Building code requirements for structural concrete (ACI 318-99) and commentary (ACI 318R-99). American Concrete Institute, Farmington Hills, MI. Ali, M.A., and White, R.N. 2001. Automatic Generation of Truss Model for Optimal Design of Reinforced Concrete Structures, ACI Structural Journal,98(4), 431-442. American Society of Civil Engineers. 2000. FEMA 356: Prestandard and Commentary for the Seismic Rehabilitation of Buildings. Federal Emergency Management Agency, Washington, DC. Beres, A., White, A.N., and Gergely, P. 1992. Seismic behavior of RC frame structures with nonductile details: Part I-Summary of experimental findings of full scale beam-column joint tests, Report NCEER-92-0024, NCEER, SUNY Buffalo, NY. Building Seismic Safety Council. 1997. FEMA 273: NEHRP Guidelines for the Seismic Rehabilitation of Buildings. Federal Emergency Management Agency, Washington, DC. Concrete International. 2001. Chapter 22, ACI 318 Code Building code requirements for structural concrete (ACI 318-99) and commentary (ACI 318R-99). American Concrete Institute, Farmington Hills, MI, 125-132. Clyde, C., Pantelides, C.P., and Reaveley, L.D. 2000. Performance-based evaluation of exterior reinforced concrete building joints for seismic excitation. Pacific Earthquake Engineering Research Center, PEER Report 2000/05, University of California, Berkeley, CA. Durrani, A.J., and Zerbe, H.E.. 1987. Seismic resistance of R/C exterior connections with floor slab. Journal of Structural Engineering, 113 (8), 1850-64. Earthquake Engineering Research Institute. 1999a. EERI Special Earthquake Report – September 1999. The Tehuacan, Mexico, Earthquake of June 15, 1999. http://www.eeri.org/earthquakes/earthquakes.html
102
Earthquake Engineering Research Institute. 1999b. EERI Special Earthquake Report – November 1999. The Athens, Greece Earthquake of September 7, 1999. http://www.eeri.org/earthquakes/earthquakes.html Earthquake Engineering Research Institute. 1999b. EERI Special Earthquake Report – December 1999. The Chi-Chi, Taiwan Earthquake of September 21, 1999. http://www.eeri.org/earthquakes/earthquakes.html Ehsani, M.R., and Wight, J.K. 1985. Exterior reinforced concrete beam-to-column connections subjected to earthquake-type loading. ACI Journal, 82(4), 492-499. Hakuto, S., Park, R., and Tanaka, H. 2000. Seismic load tests on interior and exterior beam-column joints with substandard reinforcing details. ACI Journal, 97(1), 11-25. Hose, Y.D., Eberhard, M., and Seible, F. 1999. Performance Library of Concrete Bridge Components, Sub-assemblages and Systems under simulated Seismic Loads. SSRP 99/08 Structural Systems Research Program, UCSD, San Diego, CA. Hwang, S-J., and Lee, H-J. 1999. Analytical Model for Predicting Shear Strengths of Exterior Reinforced Concrete Beam-Column Joints for Seismic Resistance. ACI Structural Journal, 96(5), 846-857. Kaku, T., and Asakusa, H. 1991. Bond and anchorage of bars in reinforced concrete beam-column joints. ACI SP-123, Design of Beam-Column Joints for Seismic Resistance, J.O. Jirsa, ed., American Concrete Institute, Detroit, MI., 401-423. Kurose, Y. 1987. Recent studies on reinforced concrete beam column joints in Japan. PMFSEL Report No. 87-8 Department of Civil Engineering, University of Texas at Austin, Austin, TX. Lowes, L.N., and Moehle, J.P. 1999. Evaluation and Retrofit of Beam-Column T-Joints in Older Reinforced Concrete Bridge Structures. ACI Structural Journal, 96(4), 519-532. MacGregor, J.G. 1997 Reinforced Concrete - Mechanics and Design, Third Edition, Prentice Hall, Inc., Upper Saddle River, NJ. Megget, L.M. 1974. Cyclic behaviour of exterior reinforced concrete beam-column joints. Bulletin of the New Zealand National Society for Earthquake Engineering, 7(1). Meinheit, D.F. and Jirsa, J.O., The shear strength of reinforced concrete beam-column joints, CESRL Report No. 77-1, University of Texas, Austin, TX, Jan. 1977.
103
Moehle, J.P. and Mahin, S.A. 1991. Observations on the behavior of reinforced concrete buildings during earthquakes. Earthquake-Resistant Concrete Structures Inelastic Response and Design SP-127, American Concrete Institute, ed. S.K. Ghosh, Detroit. Pantazapoulou, S.J., and J.F. Bonacci. 1992. Consideration of questions about beam-column joints. ACI Structural Journal, 89 (1), 27-36. Pantazapoulou, S.J., and J.F. Bonacci. 1994. On earthquake-resistant reinforced concrete frame connections. Canadian Journal of Civil Engineering, 21, 307-28. Park, R.; et al. 1995. The Hyogo-ken Nanbu earthquake (the great Hanshin earthquake) of 17 January 1995: report of the NZNSEE Reconnaissance Team, Bulletin of the New Zealand National Society for Earthquake Engineering, 28, 1, Mar. 1995, pg. 1-98. Park, R. (1997). A static force-based procedure for the seismic assessment of existing reinforced concrete moment resisting frames. Bulletin of the New Zealand National Society for Earthquake Engineering, 30(3), 213-26. Paulay, T., and Scarpas, A. 1981. The behaviour of exterior beam-column joints. Bulletin of the New Zealand National Society for Earthquake Engineering, 14(3), 131-44. Priestley, M.J.N., Seible, F., and Calvi, G.M. 1996. Seismic Design and Retrofit of Bridges. John Wiley & sons, Inc., New York, NY. Sezen, H., Elwood, K.J., Whittaker, A.S., Mosalam, K. M., Wallace, J.W., and Stanton, J.F. 2000. Structural engineering reconnaissance of the August 17, 1999 earthquake: Kocaeli (Izmit), Turkey, PEER-2000/09, Berkeley: Pacific Earthquake Engineering Research Center, University of California, Dec. Tsonos, A.G., Tegos, I.A., and Penelis, G.G. 1995. Influence of Axial Force Variations on the Seismic Behavior of Exterior Beam-Column Joints. European Earthquake Engineering, 3, 51-63. Uang, C-M., Elgamal, A., Li, W-S., and Chou, C-C. 1999. Ji-Ji Taiwan Earthquake of September 21, 1999: A Brief Reconnaissance Report, Department of Structural Engineering, University of California, San Diego, http://www.structures.ucsd.edu/Taiwaneq Uzumeri, S. M. 1977. Strength and Ductility of Cast-In-Place Beam-Column Joints. ACI Publication SP 53-12: Reinforced Concrete Structures in Seismic Zones, 293-350.

PEER REPORTS
PEER reports are available from the National Information Service for Earthquake Engineering (NISEE). To order PEER reports, please contact the Pacific Earthquake Engineering Research Center, 1301 South 46th Street, Richmond, California 94804-4698. Tel.: (510) 231-9468; Fax: (510) 231-9461. PEER 2002/18 Assessment of Reinforced Concrete Building Exterior Joints with Substandard
Details. Chris P. Pantelides, Jon Hansen, Justin Nadauld, and Lawrence D. Reaveley. May 2002.
PEER 2002/17 Structural Characterization and Seismic Response Analysis of a Highway
Overcrossing Equipped with Elastomeric Bearings and Fluid Dampers: A Case Study. Nicos Makris and Jian Zhang. November 2002.
PEER 2002/16 Estimation of Uncertainty in Geotechnical Properties for Performance-Based
Earthquake Engineering. Allen L. Jones, Steven L. Kramer, and Pedro Arduino. December 2002.
PEER 2002/15 Seismic Behavior of Bridge Columns Subjected to Various Loading Patterns.
Asadollah Esmaeily-Gh. and Yan Xiao. December 2002. PEER 2002/14 Inelastic Seismic Response of Extended Pile Shaft Supported Bridge Structures. T.C.
Hutchinson, R.W. Boulanger, Y.H. Chai, and I.M. Idriss. December 2002. PEER 2002/13 Probabilistic Models and Fragility Estimates for Bridge Components and Systems.
Paolo Gardoni, Armen Der Kiureghian, and Khalid M. Mosalam. June 2002. PEER 2002/12 Effects of Fault Dip and Slip Rake on Near-Source Ground Motions: Why Chi-Chi
Was a Relatively Mild M7.6 Earthquake. Brad T. Aagaard, John F. Hall, and Thomas H. Heaton. December 2002.
PEER 2002/11 Analytical and Experimental Study of Fiber-Reinforced Strip Isolators. James M. Kelly
and Shakhzod M. Takhirov. September 2002. PEER 2002/10 Centrifuge Modeling of Settlement and Lateral Spreading with Comparisons to
Numerical Analyses. Sivapalan Gajan and Bruce L. Kutter. January 2003. PEER 2002/09 Documentation and Analysis of Field Case Histories of Seismic Compression during
the 1994 Northridge, California, Earthquake. Jonathan P. Stewart, Patrick M. Smith, Daniel H. Whang, and Jonathan D. Bray. October 2002.
PEER 2002/08 Component Testing, Stability Analysis and Characterization of Buckling-Restrained
Unbonded BracesTM. Cameron Black, Nicos Makris, and Ian Aiken. September 2002. PEER 2002/07 Seismic Performance of Pile-Wharf Connections. Charles W. Roeder, Robert Graff,
Jennifer Soderstrom, and Jun Han Yoo. December 2001. PEER 2002/06 The Use of Benefit-Cost Analysis for Evaluation of Performance-Based Earthquake
Engineering Decisions. Richard O. Zerbe and Anthony Falit-Baiamonte. September 2001.
PEER 2002/05 Guidelines, Specifications, and Seismic Performance Characterization of Nonstructural Building Components and Equipment. André Filiatrault, Constantin Christopoulos, and Christopher Stearns. September 2001.
PEER 2002/03 Investigation of Sensitivity of Building Loss Estimates to Major Uncertain Variables
for the Van Nuys Testbed. Keith A. Porter, James L. Beck, and Rustem V. Shaikhutdinov. August 2002.
PEER 2002/02 The Third U.S.-Japan Workshop on Performance-Based Earthquake Engineering
Methodology for Reinforced Concrete Building Structures. July 2002. PEER 2002/01 Nonstructural Loss Estimation: The UC Berkeley Case Study. Mary C. Comerio and
John C. Stallmeyer. December 2001. PEER 2001/16 Statistics of SDF-System Estimate of Roof Displacement for Pushover Analysis of
Buildings. Anil K. Chopra, Rakesh K. Goel, and Chatpan Chintanapakdee. December 2001.
PEER 2001/15 Damage to Bridges during the 2001 Nisqually Earthquake. R. Tyler Ranf, Marc O.
Eberhard, and Michael P. Berry. November 2001. PEER 2001/14 Rocking Response of Equipment Anchored to a Base Foundation. Nicos Makris and
Cameron J. Black. September 2001. PEER 2001/13 Modeling Soil Liquefaction Hazards for Performance-Based Earthquake Engineering.
Steven L. Kramer and Ahmed-W. Elgamal. February 2001. PEER 2001/12 Development of Geotechnical Capabilities in OpenSees. Boris Jeremic. September
2001. PEER 2001/11 Analytical and Experimental Study of Fiber-Reinforced Elastomeric Isolators. James
M. Kelly and Shakhzod M. Takhirov. September 2001. PEER 2001/10 Amplification Factors for Spectral Acceleration in Active Regions. Jonathan P.
Stewart, Andrew H. Liu, Yoojoong Choi, and Mehmet B. Baturay. December 2001. PEER 2001/09 Ground Motion Evaluation Procedures for Performance-Based Design. Jonathan P.
Stewart, Shyh-Jeng Chiou, Jonathan D. Bray, Robert W. Graves, Paul G. Somerville, and Norman A. Abrahamson. September 2001.
PEER 2001/08 Experimental and Computational Evaluation of Reinforced Concrete Bridge Beam-
Column Connections for Seismic Performance. Clay J. Naito, Jack P. Moehle, and Khalid M. Mosalam. November 2001.
PEER 2001/07 The Rocking Spectrum and the Shortcomings of Design Guidelines. Nicos Makris
and Dimitrios Konstantinidis. August 2001. PEER 2001/06 Development of an Electrical Substation Equipment Performance Database for
Evaluation of Equipment Fragilities. Thalia Agnanos. April 1999. PEER 2001/05 Stiffness Analysis of Fiber-Reinforced Elastomeric Isolators. Hsiang-Chuan Tsai and
James M. Kelly. May 2001. PEER 2001/04 Organizational and Societal Considerations for Performance-Based Earthquake
Engineering. Peter J. May. April 2001.
PEER 2001/03 A Modal Pushover Analysis Procedure to Estimate Seismic Demands for Buildings:
Theory and Preliminary Evaluation. Anil K. Chopra and Rakesh K. Goel. January 2001.
PEER 2001/02 Seismic Response Analysis of Highway Overcrossings Including Soil-Structure
Interaction. Jian Zhang and Nicos Makris. March 2001. PEER 2001/01 Experimental Study of Large Seismic Steel Beam-to-Column Connections. Egor P.
Popov and Shakhzod M. Takhirov. November 2000. PEER 2000/10 The Second U.S.-Japan Workshop on Performance-Based Earthquake Engineering
Methodology for Reinforced Concrete Building Structures. March 2000. PEER 2000/09 Structural Engineering Reconnaissance of the August 17, 1999 Earthquake: Kocaeli
(Izmit), Turkey. Halil Sezen, Kenneth J. Elwood, Andrew S. Whittaker, Khalid Mosalam, John J. Wallace, and John F. Stanton. December 2000.
PEER 2000/08 Behavior of Reinforced Concrete Bridge Columns Having Varying Aspect Ratios and
Varying Lengths of Confinement. Anthony J. Calderone, Dawn E. Lehman, and Jack P. Moehle. January 2001.
PEER 2000/07 Cover-Plate and Flange-Plate Reinforced Steel Moment-Resisting Connections.
Taejin Kim, Andrew S. Whittaker, Amir S. Gilani, Vitelmo V. Bertero, and Shakhzod M. Takhirov. September 2000.
PEER 2000/06 Seismic Evaluation and Analysis of 230-kV Disconnect Switches. Amir S. J. Gilani,
Andrew S. Whittaker, Gregory L. Fenves, Chun-Hao Chen, Henry Ho, and Eric Fujisaki. July 2000.
PEER 2000/05 Performance-Based Evaluation of Exterior Reinforced Concrete Building Joints for
Seismic Excitation. Chandra Clyde, Chris P. Pantelides, and Lawrence D. Reaveley. July 2000.
PEER 2000/04 An Evaluation of Seismic Energy Demand: An Attenuation Approach. Chung-Che
Chou and Chia-Ming Uang. July 1999. PEER 2000/03 Framing Earthquake Retrofitting Decisions: The Case of Hillside Homes in Los
Angeles. Detlof von Winterfeldt, Nels Roselund, and Alicia Kitsuse. March 2000. PEER 2000/02 U.S.-Japan Workshop on the Effects of Near-Field Earthquake Shaking. Andrew
Whittaker, ed. July 2000. PEER 2000/01 Further Studies on Seismic Interaction in Interconnected Electrical Substation
Equipment. Armen Der Kiureghian, Kee-Jeung Hong, and Jerome L. Sackman. November 1999.
PEER 1999/14 Seismic Evaluation and Retrofit of 230-kV Porcelain Transformer Bushings. Amir S.
Gilani, Andrew S. Whittaker, Gregory L. Fenves, and Eric Fujisaki. December 1999. PEER 1999/13 Building Vulnerability Studies: Modeling and Evaluation of Tilt-up and Steel
Reinforced Concrete Buildings. John W. Wallace, Jonathan P. Stewart, and Andrew S. Whittaker, editors. December 1999.
PEER 1999/12 Rehabilitation of Nonductile RC Frame Building Using Encasement Plates and Energy-Dissipating Devices. Mehrdad Sasani, Vitelmo V. Bertero, James C. Anderson. December 1999.
PEER 1999/11 Performance Evaluation Database for Concrete Bridge Components and Systems
under Simulated Seismic Loads. Yael D. Hose and Frieder Seible. November 1999. PEER 1999/10 U.S.-Japan Workshop on Performance-Based Earthquake Engineering Methodology
for Reinforced Concrete Building Structures. December 1999. PEER 1999/09 Performance Improvement of Long Period Building Structures Subjected to Severe
Pulse-Type Ground Motions. James C. Anderson, Vitelmo V. Bertero, and Raul Bertero. October 1999.
PEER 1999/08 Envelopes for Seismic Response Vectors. Charles Menun and Armen Der
Kiureghian. July 1999. PEER 1999/07 Documentation of Strengths and Weaknesses of Current Computer Analysis
Methods for Seismic Performance of Reinforced Concrete Members. William F. Cofer. November 1999.
PEER 1999/06 Rocking Response and Overturning of Anchored Equipment under Seismic
Excitations. Nicos Makris and Jian Zhang. November 1999. PEER 1999/05 Seismic Evaluation of 550 kV Porcelain Transformer Bushings. Amir S. Gilani,
Andrew S. Whittaker, Gregory L. Fenves, and Eric Fujisaki. October 1999. PEER 1999/04 Adoption and Enforcement of Earthquake Risk-Reduction Measures. Peter J. May,
Raymond J. Burby, T. Jens Feeley, and Robert Wood. PEER 1999/03 Task 3 Characterization of Site Response General Site Categories. Adrian
Rodriguez-Marek, Jonathan D. Bray, and Norman Abrahamson. February 1999. PEER 1999/02 Capacity-Demand-Diagram Methods for Estimating Seismic Deformation of Inelastic
Structures: SDF Systems. Anil K. Chopra and Rakesh Goel. April 1999. PEER 1999/01 Interaction in Interconnected Electrical Substation Equipment Subjected to
Earthquake Ground Motions. Armen Der Kiureghian, Jerome L. Sackman, and Kee-Jeung Hong. February 1999.
PEER 1998/08 Behavior and Failure Analysis of a Multiple-Frame Highway Bridge in the 1994
Northridge Earthquake. Gregory L. Fenves and Michael Ellery. December 1998. PEER 1998/07 Empirical Evaluation of Inertial Soil-Structure Interaction Effects. Jonathan P.
Stewart, Raymond B. Seed, and Gregory L. Fenves. November 1998. PEER 1998/06 Effect of Damping Mechanisms on the Response of Seismic Isolated Structures.
Nicos Makris and Shih-Po Chang. November 1998. PEER 1998/05 Rocking Response and Overturning of Equipment under Horizontal Pulse-Type
Motions. Nicos Makris and Yiannis Roussos. October 1998. PEER 1998/04 Pacific Earthquake Engineering Research Invitational Workshop Proceedings, May
14–15, 1998: Defining the Links between Planning, Policy Analysis, Economics and Earthquake Engineering. Mary Comerio and Peter Gordon. September 1998.
PEER 1998/03 Repair/Upgrade Procedures for Welded Beam to Column Connections. James C. Anderson and Xiaojing Duan. May 1998.
PEER 1998/02 Seismic Evaluation of 196 kV Porcelain Transformer Bushings. Amir S. Gilani, Juan
W. Chavez, Gregory L. Fenves, and Andrew S. Whittaker. May 1998. PEER 1998/01 Seismic Performance of Well-Confined Concrete Bridge Columns. Dawn E. Lehman
and Jack P. Moehle. December 2000.