Embed Size (px)
Citation preview

- Dokumenten- und Publikationsserver der
Georg-August-Universität Göttingen
2013
Assessment of socio-economic functions of tropical lowland
transformation systems in Indonesia
-
sampling framework and methodological approach
Faust, H., Schwarze, S., Beckert, B., Brümmer, B., Dittrich, C., Euler, M., Gatto, M.,
Hauser-Schäublin, B., Hein, J., Holtkamp, A. M., Ibanez, M., Klasen, S., Kopp, T.,
Krishna, V., Kunz, Y., Lay, J., Mußhoff, O., Qaim, M., Steinebach, S., Vorlaufer, M.,
Wollni, M.
EFForTS discussion paper series Nr. 1
Faust, H. ; Schwarze, S. ; Beckert, B. ; Brümmer, B. ; Dittrich, C. ; Euler, M. ; Gatto, M. ; Hauser-
Schäublin, B. ; Hein, J. ; Holtkamp, A. M. ; Ibanez, M.; Klasen, S. ; Kopp, T. ; Krishna, V. ; Kunz, Y. ; Lay,
J. ; Mußhoff, O. ; Qaim, M. ; Steinebach, S.; Vorlaufer, M. ; Wollni, M.: Assessment of socio-economic
functions of tropical lowland transformation systems in Indonesia : sampling framework and
methodological approach
Göttingen : GOEDOC, Dokumenten- und Publikationsserver der Georg-August-Universität, 2013
(EFForTS discussion paper series 1)
Verfügbar:
PURL: http://resolver.sub.uni-goettingen.de/purl/?webdoc-3901
This work is licensed under the Creative Commons License 3.0 “by-nd”,
allowing you to download, distribute and print the document in a few copies for private
or educational use, given that the document stays unchanged and the creator is mentioned.
You are not allowed to sell copies of the free version.

Bibliographische Information der Deutschen Nationalbibliothek
Die Deutsche Nationalbibliothek verzeichnet diese Publikation in der Deutschen
Nationalbibliographie; detaillierte bibliographische Daten sind im Internet über
<http://dnb.ddb.de> abrufbar.
Erschienen in der Reihe
EFForTS discussion paper series
ISSN: 2197-6244
Herausgeber der Reihe
SFB 990 EFForTS, Ecological and Socioeconomic Functions of Tropical Lowland Rainforest
Transformation Systems (Sumatra, Indonesien) - Ökologische und sozioökonomische Funktionen
tropischer Tieflandregenwald-Transformationssysteme (Sumatra, Indonesien)
Georg-August-Universität Göttingen
Johann-Friedrich-Blumenbach Institut für Zoologie und Anthropologie, Fakultät für Biologie und
Psychologie
Abstract: EFForTS is a collaborative research center (CRC) which focuses on Ecological and
socioeconomic Functions of Tropical Lowland Rainforest Transformation Systems in Sumatra,
Indonesia. The paper presents the common sampling frame of the socio economic sub-projects. The
investigations and data collections intertwine and complement one another. Thus the methodological
approach reflects the idea of an interdisciplinary and integrative research approach. Lead by
hypotheses we structured our sampling procedure hierarchically. Starting at the household level in the
core villages of the research regions we investigate additional local villages. Further we extend the data
collections on the regional level with household, village and trader surveys. The national and
international levels we reach by stakeholder interviews with governmental and non-governmental
experts. The applied methods are composed of qualitative and quantitative empirical studies.
Keywords: socioeconomic functions, agricultural transformation systems, sampling framework,
methods, Jambi, Indonesia
Assessment of Socio-Economic Functions of Tropical Lowland Transformation Systems in Indonesia
- Sampling Framework and Methodological Approach
Faust, H., Schwarze, S., Beckert, B., Brümmer, B., Dittrich, C., Euler, M., Gatto, M., Hauser-Schäublin, B., Hein, J., Holtkamp, A. M., Ibanez, M.,
Klasen, S., Kopp, T., Krishna, V., Kunz, Y., Lay, J., Mußhoff, O., Qaim, M., Steinebach, S., Vorlaufer, M., Wollni, M.
EFForTS Discussion Paper Series
No. 1 (September 2013)
Funded by the German Research Foundation (DFG) through the CRC 990 “EFForTS, Ecological and Socioeconomic Functions of Tropical Lowland Rainforest Transformation
Systems (Sumatra, Indonesia)”
www.uni-goettingen.de/en/310995.html
SFB 990, University of Goettingen
Berliner Straße 28, D-37073 Goettingen, Germany
ISSN: 2197-6244

II
Managing editors:
At the University of Goettingen, Germany
Prof. Dr. Christoph Dittrich, Institute of Geography, Dept. of Human Geography
(Email: [email protected])
Dr. Stefan Schwarze, Dept. of Agricultural Economics and Rural Development,
(Email: [email protected])
At the Universities of Bogor and Jambi, Indonesia
Prof. Dr. Zulkifli Alamsyah, Dept. Of Agricultural Economics, Faculty of Agriculture, University
of Jambi
(Email: [email protected])
Dr. Satyawan Sunito, Dept. of Communication and Community Development Sciences, Faculty of
Human Ecology, Bogor Agricultural University (IPB)
(Email: [email protected])
III
Table of contents
Abstract 1 1. Introduction 2 1.1 Scope and objectives of EFForTS in Jambi 2 1.2 Scope and objective of Human Dimensions Group 3 1.3 Research area 4 2. Conceptual procedure of qualitative studies 5 2.1 Research hypotheses / Research questions 6 2.2 Village case studies 6
2.2.1 Stakeholder interviews 10 2.2.2 Participatory tools 11
2.3 Household case studies 13 2.3.1 Problem-centered interviews 13 2.3.2 Timelines 14
2.4 Comparative cultural study 14 3. Conceptual procedure of quantitative studies 15 3.1 Research hypotheses 15 3.2 The village survey 16
3.2.1 Sampling Procedure 16 3.2.2 Objectives of the village survey and questionnaire design 17
3.3 The household survey 18 3.3.1 Sampling procedure 18 3.3.2 Objectives of the household survey and questionnaire design 19 3.3.3 Ecological extension of the household survey 19
3.4 Trader survey 20 4. Economic field experiments 20 4.1 Risk attitudes 20 4.2 Trust preferences 21 4.3 Incentive Mechanisms for sustainable land use options 22 References 24 List of authors and contributions 28 Appendix 29
IV
List of figures Fig. 1: Joint sampling framework of Human Dimensions Group 3 Fig. 2: Research areas 5 Fig. 3: Village case studies 7 Fig. 4: Participatory village mapping 12 Fig. 5: Village survey 17 Fig. 6: Shares of rubber and oil palm cultivation on village level 18 List of tables Table 1: Structure of the Holt and Laury Lottery 21 Table 2: Design of the compensation mechanisms 23

1
Abstract EFForTS is a collaborative research center (CRC) which focuses on Ecological and socio-economic Functions of Tropical Lowland Rainforest Transformation Systems in Sumatra, Indonesia. The paper presents the common sampling frame of the socio economic sub-projects. The investigations and data collections intertwine and complement one another. Thus the methodological approach reflects the idea of an interdisciplinary and integrative research approach. Lead by hypotheses we structured our sampling procedure hierarchically. Starting at the household level in the core villages of the research regions we investigate additional local villages. Further we extend the data collections on the regional level with household, village and trader surveys. The national and international levels we reach by stakeholder interviews with governmental and non-governmental experts. The applied methods are composed of qualitative and quantitative empirical studies. Keywords: socioeconomic functions, rainforest transformation systems, sampling framework, methods, Jambi, Indonesia

2
1. Introduction 1.1 Scope and objectives of EFForTS in Jambi Around the world, the expansion of agriculture and the extraction of natural resources are increasingly competing with natural ecosystems. In many tropical areas, rainforests are cleared in order to exploit timber and other forest products as well as plant crops for food, feed and fuel use. Commonly it is assumed that, when natural forests are cleared, all forest functions and services are lost. Against this background, natural forest conservation would be the only way to preserve these functions and services. However, given increasing human demand for food, feed, fiber and other natural resources, complete conservation is not realistic in many settings and might also not be required from an ecological perspective. Surprisingly, the determinants of different patterns of deforestation and the roles of resulting transformation systems of tropical rainforests for conserving biodiversity as well as ecological and socioeconomic functions have received little attention in scientific research so far. Investigating the functions of rainforest transformation systems is particularly important for lowland rainforests, as these are the most threatened, disappearing at accelerating rates (http://www.uni-goettingen.de/en/310995.html). The Collaborative Research Center (CRC) “Ecological and Socioeconomic Functions of Tropical Lowland Rainforest Transformation Systems” (EFForTS) aims at providing science-based guidelines on how to protect and enhance the ecological functions and services of tropical forests, forest remnants and agricultural transformation systems at a landscape scale, while improving human welfare at the same time. The results are expected to contribute to the development of strategies for sustainable management of forest reserves and major rainforest transformation systems of the lowland tropics of Southeast Asia, such as rubber and oil palm plantations. Further, the program aims at providing baseline information on how to integrate agricultural land use and conservation issues, crucial for the implementation of biosphere reserves and similar concepts involving different zones of human impact. In order to implement such zones and promote more integrative land use, detailed knowledge on the functions and services of forest reserves vs. agricultural transformation systems in a landscape context is required. The CRC addresses the following major research questions:
• What are the driving forces for deforestation and the establishment of different agricultural transformation systems, and what factors contribute to the preservation of functions of tropical lowland rainforest in an agricultural landscape?
• What are the functions and services of forest transformation systems, such as extensive rubber (‘jungle rubber’), and intensive rubber and oil palm plantations? Which characteristics of the transformation systems are responsible for which functions/services?
• What are the environmental, economic and social impacts of transforming tropical lowland rainforest into agricultural systems such as rubber und oil palm plantations?
• How can the ecological and socioeconomic functions and services of tropical lowland rainforest transformation systems be improved? What are technological, institutional and policy preconditions for implementing landscape systems that reconcile ecological functions, agricultural productivity and human welfare?

3
1.2 Scope and objective of Human Dimensions Group Knowledge on the long term human dimensions of large-scale deforestation and the design of appropriate mitigation policies is still limited. The socioeconomic subprojects (SP) analyze the driving forces of observed land use changes (e.g. the expansion of oil palm and intensive rubber plantations), their impacts, as well as resulting policy implications. Driving forces include international market forces (e.g., oil price and food price developments, carbon markets) and regimes (e.g., WTO, UNFCCC), national and regional policies, as well as institutional, socio-demographic and cultural factors at the micro level. The impact analysis focuses on a diverse set of socioeconomic functions of transformation systems, including economic (e.g., profit, income, employment) and social (e.g. income distribution, risk, poverty, food security, culture, gender) effects and considers historical development of the last 100 years (http://www.uni-goettingen.de/en/project-groups/312409.html). Policy recommendations on welfare outcomes in their various dimensions and potential improvement through institutional adjustments will be derived in each SP. Furthermore, more far reaching policy recommendations, determining how sustainable transformation systems could be designed and implemented, will be developed through interdisciplinary cooperation. This explicitly takes the synergies and trade-offs between socioeconomic and ecological functions into account considering political economy. The socioeconomic SPs follow an extensive complementary approach, as they all concentrate on different levels of analysis, starting from the micro-farm and household level up to the macro-national and international level. Moreover, they follow complementarities in terms of their methodological approaches; both quantitative and qualitative tools are developed, applied and adapted to the specific Indonesian context. While some of the SPs use structured surveys and econometric techniques, others use economic field experiments, village and household case studies and participatory approaches, as well as stakeholder interviews. A joint sampling framework has been developed for the different data collection activities (Fig. 1). Fig. 1: Joint sampling framework of Human Dimensions Group
100 villages (survey)
40 villages
700 households (experiments)
700 households (survey)
80 households (case studies)
350 traders (survey)
6 villages (comparative study)
Households in 3-6 villages (experiments)
14 villages (participatory tools)
4
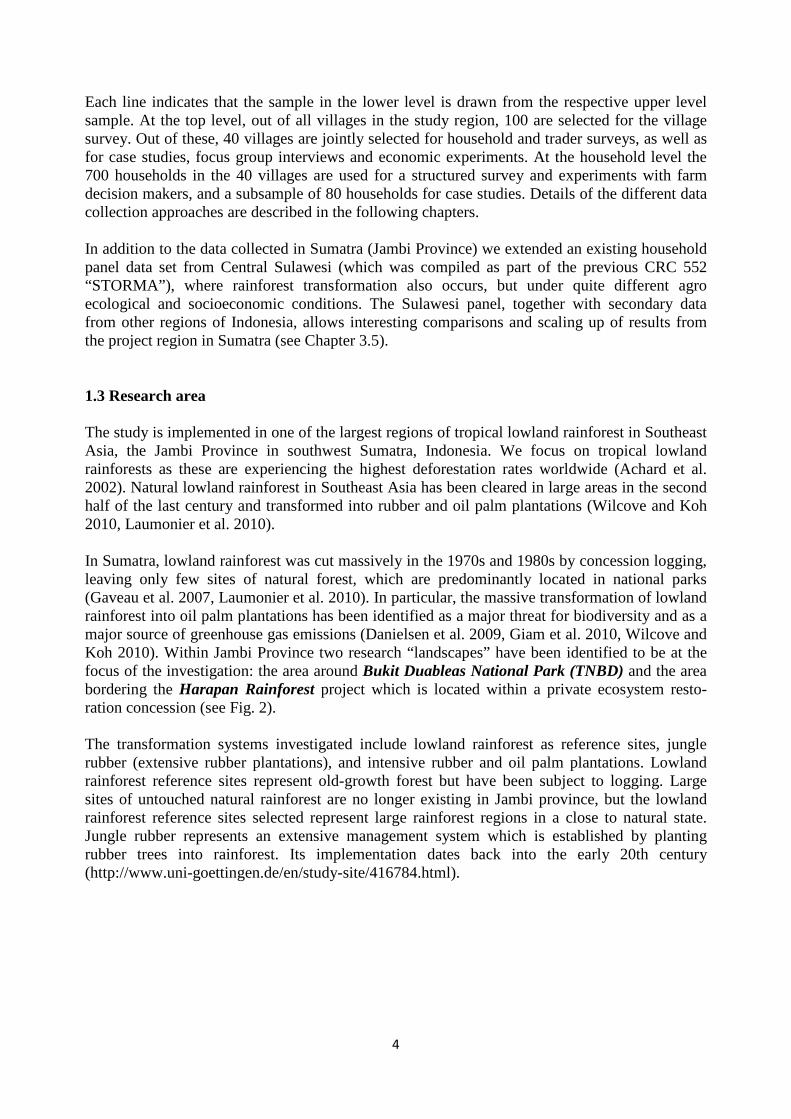
Each line indicates that the sample in the lower level is drawn from the respective upper level sample. At the top level, out of all villages in the study region, 100 are selected for the village survey. Out of these, 40 villages are jointly selected for household and trader surveys, as well as for case studies, focus group interviews and economic experiments. At the household level the 700 households in the 40 villages are used for a structured survey and experiments with farm decision makers, and a subsample of 80 households for case studies. Details of the different data collection approaches are described in the following chapters. In addition to the data collected in Sumatra (Jambi Province) we extended an existing household panel data set from Central Sulawesi (which was compiled as part of the previous CRC 552 “STORMA”), where rainforest transformation also occurs, but under quite different agro ecological and socioeconomic conditions. The Sulawesi panel, together with secondary data from other regions of Indonesia, allows interesting comparisons and scaling up of results from the project region in Sumatra (see Chapter 3.5). 1.3 Research area The study is implemented in one of the largest regions of tropical lowland rainforest in Southeast Asia, the Jambi Province in southwest Sumatra, Indonesia. We focus on tropical lowland rainforests as these are experiencing the highest deforestation rates worldwide (Achard et al. 2002). Natural lowland rainforest in Southeast Asia has been cleared in large areas in the second half of the last century and transformed into rubber and oil palm plantations (Wilcove and Koh 2010, Laumonier et al. 2010). In Sumatra, lowland rainforest was cut massively in the 1970s and 1980s by concession logging, leaving only few sites of natural forest, which are predominantly located in national parks (Gaveau et al. 2007, Laumonier et al. 2010). In particular, the massive transformation of lowland rainforest into oil palm plantations has been identified as a major threat for biodiversity and as a major source of greenhouse gas emissions (Danielsen et al. 2009, Giam et al. 2010, Wilcove and Koh 2010). Within Jambi Province two research “landscapes” have been identified to be at the focus of the investigation: the area around Bukit Duableas National Park (TNBD) and the area bordering the Harapan Rainforest project which is located within a private ecosystem resto-ration concession (see Fig. 2). The transformation systems investigated include lowland rainforest as reference sites, jungle rubber (extensive rubber plantations), and intensive rubber and oil palm plantations. Lowland rainforest reference sites represent old-growth forest but have been subject to logging. Large sites of untouched natural rainforest are no longer existing in Jambi province, but the lowland rainforest reference sites selected represent large rainforest regions in a close to natural state. Jungle rubber represents an extensive management system which is established by planting rubber trees into rainforest. Its implementation dates back into the early 20th century (http://www.uni-goettingen.de/en/study-site/416784.html).

5
Fig. 2: Research areas
2. Conceptional procedure of qualitative studies Most of the human dimension studies carried out in Jambi Province highlight only one socioeconomic aspect such as livelihoods in terms of rubber agroforestry (e.g. Martini et. al. 2010; Feintrenie and Levang 2009), oil palm cultivation (e.g. Feintrenie et al. 2010) or aspects of environmental benefits and conservation (e.g. Murdiyarso et. al. 2002). Therefore, including a geographical comprehensive component by analyzing rural livelihood systems at the micro-level and at the same time analyzing the underlying conditions, drivers and trends of the current landscape transformation on a meso- and even macro-level will help to understand the effects of environmental and agrarian change in Jambi Province in a more profound way.
From a methodological point of view, some of the studies are based on a qualitative research approach with a relatively open research design. This inductive approach enables the researcher to detect new insights and develop empirically based theories. The main aim of qualitative research is, to be able to understand the underlying individual decisions for specific land use options and thus the processes of land use change, complementary with the quantitative research approach. The qualitative methods applied here are: participant observation, semi-structured interviews with stakeholders on village level, problem-centered interviews with households, focus group discussions with key informants, participatory tools like mapping, timelines and comparative cultural study.

6
2.1 Research hypotheses / research questions In anthropology it is more common to develop (and to speak about) research questions instead of „hypotheses“ especially since the anthropologist’s goal is primarily to understand people’s perspectives and practices (emic point of view) rather than to “test” the investigator’s assumptions (etic point of view). The “hypotheses” listed below are therefore rather research questions than hypotheses.
Mainly related to village and household case studies H1: The grade of regional landscape transformation in terms of fragmentation and degradation is
stronger depending on sociocultural factors (i.e. share of migrants) and political power structures (pluralism of law, i.e. traditional, state) than on pure economic and physical advantages. These sociocultural and political factors derive from historical processes concerning population and settlement development.
H2: Environmental values of stakeholder groups and the land use mosaic derive from asymmetric power relations between various local actor groups, that is why the socioeconomic valuation of landscape types are depending stronger on political negotiations between different stakeholder groups than on pure economic advantages.
H3: Land use change is a process of political appropriation of land rather than over-exploitation that means land use change depends on environmental governance based on specific local power structures which determine the acceptance of sustainable land use instruments and concepts.
H4: Meanings and values of forests and their transformation systems differ between cultural groups.
H5: Cultural groups have preferences for certain transformation systems due to their cultural background.
H6: In some contexts cultural aspects (drivers) can be more influential than mere economic incentives to engage in certain transformation systems.
H7: Engagement in new and expanding transformation systems has a cultural “feedback” and transforms social structures and cultural values, and vice versa.
H8: The choice to engage in a particular transformation system depends also on the culture-specific attitude towards incentives offered by outside agents (such as world market price or offers of companies to local farmers to sell their land).
H9: Global forest conservation discourses influence local people’s engagement in forest conservation in particular ways depending on their own goals.
H10: Engagement in forest conservation influences cultural groups’ structural relationship among each other.
H11: Global forest conservation discourses changes cultural meanings and values related to the forest and its transformation.
2.2 Village case studies Within the two research regions, a focus was put on 14 research villages, 7 located south of TNBD, and 7 north of the Harapan Rainforest concession (Fig. 3). The 14 case studies research villages were selected according to several variables. All villages had to be in proximity to either

7
TNBD or Harapan Rainforest. Furthermore, it was intended to create a balance between autochthonous villages and transmigration villages as well as between villages mainly cultivating rubber and those predominantly generating income through palm oil farming. The age of the villages was also taken into consideration as the historic component (cultural landscape analysis for the last 100 years) is one of the points of major interest. Six villages have been identified as core villages providing research plots for the biotic and abiotic research projects of our collaborative research project (CRC) while being villages where the socio-economic groups conduct research as well. The other eight villages are either a subsample of the household survey or additional research villages.
Fig. 3: Village case studies
All villages selected are located within the predefined transformation systems, which include extensive rubber cultivation areas, intensive rubber and oil palm plantations as well as lowland rainforest areas. The research villages listed above differ in age, size, main land use, transformation schemes and consequently in socioeconomic dimensions (i.e. livelihood strategies). To shed light on the micro-level of analysis and consequently on the village settings, the research villages are described:
Bukit Duabelas National Park (TNBD) region:
1. Desa Baru, core plot village, district Air Hitam, regency Sarolangun is an autochthonous village bordering the Bukit Duabelas National Park. At the time of Dutch colonial rule houses were scattered amongst the cultivation area of people organized in smaller village entities called dusun. Dutch colonial rule then decided to

8
group several dusun into one village under the name of Desa Baru. The number of inhabitants in 2013 was approximately 2,820, population consists of 80% autochthonous Melayu-Jambi and 20% migrants from Java and other parts of Sumatra. Traditionally a rubber village, oil palm was introduced by PT Emal (Perseroan Terbatas Eramistra Agro Lestari) and PT1 JAW (Perseroan Terbatas Jambi Agro Wijaya) in the 1990s. The land tenure system seems unclear to the local population claiming the company area as customary land. Prevailing cultivated crop is still rubber (70%), with an increasing share of oil palm currently at approximately 30%.
2. Bukit Suban, additional village, district Air Hitam, regency Sarolangun is a transmigration village, founded in 1984 with an initial number of 445 households (the number of households has grown to 1690 households in 2012). 60% of the population is originally from Java, 40% is of local origin (Melayu-Jambi). The village was established in cooperation with an oil palm plasma scheme led by PT SAL (Perseroan Terbatas Sari Aditya Loka). The total area of the village land encompasses approximately 15,000 ha of which 950ha are under oil palm cultivation. Due to the nature of the cooperation with an oil palm company ,the main agricultural and land use schemes are oil palm plantations (around 80%) complemented by rubber (around 20%).
3. Desa Jernih, additional village, district Air Hitam, regency Sarolangun borders the Bukit Duabelas National Park and is one of the oldest villages in the region founded before the time of Dutch colonization. It consists of around 748 households (2013), out of these around 70% are local autochthonous Jambi-Melayu, 30% are migrants mainly from Java. Stated as village land are 9,400 ha. Main land use is rubber cultivation (65%); oil palms (35%) were introduced in the village in the 1990s through the introduction of the companies PT JAW and PT Emal. Rice and vegetables are cultivated by settlers from Java.
4. Lubuk Kepayang, core plot village, district Air Hitam, regency Sarolangun is a traditional village with a total number of about 425 households (2012). The main ethnicity is the local autochthonous Jambi-Melayu who comprises more than 90% of the village population. The total amount of village land stated are 6,000 ha of which more than half are allocated to oil palm cultivation (3,200 ha). Rubber monoculture (1,500 ha) and jungle rubber (1,000 ha) cultivation are of decreasing importance (2012). In 2012, the village was in negotiations with PT Emal over an oil palm contract with about 50 smallholder farmers.
5. Desa Mentawak Ulu, additional village, district Air Hitam, regency Sarolangun is a transmigration village established with an initial number of 617 households in 1986. In the case of Mentawak Ulu cooperation (plasma) with a company only kicked in after a couple of years. PT SAL started to give loans to the inhabitants in 1989/1990, started clearing land in 1990 and started to cultivate oil palm between 1991 and 1993. Inhabitants are almost exclusively Javanese and all of them hold land tenure certificates. The village has overlapping land claims with a bordering autochthonous village.
6. Gurun Mudo, additional village, district Mandiangin, regency Sarolangun is an autochthonous village founded before Dutch colonial rule. The number of households in early 2013 stood at approximately 235, with the majority of the population being autochthonous people who have inhabited the area for long. The area claimed as village land is 33,000 ha. Dominant cash crop is rubber (70%) and oil palm (30%). Population development and land use changes were impacted by 4 oil palm plantations
1 PT = Perseroan Terbatas (Limited Liability Company)

9
obtaining concession rights beginning in 1980 (PT Emal, SDM = Savit Desa Makmur). Even though influenced by oil palm companies the individual decision on crops is on rubber rather than oil palm cultivation.
7. Pauh, core plot village, district Pauh, regency Sarolangun is a traditional village with 2.424 farmer households (2012). Approximately 80% of the population originates from Jambi, whereas the remaining 20% are spontaneous migrants mainly stemming from Java. The total village land was about 24,000 ha in 2012. Monoculture rubber (5,750 ha) and oil palm (9,000 ha) are the two major land systems. The increasing importance of oil palm cultivation is pushed forward by private company involvement, in particular, PT Emal.
Harapan Rainforest region:
8. Bakti Mulya, additional village, district Sungaibaha, regency Muaro Jambi, is a transmigration settlement established in 1989/90 with an initial number of 750 households. At the time of being migrated every household was provided with a wooden hut and 2.5 ha of land: 2.0 ha for plasma (oil palm ready for harvesting) and 0.5 ha for subsistence purposes. All of the transmigrants hold land tenure certificates. Bakti Mulya is part of a larger transmigrant area consisting of 21 units or transmigrant villages.
9. Bungku, core plot village, district Bajubang, regency Batang Hari was founded in 1973 as resettlement village for the local autochthonous Batin Sembilan population. Official number of households is 2,864, whereas estimations on village level count up to 12,000 inhabitants. The local Batin Sembilan (20%) population is outnumbered by migrants from Java and other parts of Sumatra (80%). The administrative village territory covers an area of 77,000 ha including wide concessions for oil palm plantations (PT Asiatic Persada), timber plantations (PT Agronusa Alam Sejahtera and PT Wanakasita Nusantara,) and ecosystem restoration (PT Restorasi Ekosistem Indonesia/ Harapan Rainforest). Besides parts of the village territory are classified as forest reserve (Taman Hutan Raya Sultan Thaha Syaifuddin-Senami/ TAHURA). Since community land was never clearly defined large parts of the commercial concessions and of the forest reserve are claimed and used by local communities causing different land conflicts. Main cash crop is oil palm (60%) and rubber (40%). Shifting cultivation and cultivation of traditional fruit trees such as Durian is practiced in forest areas claimed by PT REKI (Restorasi Ekosistem Indonesia).
10. Desa Markanding, additional village, district Sungai Bahar is an autochthonous village with founded in the 1940s during the time of Dutch colonial rule. The number of households in 2012 stood at 733, with 30% of the population being local autochthonous and 70% being migrants (Javanese and Bataknese). The area of village land is stated to be approximately 3,810 ha. The share of rubber to oil palm production is 35% to 65%. Shifting cultivation is still in practise in forested area also claimed by the reforestation concession PT REKI. The land use and population development of Markanding is since 1984 being impacted by the introduction of the state owned company PT PN VI (Perseroan Terbatas Perkebunan Nusantara), cultivating oil palm.
11. Desa Marga Mulya, additional village, district Sungaibaha, regency Muaro Jambi is a transmigration settlement established in 1986. The number of households comprises 1,103, 85% Javanese/Sundanese, and 15% mixed origin (mainly Bataknese). The area of village land is 1,814 ha. The predominant cultivation scheme is oil palm (99.8%). The

10
founding of Marga Mulya and its economic development is inseparably related to the establishment of the stately palm oil producing company PT PN VI.
12. Mekar Jaya, additional village, district Bajubang, regency Batanghari is a transmigration village founded in 1987 in cooperation with the state-owned company PT PN VI. At the time of establishment the 335 households were moved, an estimated 70% from Java and 30% from other parts of Sumatra (e.g. Palembang). Opposed to most other transmigrant villages in the research area, Mekar Jaya was set up with a rubber and not a palm oil plasma scheme. Another significant difference to other transmigrant villages here is that people do not hold land title certificates. The village borders the Sultan Thaha Syaifuddin conservation forest which is encroached by a growing village population.
13. Pompa Air, core plot village, district Bajubang, regency Batanghari is an autochthonous village, dated back to the Dutch colonial time. Pompa Air consists of 680 households (2013), Batin Sembilan account for 40% of the inhabitants, 60% migrants from Java and other parts of Sumatra. Village land comprises 6,300 ha. Main land use in the past has been rubber cultivation which is now currently being replaced by oil palms. Land use and population development in Pompa Air is influenced by the establishment of oil palm plantations (PT Asiatic Persada) and forest conservation areas (Sultan Thaha Syaifuddin).
14. Desa Singkawang, core plot village, district Batang Hari, regency Muara Bulian is one of the oldest amongst the research villages in the Harapan area. Today only a slight majority of the 1116 inhabitants consists of the autochthonous population of the area; many people came here from Java and other parts of Sumatra. Being a traditional rubber cultivating village, oil palm was only introduced through a company in 1997. The company set up a contract through which the farmers give 80% of the yield to the company while 20% of the yield remains with the farmer. Like Mekar Jaya, Singkawang also borders Sultan Thaha Syaifuddin conservation forest which is claimed by villagers from Singkawang as well.
2.2.1 Stakeholder interviews and focus group discussions As described by George E. Marcus (1995: 79f) (1995: 79f) research which is “embedded in a world system […] cannot be […] focused on a single site of intensive investigation”. Therefore stakeholder interviews will be conducted on different political scales and as mentioned above in different research sites. Research sites are the research villages (introduced above) and important local, national and transnational nodes of decision making (Flitner and Görg 2008) related to land use transformation. Nodes of decision making are for instances governmental agencies, headquarters of environmental organizations, transnational companies and village governments.
Stakeholders or in other words experts are representatives of specific groups which are directly involved in the research topic (transformation systems) or which are observing or studying a topic related to the research topic of the researcher. For instance stakeholder interviews are conducted with representatives of donor agencies and governmental agencies. Donor policies, e.g. through support for conservation and REDD projects (e.g. Harapan Rainforest or Berbak Carbon Project) may alter land use policies and land use decisions. Governmental agencies e.g. through the implementation of transmigration projects have the potential to foster transformational change. To understand the stakeholders’ entitlements we apply semi-structured

11
interviews with key informants of all below mentioned stakeholder groups. Based on the scope of our research we in particular focus on the following stakeholder groups:
• Government agencies: 1. national level, 2. provincial level, 3. district level, 4. sub-district level, 5. village level.
• Donor agencies (no specific scale or level) • Private sector: 1. transnational companies, 2. Indonesian companies, 3. local agents such
as rubber and palm oil factories and rubber and oil palm traders. 4. Village level agents such as farming groups.
• Academia: Researcher observing the research topic from Indonesia and beyond, researchers are therefore not “classical” stakeholders.
• Non-governmental organizations (NGOs): 1. transnational, 2. national, 3. local.
Complementary we conduct focus group discussions with stakeholders on the village level:
1. peasant farmers, 2. customary institution, 3. village leaders, 4. farmer groups, 5. women groups, 6. youth groups, 7. traders.
The objective of group discussions is foremost to gain (semi) public opinions connected to social relations and situations. The central idea behind this is to use dynamics of conversations to explore different views and perceptions, supported by more spontaneous and therefore authentic comments in certain situations than those expressed in interviews. Of main interest for the present research collaboration are processes of land use change and their causes. Collective communication patterns hardly capture genuine opinions in single interviews but will rather be obtained in public, social group situations. Individual opinions are not just produced through the group process. They might have existed before, but their verbal expression will be facilitated through the group discussion. The confidence in the group facilitates more openness than in standardized individual interview situations, which are usually conducted by the research team focusing on a single household alone. During the process of group building for focus group discussion it is intended to create manifold groups of individuals of different ethnic backgrounds, gender, and social status. Interviews and focus group discussions are recorded, transcribed and coded with Atlas Ti or MAXQDA. 2.2.2 Participatory tools Participant observation As parts of the interviews as well as the group discussions focus on sensitive topics such as poverty, ethnicity, land size as well as the illegal exploitation of commodities from the Bukit Duabelas National Park (TNBD) and the Harapan Conservation Forest, we build up closeness and trust with the local households. Therefore we chose to begin the field studies with participant observation. During participant observation the researcher takes on a role in the social situation under observation. The researcher gets immersed herself/himself in the social setting under study, getting to know key actors in that location in a role with is either covert or overt, although in practice the researcher will often move between the two roles. The aims of this research tool are to experience events in a manner in which the subjects under study also experience these events and to discover the nature of social reality by understanding the actor’s perception, understanding and interpretation of that social world (Atkinson and Hammersley 2005).

12
Participatory observation is conducted in an unstructured, non-standardized and open manner within the existing social world of the village. This means participation in the community life. Further opportunities utilized to better embed the research team in the daily village life are for instance participation in religious and cultural activities (as mutual church visits with the author or mosque visits with the research assistants), farming group meetings and daily work activities, which range from participation in the daily life of the guest families to participation in school classes or the cleaning of village property. Leisure activities are used to build up trust and closeness as well. These informal ways of obtaining data provide an important corrective against information which will be received from formal interviews (Binternagel 2011: 45f). Participant observation is also the process enabling researchers to learn about the activities of the people under study in the natural setting through observing and participating in those activities. It provides the context for development of sampling guidelines and interview guides (DeWalt and DeWalt 2002) and was used as a starting point for further in depth research. Participatory mapping Participatory mapping is a group-based qualitative research tool that gives participants freedom to shape discussion or minimal intervention from researchers. Mapping can generate a rich understanding of the connections between people, places, natural resources and institutions/organizations over space and/or time. Fig. 4: Participatory village mapping
Source: Village case study, Beckert 2012.

13
Village transect Village transects are cross-sectional representation of the different agro-ecological zones. They provide information on land use, vegetation and crops according to topography, land type and ownership. Village or settlement transects are an important method to approach emic concepts and categories of land and resource use. Village transects were combined with resource mapping on village level. Resource maps on village level provide information on natural resources, land use patterns and village boundaries. Social mapping Social mapping depicts the composition and distribution of ethnic/cultural groups within the villages. This method also generates information about the village layout, the infrastructure and supports the tracing of village and population chronic. Social mapping was carried out in cooperation with villagers, preferably with the village secretary (Sekdes) or the head of economic village affairs (Kepala Urusan Pembangunan). The social village mapping was combined with village transects. 2.3 Household case studies The household selection is based on the following criteria: ethnic/cultural group, time since living in the village, subsistence strategies. To cover a wide range of households and cross cut the selected criteria the household case studies usually started in the oldest dusun of a village and continued in a chronological order to the last founded dusun. Within the dusun the households were selected by the ethnic/cultural background of the household heads and the time since living in the village. Household case studies are also coordinated with the quantitative household survey to create a common and in depth database on selected households (n = 60 – 80). 2.3.1 Problem-centered interviews All interviews followed the problem-centered interview approach. This approach is exceptionally suitable for more comprehensive samples of up to 100 interviews, as is the case with the present studies. The interviews are structured by a flexible questionnaire allowing, e.g. for non-standardized comments and explanations, as well as the incidental coverage of additional aspects when deemed necessary by the interviewer. The design of the questionnaires itself are comprised by headwords of the most important questions, without any rigid order. Questions are randomly asked according to the progression of the interview. There is no fixed pattern; rather similar topics in the guide are summarized to blocks. To obtain the best possible research outcome and to build trust, the interviews are conducted in places as familiar as possible to the respondents, usually at their homes or directly on the plots during lunch break. We try to avoid already conduct interviews at the first contact with respondents. Therefore we establish contacts in advance during participatory observations or earlier group discussions in the village. The interviews are conducted in Bahasa Indonesia supported by Indonesian research assistants whilst being recorded. In a second step, the interviews are transcribed and translated into English. To avoid a loss of side information and to immediately clarify misunderstandings, we discuss and document the relevant outcome and circumstances with the research assistants after each interview (Binternagel 2011: 56). To identify interview partners for problem centered interviews related to specific questions, we mainly used the snowball system.

14
2.3.2 Timelines The timeline method supports the exploration of the temporal dimension of people´s realities. The distinctive feature of this method is that it allows people to apply their own concept of time. Timeline captures the chronology of events as recalled by local people. It is drawn as a sequential aggregate of past events and thus provides the historical landmark of a community. However, it is not history as such but events of the past as perceived and recalled by the people themselves. Timelines giving a general historic profile of villages are the most common ones. Regarding the overall research topic, we conduct timelines modified and focused on the chronology of land use changes in the respective villages. Certain other major development interventions having a direct or indirect bearing on social and environmental changes are also recalled. This includes major migration events, infrastructure projects, or political and legal restraints. Local people may talk about a particular impact but may not recall the exact time period because they might possess own concepts of time and do not remember in terms of the Gregorian calendar but in the chronology of important local events experienced in their lives. With the outcome of the timeline method the researchers are enabled to present the respondents a local timeframe and the households are able to converge perceived changes with dates (Binternagel 2011: 47). Analysis of kinship relations (Genealogy) means the study of families and the tracing of their kinship relations and histories. This participatory tool was conducted with members of the local autochthonous population. It provides information on marriage and inheritance patterns associated with access to resources, land/tree tenure and land use systems. Further it gives information on interaction between cultural groups and shifting ethnic and social identities also related to the allocation of resources and land use systems. 2.4 Comparative cultural study In a first step of the comparative cultural study an overview on cultural groups living in the research locations is compiled. After identifying different groups, similarities and differences between these groups in respect to land/resource use and engagement in different rainforest transformation systems are investigated. For each group the relevance of cultural factors as drivers for preferences in land uses systems shall be analyzed. This implies fieldwork in different places known as “multi-sited ethnography” (Marcus 1998). A total of 10 villages or settlements (about 2 per sociocultural group) were chosen in the explorative phase of the research. We select at least one village or settlement of each cultural group which will constitute a sample for further comparative research between cultural groups within and between the two research “landscapes”. In the villages or settlements, a combination of participant observation and different participatory tools are applied (see 2.2 and 2.3), completed by open and semi-structured interviews. Certain aspects of these interviews are further explored by using structured interviews. Information on the village level is supplemented with external data already collected by other institutions and organizations such as the Provincial Government and NGOs. In order to obtain the necessary quantity and depth of data we cooperate with several research assistants (junior Indonesian scholars). Each of them conducts the field research in one of the research sites chosen and each works with a selected range of identical research question. The data obtained in these different sites will then serve as the basis for the comparison. Regular meetings will be held to discuss the intermediary results and to adapt the research questions if necessary.

15
3. Conceptual procedure of quantitative studies 3.1 Research hypotheses The following hypotheses, which are listed according to data source, will be tested in the course of the research project.
Mainly related to village survey H12: Land allocation to different transformation systems is determined by socio-economic and
agroecological conditions of the village.
H13: Social and institutional capital varies across villages and influences land allocation at the village level.
H14: Contractual agreements with oil palm companies vary across villages depending on institutional and social capital variables.
Mainly related to household survey H15: There are notable differences in the profitability of different transformation systems.
H16: The profitability of a given transformation system varies regionally and between farms.
H17: Land use change decisions of farmers are determined by a wide array of farm, household and contextual variables.
H18: Policies, institutions and price developments affect micro level decision-making on land use change.
H19: The oil palm expansion entails higher average household incomes, more employment and lower poverty levels.
H20: The oil palm expansion contributes to higher income inequality.
H21: Household income and income distribution effects vary regionally with differences in institutional and policy conditions.
H22: Increasing cash crop orientation leads to higher calorie consumption but lower dietary diversity.
H23: Nutrition effects vary regionally with differences in institutional and policy conditions.
H24: Differences in technical efficiency between smallholders within the same transformation system as well as differences in the distribution of technical efficiency between different transformation systems are substantial.
H25: Differences in environmental efficiency between smallholders are substantial, and the best practice frontier functions between the transformation systems differ along intensity gradients.
Mainly related to trader survey H26: Product prices (and hence economic outcomes) for smallholders depend crucially on the
specific organization of the local value chain. Village traders are able to exercise market power, based on market imperfections on the farmers’ side: asymmetric information and credit constraints.

16
H27: Stakeholders at all stages along the value chain exercise market power, with a special focus on crumb rubber factories and village traders.
H28: Crumb rubber factories are able to exercise market power due to cartelization.
H29: International market developments are important drivers for the developments in the value chain for oil palms and rubber, moderated by national and regional policy environments.
Mainly related to field experiments H30: The majority of Indonesian farmers are risk-averse.
H31: Risk aversion varies among Indonesian farmers and depends inter alia on the financial situation of the farm-household.
H32: Conversion triggers obtained from the real options approach are significantly higher than conversion triggers obtained from classical investment theory and therefore classical models overestimate the willingness to switch to a more sustainable land use system.
H33: The specific starting position (e.g., with and without reconversion options) has a significant impact on the difference between the trigger of the real options approach and of the classical investment theory.
H34: The economic-ecological trade-offs of transformation systems with different intensities are misestimated if the risk attitude of decision makers is not taken into account.
H35: The willingness to accept of Indonesian farmers to deliver additional ecological functions calculated with normative models is comparable to the results of surveys.
H36: Higher individual compensations lead to transformation systems with higher overall levels of ecological and socio-economic functions.
H37: Joint compensation mechanisms increase the effectiveness of the payment scheme.
H38: Compensation mechanisms can be designed that influence the spatial distribution of transformation systems leading to higher levels of ecological functions.
H39: The effectiveness of different compensation mechanisms depends on individual and collective characteristics of decision makers.
3.2 The village survey 3.2.1 Sampling procedure Five regencies, which comprise most of the lowland transformation systems of Jambi province, were selected purposively. These regencies are Sarolangun, Bungo and Tebo as the ones in proximity of the Bukit Duableas National Park as well as Batanghari and Muaro Jambi, representing the Harapan Rainforest research area. In order to capture geographical disparity and regional diversity, the number of villages per regency and district was fixed. From each of the selected regencies, five districts and four rural villages from each of these districts were selected randomly. In addition, the villages where the core research plots are, were also included in the sample. Although there are 6 core plot villages, one of them (Bungku) was already included in the list of random villages. While coverage of 100 villages was initially planned, due to logistical reasons only 98 villages (see appendix for the list of villages). During the survey the exact location of the sample villages was geo-referenced and mapped (Fig. 5).

17
Fig. 5: Village survey
3.2.2 Objectives of the village survey and questionnaire design The overall goal of the village survey is to analyze the determinants of land allocation in lowland rainforest areas at the village level. Special emphasis is put on the role of socio-economic and agro-ecological conditions as well as contractual arrangements for land allocation. In the selected villages, interviews were carried out with a group of key informants, which included the village head as well as other important stakeholders in the village, using a structured questionnaire. The following information was collected in the survey (1) land allocation (2) demographic characteristics (3) economic income activities including contractual arrangements (4) access to resources and technology use (5) institutional aspects (6) conflicts concerning land and resource use (7) input and output prices (8) risk perceptions (9) village organizations. In order to analyze changes over time, data on village-level characteristics and land allocation were recalled for the years 1992, 2002 and 2012. The questionnaire was pre-tested several times in collaboration with the Indonesian counterparts, and was translated to Bahasa Indonesia using the service of a professional translating agency from Jambi. This questionnaire was explained to the enumerators in a workshop held at the University of Jambi (UNJA). The interviews with key informants were conducted between October and December 2012.

18
3.3 The household survey 3.3.1 Sampling procedure In a first step, 40 villages were chosen from the list of villages selected for the village survey in order to reduce time and costs of the household survey. Specifically, four districts and two rural villages from the already selected districts and villages were selected randomly. The core plot village of Bungku was again already included in the list of randomly selected villages leading to 40 randomly and 5 purposively selected villages for the household survey. With the exception of Pematang Kabau (Sarolangun), the household survey was conducted in the same villages as the village survey (see Fig. 5 and Fig.6, list of the selected villages see appendix). Following village selection, a complete list of households from each of the selected villages was developed using a team of 5 enumerators. In the villages without published list of households and occupation, enumerators visited every RT (“Rukun Tetangga”; neighborhood head) and compiled the list with the help of the heads of RTs. The team also collected basic village-level information from the head of the village and the village secretary (e.g. number of farming households, number of traders etc.). The initial estimation of the data collected shows that 35% of the sample farmers cultivate oil palm and 75% rubber (Fig. 6). In three of the sample villages, only marginal area was under plantation crops. Significant diversity is found across the selected villages with respect to a number of characteristics, especially ethnicity and population density. The available secondary data (based on PODES2 2008) supports this observation. Fig. 6: Shares of rubber and oil palm cultivation on village level
2 PODES = Potensi Desa is a statistical village survey which is issued by the Indonesian Central Bureau of Statistics (Badan Pusat Statistik, BPS)
19
Sampling a constant number of households (for example, 15 households per village) across these villages would critically under-represent households from larger villages and over-represents those from smaller villages. To reduce the magnitude of this problem, we divide the randomly selected villages into four quarters based on population size. Only 6 households were selected from each of the 10 villages that come in the lowest quartile, 12/village from second quartile, 18/village from third and 24/village from the largest quartile, resulting in a total sample size of 600. This selection was based on the number of total households per village, which is strongly correlated with number of farmers per village (corr. coef: +0.90). Additionally, 20 households were selected from each of the 5 purposively selected villages. The selection was purposively for the farmers owning the core plots and randomly for the remaining households in these villages. 3.3.2 Objectives of the household survey and questionnaire design The overall goal of the household survey is to understand the micro-level determinants of recent land use changes in lowland rainforest areas and to quantify their impacts on the welfare of smallholder farm households. Keeping this goal in focus, the household survey is primarily designed to examine the adoption pattern and factors influencing adoption of different land use systems by the smallholder farmers of Jambi province, compare the economic profitability, and impacts of these changes on farmer income, income distribution and livelihoods. Special emphasis is placed on the role of institutional conditions like land rights, migration, contracts with companies, farmer group participation etc. The exact location of the sample households was geo-referenced and mapped. The first round of this survey was conducted from September to December 2012; a second round is planned for 2015. The questionnaire was designed in five different sections (1) current land use patterns and changes over years (2) institutional framework (migration, contracts etc.) (3) input-output data from all major crop plots (4) off-farm income details and (5) consumption details. The questions from other CRC 990 sub-projects were included as a different sub-section, which was administered only in the six core-plot villages. Input-output and income details were collected over a period of one year, preceding the survey implementation. There were historical information collected on institutions and land use changes. On the other hand, consumption details from previous week and year was collected for food and non-food items, respectively. The number of crops being cultivated determined the length of questionnaire, which ranged from 25 pages (no plantation crops) to 52 pages (cultivates oil palm, plantation and jungle rubber). The questionnaire was pre-tested several times to ensure consistency and accuracy of the data, and was translated to Bahasa Indonesia using the service of a professional translating agency from Jambi. This questionnaire was explained to the enumerators in a workshop conducted at UNJA, with the help of the Indonesian counterpart. Data collection took place between October and December 2012. 3.3.3 Ecological extension of the household survey In addition to the five sections of the household questionnaire a supplemental survey collecting ecological data was conducted. Exactly one third of the previously sampled households of the household survey were re-sampled to record information on the status of biological diversity and ecological functionality on the plantations sites. With the given figures from the household data collection the largest plot of the farmer was selected on which plant abundance and species richness data as well as soil samples and biomass data was gathered. This environmental data set in combination with the household survey data gives us the unique opportunity to broaden a
20
technical efficiency analysis towards comprehensive environmental efficiency measures, possibly at different regional scales. Therefore the objective of this additional collected data is to elucidate differences in environmental efficiency between smallholders in the same transformation system as well as differences between the different transformation systems. 3.4 Trader survey For the analyses of the regional rubber and oil palm value chains an interview-based trader survey was carried out with 335 local middlemen and small traders in the five regions of the household survey (around 80% of all active traders in the region). In the explorative field trip, rubber oriented villages showed the most complex local trading schemes, with between one and 15 local middlemen and traders. On average, in each of the 40 villages about eight interview partners were interviewed. Based on the information gained from the interviews, about 25 larger local traders and regional stockholders for rubber were identified and interviewed, so that the total sample consists of 360 observations. The questionnaire for the trader survey collected information on the involvement of the middlemen in palm oil and rubber marketing. The regional rubber value chain is of particular interest: the linkages between smallholders and middlemen are far more complex than a simple supplier-buyer relationship. Frequently, middlemen grant long-term credit to the farmers at nominally zero interest rate. They recover their refinancing cost (including profit) by differentiating the price they pay for the delivered rubber. The actual sources of refinancing are often larger (regional) traders, where again no nominal interest rate is part of the credit agreement. These complex institutional arrangements turn the true capital costs elusive so that credit markets are likely to be incomplete and inefficient. The interviews capture the full complexity of these arrangements at the various levels and are augmented by data on the sources of information gathering concerning prices, market development, policies, etc., as well as ethnological aspects. The data for the trade flow and price transmission analyses is based on secondary data. Regional, national and international statistical agencies collect a multitude of price information at various levels. The trade flows for palm oil (crude and refined) and rubber products will be obtained from Global Trade Information Services (GTIS) at the Harmonized System (HS) code on a six digits level (palm oil: HS 151110, 151190, rubber HS 40011x). Via the HS code every product that is traded internationally can be identified unambiguously and is mainly used for definitions of tariff duties. Information on relevant policy instruments (e.g., export taxes) will be obtained from provincial and national authorities. Data on prices at different stages were obtained from associations of processors, as well as trading enterprises on the national level. In combination, quantity and price data will allow for a comprehensive assessment of the integration of the regional and international markets for palm oil and rubber. 4. Economic field experiments 4.1. Risk attitudes In order to estimate the risk attitude of farmers in Indonesia, we carried out field experiments following Holt and Laury (2002) which are designed to be incentive compatible. During the Lottery comparisons are preferred over a certainty equivalent method because they avoid possible distortions by a certainty effect (Levy and Levy, 2002). This method is also favored over psychometric scales (e.g., Zuckerman, 1971), the lottery is based on monetary choices
21
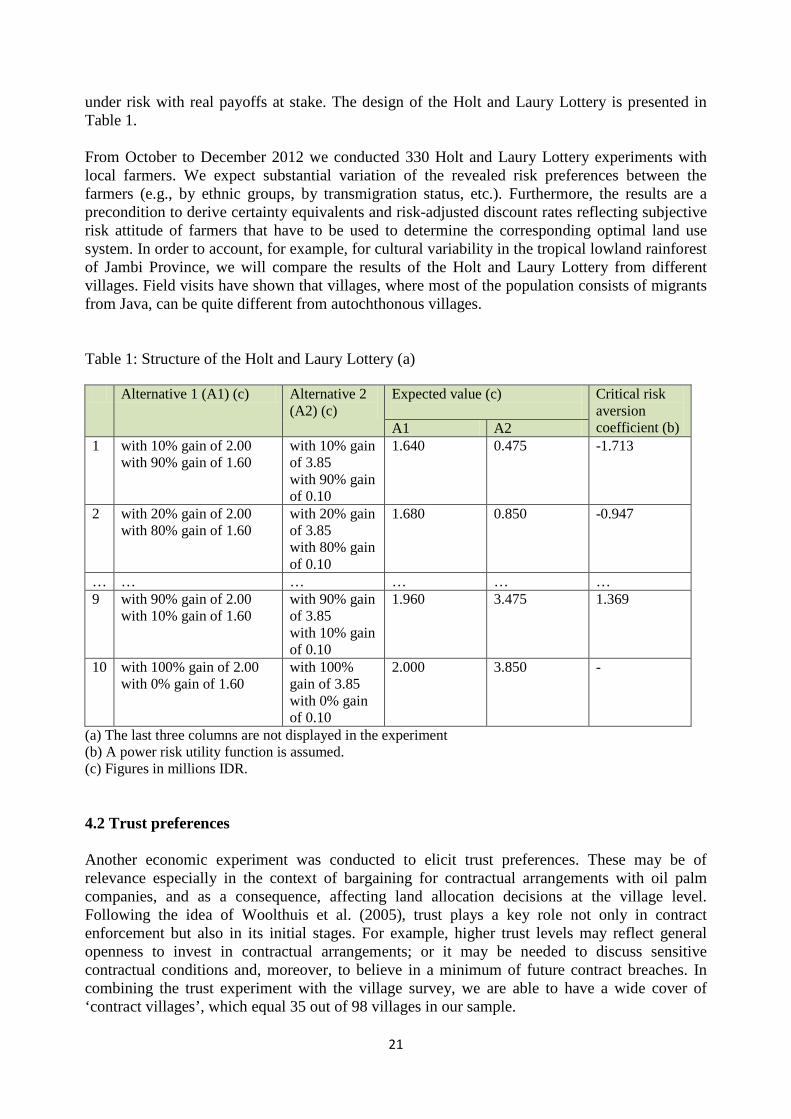
under risk with real payoffs at stake. The design of the Holt and Laury Lottery is presented in Table 1. From October to December 2012 we conducted 330 Holt and Laury Lottery experiments with local farmers. We expect substantial variation of the revealed risk preferences between the farmers (e.g., by ethnic groups, by transmigration status, etc.). Furthermore, the results are a precondition to derive certainty equivalents and risk-adjusted discount rates reflecting subjective risk attitude of farmers that have to be used to determine the corresponding optimal land use system. In order to account, for example, for cultural variability in the tropical lowland rainforest of Jambi Province, we will compare the results of the Holt and Laury Lottery from different villages. Field visits have shown that villages, where most of the population consists of migrants from Java, can be quite different from autochthonous villages. Table 1: Structure of the Holt and Laury Lottery (a) Alternative 1 (A1) (c) Alternative 2
(A2) (c) Expected value (c)
Critical risk aversion coefficient (b) A1 A2
1 with 10% gain of 2.00 with 90% gain of 1.60
with 10% gain of 3.85 with 90% gain of 0.10
1.640 0.475 -1.713
2 with 20% gain of 2.00 with 80% gain of 1.60
with 20% gain of 3.85 with 80% gain of 0.10
1.680 0.850 -0.947
… … … … … … 9 with 90% gain of 2.00
with 10% gain of 1.60 with 90% gain of 3.85 with 10% gain of 0.10
1.960 3.475 1.369
10 with 100% gain of 2.00 with 0% gain of 1.60
with 100% gain of 3.85 with 0% gain of 0.10
2.000 3.850 -
(a) The last three columns are not displayed in the experiment (b) A power risk utility function is assumed. (c) Figures in millions IDR. 4.2 Trust preferences Another economic experiment was conducted to elicit trust preferences. These may be of relevance especially in the context of bargaining for contractual arrangements with oil palm companies, and as a consequence, affecting land allocation decisions at the village level. Following the idea of Woolthuis et al. (2005), trust plays a key role not only in contract enforcement but also in its initial stages. For example, higher trust levels may reflect general openness to invest in contractual arrangements; or it may be needed to discuss sensitive contractual conditions and, moreover, to believe in a minimum of future contract breaches. In combining the trust experiment with the village survey, we are able to have a wide cover of ‘contract villages’, which equal 35 out of 98 villages in our sample.
22
In each of the 98 villages a randomly selected amount of households was invited to participate in the experiment. In total we played the trust experiment with about 460 farmers. For synergy reasons, we attempted to identify the same households in the overlapping villages with C07. The trust experiment is a standard experiment conducted already many times in several countries (Cardenas and Carpenter, 2008). We adjusted the experiments to abide to local ethical norms, which resulted, among others, in giving out voucher mobile cards instead of real money. Preliminary results reveal that trust levels are higher for ‘contract villages’ than villages without any contract. Deeper analysis will focus on the impact of this finding on contract formation and its conditions in which we will control for village characteristics, ethnical diversity and especially the government-initiated transmigrant program, which has already been identified as relevant in land allocation decisions at the village level. 4.3. Incentive mechanisms for sustainable land use options In recent years payments for environmental services (PES) have been praised as a promising policy instrument to motivate land users to conserve by creating an exchange value for ecosystem services (Narloch et al. 2011). Increasing evidence shows that the political and social legitimacy of PES schemes and thus the sustainability of a program is closely associated with the fair distribution of costs and benefits within the society. Fairness is often associated with the aspect of pro-poor targeting, i.e. the extent to which the poor have access to the scheme or can benefit from a scheme (Narloch et al. 2013). We investigate the effects of different compensation mechanisms on land allocation, cost-effectiveness and equity considerations under endowment and productivity heterogeneity. Between November 2012 and February 2013, we conducted a public good experiment. Participants were randomly matched into groups of three individuals. Each game participant was endowed with a fixed number of land units (e). To account for heterogeneity in land endowments, we form heterogeneous groups of two participants with e=5 and of one participant with e=10. Each participant had to decide how much of their land endowment they allocate to oil palm and jungle rubber, respectively. Decisions were made anonymously and without communication between participants. While each unit allocated to oil palm led to a return of one, each unit allocated to jungle rubber generated a return of less than one representing the fact that oil palm is more profitable to the individual farmer than jungle rubber. In addition, we included the positive externalities generated by jungle rubber (increased biodiversity, watershed protection, erosion control) by increasing the other group members’ income by b for each unit invested in jungle rubber. We chose b such that we produce a situation of a social dilemma. The pay-off function for individual i can thus be expressed as: (1) 𝜋𝑖 = 𝑥𝑖 + 𝑎(𝑒 − 𝑥𝑖) + 𝑏 ∑ (𝑒 − 𝑥𝑗)𝑛
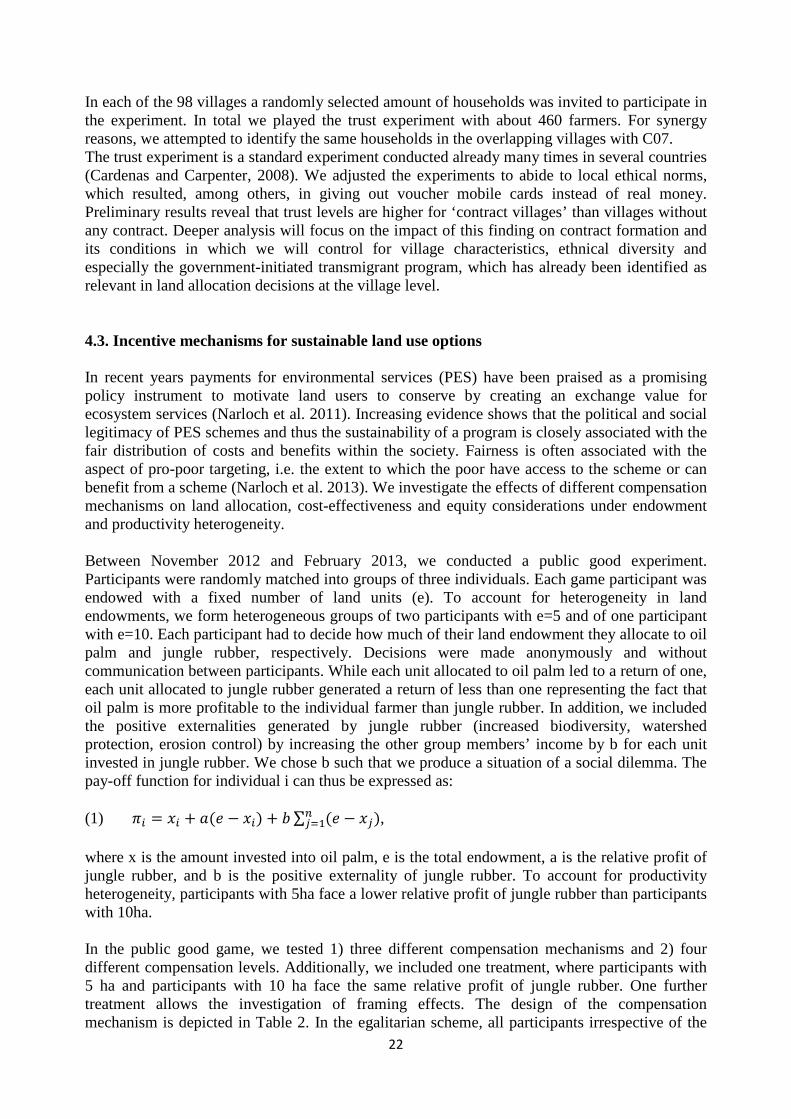
𝑗=1 , where x is the amount invested into oil palm, e is the total endowment, a is the relative profit of jungle rubber, and b is the positive externality of jungle rubber. To account for productivity heterogeneity, participants with 5ha face a lower relative profit of jungle rubber than participants with 10ha. In the public good game, we tested 1) three different compensation mechanisms and 2) four different compensation levels. Additionally, we included one treatment, where participants with 5 ha and participants with 10 ha face the same relative profit of jungle rubber. One further treatment allows the investigation of framing effects. The design of the compensation mechanism is depicted in Table 2. In the egalitarian scheme, all participants irrespective of the

23
opportunity costs to convert from oil palm into jungle rubber, received a flat compensation per ha conserved. The pro-poor compensation scheme accounts for inequality in opportunity costs by paying a higher share of compensation to farmers with 5 ha. In the threshold scheme the group has to reach a certain threshold of conservation area to receive compensation. Table 2: Design of the compensation mechanisms Compensation mechanism Egalitarian “Pro-poor” Threshold
Endowment heterogeneity (ha) 5 10 5 10 5 10 Productivity heterogeneity (relative profit of jungle rubber)
0.5 0.6 0.5 0.6 0.5 0.6
PES scheme (relative compensation for jungle rubber cultivation) Between subject design Pij (i=1,2) Within subject design Pij (j=1,2)
P11 0.05 0.05 0.10 0 0.05 0.05 P12 0.25 0.25 0.30 0.20 0.25 0.25 P21 0.10 0.10 0.15 0.05 0.10 0.10 P22 0.30 0.30 0.35 0.25 0.30 0.30
The public good game was carried out in two transmigrant (Bukit Sari, Bukit Harapan) and two autochthonous villages (Pulau Betung, Kameo) in Batanghari district. In all four villages jungle rubber and oil palm cultivation can be found. Based on a village census, in each village 250 household heads that cultivate rubber and/or oil palm were randomly selected to participate in the workshop. All subjects were paid privately using checks made payable for them in their local shops.
24
References Achard F et al. (2002) Determination of deforestation rates of the world's humid tropical forests.
Science 297: 999-1002. Arrow K et al. (1995) Economic growth, carrying capacity, and the environment. Science 268:
520-521. Atkinson P, Hammersley M (2005) Ethnography and participant observation. Denzim, N K and
Y S Lincoln (Eds.): Handbook of qualitative research. Sage Publications, London, New Delhi: 248-260.
Badan Pusaat Statistik Jambi (2011) Jambi dalam angka. (Self-published) Balvanera P et al. (2006) Quantifying the evidence for biodiversity effects on ecosystem
functioning and services. Ecology Letters 9: 1146-56. Bell T et al. (2009) A linear model method for biodiversity–ecosystem functioning experiments.
American Naturalist 174: 836–849. Bennett EM et al. 2009) Understanding relationships among multiple ecosystem services.
Ecology Letters 12: 1394-1404. Bhagwat SA, Willis KJ (2008) Agroforestry as a solution to the oil-palm debate. Conservation
Biology 22: 1368–1369. Binternagel N (2011) Adaptation to natural hazards in Central Sulawesi, Indonesia - strategies of
rural households. Dissertation, Göttingen. Boerner J et al. (2007) Ecosystem services, agriculture, and rural poverty in Eastern Brazilian
Amazon: interrelationships and policy prescriptions. Ecological Economics 64: 356-373. Cardenas JC, Carpenter J (2008) Behavioural development economics: lessons from field labs in
the developing world. Journal of Development Studies 44 (3): 311-338. Chavas JP et al. (2009): Organic and conventional production systems in the Wisconsin
integrated cropping systems trial - II. Economic and risk analysis 1993-2006. Agronomy Journal 101: 288-295
Chhatre A, Agrawal A (2009). Trade-offs and synergies between carbon storage and livelihood benefits from forest commons. Proceedings of the National Academy of Sciences of the USA 106: 17667–17670.
Danielsen F et al. (2009) Biofuel plantations on forested lands: Double jeopardy for biodiversity and climate. Conservation Biology 23: 348-358.
De Haan L, Zoomers A. (2003) Development geography at the crossroads of livelihood and globalisation. Tijdschrift voor economische en sociale geografie 94(3): 350-362.
DeWalt KM., DeWalt BR (2002) Participant observation: a guide for fieldworkers. Walnut Creek, CA: AltaMira Press.
Ellis F (2000) Rural livelihoods and diversity in developing countries. Oxford University Press. Oxford.
Fahrig L et al. (2010) Functional landscape heterogeneity and animal biodiversity in agricultural landscapes. Ecology 14: 101–112.
Feintrenie L, Levang P (2009) Sumatra´s Rubber Agroforests: Advent, Rise and Fall of a Sustainable Cropping System. Small-scale Forestry. Research Paper.
Feintrenie L et al. (2010): Why do farmers prefer Oil Palm. Lessons Learnt from Bungo District, Indonesia. In: Small-scale Forestry 9:379–396.
Feintrenie L et al. (2010) Are local people conservationists? Analysis of transition dynamics from agroforests to monoculture plantations in Indonesia. Ecology and Society 15: 37.
Flitner M, Görg C (2008) Politik im Globalen Wandel–räumliche Maßstäbe und Knoten der Macht. Brunnengräber A, Burchardt HJ, Görg C (eds.) Mit mehr Ebenen zu mehr Gestaltung.
Gatti R et al. (2011) The biodiversity bargaining problem. Environmental and Resource Economics 48: 609-628.

25
Gaveau DLA et al. (2007) Three decades of deforestation in southwest Sumatra: Have protected areas halted forest loss and logging, and promoted re-growth? Biological Conservation 134: 495-504.
Giam X et al. (2010) The extent of undiscovered species in Southeast Asia. Biodiversity and Conservation 19: 943-954.
Godfray HCJ et al. (2010) Food security: the challenge of feeding 9 billion people. Science 327: 812-818.
Hanski I, Gilpin M (1997) Metapopulation biology: ecology, genetics, and evolution. Academic Press, San Diego.
Harrison, G, List, J (2004) Field experiments. Journal of Economic Literature 42(4): 1009–1055. Hector A, Bagchi R (2007) Biodiversity and ecosystem multifunctionality. Nature 448: 188–190. Holt CA, Laury SK (2002) Risk aversion and incentive effects. American Economic Review 92:
1644-1655. Holt RD et al. (1999) Trophic rank and the species-area relationship. Ecology 80: 1495-1504. Hooper DU et al. (2005) Effects of biodiversity on ecosystem functioning: a consensus of current
knowledge. Ecological Monographs 75: 3–35. Ibanez M, Martinsson P (2007): Can we do policy recommendations from a framed field
experiment? The case of coca cultivation in Colombia. Working Papers in Economics 306. University of Gothenburg. School of Business, Economics and Law.
Kenward RE et al. (2011) Identifying governance strategies that effectively support ecosystem services, resource sustainability, and biodiversity. Proceedings of the National Academy of Sciences 108: 5308-5312.
Klasen S et al. (2010) Cash crop choice and rural income dynamics in post-crisis Indonesia. Courant Research Center Working Paper No. 33.
Klasen S et al. (2010): Demography, Development, and Deforestation at the Rainforest Margin in Indonesia. Tscharntke T et al. (eds.): Tropical rainforests and agroforests under global change – Ecological and socio-economic valuations. Springer. Berlin: 213-236
Koh LP et al. (2009) Designer landscapes for sustainable biofuels. Trends in Ecology and Evolution 24: 431-438.
Lambin EF et al. (2001): The causes of land-use and land-cover change. Moving beyond the myths. In: Global Environmental Change, 11, 261-269.
Laumonier Y et al. (2010) Eco-floristic sectors and deforestation threats in Sumatra: identifying new conservation area network priorities for ecosystem-based land use planning. Biodiversity and Conservation 19: 1153-1174.
Laurance WF (2008) Theory meets reality: How habitat fragmentation research has transcended island biogeographic theory. Biological Conservation 141: 1731-1744.
Levin SA (1992). The problem of pattern and scale in ecology. Ecology 73: 1943-1967. Levy M, Levy H (2002) Prospect theory: Much ado about nothing. Management Science 48:
1334-1349. Lichtenberg E et al. (2010) Natural resource economics and conservation: contributions of
agricultural economics and agricultural economists. American Journal of Agricultural Economics 92(S1): 469-486.
Milfont, T, Duckitt J (2010): Environmental attitudes inventory: a valid and reliable measure to assess the structure of environmental attitudes. Journal of Environmental Psychology 30: 80-94.
MA (Millenium Ecosystem Assessment) (2005) Ecosystems and human well-being: Synthesis. Island Press, Washington DC.
Marcus, GE (1998) The Emergence of Multi-Sited Ethnography. Marcus GE (ed.) Ethnography through Thick and Thin. Princeton: Princeton University Press
26
Martini E. et al. (2010) Rubber agroforests and governance at the interface between conservation and livelihoods in Bungo district, Jambi province, Indonesia. Working paper 124. Bogor, Indonesia: World Agroforestry Centre.
MacArthur RH, Wilson EO (1967) The theory of island biogeography. Princeton University Press, Princeton.
Meyer KM et al. (2010) Crossing scales in ecology. Basic and Applied Ecology 11: 561-562. Murdiyarso D et al. (2002) Environmental Benefits and Sustainable Land-Use Options in the
Jambi Transect, Sumatra, Indonesia. Journal of Vegetation Science 3(13): 429-438 Naeem D et al. (2009) Biodiversity, ecosystem functioning and human wellbeing - An ecological
and economic perspective. Oxford University Press, Oxford. Narloch, U et al. (2011) Cost-effectiveness targeting under multiple conservation goals and
equity consideration in the Andes. Environmental Conservation 38: 417-425 Narloch U et al. (2013) How to achieve fairness in payments for ecosystem services? Insights
from agrobiodiversity conservation auctions, Land Use Policy 35: 107-118 Nelson E et al. (2009) Modeling multiple ecosystem services, biodiversity conservation,
commodity production, and tradeoffs at landscape scales. Frontiers in Ecology and the Environment 7: 4–11.
O'Neill RV et al. (1986) A hierarchical concept of ecosystems. Princeton University Press, Princeton.
Ostrom E (2009) A general framework for analyzing sustainability of social-ecological systems. Science 325: 419-22.
Paquette A, Messier C (2011) The effect of biodiversity on tree productivity: From temperate to boreal forests. Global Ecology and Biogeography 20: 170-80.
Perfecto I, Vandermeer J (2010) The agroecological matrix as alternative to the land sparing/agriculture intensification model. Proceedings of the National Academy of Sciences 107: 5786-5791.
Polasky S. et al. (2008) Where to put things? Spatial land management to sustain biodiversity and economic returns. Biological Conservation 141: 1505 –1524.
Power AG (2010) Ecosystem services and agriculture: tradeoffs and synergies. Philosophical Transactions of the Royal Society B: Biological Sciences 365: 1554 (2959-2971.
Raudsepp-Hearne C et al. (2010) Ecosystem service bundles for analyzing tradeoffs in diverse landscapes. Proceedings of the National Academy of Sciences 107: 5242-5247.
Priess JA et al. (2007) Linking deforestation scenarios to pollination services and economic returns in coffee agroforestry systems. Ecological Applications 17: 407-417.
Rodrigues ASL et al. (2009) Boom-and-Bust development patterns across the Amazon deforestation frontier. Science 324: 1435-1437.
Scherer-Lorenzen M et al. (2007) Exploring the functional significance of forest diversity: a new longterm experiment with temperate tree species (BIOTREE). Perspectives in Plant Ecology, Evolution and Systematics 9: 53-70.
Schneider DC (2001) The rise of the concept of scale in ecology. BioScience 51: 545-553. Scoones I (2009) Livelihood perspectives and rural development. Journal of Peasant Studies.
Vol. 36, No. 1. pp: 171-196. Steffan-Dewenter I et al. (2007) Tradeoffs between income, biodiversity, and ecosystem
functioning during tropical rainforest conversion and agroforestry intensification. PNAS 104: 4973-4978.
Stork NE et al. (2009) Vulnerability and resilience of tropical forest species to land-use change. Conservation Biology 23: 1438-47.
Tscharntke T et al. (2005) Landscape perspectives on agricultural intensification and biodiversity - ecosystem service management. Ecology Letters 8: 857-74.
27
United Nations (UN) (2007) Framework Convention on Climate Change. Report of the Conference of the Parties on its thirteenth session. http://unfccc.int/resource/docs/2007/cop13/eng/06.pdf. [03.05.2013].
Woolthuis RK et al. (2005) Trust, contract and relationship development. Organization Studies 26: 813-840.
World Bank (2007) World development report: agriculture for development. Oxford University Press, New York.
Wilcove DS, Koh LP (2010) Addressing the threats to biodiversity from oil-palm agriculture. Biodiversity and Conservation 19: 999-1007.
Zuckerman M (1971): Dimensions of sensation seeking. Journal of Consulting and Clinical Psychology 36: 45-52.

28
List of authors and contributions
Project titles and descriptions are available on http://www.uni-goettingen.de/en/412101.html Authors’ addresses via http://www.uni-goettingen.de/en/staff/412128.html
(SP = Subproject)
Beckert, Barbara, Ph.D. candidate, Human Geography, SP C02: chapter 2.2
Brümmer, Bernhard, Prof. Dr., Agricultural Economics and Rural Development, SP C01: chapter 3.4
Dittrich, Christoph, Prof. Dr., Human Geography, SP C02: chapter 2
Euler, Michael Ph.D. candidate, Agricultural Economics and Rural Development, SP C07: Chapter 3.3
Faust, Heiko, Prof. Dr., Human Geography, SP C02: Chapter 1 and 2
Gatto, Marcel, Ph.D. candidate, Agricultural Economics and Rural Development SP08: Chapter 3.2 and 4.2
Hauser-Schäublin, Brigitta, Prof. Dr., Cultural and Social Anthropology, SP C03: Chapter 2
Hein, J., Ph.D. candidate, German Development Institute (DIE), SP02: Chapter 2.2.1
Holtkamp, Anna Mareike, Ph.D. candidate, Agricultural Economics and Rural Development, SP C01: chapter 3.3.3
Ibanez, M., Jun.-Prof., CRC Poverty, Equity and Growth, SP08: Chapter 3
Klasen, Stephan, Prof. Ph.D., Development Economics, SP C04: Chapter 3
Kopp, Thomas, Ph.D. candidate Agricultural Economics and Rural Development, SP C01: chapter 3.4
Krishna, Vijesh, Dr., Agricultural Economics and Rural Development, SP C07: Chapter 3.2 and 3.3
Kunz, Yvonne, Ph.D. candidate, Human Geography, SP 02: Chapter 2.2
Lay, Jann, Prof. Dr., Development Economics, SP C04: Chapter 3
Mußhoff, Oliver, Prof. Dr., Agricultural Economics and Rural Development, SP C06: Chapter 4
Qaim, Matin, Prof. Dr., Agricultural Economics and Rural Development, SP C07: Chapter 1 and 3
Schwarze, Stefan, Dr., Agricultural Economics and Rural Development, SP C07: Chapter 3
Steinebach, Stefanie, Dr., Cultural and Social Anthropology, SP C03: Chapter 2.2 and 2.3
Vorlaufer, Miriam, Ph.D. candidate, Agricultural Economics and Rural Development, SP C08: Chapter 4
Wollni, Meike, Jun.-Prof. Dr., Agricultural Economics and Rural Development, SP C08: Chapter 4
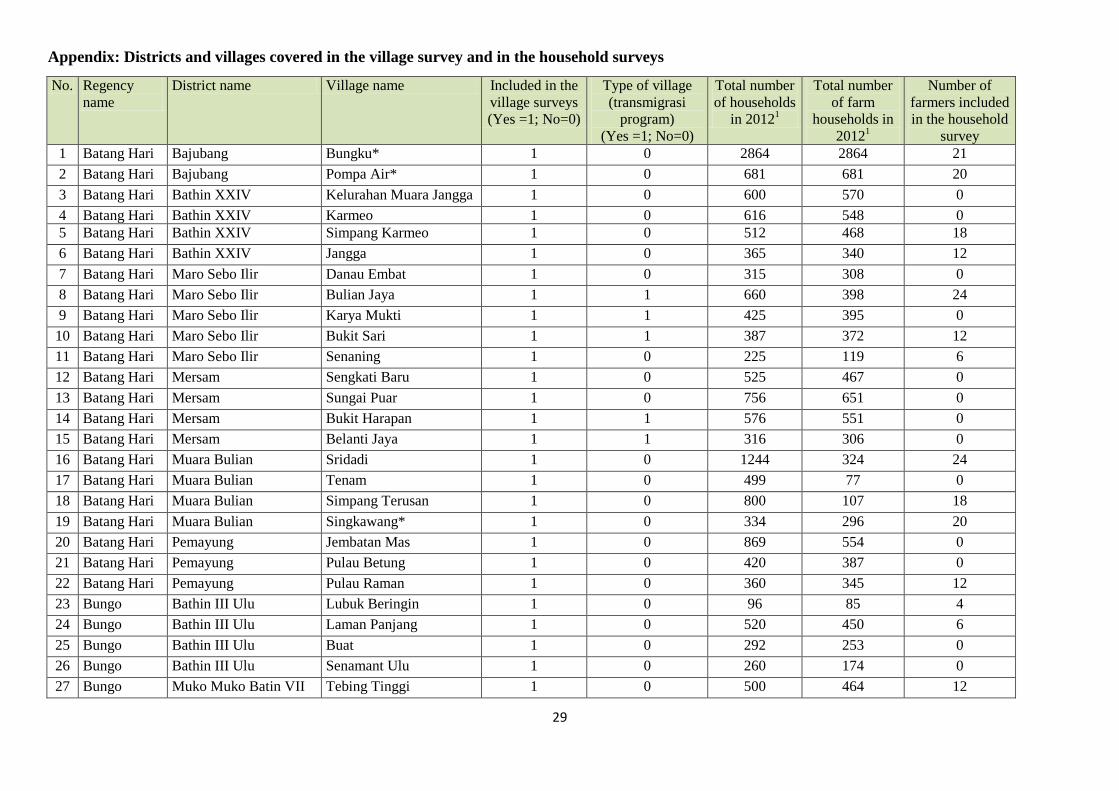
29
Appendix: Districts and villages covered in the village survey and in the household surveys
No. Regency name
District name Village name Included in the village surveys (Yes =1; No=0)
Type of village (transmigrasi
program) (Yes =1; No=0)
Total number of households
in 20121
Total number of farm
households in 20121
Number of farmers included in the household
survey 1 Batang Hari Bajubang Bungku* 1 0 2864 2864 21 2 Batang Hari Bajubang Pompa Air* 1 0 681 681 20 3 Batang Hari Bathin XXIV Kelurahan Muara Jangga 1 0 600 570 0 4 Batang Hari Bathin XXIV Karmeo 1 0 616 548 0 5 Batang Hari Bathin XXIV Simpang Karmeo 1 0 512 468 18 6 Batang Hari Bathin XXIV Jangga 1 0 365 340 12 7 Batang Hari Maro Sebo Ilir Danau Embat 1 0 315 308 0 8 Batang Hari Maro Sebo Ilir Bulian Jaya 1 1 660 398 24 9 Batang Hari Maro Sebo Ilir Karya Mukti 1 1 425 395 0 10 Batang Hari Maro Sebo Ilir Bukit Sari 1 1 387 372 12 11 Batang Hari Maro Sebo Ilir Senaning 1 0 225 119 6 12 Batang Hari Mersam Sengkati Baru 1 0 525 467 0 13 Batang Hari Mersam Sungai Puar 1 0 756 651 0 14 Batang Hari Mersam Bukit Harapan 1 1 576 551 0 15 Batang Hari Mersam Belanti Jaya 1 1 316 306 0 16 Batang Hari Muara Bulian Sridadi 1 0 1244 324 24 17 Batang Hari Muara Bulian Tenam 1 0 499 77 0 18 Batang Hari Muara Bulian Simpang Terusan 1 0 800 107 18 19 Batang Hari Muara Bulian Singkawang* 1 0 334 296 20 20 Batang Hari Pemayung Jembatan Mas 1 0 869 554 0 21 Batang Hari Pemayung Pulau Betung 1 0 420 387 0 22 Batang Hari Pemayung Pulau Raman 1 0 360 345 12 23 Bungo Bathin III Ulu Lubuk Beringin 1 0 96 85 4 24 Bungo Bathin III Ulu Laman Panjang 1 0 520 450 6 25 Bungo Bathin III Ulu Buat 1 0 292 253 0 26 Bungo Bathin III Ulu Senamant Ulu 1 0 260 174 0 27 Bungo Muko Muko Batin VII Tebing Tinggi 1 0 500 464 12
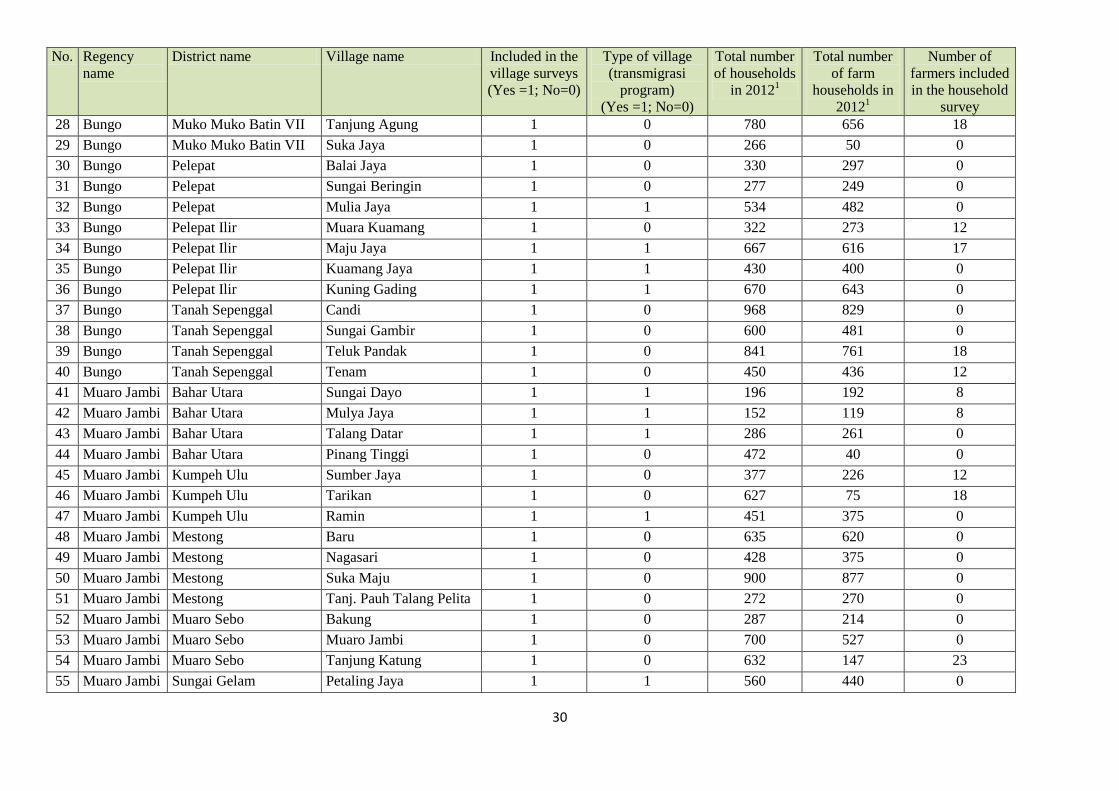
30
No. Regency name
District name Village name Included in the village surveys (Yes =1; No=0)
Type of village (transmigrasi
program) (Yes =1; No=0)
Total number of households
in 20121
Total number of farm
households in 20121
Number of farmers included in the household
survey 28 Bungo Muko Muko Batin VII Tanjung Agung 1 0 780 656 18 29 Bungo Muko Muko Batin VII Suka Jaya 1 0 266 50 0 30 Bungo Pelepat Balai Jaya 1 0 330 297 0 31 Bungo Pelepat Sungai Beringin 1 0 277 249 0 32 Bungo Pelepat Mulia Jaya 1 1 534 482 0 33 Bungo Pelepat Ilir Muara Kuamang 1 0 322 273 12 34 Bungo Pelepat Ilir Maju Jaya 1 1 667 616 17 35 Bungo Pelepat Ilir Kuamang Jaya 1 1 430 400 0 36 Bungo Pelepat Ilir Kuning Gading 1 1 670 643 0 37 Bungo Tanah Sepenggal Candi 1 0 968 829 0 38 Bungo Tanah Sepenggal Sungai Gambir 1 0 600 481 0 39 Bungo Tanah Sepenggal Teluk Pandak 1 0 841 761 18 40 Bungo Tanah Sepenggal Tenam 1 0 450 436 12 41 Muaro Jambi Bahar Utara Sungai Dayo 1 1 196 192 8 42 Muaro Jambi Bahar Utara Mulya Jaya 1 1 152 119 8 43 Muaro Jambi Bahar Utara Talang Datar 1 1 286 261 0 44 Muaro Jambi Bahar Utara Pinang Tinggi 1 0 472 40 0 45 Muaro Jambi Kumpeh Ulu Sumber Jaya 1 0 377 226 12 46 Muaro Jambi Kumpeh Ulu Tarikan 1 0 627 75 18 47 Muaro Jambi Kumpeh Ulu Ramin 1 1 451 375 0 48 Muaro Jambi Mestong Baru 1 0 635 620 0 49 Muaro Jambi Mestong Nagasari 1 0 428 375 0 50 Muaro Jambi Mestong Suka Maju 1 0 900 877 0 51 Muaro Jambi Mestong Tanj. Pauh Talang Pelita 1 0 272 270 0 52 Muaro Jambi Muaro Sebo Bakung 1 0 287 214 0 53 Muaro Jambi Muaro Sebo Muaro Jambi 1 0 700 527 0 54 Muaro Jambi Muaro Sebo Tanjung Katung 1 0 632 147 23 55 Muaro Jambi Sungai Gelam Petaling Jaya 1 1 560 440 0

31
No. Regency name
District name Village name Included in the village surveys (Yes =1; No=0)
Type of village (transmigrasi
program) (Yes =1; No=0)
Total number of households
in 20121
Total number of farm
households in 20121
Number of farmers included in the household
survey 56 Muaro Jambi Sungai Gelam Ladang Panjang 1 0 1902 1670 24 57 Muaro Jambi Sungai Gelam Talang Belido 1 0 1003 927 0 58 Muaro Jambi Sungai Gelam Parit 1 0 675 613 18 59 Muaro Jambi Taman Rago Tebat Patah 1 0 250 216 8 60 Sarolangun Air Hitam Mentawak Ulu 1 1 564 440 0 61 Sarolangun Air Hitam Lubuk Kepayang* 1 0 425 383 20 62 Sarolangun Air Hitam Desa Baru* 1 0 721 600 20 63 Sarolangun Air Hitam Pematang Kabau 0 1 733 620 24 64 Sarolangun Limun Pulau Pandan 1 0 363 276 0 65 Sarolangun Limun Moenti 1 0 235 165 0 66 Sarolangun Limun Temenggung 1 0 1800 1620 0 67 Sarolangun Limun Muara Mansao 1 0 428 380 0 68 Sarolangun Pauh Batu Kucing 1 0 861 840 0 69 Sarolangun Pauh Pangidaran 1 0 204 183 0 70 Sarolangun Pauh Pauh* 1 0 2500 2424 20 71 Sarolangun Pauh Semaran 1 0 423 402 12 72 Sarolangun Pauh Danau Serdang 1 0 274 274 6 73 Sarolangun Pelawan Pematang Kolim 1 1 800 690 24 74 Sarolangun Pelawan Batu Putih 1 1 642 637 18 75 Sarolangun Pelawan Muara Danau 1 0 236 219 0 76 Sarolangun Pelawan Pelawan Jaya 1 0 508 411 0 77 Sarolangun Singkut Bukit Murau 1 1 1653 1488 24 78 Sarolangun Singkut Pasar Singkut 1 1 1338 1300 0 79 Sarolangun Singkut Payo Lebar 1 1 1248 1148 24 80 Sarolangun Singkut Bukit Tigo 1 0 1000 35 0 81 Tebo Rimbo Ilir Sari Mulya 1 1 1102 1030 0 82 Tebo Rimbo Ilir Giri Purno 1 1 640 566 0 83 Tebo Rimbo Ilir Sepakat Bersatu 1 0 335 305 6

32
No. Regency name
District name Village name Included in the village surveys (Yes =1; No=0)
Type of village (transmigrasi
program) (Yes =1; No=0)
Total number of households
in 20121
Total number of farm
households in 20121
Number of farmers included in the household
survey 84 Tebo Sumay Jati Belarik 1 0 210 204 0 85 Tebo Sumay Teriti 1 0 328 221 12 86 Tebo Sumay Teluk Langkap 1 0 417 385 0 87 Tebo Sumay Muara Sekalo 1 0 230 114 6 88 Tebo Tebo Tengah Bedaro Rampak 1 0 744 670 0 89 Tebo Tebo Tengah Sungai Keruh 1 0 867 778 0 90 Tebo Tebo Tengah Tebing Tinggi 1 0 1637 1070 1 91 Tebo Tebo Ulu Giriwinangun 1 1 1259 1043 24 92 Tebo Tebo Ulu Pulau Panjang 1 0 552 309 12 93 Tebo Tebo Ulu Tanjung Aur 1 0 414 400 0 94 Tebo Tebo Ulu Rantau Langkap 1 0 444 406 19 95 Tebo Tebo Ulu Teluk Kasai Rambahan 1 0 293 277 0 96 Tebo VII Koto Teluk Kayu Putih 1 0 1418 1354 0 97 Tebo VII Koto Aur Cino 1 0 700 615 20 98 Tebo VII Koto Sungai Abang 1 0 1100 1040 0 99 Tebo VII Koto Muara Tabun 1 0 255 250 6