Embed Size (px)
Citation preview

Assessment of Soft Vane and Metal FoamEngine Noise Reduction Concepts
M. G. Jones∗and T. L. Parrott†
NASA Langley Research Center, Hampton, VA 23681and
D. L. Sutliff‡and C. E. Hughes§
NASA Glenn Research Center, Cleveland, OH 44135
Two innovative fan-noise reduction concepts developed by NASA are presented - soft vanesand over-the-rotor metal foam liners. Design methodologies are described for each concept.Soft vanes are outlet guide vanes with internal, resonant chambers that communicate withthe exterior aeroacoustic environment via a porous surface. They provide acoustic absorp-tion via viscous losses generated by interaction of unsteady flows with the internal solidstructure. Over-the-rotor metal foam liners installed at or near the fan rotor axial planeprovide rotor noise absorption. Both concepts also provide pressure-release surfaces thatpotentially inhibit noise generation. Several configurations for both concepts are evaluatedwith a normal incidence tube, and the results are used to guide designs for implementationin two NASA fan rigs. For soft vanes, approximately 1 to 2 dB of broadband inlet andaft-radiated fan noise reduction is achieved. For over-the-rotor metal foam liners, up to3 dB of fan noise reduction is measured in the low-speed fan rig, but minimal reduction ismeasured in the high-speed fan rig. These metal foam liner results are compared with astatic engine test, in which inlet sound power level reductions up to 5 dB were measured.Brief plans for further development are also provided.
I. Introduction
Two promising aircraft engine noise reduction concepts, soft vanes and over-the-rotor (OTR) metal foamliners (see Fig. 1), have been developed by NASA over the last eight years. Each is believed to reduce the fannoise radiated to the community via two mechanisms. First, they provide acoustic absorption by inducingviscous dissipation at internal solid structure surfaces (chamber walls for soft vanes, structural ligaments forfoam). Second, they provide pressure-release surfaces (softening of the surface to reduce pressure) in thenear-field of the noise generation process, thereby reducing radiation efficiency. The first of these concepts isthe soft vane,1 wherein a portion of the fan exit guide vane surface is made porous to allow communicationbetween pressure fluctuations at the vane surface and multiple, internal, resonant chambers. The internalchambers and porous surface are designed to an optimum impedance, such that maximum sound absorptionis achieved. This impedance boundary condition also provides pressure release (relative to the rigid surface itreplaces) at the surface of the fan exit guide vane. Soft vanes are intended to reduce rotor-stator interactionnoise radiated through the inlet and aft-fan duct.
The second concept is a metal foam liner that is embedded in the nacelle wall. It is generally locatedat or near the fan rotor plane, and is thus described as an OTR metal foam liner.2 The harsh aeroacousticenvironment has heretofore prevented conventional liner installation at this location. Instead, this portion ofthe nacelle wall consists of the fan containment case, which is intended to contain a blade that breaks away
∗Senior Research Scientist, Research and Technology Directorate, Structural Acoustics Branch, AIAA Associate Fellow.†Senior Research Scientist, Research and Technology Directorate, Structural Acoustics Branch.‡Aerospace Engineer, Research and Technology Directorate, Acoustics Branch, AIAA Senior Member.§Aerospace Engineer, Research and Technology Directorate, Acoustics Branch, AIAA Senior Member.
1 of 20
American Institute of Aeronautics and Astronautics
https://ntrs.nasa.gov/search.jsp?R=20090020438 2019-01-02T17:44:58+00:00Z
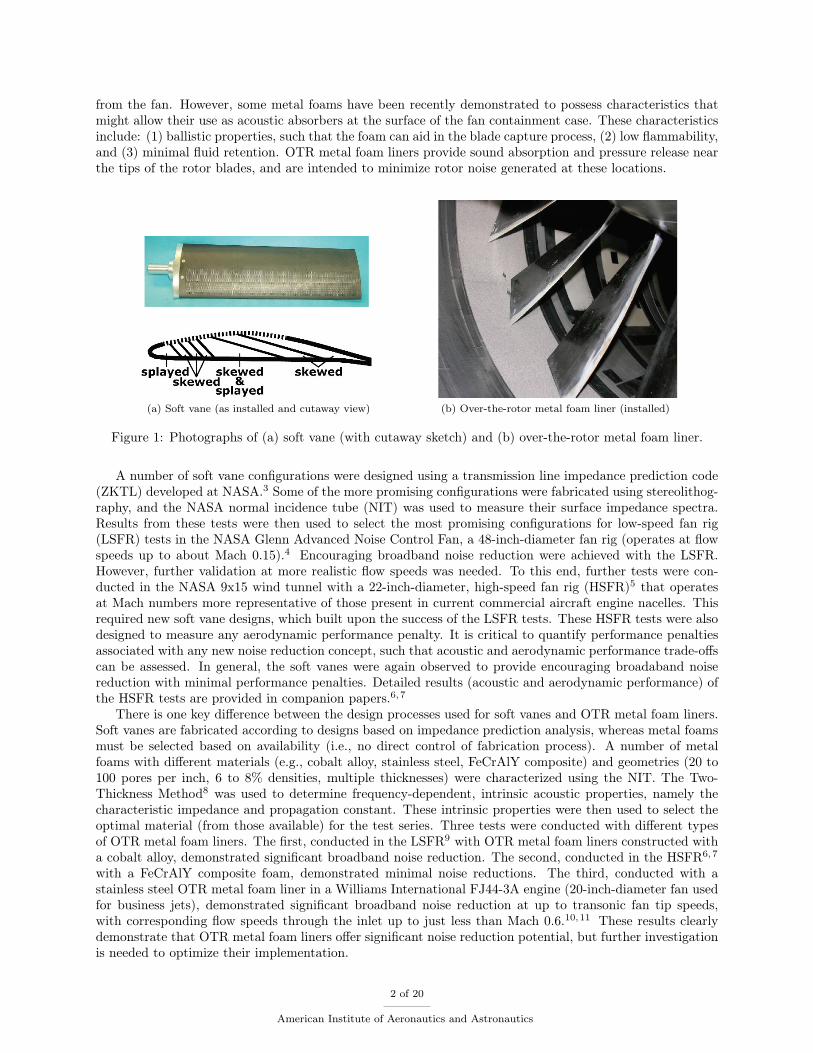
from the fan. However, some metal foams have been recently demonstrated to possess characteristics thatmight allow their use as acoustic absorbers at the surface of the fan containment case. These characteristicsinclude: (1) ballistic properties, such that the foam can aid in the blade capture process, (2) low flammability,and (3) minimal fluid retention. OTR metal foam liners provide sound absorption and pressure release nearthe tips of the rotor blades, and are intended to minimize rotor noise generated at these locations.
(a) Soft vane (as installed and cutaway view) (b) Over-the-rotor metal foam liner (installed)
Figure 1: Photographs of (a) soft vane (with cutaway sketch) and (b) over-the-rotor metal foam liner.
A number of soft vane configurations were designed using a transmission line impedance prediction code(ZKTL) developed at NASA.3 Some of the more promising configurations were fabricated using stereolithog-raphy, and the NASA normal incidence tube (NIT) was used to measure their surface impedance spectra.Results from these tests were then used to select the most promising configurations for low-speed fan rig(LSFR) tests in the NASA Glenn Advanced Noise Control Fan, a 48-inch-diameter fan rig (operates at flowspeeds up to about Mach 0.15).4 Encouraging broadband noise reduction were achieved with the LSFR.However, further validation at more realistic flow speeds was needed. To this end, further tests were con-ducted in the NASA 9x15 wind tunnel with a 22-inch-diameter, high-speed fan rig (HSFR)5 that operatesat Mach numbers more representative of those present in current commercial aircraft engine nacelles. Thisrequired new soft vane designs, which built upon the success of the LSFR tests. These HSFR tests were alsodesigned to measure any aerodynamic performance penalty. It is critical to quantify performance penaltiesassociated with any new noise reduction concept, such that acoustic and aerodynamic performance trade-offscan be assessed. In general, the soft vanes were again observed to provide encouraging broadaband noisereduction with minimal performance penalties. Detailed results (acoustic and aerodynamic performance) ofthe HSFR tests are provided in companion papers.6,7
There is one key difference between the design processes used for soft vanes and OTR metal foam liners.Soft vanes are fabricated according to designs based on impedance prediction analysis, whereas metal foamsmust be selected based on availability (i.e., no direct control of fabrication process). A number of metalfoams with different materials (e.g., cobalt alloy, stainless steel, FeCrAlY composite) and geometries (20 to100 pores per inch, 6 to 8% densities, multiple thicknesses) were characterized using the NIT. The Two-Thickness Method8 was used to determine frequency-dependent, intrinsic acoustic properties, namely thecharacteristic impedance and propagation constant. These intrinsic properties were then used to select theoptimal material (from those available) for the test series. Three tests were conducted with different typesof OTR metal foam liners. The first, conducted in the LSFR9 with OTR metal foam liners constructed witha cobalt alloy, demonstrated significant broadband noise reduction. The second, conducted in the HSFR6,7
with a FeCrAlY composite foam, demonstrated minimal noise reductions. The third, conducted with astainless steel OTR metal foam liner in a Williams International FJ44-3A engine (20-inch-diameter fan usedfor business jets), demonstrated significant broadband noise reduction at up to transonic fan tip speeds,with corresponding flow speeds through the inlet up to just less than Mach 0.6.10,11 These results clearlydemonstrate that OTR metal foam liners offer significant noise reduction potential, but further investigationis needed to optimize their implementation.
2 of 20
American Institute of Aeronautics and Astronautics
The purpose of this report is to review current design and evaluation methods used to select soft vane andOTR metal foam liners for tests of increasing complexity. Results from tests with the NIT, the low-speedfan rig (LSFR), the high-speed fan rig (HSFR), and the FJ44-3A engine are presented. The soft vane designmethodology is described, along with the issues that arise with regard to implementation. Soft vane designsfor the LSFR and HSFR are discussed, along with design criteria and results from component evaluationsconducted with the NIT. Since detailed results from the two fan rig tests are provided elsewhere, only limitedresults from each of these tests are discussed. The next sections provide similar discussion for over-the-rotormetal foam liners. The paper closes with concluding remarks regarding the proposed application of each ofthese two novel noise reduction concepts, and offers a brief description of plans for their further development.
II. Soft Vanes
A. Design Methodology
As briefly discused earlier, soft vanes are assumed to provide noise reduction via two mechanisms: (1) passiveabsorption, and (2) pressure release that reduces source efficiency via surface proximity to the near-field ofthe noise generation process. The initial evaluation of this concept was targeted for the LSFR. As willbe discussed in section B, preliminary analysis with a NASA Glenn code12 predicted significant rotor-statorinteraction noise reduction could be achieved if a portion of the vane surface was designed to present a suitableimpedance boundary condition. Previous measurements had indicated that the pressure fluctuations impingeon the surface of the vane at normal incidence (i.e., perpendicular to the surface). The vane surface impedancewas therefore designed to be equal to the characteristic impedance of air, which provides maximum soundabsorption for normal incidence sound waves and, presumably, significant surface softening (i.e., pressurerelease).
There are multiple options to achieve the target surface impedance. Of these, the parallel-elementapproach13 seemed to offer the most flexibility. This approach is based on the use of multiple internalchambers (quarter-wavelength resonators) with respective lengths judiciously chosen to achieve a targetsurface impedance spectrum. However, this approach depends on the ability to package these chambers inthe interior of the vane (see figure 1). As is demonstrated later, this packaging is challenging. For the currentsoft vane designs, the internal chambers are skewed (not perpendicular to the porous surface) and splayed(variable width along the length of the chamber) to comply with vane geometry constraints. Skew effectsare discussed in detail in a companion paper,14 and are incorporated via the modified, equivalent circulardiameter, Ds,i. Splay effects are “smeared” by representing the variable-width chamber as a constant-widthchamber with the same average width. Evaluations of these parameters are described below. The soft vaneswith internal chambers were designed in three distinct phases. In the first, knowledge of the target impedancespectrum is employed to select a combination of internal chambers expected to achieve maximum soundabsorption. The design is targeted toward maximum absorption because this noise reduction mechanism ismuch better understood than the use of a pressure release surface to inhibit noise generation. Next, each ofthe relevant geometric parameters is determined. This includes those that account for the fact that many,if not all, of the chambers are skewed and some are also splayed. Finally, an impedance prediction modelis used to compute the surface impedance of the vane. Each chamber is assumed to contain rigid walls(partitions) to inhibit interaction with adjacent chambers, and to be sufficiently narrow, such that the softvane can be properly modeled as a locally-reacting liner.
1. Design
1. Determine the target surface impedance spectrum based on the rotor-stator interaction noise spectrum
2. Design the initial chambers with depths corresponding to quarter-wavelengths of frequencies with thehighest sound pressure levels (SPL)
3. Design the remaining chambers with depths corresponding to quarter-wavelengths distributed over thefull frequency range of interest, to take full advantage of all available volume within the vane
3 of 20
American Institute of Aeronautics and Astronautics

2. Geometric Parameter Computation
The following steps describe the geometric parameters used in the determination of the impedance of thesoft vane. For convenience, some of the key parameters are shown in Fig. 2.
(a) Individual skewed chamber (b) Individual chamber with embedded barrier
Figure 2: Sketch of individual chamber i; Lp,i,L and Lp,i,R are lengths of left and right partitions, respectively;Wi is width of chamber; φi is skew angle. Embedded barrier separates chamber into spanwise segments.
1. Compute the length, Lp,i, of each partition (walls separating chambers within vane)
2. Compute the average length, Li, of chamber i using
Li = (Lp,i,L + Lp,i,R)/2 (1)
where Lp,i,L and Lp,i,R represent the left and right partition lengths of the chamber, respectively
3. Compute the average width (distance between partitions), Wi, of each chamber
4. Compute the equivalent circular diameter, Di, using
Di = (WiSi)/(Wi + Si) (2)
based on analysis of high aspect ratio channels by Richards,15 where Si represents the span of the ith
chamber (Note: All chambers were assumed to have the same span for the soft vanes included in thesetests.)
5. Compute the skew angle (re normal incidence), φi, of each chamber; i.e., the angle at which the chamberintersects the porous surface (Note: φi = 0◦ corresponds to a chamber that is perpendicular to thesurface.)
6. Compute the modified, equivalent circular diameter, Ds,i, using
Ds,i = Di cos(φi) (3)
to account for skew angle
7. Compute the weighting factor, Fi, corresponding to chamber i using
Fi = Wi/Wsurf (4)
where Wsurf represents the total width of the porous surface
4 of 20
American Institute of Aeronautics and Astronautics
3. Surface Impedance and Absorption Coefficient Predictions
1. Use the Zwikker-Kosten Transmission Line (ZKTL) impedance prediction code3,13 to predict theimpedance spectrum, ζint(f), for the equivalent circular chamber with diameter Ds,i and length Li.The ZKTL code allows for chambers filled with air or bulk material, so long as the intrinsic properties(characteristic impedance and propagation constant) are known. Semi-empirical models exist for manytypes of bulk materials. If there is no known model for the selected material, these properties mustbe experimentally determined. One such approach is to use the Two-Thickness Method8 described insome detail in section III.A.
2. Use the ZKTL code to incorporate the additional impedance, ζfs(f), due to the porous facesheetand/or the fibermetal cover sheet. This component is added to the internal impedance to determinethe surface impedance spectrum
ζi(f) = ζint(f) + ζfs(f) (5)
due to the selected chamber. It should be noted that almost all computations used in this impedanceprediction process are based on linear acoustics. The sole exception to this is the application of thefacesheet impedance, ζfs(f). The ZKTL code allows the actual noise spectrum, if known, to be usedin the determination of this facesheet impedance.
3. Compute the surface admittance spectrum for the individual chamber via
βi(f) = 1/ζi(f) (6)
4. Compute the average admittance
βave(f) =nc∑i=1
Fi βi(f) (7)
over nc chambers, from which the average impedance can be determined using
ζave(f) = 1/βave(f) (8)
5. Compute the absorption coefficient spectrum for normal incidence sound waves as
α(f) =4θave(f)
[θave(f) + 1)2 + χ2ave(f)]
(9)
where θave(f) and χave(f) represent the normalized average resistance and reactance spectra (real andimaginary components of ζave(f), respectively
Note: All impedances in this paper are assumed to be normalized by the characteristic impedance of air, ρc,where ρ and c are the density and sound speed in air, respectively.
B. Low-Speed Fan Rig (LSFR) Test
The Advanced Noise Control Fan, a 48-in-diameter low-speed fan rig (LSFR), was used as a test bed forevaluation of soft vane concepts. This evaluation is divided into three portions. First, soft vanes are designedto maximize noise reduction in the LSFR. Second, samples are fabricated and tested in the NIT. Finally,soft vanes are tested in the LSFR.
5 of 20
American Institute of Aeronautics and Astronautics
1. Design
As mentioned earlier, soft vanes are believed to provide rotor-stator interaction noise reduction via direct(sound absorption) and indirect (use of pressure-release surface to inhibit noise generation process) noisereduction mechanisms. Currently, it is not clear which of these mechanisms is dominant. In fact, since softvanes are placed in the near-field of the rotor-stator interaction, it is likely that there is significant interactionbetween these mechanisms.
An existing database of measured unsteady pressures on a model fan exit guide vane16 was used toestimate the potential noise reduction that could be achieved by replacing the original vanes of the LSFRwith soft vanes. An in-house code12 was used to predict the noise reduction that could be achieved ifa prescribed region of each vane surface was assumed to be compliant with a specified impedance. Forthis initial series of tests, the target noise spectrum was assumed to be uniform over a frequency range of1000 to 3000 Hz. Thus, the goal was to achieve optimum impedance over this frequency range. Previousmeasurements had indicated that the pressure fluctuations impinge on the surface of the vane at normalincidence (i.e., perpendicular to the surface). The target vane surface impedance was therefore assumedto be equal to the characteristic impedance of air (across the frequency range of interest), which providesmaximum sound absorption for normal incidence sound waves. This choice of using the surface impedancespectrum (and hence, the normal incident absorption coefficient spectrum) as the figure of merit was alsoused because it could be easily implemented, whereas the pressure release mechanism (due to the same “soft”surface) is much less understood. Basically, any noise reduction due to the use of a pressure release surfaceto inhibit the noise generation process is treated as an additional benefit, and is not explicitly included inthe design methodology.
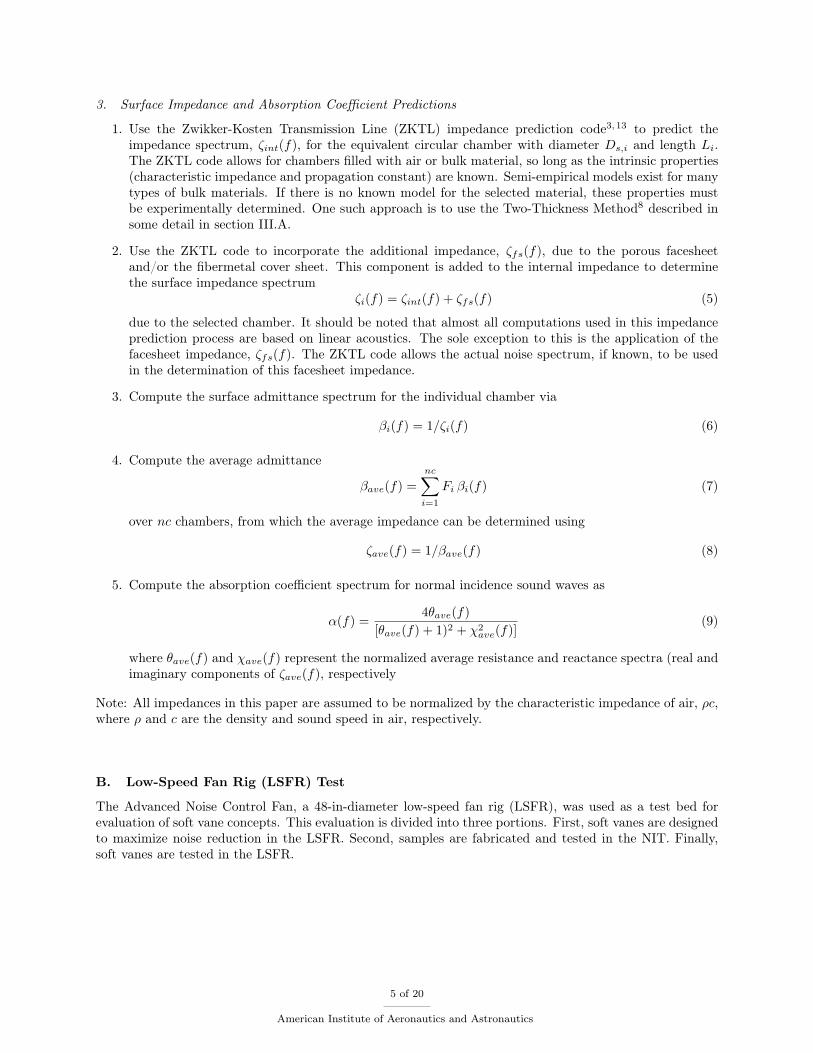
A limited study was performed to determine the optimal portion of the vane surface to have thisimpedance, and the selected “soft” portion is shown as a dotted line in the sketches below (Fig. 3).
(a) Helmholtz Resonator (A1) (b) Quarter-Wavelength Liner 1 (A2)
(c) Quarter-Wavelength Liner 2 (A3)
Figure 3: Sketches of three soft vane configurations.
Given the limited soft vane chord length (less than 4.5 in), a key ingredient of the design methodology was topackage the internal chambers in such a way that the optimum impedance spectrum can be achieved over thefrequency range of 1000 to 3000 Hz. Two general types of soft vane configurations were considered. The firstwas an open resonator design (i.e., a single Helmholtz resonator, with no internal partitions; see Fig. 3-a).The second was a parallel-element design, consisting of multiple, internal, quarter-wavelength chambers (seeFig. 3-b,c) targeted to selected frequencies, and was based on the detailed design methodology discussed insection A. The “soft” surface of each of these vanes consisted of evenly distributed, 0.05-in-diameter holesto provide an open area ratio of approximately 0.3. The normal incidence absorption coefficient spectrum,α(f), was computed for each of these configurations, and was used as the figure of merit for selection ofconfigurations for further study. Since the target noise spectrum was assumed to be uniform, the idealabsorption coefficient spectrum would have a constant value of unity (α(f) = 1).
2. Component Evaluation
Each configuration depicted in Fig. 3 was fabricated via a stereolithography process (e.g., Fig. 4), such thatthey could be conveniently tested with the NIT (Fig. 5). An end cap was used to open one end of eachvane, such that bulk material could be easily inserted into the individual chambers. Each of the selected
6 of 20
American Institute of Aeronautics and Astronautics
configurations was tested with no bulk material inserted into the structure. For frequencies away fromresonance, the measured normalized resistance is approximately 0.2, 0.5, and 0.3 for configurations A1, A2,and A3, respectively. Clearly, the majority of the resistance for configuration A1 is due to the porous surface.The additional resistance measured for the other two configurations is due to viscous scrubbing losses withinthe internal chambers.
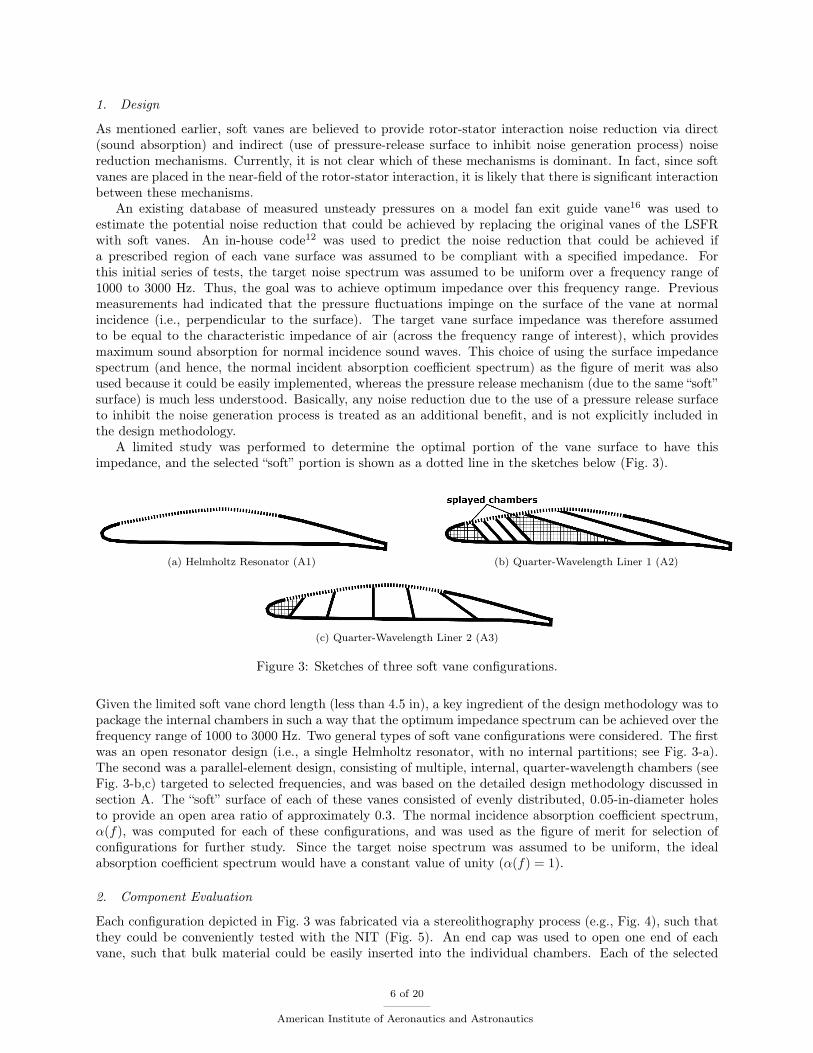
Each of the three soft vanes was also tested with some or all of their chambers filled with either Kevlaror ceramic beads (e.g., Fig. 4). These tests were used to gain additional insight into the effects of varyingthe intrinsic properties of the selected chambers (ζc and Γ). Additional tests were conducted with fibermetalcover sheets to increase the normalized acoustic resistance. Each of these soft vane configurations had theirrespective strengths and weaknesses. For the sake of brevity, the remainder of this discussion is limited toconfiguration A2 (Fig. 3-b), as this soft vane geometry produced the best results in both the component andLSFR evaluations.
Figure 4: Photograph of open (no end cap) soft vane configuration fabricated via a stereolithography process;three chambers filled with ceramic beads.
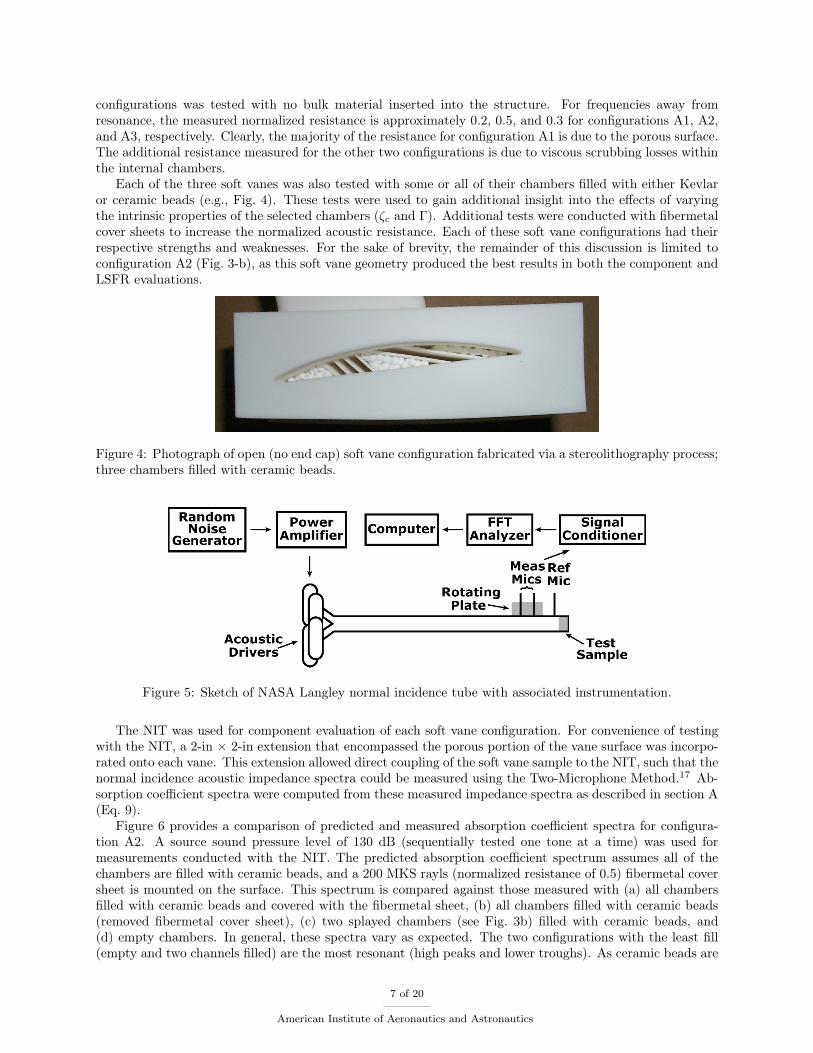
Figure 5: Sketch of NASA Langley normal incidence tube with associated instrumentation.
The NIT was used for component evaluation of each soft vane configuration. For convenience of testingwith the NIT, a 2-in × 2-in extension that encompassed the porous portion of the vane surface was incorpo-rated onto each vane. This extension allowed direct coupling of the soft vane sample to the NIT, such that thenormal incidence acoustic impedance spectra could be measured using the Two-Microphone Method.17 Ab-sorption coefficient spectra were computed from these measured impedance spectra as described in section A(Eq. 9).
Figure 6 provides a comparison of predicted and measured absorption coefficient spectra for configura-tion A2. A source sound pressure level of 130 dB (sequentially tested one tone at a time) was used formeasurements conducted with the NIT. The predicted absorption coefficient spectrum assumes all of thechambers are filled with ceramic beads, and a 200 MKS rayls (normalized resistance of 0.5) fibermetal coversheet is mounted on the surface. This spectrum is compared against those measured with (a) all chambersfilled with ceramic beads and covered with the fibermetal sheet, (b) all chambers filled with ceramic beads(removed fibermetal cover sheet), (c) two splayed chambers (see Fig. 3b) filled with ceramic beads, and(d) empty chambers. In general, these spectra vary as expected. The two configurations with the least fill(empty and two channels filled) are the most resonant (high peaks and lower troughs). As ceramic beads are
7 of 20
American Institute of Aeronautics and Astronautics

Figure 6: Comparison of predicted (configuration A2 with all chambers filled with ceramic beads and afibermetal cover sheet) and measured absorption coefficient spectra; Predicted - black solid line, Measuredwith all chambers filled with ceramic beads and a fibermetal cover sheet - red dashed line, Measured withall chambers filled with ceramic beads - blue dotted line, Measured with two splayed chambers filled withceramic beads - green dashed line, Measured with empty chambers - purple dashed line.
added, these spectra become flatter. Finally, the addition of the fibermetal cover sheet causes the measuredabsorption coefficient spectrum to most closely approach the predicted spectrum.
Ideally, the red dashed line would be well matched with the solid black line, as they represent the measuredand predicted absorption coefficient spectra for the same configuration. While the spectra are similar, theprediction clearly over-predicts the measured absorption. This suggests that further investigation may beneeded into the effects of skewed and splayed chambers. However, there are other potential causes ofthese differences as well. The model assumes complete acoustic isolation between adjacent chambers andrigid termination of each individual chamber. Although efforts were made to ensure conformance to theseconditions, a companion paper14 presents results from more recent tests that indicate the wall thicknessmay have been insufficient. Also, each vane was fabricated with a removable end cap, such that individualchambers could be easily filled with bulk material. While this was valuable for ease of testing, it alsointroduced a path for potential sound leakage. Considering all of these issues, the comparison of predictedand measured absorption coefficient spectra is encouraging.
There are a number of differences between the results measured without the fibermetal cover sheet, but afew of the more significant ones merit discussion. The completely empty vane (purple dashed line) providesabsorption coefficients above 0.5 for all frequencies above approximately 1200 Hz. It also provides two largerabsorption peaks, nearly 1.0 near 1500 Hz and greater than 0.8 above 2800 Hz, and dips to approximately0.55 near 2300 Hz. Three features are of note for the vane completely filled with ceramic beads (blue dottedline). The low-frequency absorption is reduced to approximately 0.7 (still a high absorption value), while thehigh-frequency absorption is increased to approximately 0.9. The dip between these two frequency regimesis slightly increased to approximately 0.6. Finally, the vane with only two chambers filled with ceramicbeads (green dashed line) appears to capture the best of each of the other two configurations. For thisconfiguration, the absorption coefficient peaks approach unity near 1500 and 2800 Hz, with minimal loss ofabsorption for the frequencies between these two limits.
8 of 20
American Institute of Aeronautics and Astronautics
3. Fan Rig Evaluation
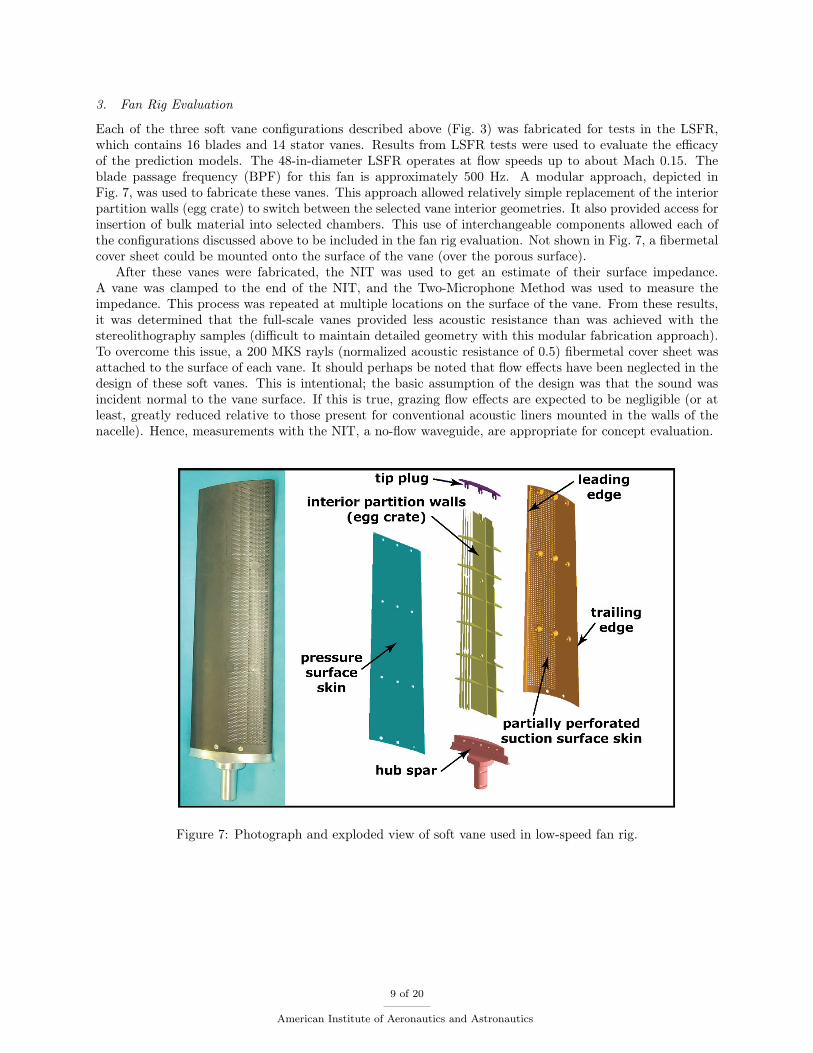
Each of the three soft vane configurations described above (Fig. 3) was fabricated for tests in the LSFR,which contains 16 blades and 14 stator vanes. Results from LSFR tests were used to evaluate the efficacyof the prediction models. The 48-in-diameter LSFR operates at flow speeds up to about Mach 0.15. Theblade passage frequency (BPF) for this fan is approximately 500 Hz. A modular approach, depicted inFig. 7, was used to fabricate these vanes. This approach allowed relatively simple replacement of the interiorpartition walls (egg crate) to switch between the selected vane interior geometries. It also provided access forinsertion of bulk material into selected chambers. This use of interchangeable components allowed each ofthe configurations discussed above to be included in the fan rig evaluation. Not shown in Fig. 7, a fibermetalcover sheet could be mounted onto the surface of the vane (over the porous surface).
After these vanes were fabricated, the NIT was used to get an estimate of their surface impedance.A vane was clamped to the end of the NIT, and the Two-Microphone Method was used to measure theimpedance. This process was repeated at multiple locations on the surface of the vane. From these results,it was determined that the full-scale vanes provided less acoustic resistance than was achieved with thestereolithography samples (difficult to maintain detailed geometry with this modular fabrication approach).To overcome this issue, a 200 MKS rayls (normalized acoustic resistance of 0.5) fibermetal cover sheet wasattached to the surface of each vane. It should perhaps be noted that flow effects have been neglected in thedesign of these soft vanes. This is intentional; the basic assumption of the design was that the sound wasincident normal to the vane surface. If this is true, grazing flow effects are expected to be negligible (or atleast, greatly reduced relative to those present for conventional acoustic liners mounted in the walls of thenacelle). Hence, measurements with the NIT, a no-flow waveguide, are appropriate for concept evaluation.
Figure 7: Photograph and exploded view of soft vane used in low-speed fan rig.
9 of 20
American Institute of Aeronautics and Astronautics
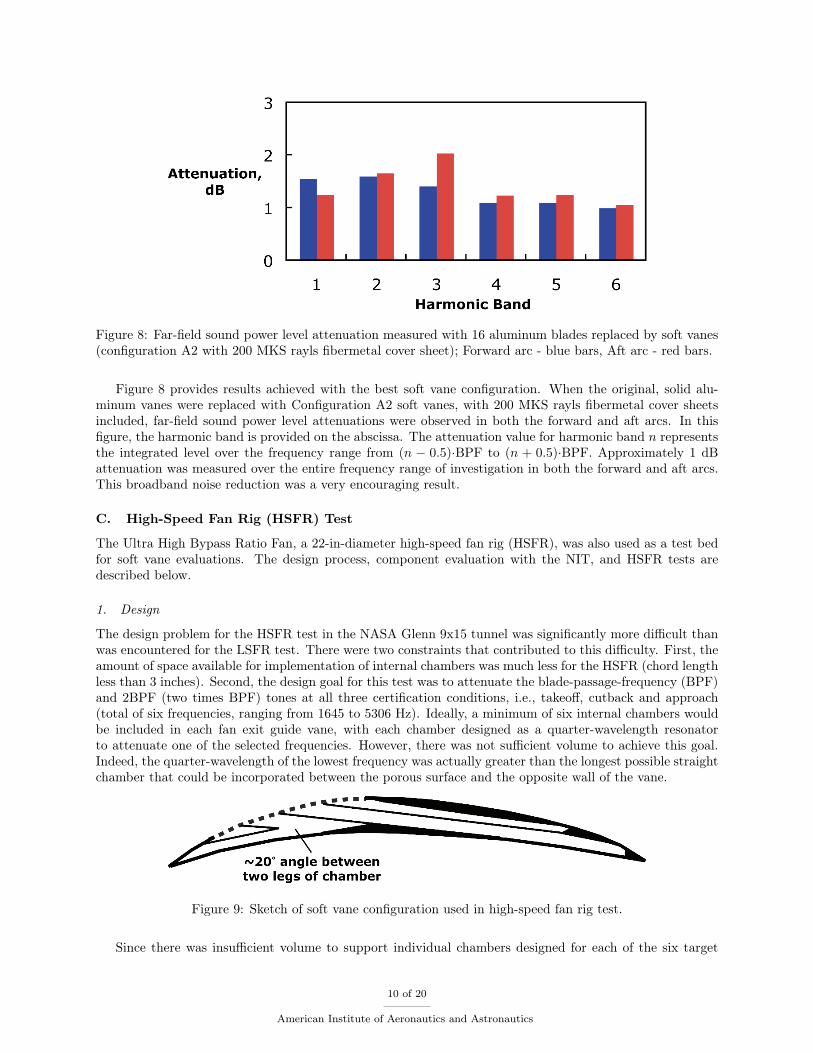
Figure 8: Far-field sound power level attenuation measured with 16 aluminum blades replaced by soft vanes(configuration A2 with 200 MKS rayls fibermetal cover sheet); Forward arc - blue bars, Aft arc - red bars.
Figure 8 provides results achieved with the best soft vane configuration. When the original, solid alu-minum vanes were replaced with Configuration A2 soft vanes, with 200 MKS rayls fibermetal cover sheetsincluded, far-field sound power level attenuations were observed in both the forward and aft arcs. In thisfigure, the harmonic band is provided on the abscissa. The attenuation value for harmonic band n representsthe integrated level over the frequency range from (n − 0.5)·BPF to (n + 0.5)·BPF. Approximately 1 dBattenuation was measured over the entire frequency range of investigation in both the forward and aft arcs.This broadband noise reduction was a very encouraging result.
C. High-Speed Fan Rig (HSFR) Test
The Ultra High Bypass Ratio Fan, a 22-in-diameter high-speed fan rig (HSFR), was also used as a test bedfor soft vane evaluations. The design process, component evaluation with the NIT, and HSFR tests aredescribed below.
1. Design
The design problem for the HSFR test in the NASA Glenn 9x15 tunnel was significantly more difficult thanwas encountered for the LSFR test. There were two constraints that contributed to this difficulty. First, theamount of space available for implementation of internal chambers was much less for the HSFR (chord lengthless than 3 inches). Second, the design goal for this test was to attenuate the blade-passage-frequency (BPF)and 2BPF (two times BPF) tones at all three certification conditions, i.e., takeoff, cutback and approach(total of six frequencies, ranging from 1645 to 5306 Hz). Ideally, a minimum of six internal chambers wouldbe included in each fan exit guide vane, with each chamber designed as a quarter-wavelength resonatorto attenuate one of the selected frequencies. However, there was not sufficient volume to achieve this goal.Indeed, the quarter-wavelength of the lowest frequency was actually greater than the longest possible straightchamber that could be incorporated between the porous surface and the opposite wall of the vane.
Figure 9: Sketch of soft vane configuration used in high-speed fan rig test.
Since there was insufficient volume to support individual chambers designed for each of the six target
10 of 20
American Institute of Aeronautics and Astronautics
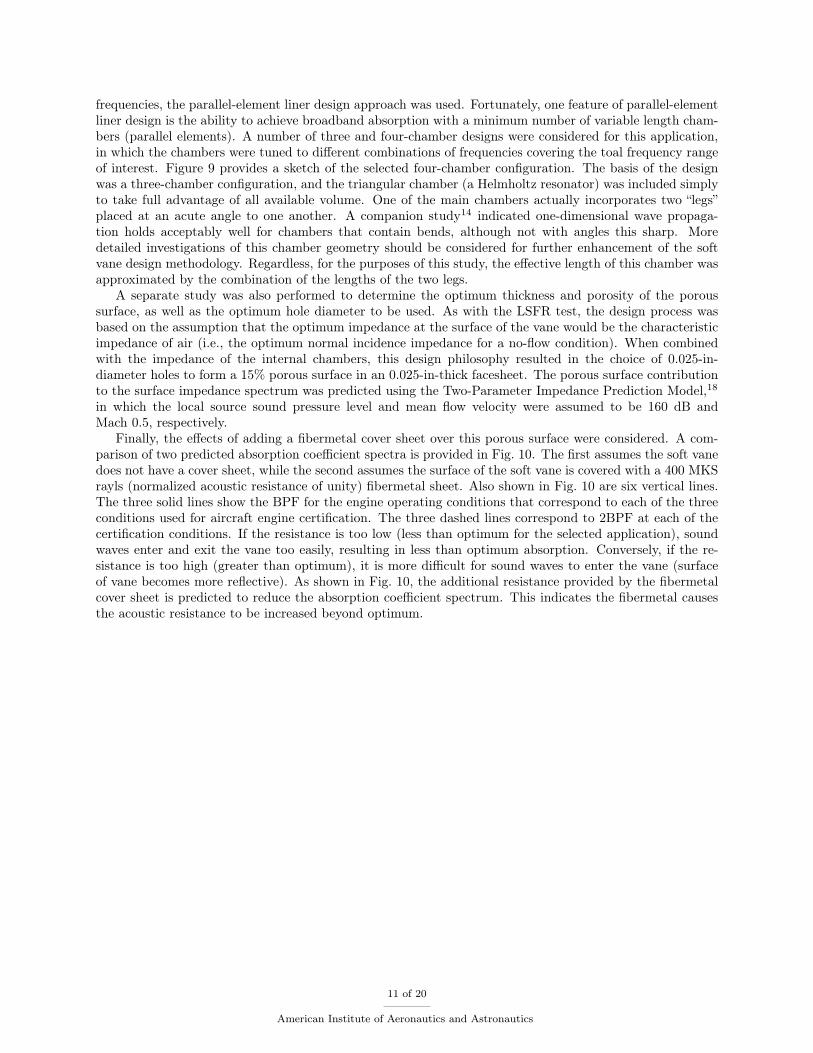
frequencies, the parallel-element liner design approach was used. Fortunately, one feature of parallel-elementliner design is the ability to achieve broadband absorption with a minimum number of variable length cham-bers (parallel elements). A number of three and four-chamber designs were considered for this application,in which the chambers were tuned to different combinations of frequencies covering the toal frequency rangeof interest. Figure 9 provides a sketch of the selected four-chamber configuration. The basis of the designwas a three-chamber configuration, and the triangular chamber (a Helmholtz resonator) was included simplyto take full advantage of all available volume. One of the main chambers actually incorporates two “legs”placed at an acute angle to one another. A companion study14 indicated one-dimensional wave propaga-tion holds acceptably well for chambers that contain bends, although not with angles this sharp. Moredetailed investigations of this chamber geometry should be considered for further enhancement of the softvane design methodology. Regardless, for the purposes of this study, the effective length of this chamber wasapproximated by the combination of the lengths of the two legs.
A separate study was also performed to determine the optimum thickness and porosity of the poroussurface, as well as the optimum hole diameter to be used. As with the LSFR test, the design process wasbased on the assumption that the optimum impedance at the surface of the vane would be the characteristicimpedance of air (i.e., the optimum normal incidence impedance for a no-flow condition). When combinedwith the impedance of the internal chambers, this design philosophy resulted in the choice of 0.025-in-diameter holes to form a 15% porous surface in an 0.025-in-thick facesheet. The porous surface contributionto the surface impedance spectrum was predicted using the Two-Parameter Impedance Prediction Model,18in which the local source sound pressure level and mean flow velocity were assumed to be 160 dB andMach 0.5, respectively.
Finally, the effects of adding a fibermetal cover sheet over this porous surface were considered. A com-parison of two predicted absorption coefficient spectra is provided in Fig. 10. The first assumes the soft vanedoes not have a cover sheet, while the second assumes the surface of the soft vane is covered with a 400 MKSrayls (normalized acoustic resistance of unity) fibermetal sheet. Also shown in Fig. 10 are six vertical lines.The three solid lines show the BPF for the engine operating conditions that correspond to each of the threeconditions used for aircraft engine certification. The three dashed lines correspond to 2BPF at each of thecertification conditions. If the resistance is too low (less than optimum for the selected application), soundwaves enter and exit the vane too easily, resulting in less than optimum absorption. Conversely, if the re-sistance is too high (greater than optimum), it is more difficult for sound waves to enter the vane (surfaceof vane becomes more reflective). As shown in Fig. 10, the additional resistance provided by the fibermetalcover sheet is predicted to reduce the absorption coefficient spectrum. This indicates the fibermetal causesthe acoustic resistance to be increased beyond optimum.
11 of 20
American Institute of Aeronautics and Astronautics
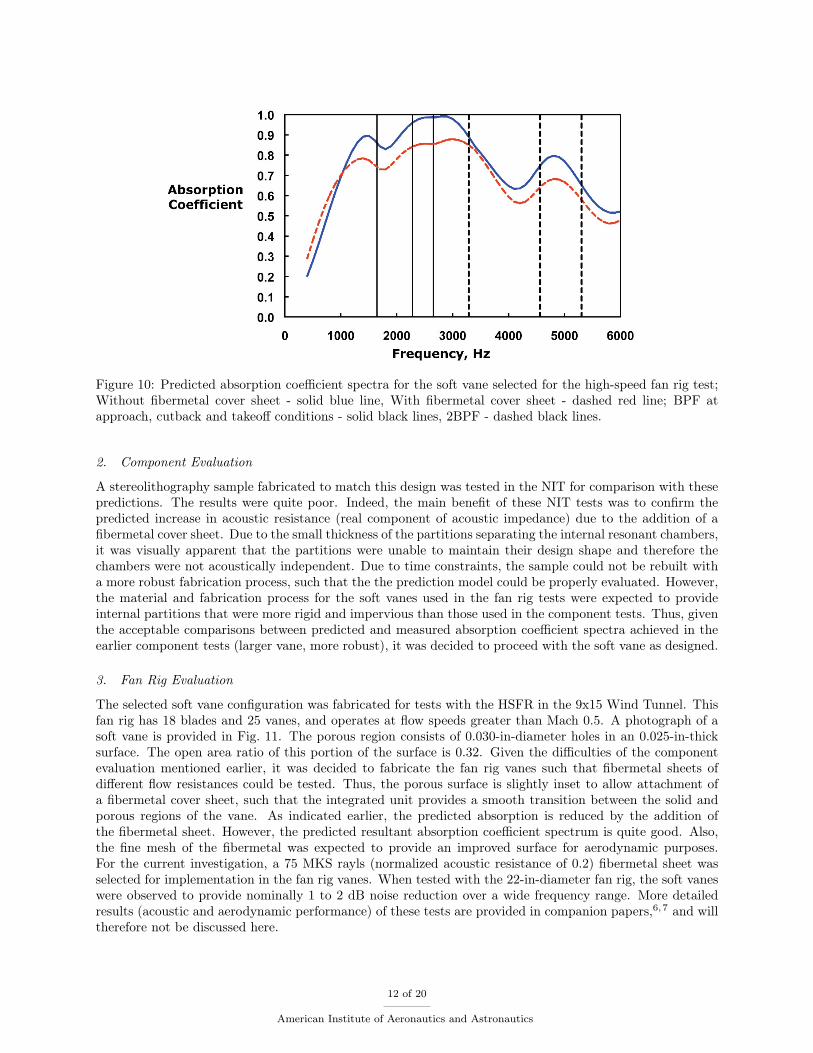
Figure 10: Predicted absorption coefficient spectra for the soft vane selected for the high-speed fan rig test;Without fibermetal cover sheet - solid blue line, With fibermetal cover sheet - dashed red line; BPF atapproach, cutback and takeoff conditions - solid black lines, 2BPF - dashed black lines.
2. Component Evaluation
A stereolithography sample fabricated to match this design was tested in the NIT for comparison with thesepredictions. The results were quite poor. Indeed, the main benefit of these NIT tests was to confirm thepredicted increase in acoustic resistance (real component of acoustic impedance) due to the addition of afibermetal cover sheet. Due to the small thickness of the partitions separating the internal resonant chambers,it was visually apparent that the partitions were unable to maintain their design shape and therefore thechambers were not acoustically independent. Due to time constraints, the sample could not be rebuilt witha more robust fabrication process, such that the the prediction model could be properly evaluated. However,the material and fabrication process for the soft vanes used in the fan rig tests were expected to provideinternal partitions that were more rigid and impervious than those used in the component tests. Thus, giventhe acceptable comparisons between predicted and measured absorption coefficient spectra achieved in theearlier component tests (larger vane, more robust), it was decided to proceed with the soft vane as designed.
3. Fan Rig Evaluation
The selected soft vane configuration was fabricated for tests with the HSFR in the 9x15 Wind Tunnel. Thisfan rig has 18 blades and 25 vanes, and operates at flow speeds greater than Mach 0.5. A photograph of asoft vane is provided in Fig. 11. The porous region consists of 0.030-in-diameter holes in an 0.025-in-thicksurface. The open area ratio of this portion of the surface is 0.32. Given the difficulties of the componentevaluation mentioned earlier, it was decided to fabricate the fan rig vanes such that fibermetal sheets ofdifferent flow resistances could be tested. Thus, the porous surface is slightly inset to allow attachment ofa fibermetal cover sheet, such that the integrated unit provides a smooth transition between the solid andporous regions of the vane. As indicated earlier, the predicted absorption is reduced by the addition ofthe fibermetal sheet. However, the predicted resultant absorption coefficient spectrum is quite good. Also,the fine mesh of the fibermetal was expected to provide an improved surface for aerodynamic purposes.For the current investigation, a 75 MKS rayls (normalized acoustic resistance of 0.2) fibermetal sheet wasselected for implementation in the fan rig vanes. When tested with the 22-in-diameter fan rig, the soft vaneswere observed to provide nominally 1 to 2 dB noise reduction over a wide frequency range. More detailedresults (acoustic and aerodynamic performance) of these tests are provided in companion papers,6,7 and willtherefore not be discussed here.
12 of 20
American Institute of Aeronautics and Astronautics
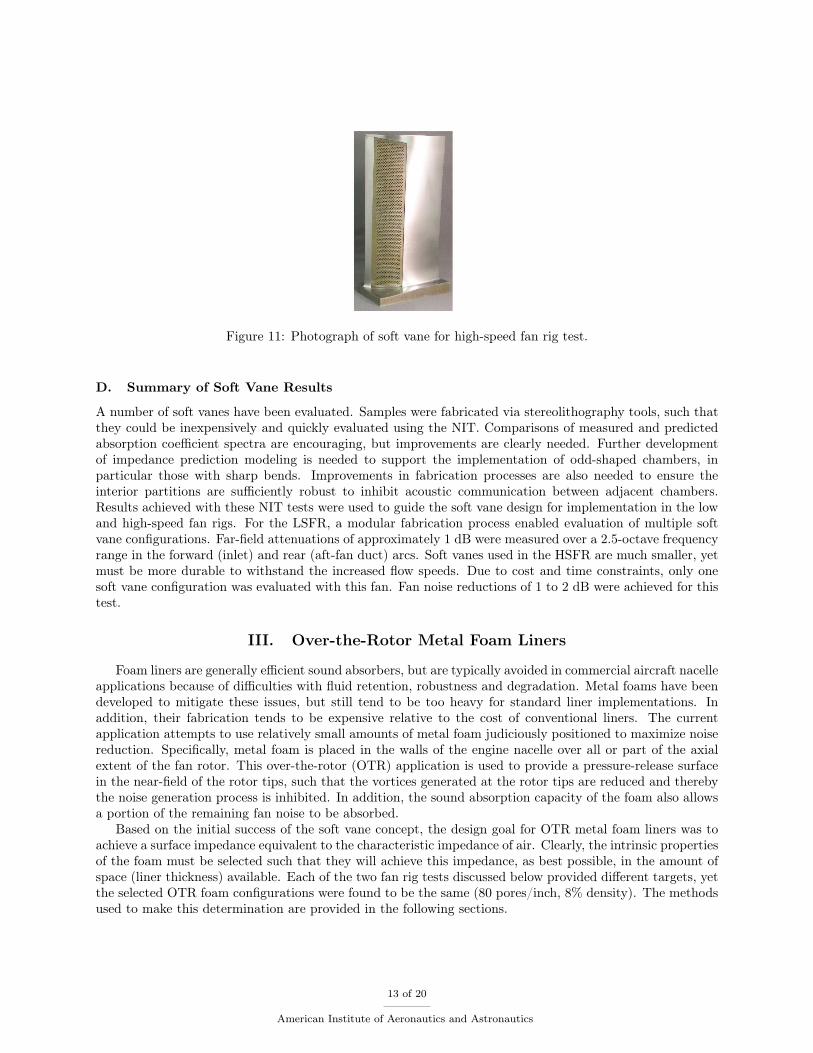
Figure 11: Photograph of soft vane for high-speed fan rig test.
D. Summary of Soft Vane Results
A number of soft vanes have been evaluated. Samples were fabricated via stereolithography tools, such thatthey could be inexpensively and quickly evaluated using the NIT. Comparisons of measured and predictedabsorption coefficient spectra are encouraging, but improvements are clearly needed. Further developmentof impedance prediction modeling is needed to support the implementation of odd-shaped chambers, inparticular those with sharp bends. Improvements in fabrication processes are also needed to ensure theinterior partitions are sufficiently robust to inhibit acoustic communication between adjacent chambers.Results achieved with these NIT tests were used to guide the soft vane design for implementation in the lowand high-speed fan rigs. For the LSFR, a modular fabrication process enabled evaluation of multiple softvane configurations. Far-field attenuations of approximately 1 dB were measured over a 2.5-octave frequencyrange in the forward (inlet) and rear (aft-fan duct) arcs. Soft vanes used in the HSFR are much smaller, yetmust be more durable to withstand the increased flow speeds. Due to cost and time constraints, only onesoft vane configuration was evaluated with this fan. Fan noise reductions of 1 to 2 dB were achieved for thistest.
III. Over-the-Rotor Metal Foam Liners
Foam liners are generally efficient sound absorbers, but are typically avoided in commercial aircraft nacelleapplications because of difficulties with fluid retention, robustness and degradation. Metal foams have beendeveloped to mitigate these issues, but still tend to be too heavy for standard liner implementations. Inaddition, their fabrication tends to be expensive relative to the cost of conventional liners. The currentapplication attempts to use relatively small amounts of metal foam judiciously positioned to maximize noisereduction. Specifically, metal foam is placed in the walls of the engine nacelle over all or part of the axialextent of the fan rotor. This over-the-rotor (OTR) application is used to provide a pressure-release surfacein the near-field of the rotor tips, such that the vortices generated at the rotor tips are reduced and therebythe noise generation process is inhibited. In addition, the sound absorption capacity of the foam also allowsa portion of the remaining fan noise to be absorbed.
Based on the initial success of the soft vane concept, the design goal for OTR metal foam liners was toachieve a surface impedance equivalent to the characteristic impedance of air. Clearly, the intrinsic propertiesof the foam must be selected such that they will achieve this impedance, as best possible, in the amount ofspace (liner thickness) available. Each of the two fan rig tests discussed below provided different targets, yetthe selected OTR foam configurations were found to be the same (80 pores/inch, 8% density). The methodsused to make this determination are provided in the following sections.
13 of 20
American Institute of Aeronautics and Astronautics
A. Design Methodology
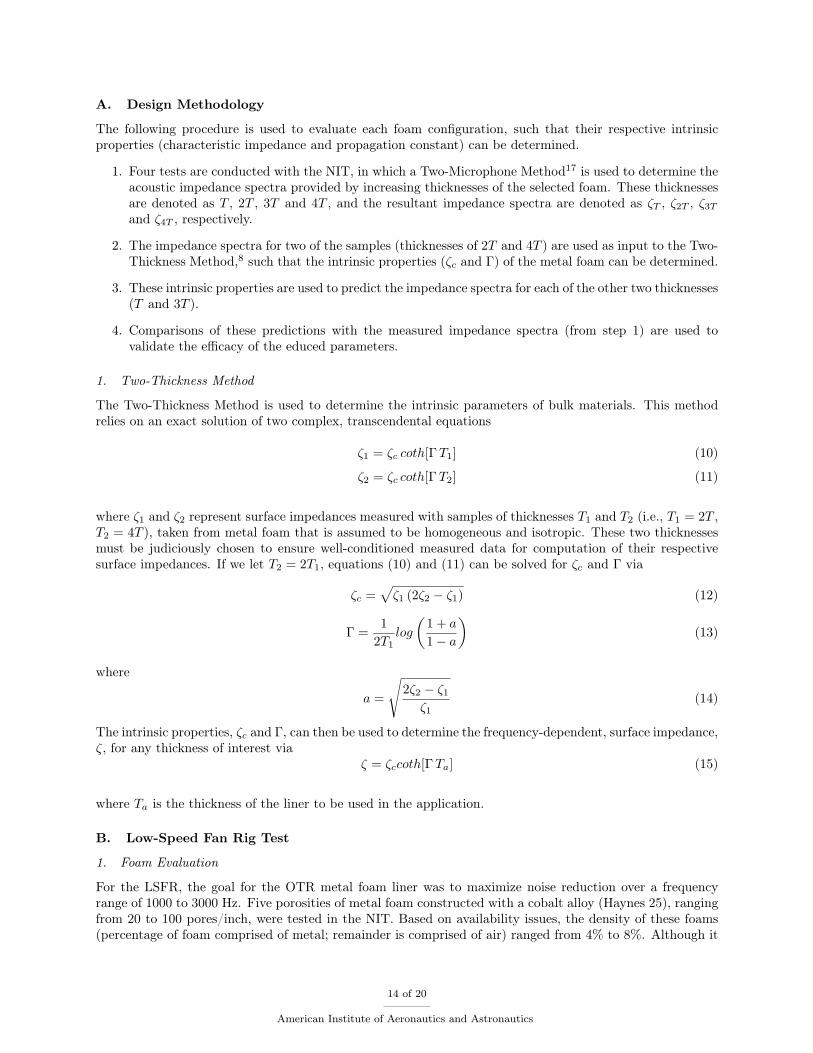
The following procedure is used to evaluate each foam configuration, such that their respective intrinsicproperties (characteristic impedance and propagation constant) can be determined.
1. Four tests are conducted with the NIT, in which a Two-Microphone Method17 is used to determine theacoustic impedance spectra provided by increasing thicknesses of the selected foam. These thicknessesare denoted as T , 2T , 3T and 4T , and the resultant impedance spectra are denoted as ζT , ζ2T , ζ3T
and ζ4T , respectively.
2. The impedance spectra for two of the samples (thicknesses of 2T and 4T ) are used as input to the Two-Thickness Method,8 such that the intrinsic properties (ζc and Γ) of the metal foam can be determined.
3. These intrinsic properties are used to predict the impedance spectra for each of the other two thicknesses(T and 3T ).
4. Comparisons of these predictions with the measured impedance spectra (from step 1) are used tovalidate the efficacy of the educed parameters.
1. Two-Thickness Method
The Two-Thickness Method is used to determine the intrinsic parameters of bulk materials. This methodrelies on an exact solution of two complex, transcendental equations
ζ1 = ζc coth[ΓT1] (10)
ζ2 = ζc coth[ΓT2] (11)
where ζ1 and ζ2 represent surface impedances measured with samples of thicknesses T1 and T2 (i.e., T1 = 2T ,T2 = 4T ), taken from metal foam that is assumed to be homogeneous and isotropic. These two thicknessesmust be judiciously chosen to ensure well-conditioned measured data for computation of their respectivesurface impedances. If we let T2 = 2T1, equations (10) and (11) can be solved for ζc and Γ via
ζc =√
ζ1 (2ζ2 − ζ1) (12)
Γ =1
2T1log
(1 + a
1 − a
)(13)
where
a =
√2ζ2 − ζ1
ζ1(14)
The intrinsic properties, ζc and Γ, can then be used to determine the frequency-dependent, surface impedance,ζ, for any thickness of interest via
ζ = ζccoth[ΓTa] (15)
where Ta is the thickness of the liner to be used in the application.
B. Low-Speed Fan Rig Test
1. Foam Evaluation
For the LSFR, the goal for the OTR metal foam liner was to maximize noise reduction over a frequencyrange of 1000 to 3000 Hz. Five porosities of metal foam constructed with a cobalt alloy (Haynes 25), rangingfrom 20 to 100 pores/inch, were tested in the NIT. Based on availability issues, the density of these foams(percentage of foam comprised of metal; remainder is comprised of air) ranged from 4% to 8%. Although it
14 of 20
American Institute of Aeronautics and Astronautics

would have been preferred to maintain a constant density for each of these foams, initial results indicatedthe number of pores per inch is the more important parameter.
Foam thicknesses of 1 and 2 inches were considered. For convenience, it was decided that the same metalfoam would be used for both tests, such that the larger thickness could be achieved by adding an additionallayer of the same foam over the first layer. The absorption coefficient spectrum for the larger thickness waschosen as the figure of merit; i.e., the goal for the LSFR test was to maximize noise reduction for the 2-inthick configuration. Absorption coefficient spectra predicted [using Eq. (15)] for three types of Haynes 25foam with thicknesses of 2 inches are provided in Fig. 12. Based on these predicted absorption coefficientspectra, the material with 80 pores/inch and 8% density (foam consists of 8% metal and 92% air) was chosen.
Figure 12: Comparison of absorption coefficient spectra for three types of Haynes 25 foam; 80 ppi, 8% dense- black line, 80 ppi, 4% dense - red line, 60 ppi, 7% dense - green line.
Figure 13: Noise reduction measured in low-speed fan rig test with over-the-rotor metal foam liner; Forwardarc - blue bars, Aft arc - red bars.
2. Fan Rig Evaluation
Multiple OTR metal foam liner locations were evaluated with the 48-in-diameter LSFR, and the results areprovided by Sutliff, et al.9 One of the more interesting results is provided in Fig. 13. Significant attenuationsof 3 to 4 dB over the upper five harmonic bands are observed in both far-field arcs (i.e., reduction of noiseradiatated from inlet and aft-fan duct). Based on these very encouraging results, it was decided that thisOTR foam concept should be pursued with tests in a HSFR. These tests are discussed below.
15 of 20
American Institute of Aeronautics and Astronautics
C. High-Speed Fan Rig Test
1. Foam Evaluation
For the HSFR test, the goal for the OTR metal foam liner was to attenuate the blade-passage-frequency(BPF) and 2BPF (two times BPF) tones at all three certification conditions, i.e., takeoff, cutback andapproach (total of six frequencies, ranging from 1645 to 5306 Hz). The 22-in-diameter fan rig is designed tosupport OTR foam thicknesses up to 1.5 inches. Based on this depth limitation and the frequency range ofinterest, the same foam (Haynes 25, 80 ppi, 8% dense) appears suitable for this application.
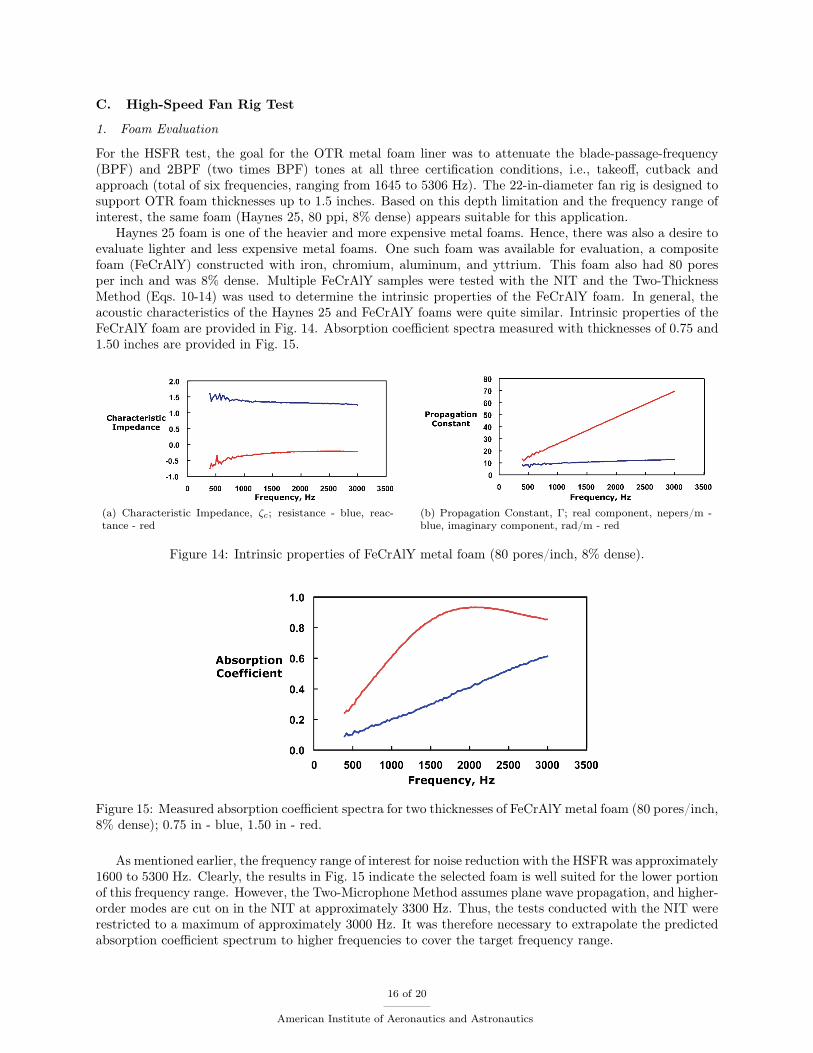
Haynes 25 foam is one of the heavier and more expensive metal foams. Hence, there was also a desire toevaluate lighter and less expensive metal foams. One such foam was available for evaluation, a compositefoam (FeCrAlY) constructed with iron, chromium, aluminum, and yttrium. This foam also had 80 poresper inch and was 8% dense. Multiple FeCrAlY samples were tested with the NIT and the Two-ThicknessMethod (Eqs. 10-14) was used to determine the intrinsic properties of the FeCrAlY foam. In general, theacoustic characteristics of the Haynes 25 and FeCrAlY foams were quite similar. Intrinsic properties of theFeCrAlY foam are provided in Fig. 14. Absorption coefficient spectra measured with thicknesses of 0.75 and1.50 inches are provided in Fig. 15.
(a) Characteristic Impedance, ζc; resistance - blue, reac-tance - red
(b) Propagation Constant, Γ; real component, nepers/m -blue, imaginary component, rad/m - red
Figure 14: Intrinsic properties of FeCrAlY metal foam (80 pores/inch, 8% dense).
Figure 15: Measured absorption coefficient spectra for two thicknesses of FeCrAlY metal foam (80 pores/inch,8% dense); 0.75 in - blue, 1.50 in - red.
As mentioned earlier, the frequency range of interest for noise reduction with the HSFR was approximately1600 to 5300 Hz. Clearly, the results in Fig. 15 indicate the selected foam is well suited for the lower portionof this frequency range. However, the Two-Microphone Method assumes plane wave propagation, and higher-order modes are cut on in the NIT at approximately 3300 Hz. Thus, the tests conducted with the NIT wererestricted to a maximum of approximately 3000 Hz. It was therefore necessary to extrapolate the predictedabsorption coefficient spectrum to higher frequencies to cover the target frequency range.
16 of 20
American Institute of Aeronautics and Astronautics

The real and imaginary components of the characteristic impedance and propagation constant (total offour components) all asymptotically approach straight lines (see Fig. 14) that can easily be extrapolated tohigher frequencies. The spectra for each of these intrinsic parameters were extended to 6000 Hz (straightline extensions), and the resultant absorption coefficient spectra for thicknesses of 0.75 and 1.50 inches werecomputed from these extrapolated spectra of the intrinsic parameters (see Fig. 16). Based on this analysis,the FeCrAlY foam was accepted for testing in the HSFR.
Figure 16: Absorption coefficient spectra extrapolated out to 6000 Hz for two thickness of FeCrAlY foammetal; 0.75 in - blue, 1.50 in - red.
2. Fan Rig Evaluation
As mentioned earlier, it is important to minimize aerodynamic performance penalties associated with newnoise reduction concepts. Given the roughness of the metallic foam, it was determined that a rub stripshould be mounted over the surface of the metal foam. In order for the foam to provide a pressure releasesurface, as well as some noise absorption, the rub strip must be porous to allow communication betweenthe aeroacoustic environment and the interior of the foam block. Based on a combination of CFD analysisand previous test results, the rub strip was designed to use 0.035-in-diameter holes to achieve an open arearatio of 0.2 (20% porous). For structural reasons, it was initially designed to have a thickness of 0.25 inches.However, as shown in Fig. 17, this significantly reduces the effectiveness of the system (foam plus rub strip),as it causes the system to exhibit significant acoustic resonances. This result was predicted using the ZKTLcode and the Two-Parameter Impedance Prediction Model, each of which was discussed earlier. The metalfoam is assumed to be nearly independent of mean grazing flow effects, but this is not true for the perforaterub strip. Hence, a Mach 0.5 grazing flow was assumed for this computation.
17 of 20
American Institute of Aeronautics and Astronautics
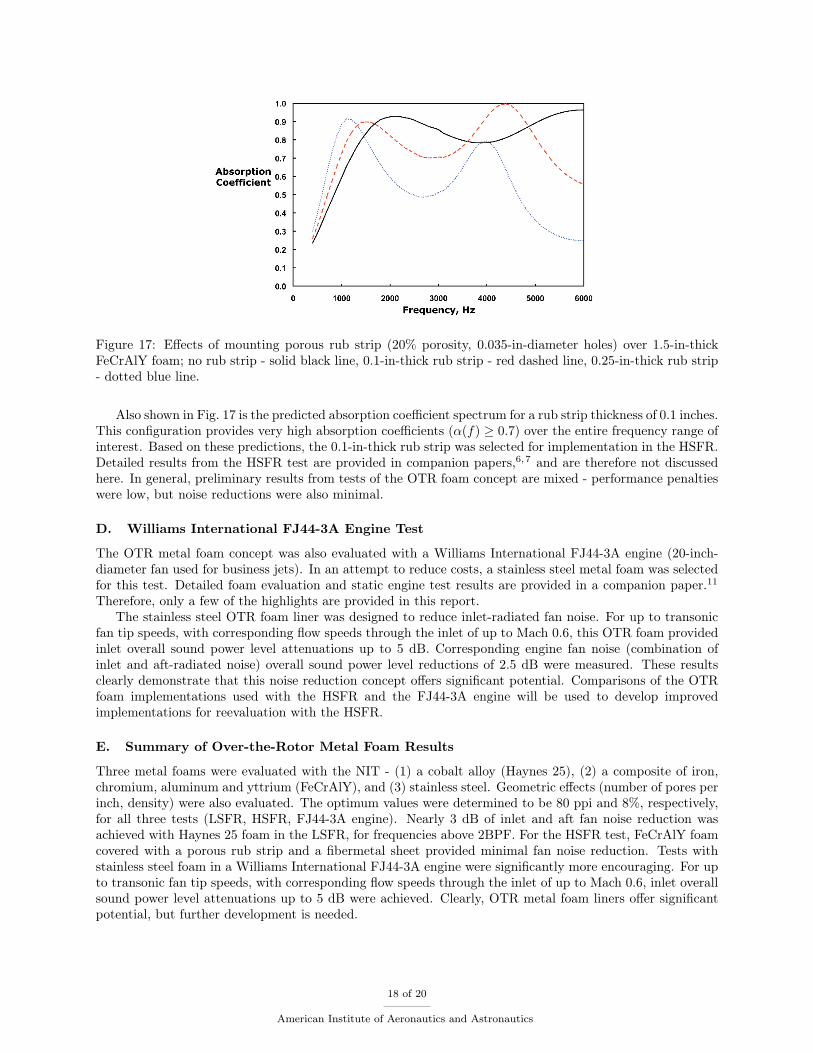
Figure 17: Effects of mounting porous rub strip (20% porosity, 0.035-in-diameter holes) over 1.5-in-thickFeCrAlY foam; no rub strip - solid black line, 0.1-in-thick rub strip - red dashed line, 0.25-in-thick rub strip- dotted blue line.
Also shown in Fig. 17 is the predicted absorption coefficient spectrum for a rub strip thickness of 0.1 inches.This configuration provides very high absorption coefficients (α(f) ≥ 0.7) over the entire frequency range ofinterest. Based on these predictions, the 0.1-in-thick rub strip was selected for implementation in the HSFR.Detailed results from the HSFR test are provided in companion papers,6,7 and are therefore not discussedhere. In general, preliminary results from tests of the OTR foam concept are mixed - performance penaltieswere low, but noise reductions were also minimal.
D. Williams International FJ44-3A Engine Test
The OTR metal foam concept was also evaluated with a Williams International FJ44-3A engine (20-inch-diameter fan used for business jets). In an attempt to reduce costs, a stainless steel metal foam was selectedfor this test. Detailed foam evaluation and static engine test results are provided in a companion paper.11Therefore, only a few of the highlights are provided in this report.
The stainless steel OTR foam liner was designed to reduce inlet-radiated fan noise. For up to transonicfan tip speeds, with corresponding flow speeds through the inlet of up to Mach 0.6, this OTR foam providedinlet overall sound power level attenuations up to 5 dB. Corresponding engine fan noise (combination ofinlet and aft-radiated noise) overall sound power level reductions of 2.5 dB were measured. These resultsclearly demonstrate that this noise reduction concept offers significant potential. Comparisons of the OTRfoam implementations used with the HSFR and the FJ44-3A engine will be used to develop improvedimplementations for reevaluation with the HSFR.
E. Summary of Over-the-Rotor Metal Foam Results
Three metal foams were evaluated with the NIT - (1) a cobalt alloy (Haynes 25), (2) a composite of iron,chromium, aluminum and yttrium (FeCrAlY), and (3) stainless steel. Geometric effects (number of pores perinch, density) were also evaluated. The optimum values were determined to be 80 ppi and 8%, respectively,for all three tests (LSFR, HSFR, FJ44-3A engine). Nearly 3 dB of inlet and aft fan noise reduction wasachieved with Haynes 25 foam in the LSFR, for frequencies above 2BPF. For the HSFR test, FeCrAlY foamcovered with a porous rub strip and a fibermetal sheet provided minimal fan noise reduction. Tests withstainless steel foam in a Williams International FJ44-3A engine were significantly more encouraging. For upto transonic fan tip speeds, with corresponding flow speeds through the inlet of up to Mach 0.6, inlet overallsound power level attenuations up to 5 dB were achieved. Clearly, OTR metal foam liners offer significantpotential, but further development is needed.
18 of 20
American Institute of Aeronautics and Astronautics
IV. Concluding Remarks
This paper has presented an assessment of two innovative fan-noise reduction concepts developed byNASA. Soft vanes are fan exit guide vanes with porous surfaces to allow communication between pressurefluctuations at the vane surface and internal, resonant chambers. Over-the-rotor (OTR) metal foam linersare embedded in the nacelle wall at or near the fan rotor plane. Both provide sound absorption impedanceboundary conditions. They also provide pressure release to inhibit rotor-stator interaction noise (soft vanes)and rotor-alone noise (OTR metal foam liners). Each concept was first evaluated with the NASA Langleynormal incidence tube (NIT). Comparisons of predicted and measured impedance spectra were then used toguide designs for implementation in two NASA Glenn fan rigs, a 48-in-diameter, low-speed fan rig (LSFR)and a 22-in-diameter, high-speed fan rig (HSFR). Some of the more important items regarding each of theseconcepts are listed below:
Soft Vanes
• Soft vanes were designed using a parallel-element liner design approach.
• Multiple soft vane configurations were tested in the LSFR. Far-field attenuations for inlet and aft-radiated noise of approximately 1 dB over a 2.5-octave frequency range were achieved.
• One soft vane configuration was evaluated in HSFR. Fan noise reductions of 1 to 2 dB were observed.
OTR Metal Foam Liners
• OTR metal foam liners were selected based on their ability to provide a desired impedance spectrum.The optimum configuration for implementation in each of the fan rigs was the same, i.e., 80 pores perinch and 8% density.
• Nearly 3 dB of inlet and aft fan noise reduction was measured for frequencies above 2BPF in the LSFR.
• Because of the increased flow velocity and sound intensity, the OTR metal foam was covered with aporous rub strip and a fibermetal cover sheet for implementation in the HSFR. Marginal noise reductionwas achieved in this test.
• In a companion investigation, a Williams International FJ44-3A engine provided inlet overall soundpower level attenuations up to 5 dB and total engine (inlet plus aft) overall sound power level attenu-ations of 2.5 dB.
Although very encouraging results have been achieved with each of these concepts, there is clearly a need formore detailed investigation of physics underlying each of these concepts. The following provides a descriptionof some of the plans for further investigation.
• Improved fan-noise prediction codes will be developed to determine the optimum impedance spectrato be provided by soft vanes and OTR metal foam liners.
• Enhanced impedance prediction models will be developed to account for (1) odd-shaped interior cham-bers within soft vanes, and (2) OTR metal foam liner (e.g., metallic composition, density and numberof pores per inch)
• A comparison of OTR metal foam liner configurations tested in the HSFR and the Williams Interna-tional engine will be used to evaluate the effects of installation on potential noise reduction.
References1Jones, M. G., Parrott, T. L., Heidelberg, L. J., and Envia, E., “Low-Noise Fan Exit Guide Vanes,”U.S. Patent 7334998,
February 2008.2Huff, D. L., Sutliff, D. L., Jones, M. G., and Hebsur, M., “Sound Attenuating Turbo Rotor Treatment and Method,” U.S.
Patent pending, application 657223 filed January 2007.3Kelly, J. J. and Abu-Khajeel, H., “A User’s Guide to the Zwikker-Kosten Transmission Line Code (ZKTL),” NASA CR
206901, 1997.
19 of 20
American Institute of Aeronautics and Astronautics
4Loew, R. A., Lauer, J. T., McAllister, J., and Sutliff, D. L., “The Advanced Noise Control Fan,” NASA TM 2006-214368,November 2006.
5Woodward, R. P., Dittmar, J. H., Hall, D. G., and Kee-Bowling, B., “Background Noise Levels Measured in the NASALewis 9- by 15-Foot Low-Speed Wind Tunnel,” AIAA Paper 1995-0720, January 1995.
6Elliott, D. M., Woodward, R. P., and Podboy, G. G., “Acoustic Performance of Unique Liner Locations for a High BypassModel Turbofan at Simulated Flight Conditions,” AIAA Paper 2009-3140, May 2009.
7Hughes, C. E., and Gazzaniga, J. A., “Effect of Two Advanced Noise Reduction Technologies on the AerodynamicPerformance of an Ultra High Bypass Ratio Fan,” AIAA Paper 2009-3139, May 2009.
8Smith, C. D. and Parrott, T. L., “Comparison Of Three Methods For Measuring Acoustic Properties Of Bulk Materials,”Journal of Acoustical Society of America, Vol. 74, No. 5, 1983, pp. 1577–1582.
9Sutliff, D. L. and Jones, M. G., “Foam-Metal Liner Attenuation of Low-Speed Fan Noise,” AIAA Paper 2008-2897, May2008.
10Lauer, J. T., McAllister, J., Loew, R. A., Sutliff, D. L., and Hartley, T. C., “FJ44 Turbofan Engine Test in the NASAGlenn Research Center’s Aero-Acoustic Propulsion Laboratory,” AIAA Paper 2009-0620, January 2009.
11Sutliff, D. L., Elliott, D. M., Jones, M. G., and Hartley, T. C., “Attenuation of FJ44 Turbofan Engine Noise with aFoam-Metal Liner Installed Over-the-Rotor,” AIAA Paper 2009-3141, May 2009.
12Sutliff, D., Bridges, J., and Envia, E., “Comparison of Predicted Low Speed Fan Rotor/Stator Interaction Modes toMeasured,” AIAA Paper 1997-1609, May 1997.
13Parrott, T. L. and Jones, M. G., “Parallel-Element Liner Impedances for Improved Absorption of Broadband Sound inDucts,” Noise Control Engineering Journal, Vol. 43, No. 6, November - December, 1995.
14Howerton, B. M. and Parrott, T. L., “Validation of an Acoustic Impedance Prediction Model for Skewed Resonators,”AIAA Paper 2009-3143, May 2009.
15Richards, B. W., “Propagation of Sound Waves in Tubes of Noncircular Cross Section,” NASA TP 2601, August 1985.16Sutliff, D. L., Heidelberg, L. J., and Envia, E., “Coupling of Low Speed Fan Stator Vane Unsteady Pressures to Duct
Modes: Measured vs. Predicted,” AIAA Paper 1999-1864, May 1999.17Jones, M. G. and Stiede, P. E., “Comparison of Methods for Determining Specific Acoustic Impedance,” Journal of the
Acoustical Society of America, Vol. 101, No. 5, May 1997, pp. 2694–2704.18Jones, M. G., Parrott, T. L., and Watson, W. R., “Uncertainty and Sensitivity Analyses of a Two- Parameter Impedance
Prediction Model,” AIAA Paper 2008-2928, May 2008.
20 of 20
American Institute of Aeronautics and Astronautics