Embed Size (px)
Citation preview
STATE OF SOUTH DAKOTA
Dennis Daugaard, Governor
DEPARTMENT OF ENVIRONMENT AND NATURAL RESOURCES
Steven M. Pirner, Secretary
DIVISION OF FINANCIAL AND TECHNICAL ASSISTANCE
James Feeney, Director
GEOLOGICAL SURVEY PROGRAM
Derric L. Iles, State Geologist
OIL AND GAS INVESTIGATION 5
ASSESSMENT OF SOUTH DAKOTA’S SAND AND ALUMINA
RESOURCES FOR USE AS PROPPANT
THOMAS R. MARSHALL
DARREN J. JOHNSON
SARAH A. CHADIMA
LAYNE D. SCHULZ
MARK D. FAHRENBACH
KAREN G. HERRIG
Akeley-Lawrence Science Center
University of South Dakota
Vermillion, South Dakota
2014
GEOLOGICAL SURVEY PROGRAM DEPARTMENT OF ENVIRONMENT AND NATURAL RESOURCES
AKELEY-LAWRENCE SCIENCE CENTER
414 EAST CLARK STREET
VERMILLION, SOUTH DAKOTA 57069-2390
(605) 677-5227
Derric L. Iles, M.S., C.P.G. State Geologist
Timothy C. Cowman, M.S. Environmental Scientist Manager
Priscilla E. Young, B.S. Senior Secretary
Jeffery J. Allen, B.S. Geologist
Sarah A. Chadima, M.S., C.P.G. Geologist
Wesley P. Christensen, B.S. Geologist
Brian A. Fagnan, M.S. Geologist
Dragan Filipovic, M.S. Hydrologist
Stevie L. Holmes, B.S Geologist
Ann R. Jensen, B.S. Geologist
Darren J. Johnson, M.S. Geologist
Thomas R. Marshall, Ph.D. Geologist
Matthew T. Noonan, B.S. Hydrologist
Thomas B. Rich, M.S. Hydrologist
Layne D. Schulz, B.S. Geologist
Scott W. Jensen Civil Engineering Technician
David A. Liviskie, B.S. Natural Resources Technician
Ted R. Miller, B.S. Civil Engineering Technician
James R. Olson, B.S. Civil Engineering Technician
Lori L. Roinstad Cartographer
RAPID CITY REGIONAL OFFICE
2050 WEST MAIN, SUITE 1
RAPID CITY, SOUTH DAKOTA 57702-2493
(605) 394-2229
Mark D. Fahrenbach, Ph.D. Geologist
Joanne M. Noyes, M.S., P.E. Hydrologist
i
CONTENTS Page
ABSTRACT ............................................................................................................................. 1
INTRODUCTION ................................................................................................................... 2
Background ................................................................................................................... 2
Purpose of study ............................................................................................................ 5
Previous investigations ................................................................................................. 5
Sand resources for silica use ............................................................................. 5
Raw materials for ceramic proppant ................................................................. 6
METHODS .............................................................................................................................. 8
Selection of geologic units to be sampled ..................................................................... 8
Description of geologic units ........................................................................................ 8
Deadwood Formation ........................................................................................ 8
Minnelusa Formation ........................................................................................ 8
Hulett Sandstone Member of the Sundance Formation .................................... 9
Unkpapa Sandstone ........................................................................................... 9
Lakota Formation .............................................................................................. 9
Fall River Sandstone ......................................................................................... 10
Fox Hills Sandstone .......................................................................................... 10
Arikaree Group ................................................................................................. 11
Ogallala Group .................................................................................................. 11
Sand Hills Formation ........................................................................................ 11
Acquisition of samples .................................................................................................. 12
Sample locations ........................................................................................................... 13
ii
METHODS – continued Page
Processing of samples ................................................................................................... 13
ANALYSIS OF SAMPLES .................................................................................................... 14
Sieving of samples ........................................................................................................ 14
Percent aggregate estimation ........................................................................................ 15
Effect of aggregates on sieve data ................................................................................ 15
Qualitative assessment of mineralogy, sphericity, and roundness ................................ 15
RESULTS ................................................................................................................................ 16
Sieve analysis ................................................................................................................ 16
Results from geologic units sampled ............................................................................ 16
Deadwood Formation ........................................................................................ 16
Minnelusa Formation ........................................................................................ 16
Hulett Sandstone Member of the Sundance Formation .................................... 17
Unkpapa Sandstone ........................................................................................... 17
Lakota Formation .............................................................................................. 17
Fall River Sandstone ......................................................................................... 18
Lakota Formation or Fall River sandstone ........................................................ 18
Fox Hills Sandstone .......................................................................................... 18
White River Group ............................................................................................ 18
Arikaree Group ................................................................................................. 19
Ogallala Group .................................................................................................. 19
Outwash, valley train ........................................................................................ 19
Terrace deposits ................................................................................................ 19
iii
RESULTS – continued Page
Sand Hills Formation ........................................................................................ 20
Alluvium ........................................................................................................... 20
Unknown ........................................................................................................... 20
CONCLUSIONS ..................................................................................................................... 21
ACKNOWLEDGEMENTS ................................................................................................... 22
REFERENCES ........................................................................................................................ 22
FIGURES
1. Hydraulic fracturing sand as it appears in the quarry (raw),
washed to remove clay minerals, and sorted by size for various uses ................................. 2
2. Chart showing sphericity and roundness .............................................................................. 3
3. Locations of sand bearing geologic units sampled and locations of
samples submitted by fine-aggregate mine operators .......................................................... 13
TABLE
1. Suggested maximum fines for frac sand crush resistance tests ............................................ 4
APPENDIX
Sample locations and summary of sieve weight data .............................................................. 25

This page intentionally left blank
1
ABSTRACT
Current high demand for proppant in the United States prompted an investigation into
potential proppant resources in western South Dakota. The purpose of this study was to
characterize selected sand-bearing formations for potential use as natural proppant, and
determine if there are any raw materials in South Dakota suitable for the manufacturing of
ceramic proppants. The ideal natural proppant consists of greater than 99 percent sand-sized
quartz grains and also meets several other stringent standards set forth by the American
Petroleum Institute.
Selected sandstone and sand samples were collected by personnel from the Geological
Survey Program, Department of Environment and Natural Resources, from 10 different geologic
units west of the Missouri River. Additional sand samples were obtained from fine-aggregate
mine operators in western South Dakota.
Ultimately, 256 samples were collected for study; 243 underwent bulk sieve analysis to
determine grain-size distribution, and photomicrographs were acquired of material retained on
each sieve. Review of photomicrographs revealed that many sieves contained aggregates, which
skewed weight distribution results. Due to budget constraints, further testing was not possible.
All of the samples failed to meet American Petroleum Institute recommended weight
distribution specifications for natural proppants. Many samples collected from Tertiary- to
Quaternary-age geologic units (White River Group, Arikaree Group, Ogallala Group, glacial
outwash, terrace deposits, Sand Hills Formation, and alluvial deposits) have well-rounded and
spherical grains, but most contain a significant amount of minerals other than quartz. Most
samples collected from Jurassic- and Cretaceous-age geologic units (Hulett Sandstone Member
of the Sundance Formation, Unkpapa Sandstone, Lakota Formation, Fall River Sandstone, and
Fox Hills Sandstone), contain a significant amount of minerals other than quartz and/or contain
angular and elongated grains. Samples collected from the Cambrian-Ordovician-age Deadwood
Formation and Pennsylvanian-Permian-age Minnelusa Formation were determined (1) to be too
fine-grained, (2) to be too hard due to carbonate or silica cement, (3) to contain angular and
elongated grains, (4) to have significant iron staining, or (5) to contain a significant amount of
minerals other than quartz.
None of the sand in South Dakota could likely be mined solely as hydraulic fracturing sand.
In order to fully utilize a sand deposit and extract a marketable volume of sand from these
sources, significant volumes of coarser or finer material would have to have a market as well. If
there is demand for other uses, then the sand may be economical to mine.
A literature review revealed no bauxite deposits have been mapped or described, nor is there
definitive data to indicate the presence of significant kaolinite-rich sediments in South Dakota.
Thus, it is not likely that South Dakota has the necessary raw materials needed for the
manufacturing of ceramic proppants.
2
INTRODUCTION
Background
Most of the oil wells being drilled in the Williston Basin use hydraulic fracturing during the
well completion process. The hydraulic fracturing technique forces a combination of water,
proppants (natural sands, resin-coated sand, or synthetic ceramic spheres), and minor amounts of
other chemicals into a well bore under high pressure. The intent of this technique is to create
fractures in the tight reservoir rock. The proppants are used to keep the fractures open which
leads to an increase in the flow of reservoir fluid into the well bore. The Bakken/Three Forks
system in North Dakota consists of tight reservoir rocks, and increased drilling in this oil play
has led to an increase in the demand for proppants. On average, each Bakken/Three Forks well
needs 3 to 5 million pounds of proppant for completion. Over the next 20 years, the North
Dakota Industrial Commission estimates that there will be 40,000 new wells drilled in western
North Dakota.
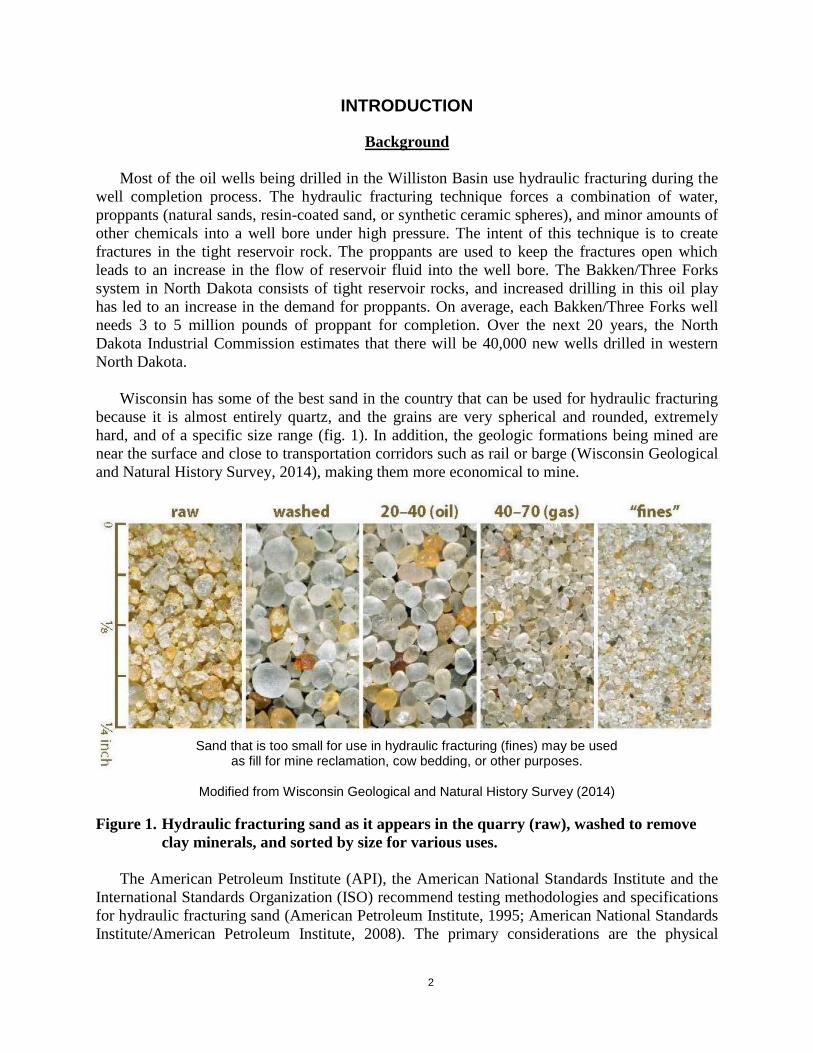
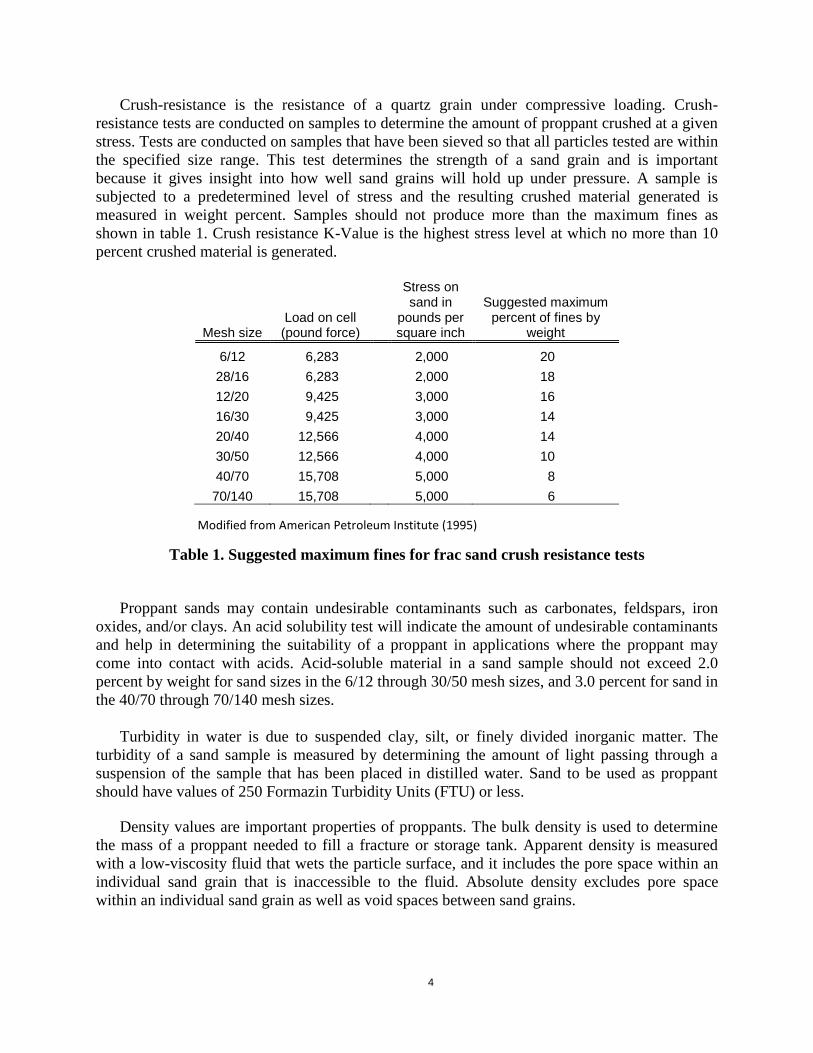
Wisconsin has some of the best sand in the country that can be used for hydraulic fracturing
because it is almost entirely quartz, and the grains are very spherical and rounded, extremely
hard, and of a specific size range (fig. 1). In addition, the geologic formations being mined are
near the surface and close to transportation corridors such as rail or barge (Wisconsin Geological
and Natural History Survey, 2014), making them more economical to mine.
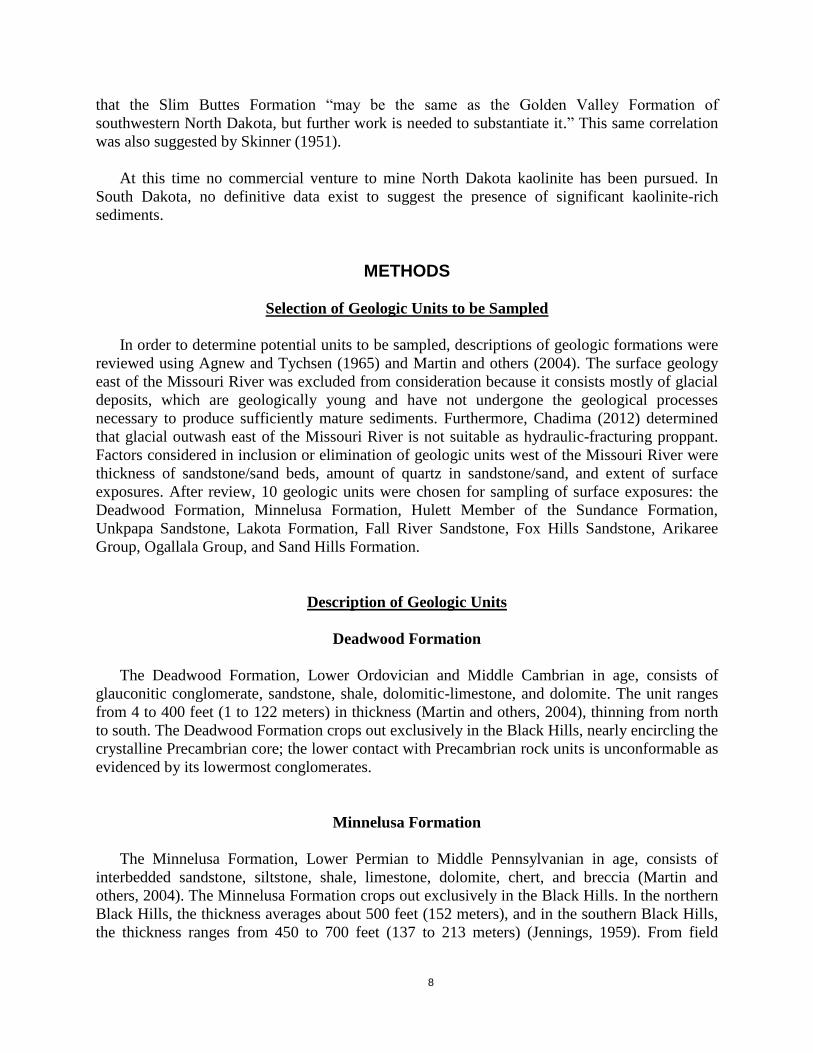
Sand that is too small for use in hydraulic fracturing (fines) may be used
as fill for mine reclamation, cow bedding, or other purposes.
Modified from Wisconsin Geological and Natural History Survey (2014)
Figure 1. Hydraulic fracturing sand as it appears in the quarry (raw), washed to remove
clay minerals, and sorted by size for various uses.
The American Petroleum Institute (API), the American National Standards Institute and the
International Standards Organization (ISO) recommend testing methodologies and specifications
for hydraulic fracturing sand (American Petroleum Institute, 1995; American National Standards
Institute/American Petroleum Institute, 2008). The primary considerations are the physical
3
aspects of the sand; size, sphericity, roundness, crush resistance, acid solubility, turbidity,
density, and mineralogy. The specifications from the American Petroleum Institute and the
American National Standards Institute are summarized in the remainder of this section of the
report.
Grain sizes within an individual sand sample are determined by sieve analysis which reveals
the grain-size distribution of a sample. The primary sand sizes used as proppants are in the 20/40
and 40/70 sieve sizes. For testing of the 20/40 size designation, sieves 16, 20, 30, 35, 40 and 50
are the recommended sizes. For testing of the 40/70 size designation, sieves 30, 40, 50, 60, 70
and 100 are recommended. The API recommends that at least 90 percent of a tested sand sample
falls between the designated sieve sizes. In addition, not more than 0.1 percent should be larger
than the first sieve size and not more than 1.0 percent should be smaller than the last sieve size.
For example when testing the 20/40 size designation, no more than 0.1 percent of the sample
should be retained on the 16 sieve and no more than 1.0 percent should be retained on the 50
sieve.
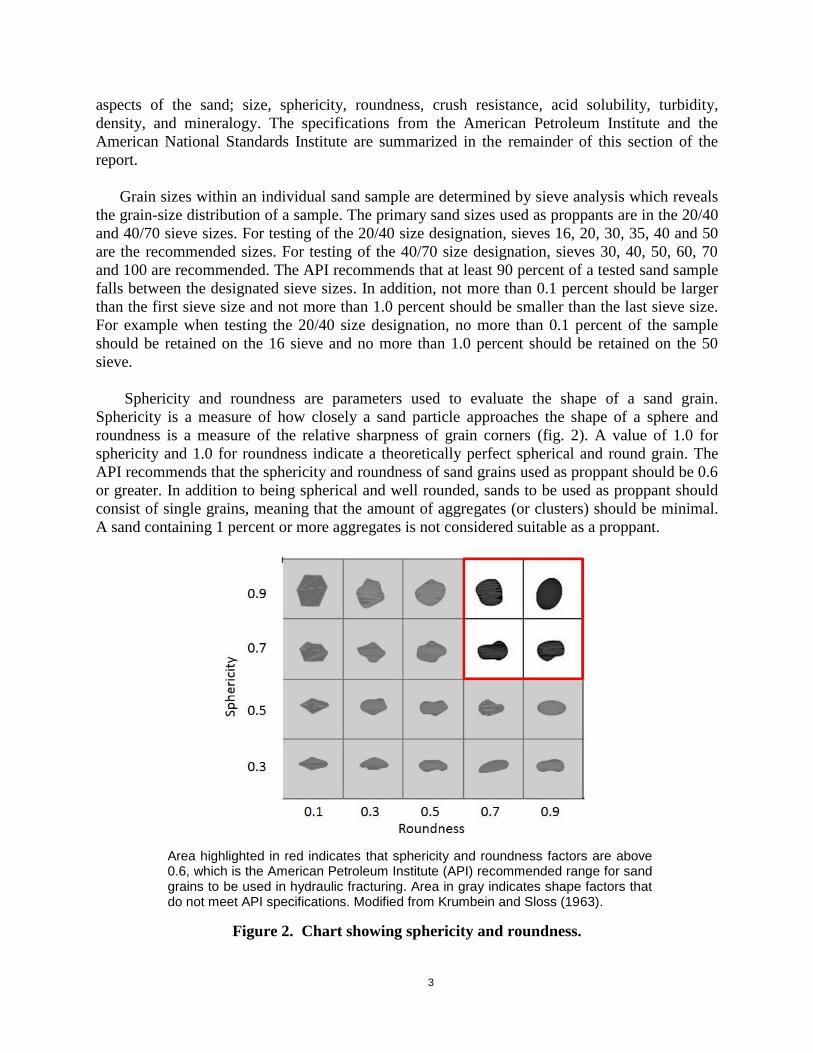
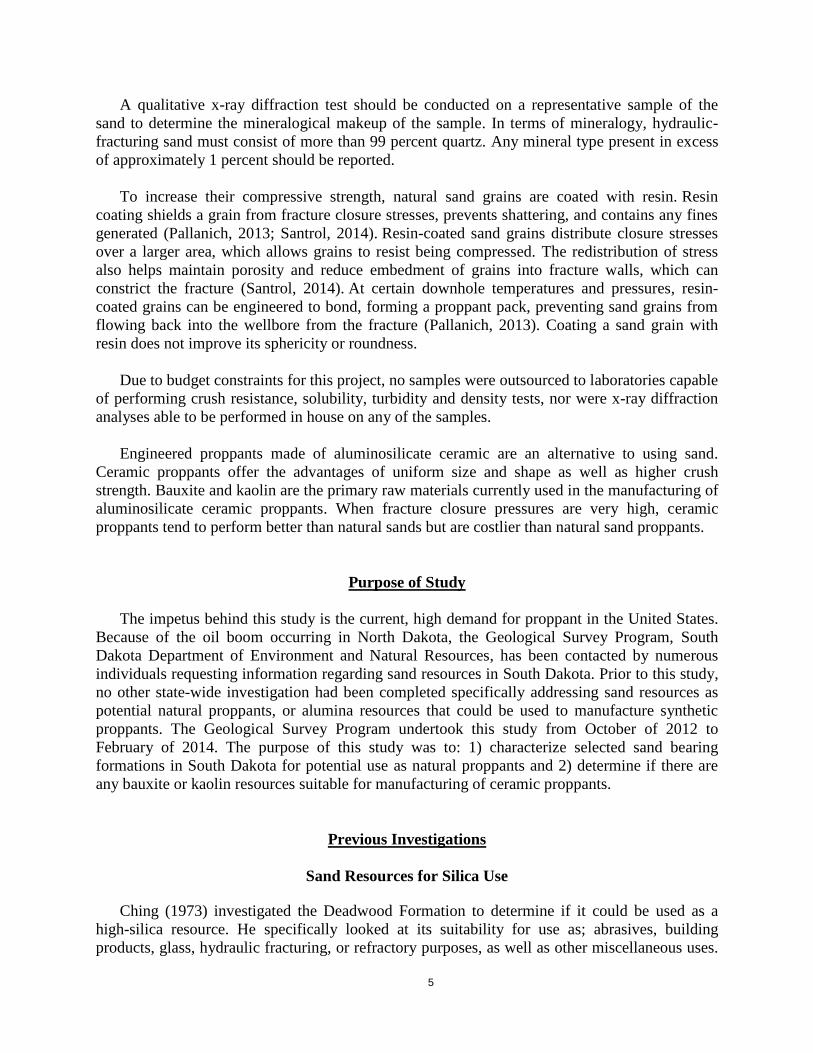
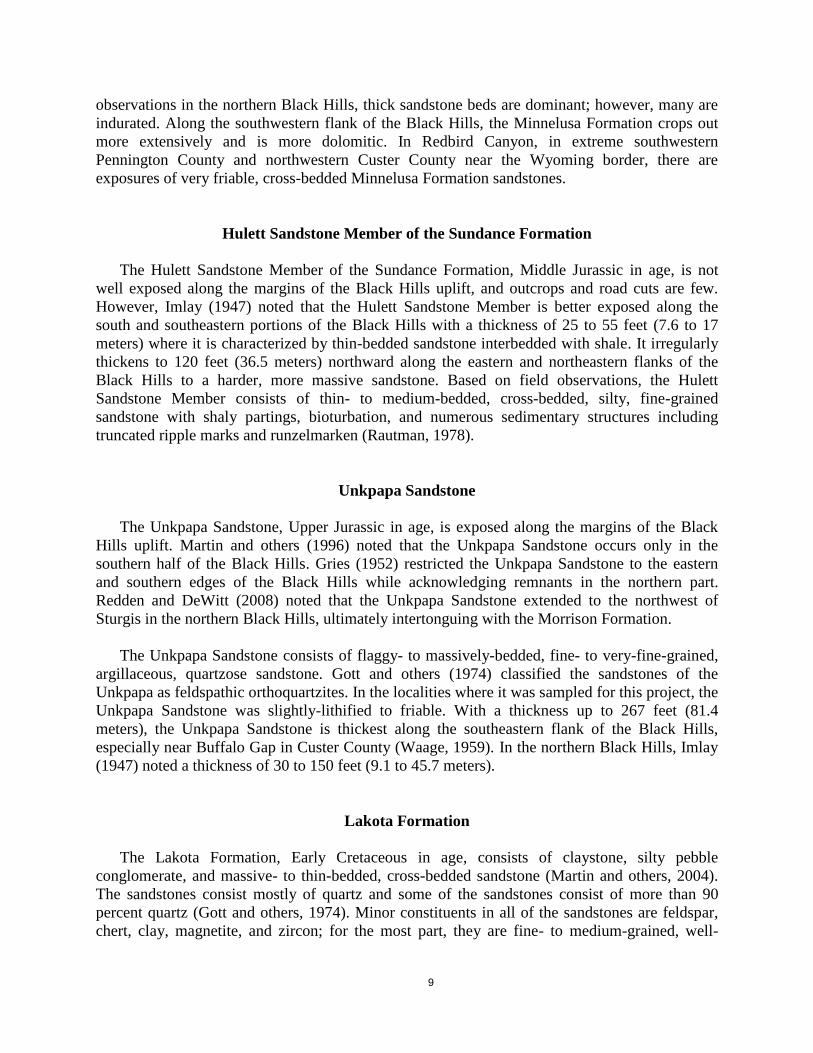
Sphericity and roundness are parameters used to evaluate the shape of a sand grain.
Sphericity is a measure of how closely a sand particle approaches the shape of a sphere and
roundness is a measure of the relative sharpness of grain corners (fig. 2). A value of 1.0 for
sphericity and 1.0 for roundness indicate a theoretically perfect spherical and round grain. The
API recommends that the sphericity and roundness of sand grains used as proppant should be 0.6
or greater. In addition to being spherical and well rounded, sands to be used as proppant should
consist of single grains, meaning that the amount of aggregates (or clusters) should be minimal.
A sand containing 1 percent or more aggregates is not considered suitable as a proppant.
Area highlighted in red indicates that sphericity and roundness factors are above 0.6, which is the American Petroleum Institute (API) recommended range for sand grains to be used in hydraulic fracturing. Area in gray indicates shape factors that do not meet API specifications. Modified from Krumbein and Sloss (1963).
Figure 2. Chart showing sphericity and roundness.
4
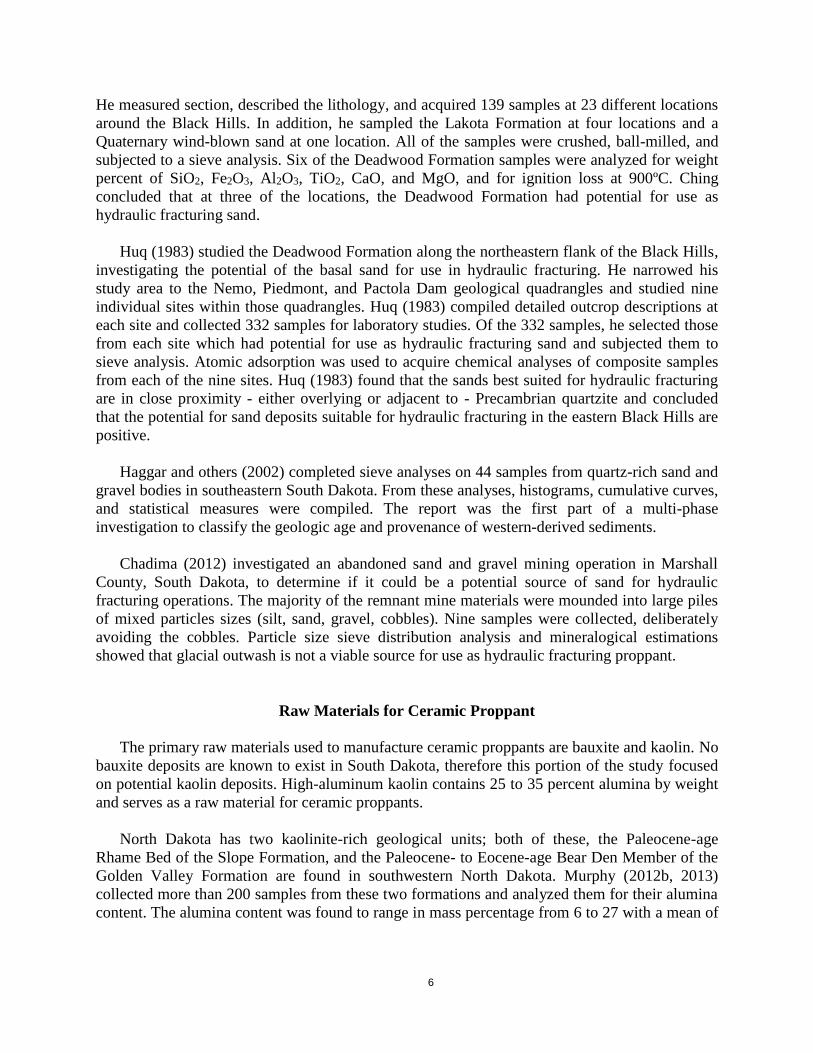
Crush-resistance is the resistance of a quartz grain under compressive loading. Crush-
resistance tests are conducted on samples to determine the amount of proppant crushed at a given
stress. Tests are conducted on samples that have been sieved so that all particles tested are within
the specified size range. This test determines the strength of a sand grain and is important
because it gives insight into how well sand grains will hold up under pressure. A sample is
subjected to a predetermined level of stress and the resulting crushed material generated is
measured in weight percent. Samples should not produce more than the maximum fines as
shown in table 1. Crush resistance K-Value is the highest stress level at which no more than 10
percent crushed material is generated.
Mesh size Load on cell (pound force)
Stress on sand in
pounds per square inch
Suggested maximum percent of fines by
weight
6/12 6,283
2,000 20
28/16 6,283
2,000 18
12/20 9,425
3,000 16
16/30 9,425
3,000 14
20/40 12,566
4,000 14
30/50 12,566
4,000 10
40/70 15,708
5,000 8
70/140 15,708 5,000 6
Modified from American Petroleum Institute (1995)
Table 1. Suggested maximum fines for frac sand crush resistance tests
Proppant sands may contain undesirable contaminants such as carbonates, feldspars, iron
oxides, and/or clays. An acid solubility test will indicate the amount of undesirable contaminants
and help in determining the suitability of a proppant in applications where the proppant may
come into contact with acids. Acid-soluble material in a sand sample should not exceed 2.0
percent by weight for sand sizes in the 6/12 through 30/50 mesh sizes, and 3.0 percent for sand in
the 40/70 through 70/140 mesh sizes.
Turbidity in water is due to suspended clay, silt, or finely divided inorganic matter. The
turbidity of a sand sample is measured by determining the amount of light passing through a
suspension of the sample that has been placed in distilled water. Sand to be used as proppant
should have values of 250 Formazin Turbidity Units (FTU) or less.
Density values are important properties of proppants. The bulk density is used to determine
the mass of a proppant needed to fill a fracture or storage tank. Apparent density is measured
with a low-viscosity fluid that wets the particle surface, and it includes the pore space within an
individual sand grain that is inaccessible to the fluid. Absolute density excludes pore space
within an individual sand grain as well as void spaces between sand grains.
5
A qualitative x-ray diffraction test should be conducted on a representative sample of the
sand to determine the mineralogical makeup of the sample. In terms of mineralogy, hydraulic-
fracturing sand must consist of more than 99 percent quartz. Any mineral type present in excess
of approximately 1 percent should be reported.
To increase their compressive strength, natural sand grains are coated with resin. Resin
coating shields a grain from fracture closure stresses, prevents shattering, and contains any fines
generated (Pallanich, 2013; Santrol, 2014). Resin-coated sand grains distribute closure stresses
over a larger area, which allows grains to resist being compressed. The redistribution of stress
also helps maintain porosity and reduce embedment of grains into fracture walls, which can
constrict the fracture (Santrol, 2014). At certain downhole temperatures and pressures, resin-
coated grains can be engineered to bond, forming a proppant pack, preventing sand grains from
flowing back into the wellbore from the fracture (Pallanich, 2013). Coating a sand grain with
resin does not improve its sphericity or roundness.
Due to budget constraints for this project, no samples were outsourced to laboratories capable
of performing crush resistance, solubility, turbidity and density tests, nor were x-ray diffraction
analyses able to be performed in house on any of the samples.
Engineered proppants made of aluminosilicate ceramic are an alternative to using sand.
Ceramic proppants offer the advantages of uniform size and shape as well as higher crush
strength. Bauxite and kaolin are the primary raw materials currently used in the manufacturing of
aluminosilicate ceramic proppants. When fracture closure pressures are very high, ceramic
proppants tend to perform better than natural sands but are costlier than natural sand proppants.
Purpose of Study
The impetus behind this study is the current, high demand for proppant in the United States.
Because of the oil boom occurring in North Dakota, the Geological Survey Program, South
Dakota Department of Environment and Natural Resources, has been contacted by numerous
individuals requesting information regarding sand resources in South Dakota. Prior to this study,
no other state-wide investigation had been completed specifically addressing sand resources as
potential natural proppants, or alumina resources that could be used to manufacture synthetic
proppants. The Geological Survey Program undertook this study from October of 2012 to
February of 2014. The purpose of this study was to: 1) characterize selected sand bearing
formations in South Dakota for potential use as natural proppants and 2) determine if there are
any bauxite or kaolin resources suitable for manufacturing of ceramic proppants.
Previous Investigations
Sand Resources for Silica Use
Ching (1973) investigated the Deadwood Formation to determine if it could be used as a
high-silica resource. He specifically looked at its suitability for use as; abrasives, building
products, glass, hydraulic fracturing, or refractory purposes, as well as other miscellaneous uses.
6
He measured section, described the lithology, and acquired 139 samples at 23 different locations
around the Black Hills. In addition, he sampled the Lakota Formation at four locations and a
Quaternary wind-blown sand at one location. All of the samples were crushed, ball-milled, and
subjected to a sieve analysis. Six of the Deadwood Formation samples were analyzed for weight
percent of SiO2, Fe2O3, Al2O3, TiO2, CaO, and MgO, and for ignition loss at 900ºC. Ching
concluded that at three of the locations, the Deadwood Formation had potential for use as
hydraulic fracturing sand.
Huq (1983) studied the Deadwood Formation along the northeastern flank of the Black Hills,
investigating the potential of the basal sand for use in hydraulic fracturing. He narrowed his
study area to the Nemo, Piedmont, and Pactola Dam geological quadrangles and studied nine
individual sites within those quadrangles. Huq (1983) compiled detailed outcrop descriptions at
each site and collected 332 samples for laboratory studies. Of the 332 samples, he selected those
from each site which had potential for use as hydraulic fracturing sand and subjected them to
sieve analysis. Atomic adsorption was used to acquire chemical analyses of composite samples
from each of the nine sites. Huq (1983) found that the sands best suited for hydraulic fracturing
are in close proximity - either overlying or adjacent to - Precambrian quartzite and concluded
that the potential for sand deposits suitable for hydraulic fracturing in the eastern Black Hills are
positive.
Haggar and others (2002) completed sieve analyses on 44 samples from quartz-rich sand and
gravel bodies in southeastern South Dakota. From these analyses, histograms, cumulative curves,
and statistical measures were compiled. The report was the first part of a multi-phase
investigation to classify the geologic age and provenance of western-derived sediments.
Chadima (2012) investigated an abandoned sand and gravel mining operation in Marshall
County, South Dakota, to determine if it could be a potential source of sand for hydraulic
fracturing operations. The majority of the remnant mine materials were mounded into large piles
of mixed particles sizes (silt, sand, gravel, cobbles). Nine samples were collected, deliberately
avoiding the cobbles. Particle size sieve distribution analysis and mineralogical estimations
showed that glacial outwash is not a viable source for use as hydraulic fracturing proppant.
Raw Materials for Ceramic Proppant
The primary raw materials used to manufacture ceramic proppants are bauxite and kaolin. No
bauxite deposits are known to exist in South Dakota, therefore this portion of the study focused
on potential kaolin deposits. High-aluminum kaolin contains 25 to 35 percent alumina by weight
and serves as a raw material for ceramic proppants.
North Dakota has two kaolinite-rich geological units; both of these, the Paleocene-age
Rhame Bed of the Slope Formation, and the Paleocene- to Eocene-age Bear Den Member of the
Golden Valley Formation are found in southwestern North Dakota. Murphy (2012b, 2013)
collected more than 200 samples from these two formations and analyzed them for their alumina
content. The alumina content was found to range in mass percentage from 6 to 27 with a mean of
7
18 percent in the Rhame Bed, and from 7 to 34 percent with a mean of 21 percent in the Bear
Den Member (Murphy, 2012a).
Occurrence of the Rhame Bed and the Bear Den Member in southwestern North Dakota
prompted a review of scientific literature in order to determine if these units may correlate with
any units in northwestern South Dakota. The Slope Formation and the Bear Den Member of the
Golden Valley Formation are not formally recognized rock units in South Dakota.
In North Dakota, the Rhame Bed typically consists of a sequence of two dominant
lithologies: a discontinuous cap composed primarily of silcrete which may be a few inches to a
few feet thick that is underlain by a deep-weathering profile enriched in kaolinite (Wehrfritz,
1978; Murphy, 2013). The average thickness of the Rhame Bed silcrete is 1.4 feet (0.43 m), and
the underlying kaolinitic sediment has an average thickness of approximately 20 feet (6 m)
(Wehrfritz, 1978).
Numerous geologists have recognized and described Paleocene-age silcretes in South Dakota
(Todd, 1898; Winchester and others, 1916; Denson and others, 1959; Pipiringos and others,
1965; Bolin 1956a and 1956b; Curtiss 1955a and 1955b). Upper-Paleocene age Tongue River
Formation silcretes have been described in northwestern South Dakota at North Cave Hills, and
on Anarchist Butte (Pipiringos and others, 1965). In addition, Paleocene-age silcretes have been
identified in the Slim Buttes area, as well as at a few other locations (Todd, 1898; Winchester
and others, 1916; Denson and others, 1959). The Tongue River Formation silcretes in South
Dakota may be correlative with the Rhame Bed silcretes of North Dakota. The average thickness
of these silcretes in South Dakota is unknown. In general, the presence of kaolinite in sediments
beneath South Dakota silcretes has not been addressed in the literature; kaolinite has only been
mentioned beneath silcrete outcrops in the North Cave Hills and at Anarchist Butte.
In North Dakota, the Golden Valley Formation consists of two members, the upper Camels
Butte Member and the lower Bear Den Member. The Camels Butte Member is characterized by
the presence of fossil megaspores of the distinctive floating fern Salvinia in its basal portion, and
by micaceous sediments throughout (Hickey, 1977). It is yellow to tan in color consisting of
strata containing illite and montmorillonite clay minerals. The underlying Bear Den Member is
recognized by its kaolinite clay content and strata that weather into three distinctly colored
zones: a basal gray, middle orange, and an upper carbonaceous purplish gray (Hickey, 1977).
Kaolinite is overwhelmingly prevalent in the orange zone where it averages more than 80 percent
of the total clay fraction (Hickey, 1977; Clechenko, 2004). The upper boundary of the Bear Den
Member is a thin bed of lignite or its lateral equivalent: a silicified siltstone (silcrete), or
freshwater limestone (Hickey, 1977). The thickness of the Bear Den Member ranges from 5 to
65 feet (2 to 20 meters), with the kaolinite-enriched zone averaging 25 feet (7.6 meters) in
thickness (Hickey, 1977).
In South Dakota, an Eocene-age stratigraphic unit named the Slim Buttes Formation was
introduced as a rock sequence in Harding County (Malhotra and Tegland, 1960). Malhotra and
Tegland (1960) evaluated the mineralogy of the Slim Buttes Formation and found the heavy
mineral content to ubiquitously contain biotite mica. Fossil megaspores of the fern Salvinia have
been found in the Slim Buttes area (Jain and Hall, 1969). Agnew and Tychsen (1965) suggested
8
that the Slim Buttes Formation “may be the same as the Golden Valley Formation of
southwestern North Dakota, but further work is needed to substantiate it.” This same correlation
was also suggested by Skinner (1951).
At this time no commercial venture to mine North Dakota kaolinite has been pursued. In
South Dakota, no definitive data exist to suggest the presence of significant kaolinite-rich
sediments.
METHODS
Selection of Geologic Units to be Sampled
In order to determine potential units to be sampled, descriptions of geologic formations were
reviewed using Agnew and Tychsen (1965) and Martin and others (2004). The surface geology
east of the Missouri River was excluded from consideration because it consists mostly of glacial
deposits, which are geologically young and have not undergone the geological processes
necessary to produce sufficiently mature sediments. Furthermore, Chadima (2012) determined
that glacial outwash east of the Missouri River is not suitable as hydraulic-fracturing proppant.
Factors considered in inclusion or elimination of geologic units west of the Missouri River were
thickness of sandstone/sand beds, amount of quartz in sandstone/sand, and extent of surface
exposures. After review, 10 geologic units were chosen for sampling of surface exposures: the
Deadwood Formation, Minnelusa Formation, Hulett Member of the Sundance Formation,
Unkpapa Sandstone, Lakota Formation, Fall River Sandstone, Fox Hills Sandstone, Arikaree
Group, Ogallala Group, and Sand Hills Formation.
Description of Geologic Units
Deadwood Formation
The Deadwood Formation, Lower Ordovician and Middle Cambrian in age, consists of
glauconitic conglomerate, sandstone, shale, dolomitic-limestone, and dolomite. The unit ranges
from 4 to 400 feet (1 to 122 meters) in thickness (Martin and others, 2004), thinning from north
to south. The Deadwood Formation crops out exclusively in the Black Hills, nearly encircling the
crystalline Precambrian core; the lower contact with Precambrian rock units is unconformable as
evidenced by its lowermost conglomerates.
Minnelusa Formation
The Minnelusa Formation, Lower Permian to Middle Pennsylvanian in age, consists of
interbedded sandstone, siltstone, shale, limestone, dolomite, chert, and breccia (Martin and
others, 2004). The Minnelusa Formation crops out exclusively in the Black Hills. In the northern
Black Hills, the thickness averages about 500 feet (152 meters), and in the southern Black Hills,
the thickness ranges from 450 to 700 feet (137 to 213 meters) (Jennings, 1959). From field
9
observations in the northern Black Hills, thick sandstone beds are dominant; however, many are
indurated. Along the southwestern flank of the Black Hills, the Minnelusa Formation crops out
more extensively and is more dolomitic. In Redbird Canyon, in extreme southwestern
Pennington County and northwestern Custer County near the Wyoming border, there are
exposures of very friable, cross-bedded Minnelusa Formation sandstones.
Hulett Sandstone Member of the Sundance Formation
The Hulett Sandstone Member of the Sundance Formation, Middle Jurassic in age, is not
well exposed along the margins of the Black Hills uplift, and outcrops and road cuts are few.
However, Imlay (1947) noted that the Hulett Sandstone Member is better exposed along the
south and southeastern portions of the Black Hills with a thickness of 25 to 55 feet (7.6 to 17
meters) where it is characterized by thin-bedded sandstone interbedded with shale. It irregularly
thickens to 120 feet (36.5 meters) northward along the eastern and northeastern flanks of the
Black Hills to a harder, more massive sandstone. Based on field observations, the Hulett
Sandstone Member consists of thin- to medium-bedded, cross-bedded, silty, fine-grained
sandstone with shaly partings, bioturbation, and numerous sedimentary structures including
truncated ripple marks and runzelmarken (Rautman, 1978).
Unkpapa Sandstone
The Unkpapa Sandstone, Upper Jurassic in age, is exposed along the margins of the Black
Hills uplift. Martin and others (1996) noted that the Unkpapa Sandstone occurs only in the
southern half of the Black Hills. Gries (1952) restricted the Unkpapa Sandstone to the eastern
and southern edges of the Black Hills while acknowledging remnants in the northern part.
Redden and DeWitt (2008) noted that the Unkpapa Sandstone extended to the northwest of
Sturgis in the northern Black Hills, ultimately intertonguing with the Morrison Formation.
The Unkpapa Sandstone consists of flaggy- to massively-bedded, fine- to very-fine-grained,
argillaceous, quartzose sandstone. Gott and others (1974) classified the sandstones of the
Unkpapa as feldspathic orthoquartzites. In the localities where it was sampled for this project, the
Unkpapa Sandstone was slightly-lithified to friable. With a thickness up to 267 feet (81.4
meters), the Unkpapa Sandstone is thickest along the southeastern flank of the Black Hills,
especially near Buffalo Gap in Custer County (Waage, 1959). In the northern Black Hills, Imlay
(1947) noted a thickness of 30 to 150 feet (9.1 to 45.7 meters).
Lakota Formation
The Lakota Formation, Early Cretaceous in age, consists of claystone, silty pebble
conglomerate, and massive- to thin-bedded, cross-bedded sandstone (Martin and others, 2004).
The sandstones consist mostly of quartz and some of the sandstones consist of more than 90
percent quartz (Gott and others, 1974). Minor constituents in all of the sandstones are feldspar,
chert, clay, magnetite, and zircon; for the most part, they are fine- to medium-grained, well-
10
sorted, locally calcareous, and rounded to subrounded (Gott and others, 1974). The Lakota
Formation ranges from 35 to 100 feet (11 to 30.4 meters) in thickness (Martin and others, 2004).
In the southwestern Black Hills, at many localities in Fall River and Custer Counties, very
friable sandstone beds of the Lakota Formation were encountered. Other friable Lakota
sandstones were identified in outcrop or sent in by fine-aggregate mine operators from
southwestern Meade County.
Fall River Sandstone
The Fall River Sandstone, Early Cretaceous in age, consists of calcareous mudstone and
shale, siltstone, cross-bedded, fine-grained, micaceous, ferruginous, locally calcareous
sandstone, and thin streaks and seams of coal and carbonaceous shale (Martin and others, 2004).
Waage (1959) described the Fall River Sandstone as predominantly sandstone with some
interbedded shale and siltstone; he also gave a thickness of 110 to 160 feet (33.5 to 48.8 meters)
in the Black Hills. He listed several defining characteristics for the formation such as fine grain
size, laminated mudstones and siltstones, tabular, laminated to cross-bedded sandstones, and
abundant sedimentary structures (Waage, 1959). From the southern Black Hills, the Fall River
Sandstone thins northward (Waage, 1959). In the southern Black Hills, sandstone beds are
frequently massive, but north of Hermosa, South Dakota, the massive sandstone beds become
thinner and less frequent and are replaced with interbedded sandstone, siltstone, and shale
(Waage, 1959).
Fox Hills Sandstone
The Fox Hills Sandstone, Late Cretaceous in age, consists of fine- to coarse-grained cross-
bedded sandstone, argillaceous sandstone, arenaceous shales, ferruginous stringers, and
siltstones, and ranges from 25 to 400 feet (7.6 to 122 meters) in thickness (Martin and others,
2004). The Fox Hills Sandstone extends from Harding and Butte Counties in the west to Jackson,
Haakon, Ziebach, Dewey, and Corson Counties in the east (Martin and others, 2004). The Fox
Hills Sandstone in Harding and Butte Counties was an ancient delta that built eastward into the
Fox Hills Sea, which covered what is currently Jackson, Haakon, Ziebach, Dewey, and Corson
Counties (Hoganson, 2007).
In a delta environment, coarser sand is deposited in river channels on the delta and in sand
bars along the shorelines. The finer sand along with silt and clay is carried out by the rivers and
deposited along the sea bed further away from the delta. Therefore, the coarsest sand in the Fox
Hills Sandstone should be found in Harding, Butte, and northwestern Meade Counties, at the
delta margins.
11
Arikaree Group
The Arikaree Group is Oligocene and Miocene in age and consists of siltstone, sandstone,
volcanic ash, claystone, and marl (Martin and others, 2004). The Arikaree Group crops out
extensively in southwestern and south-central South Dakota, and isolated outcrops are found at
West and East Short Pine Hills and Slim Buttes in Harding County (Baker, 1952; Martin and
others, 2004).
In northwestern Nebraska, Schultz (1938) described 200 feet of fine-grained, friable
sandstone in the Arikaree Group; in south-central Shannon County, the Arikaree Group consists
of gray, massive, noncalcareous, moderately consolidated, fine- to very-fine-grained sandstone
with interbedded marl and limestone, some of which may be nodular (Harksen, 1965). However,
past analysis of some sandstones from the Arikaree Group indicates mostly fine to very-fine
grain size consisting of a significant fraction of volcanic materials (Harksen and Macdonald,
1969).
Ogallala Group
The Ogallala Group, Pliocene and Miocene in age, consists of sandstone, calcareous
sandstone, silty limestone, fluvial siltstones, claystone with interbedded sandstone, bentonitic
clay, conglomerate, and western-derived gravels (Martin and others, 2004). The Ogallala Group
is found in south-central South Dakota and extends directly eastward from Shannon County to
Gregory County (Martin and others, 2004). Isolated outliers of Ogallala Group are found in
Jackson, Mellette, northern Tripp, Lyman, Brule, and extreme northwestern Charles Mix
Counties (Martin and others, 2004).
Well-cemented sandstones, volcanic ash, and lacustrine limestones and indurated sandstones
and siltstones, informally known as “mortar beds” are common in the upper part of the Ogallala
Group (Sevon, 1960; Harksen and Macdonald, 1969). The lower Ogallala Group generally
consists of friable, fine- to medium-grained, well sorted, locally calcareous, subangular to
subrounded, arkosic sandstone (Collins, 1959). Local cross-bedding is evident in addition to a
quartz- and feldspar-pebble conglomerate with localized calcite cement in the lower part
(Collins, 1959). Volcanic ash beds might be locally present throughout the unit (Collins, 1960;
Sevon, 1960).
Sand Hills Formation
The Sand Hills Formation, Quaternary in age, consists of eolian sand deposits derived from
Tertiary sandstones; it is primarily exposed in southern Bennett, Todd, and southeastern Shannon
Counties. The Sand Hills Formation consist of fine- to medium-grained sand reworked by wind
into dunes, some up to 160 feet high (Collins, 1959). The sand is unconsolidated, rounded to
well-rounded and consists mostly of quartz with some feldspar (Sevon, 1960). Because the sand
is mostly derived from the Arikaree and Ogallala Groups, it is locally calcareous, and there is
difficulty distinguishing the Sand Hills Formation from older deposits in some areas (Filipovic,
12
2011). There has been some migration of the dunes and blowouts between them, but most of the
dunes are being vegetated which stabilizes them. The maximum thickness of the Sand Hills
Formation in South Dakota is approximately 200 feet (61 meters).
Acquisition of Samples
Sampling by Geological Survey Program staff commenced during the last week of November
2012 and concluded in late July 2013. The project focused on three main areas: the Black Hills,
Bennett County, and the Fox Hills Sandstone exposures in Harding, Butte, and Meade Counties.
Samples were collected from surface exposures. Once a surface exposure was chosen for
sampling, it was cleared of debris to reduce potential contamination. Where surface exposures
were friable, composite channel samples were collected. Otherwise, “grab” samples were
obtained which consisted of breaking off a fist-sized chunk of the geologic unit every few feet
within the sample interval or collecting float along the surface exposure. Approximately 12
pounds of representative sample were collected and placed into a cloth bag. During collection,
pictures were taken of the sampling location, and the latitude and longitude were acquired using
a Garmin GPSMAP® 60CSx handheld Global Positioning System.
In February 2013, samples of sandstone/sand were solicited via letter from fine-aggregate
mine operators having mailing addresses in western South Dakota. Although this solicitation for
samples was not restricted to specific geologic units, a copy of some general specifications from
the American Petroleum Institute regarding the suitability of sand for use in hydraulic fracturing
applications was provided to the operators. If the operators thought that their aggregate might
meet the specifications, the operators were invited to send a 5 pound sample to the Geological
Survey Program for analysis. The sample location and the Geologic Map of South Dakota
(Martin and others, 2004) were used to determine the geologic unit sampled, if possible.
A total of 231 samples were collected from surface exposures in the field and another 26
samples were received from fine-aggregate mine operators. Fourteen of these samples were not
processed due to reasons described in the “Processing of Samples” section of this report. The
sample locations of the remaining 243 samples processed are shown in figure 3.
Several samples received from fine-aggregate mine operators were determined to be acquired
from the Lakota Formation and Unkpapa Sandstone; those geologic units are described above. It
was determined that the rest of the samples received from mine operators were acquired from the
Tertiary White River Group or Quaternary unconsolidated deposits (outwash valley train, terrace
deposits, and alluvium). There were six samples in which the geologic unit could not be
identified with the information provided. In this situation, the geologic unit of origin was
classified as Unknown, however, most of these samples are probably Quaternary in age.
13
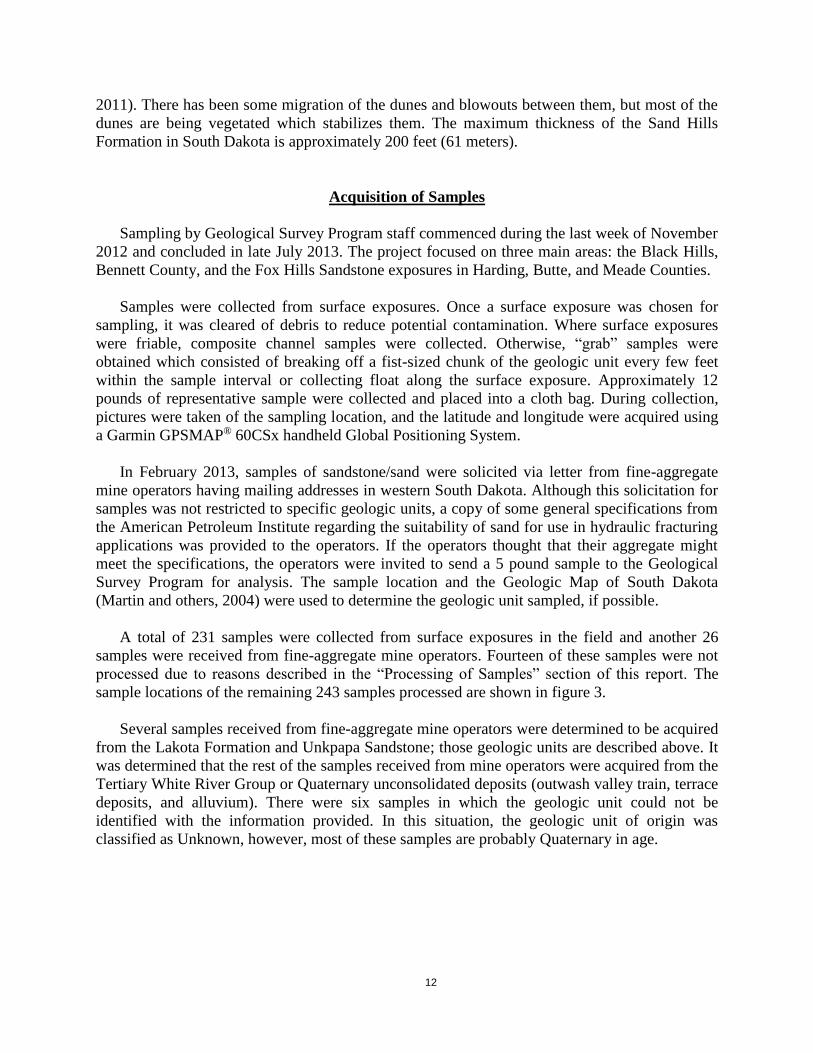
Numbers in parentheses indicate the number of samples collected for that geologic unit.
Figure 3. Locations of sand bearing geologic units sampled and locations of samples
submitted by fine-aggregate mine operators.
Sample Locations
Locational information for the 243 samples that were processed are available in a Microsoft®
Excel file at http://sddenr.net/fracsand/hfsc-locational-data.xlsx. The Excel file includes
information on sample location, formations sampled, intervals sampled, and links to field
photographs, field data sheets, and the sieve results.
Processing of Samples
All samples were assessed in the laboratory in order to determine if they were
consolidated/cemented or unconsolidated. Consolidated/cemented samples were passed through
a Braun Chipmunk VD67 crusher for disaggregation. Pieces of rock too big to fit into the crusher
were initially broken with a hammer before being placed in the crusher. The entire sample was
14
passed through the crusher to help homogenize it. Unconsolidated samples were not run through
the crusher since no further disaggregation was needed.
Samples were tested for the presence of carbonate minerals by applying dilute hydrochloric
acid. Next, samples were divided into two equal portions by pouring them into a sample splitter.
The sample was divided until approximately 80 to 120 grams of sample were collected.
Prior to disaggregation, samples HFSC-2012-009, HFSC-2012-034, HFSC-2012-050,
HFSC-2012-070, HFSC-2012-073, HFSC-2013-081, HFSC-2013-082, HFSC-2013-088,
HFSC-2013-095, HFSC-2013-118, HFSC-2013-122, and HFSC-2013-235 were removed from
the study because upon visual inspection it was determined that they contained greater than 75
percent clay. Sample HFSC-2013-256 was removed from the study because it was determined to
be weathered phonolite and contained no sand grains. Sample HFSC-2013-106 was removed
from the study because it was suspected of having been contaminated with sample
HFSC-2013-107.
Further disaggregation was accomplished by pouring the sample split through a 4 sieve to
collect any oversized rocks and/or larger aggregates. The oversized rocks were removed,
weighed and noted on the sieve data sheet. Larger aggregates were placed in an iron mortar and
pounded gently with a pestle in an up and down motion, as prescribed by Folk (1980). The
remaining sample that passed through the 4 sieve was spread out onto a flat metal pan and rolled
over with a rolling pin. The rolling pin was used until it appeared there were no more aggregates
present. Due to the hardness of many of the samples it was impossible to fully disaggregate all
the samples. Disaggregated material from the iron mortar and metal pan were recombined to be
sieved.
Every 20th sample was processed as a duplicate, to check for consistency in the
disaggregation method. A hardness descriptor (unconsolidated, very friable, friable, fairly
friable, soft, fairly soft, fairly hard, hard, and very hard) was noted on each sieve data sheet, to
provide a general overview on the difficulty of disaggregating the sample.
Samples ready to be sieved were weighed on a Mettler Toledo AE160 balance. Samples
weighing more than 120 grams were placed on a piece of wax paper, and a quartering technique
was employed until the weight was reduced to between 80 and 120 grams.
ANALYSIS OF SAMPLES
Sieving of Samples
Sieving was accomplished using Fisherbrand U.S. Standard 8-inch diameter brass sieves. A
W.S. Tyler Ro-Tap was used to mechanically shake the sieves. The Ro-Tap can only hold six
nested sieves plus the pan, so two sieve stacks were used. The first sieve stack consisted of the
16, 20, 30, 35, 40, and 50 sieves; the second stack consisted of the 60, 70, 100, 120, 140, and 5
(as a place holder) sieves. Each sample was poured into the first stack of sieves and was shaken
in the Ro-Tap for 10 minutes. Once shaking was complete on the first stack, the pan contents
15
were poured into the second stack of sieves and was shaken in the Ro-Tap for an additional 10
minutes.
To remove as many grains as possible from the sieve screens, each sieve was inverted over a
piece of creased aluminum foil and gently tapped to loosen grains. The screen was then gently
worked with a brass and/or nylon brush in a circular motion. The grains that collected on the foil
were poured into a weighing boat and then weighed.
After weighing, each sieve fraction was photographed using a Leica EZ4HD stereo
microscope with an integrated 3.0 mega-pixel CMOS camera connected to a Gateway E-155C
laptop. A small amount of material from each sieve fraction was spread out over a black
background. The sieve fraction was positioned under the microscope until numerous grains with
some separation between them could be seen. Photomicrographs were captured and annotated
using Leica LAS EZ software. Material retained on the 16 to 40 sieves were photographed at 8X
magnification. Material retained on the 50 sieve to the pan was photographed at 30X
magnification.
Percent Aggregate Estimation
Photomicrographs were used to estimate the amount of aggregates retained on each sieve.
Due to the difficulty in estimating exact percentages, four divisions were used to classify the
amount of aggregates retained on each sieve: 100 percent (all aggregates), greater than 70
percent (99% to 70% aggregates), 30-70 percent and less than 30 percent (0 to 30% aggregates).
A designation of NA (not applicable) means nothing was retained on that sieve fraction.
Effect of Aggregates on Sieve Data
The quantity of aggregates composed of smaller grains cemented together presented a
problem in conducting a meaningful analysis of the sieve data. Recommendations by API
regarding sampling and testing are for samples that are being supplied by the sand supplier or
service company to the user, meaning that the sand has potentially undergone several processing
steps. Data from this study should be considered as being acquired from “raw” materials that
have undergone only one processing step (crushing). Samples containing more than 1 percent
aggregates could not be strictly evaluated using API-recommended size-distribution
specifications. However, sieve results are generally presented as if the samples qualified for
evaluation under the API standards because there are no available standards for raw material.
Qualitative Assessment of Mineralogy, Sphericity, and Roundness
A qualitative analysis of all samples was completed. This analysis incorporated all available
information for each sample. Sieve weight data were used in conjunction with the
photomicrographs to determine if the sample contained a significant amount (visual estimate of
>10%) of clay, minerals other than quartz, and/or rock fragments. Photomicrographs were used
16
to estimate the sphericity and roundness (i.e., angular or rounded, spherical or elongated) of
individual grains.
RESULTS
Sieve Analysis
Sieve analysis was conducted on 243 samples. Twenty five of these samples were received
from fine-aggregate mine operators. Information on location and a summarization of sieve
weight data for each sample is presented in table format in the appendix.
Sieve results data are available in a Microsoft® Excel file at http://sddenr.net/fracsand/hfsc-
sieve-data.xlsx. Clicking on an individual sample number link will open a separate worksheet
that contains two charts (a histogram and a grain-size distribution curve), a percent aggregate
estimation, a hardness description, and whether or not the sample reacted to hydrochloric acid.
Within this worksheet are links to the sieve photomicrographs and to the worksheet containing
sieve data. Care should be taken when interpreting charts without consulting other data provided
(photomicrographs and aggregate estimation) because the charts do not reveal the amount of
aggregates present on each sieve.
Results from Geologic Units Sampled
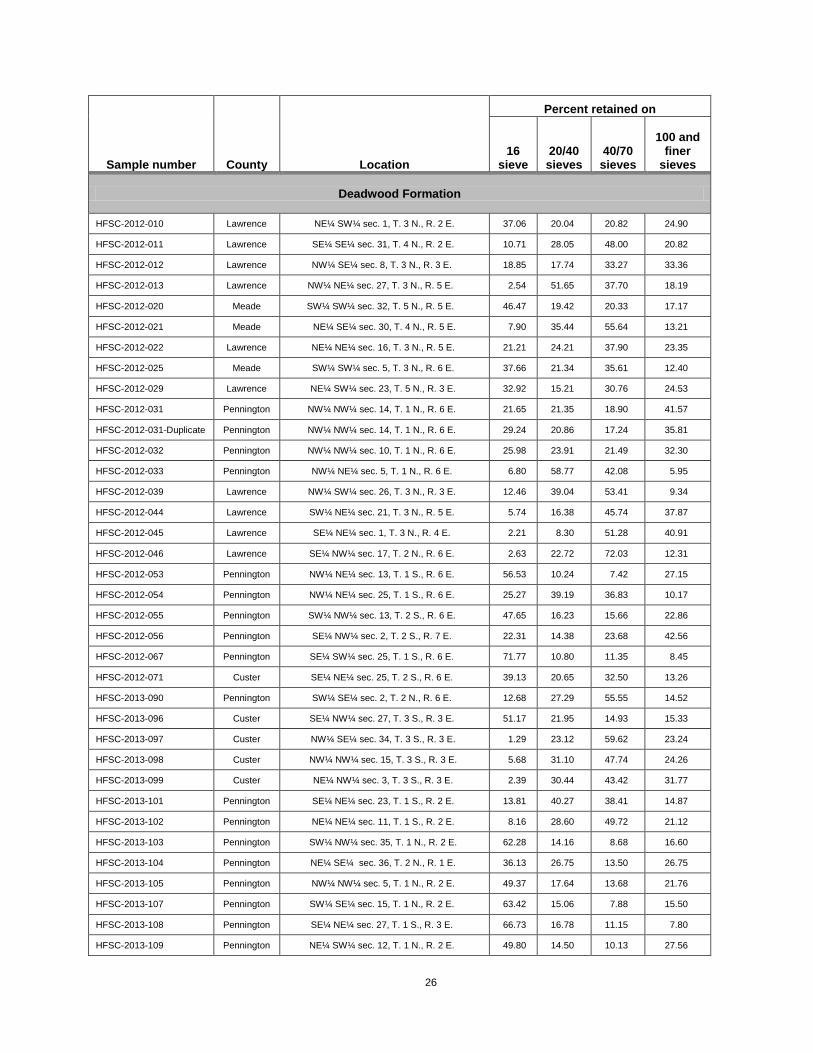
Deadwood Formation
Of the 41 samples collected from the Deadwood Formation, all failed to meet API-
recommended size distribution specifications. All of the samples had more than 0.1 percent
retained on the 16 sieve and more than 1.0 percent retained on the 100 and finer sieves. None of
the samples had more than 90 percent retained on the 20/40 or 40/70 sieves.
Most of the Deadwood Formation samples are hard and cemented with silica or calcite, and
most contain a significant amount of minerals other than quartz, rock fragments, and/or
aggregates. The majority of the quartz grains in all the Deadwood Formation samples are
angular, elongated, and/or moderately- to severely-iron stained.
Minnelusa Formation
Of the 62 samples acquired from the Minnelusa Formation, 14 had less than 0.1 percent
retained on the 16 sieve. However, all samples failed to meet API-recommended size distribution
specifications because they had more than 1.0 percent retained on the 100 and finer sieves. None
of the samples had more than 90 percent retained on the 20/40 or 40/70 sieves.
Most of the Minnelusa Formation samples tested positive for carbonates (11 did not) and
most contain a significant amount of clay or minerals other than quartz. Because many
17
Minnelusa Formation samples are fine grained and cemented with carbonates, weight
percentages on the 40 and coarser sieves are primarily aggregates.
Hulett Sandstone Member of the Sundance Formation
All 13 samples collected from the Hulett Sandstone Member of the Sundance Formation
tested positive for carbonate minerals. Almost without exception, all sieves but the 140 sieve and
pan contained 100 percent aggregates, indicating very-fine-grained sandstone, well- to loosely-
cemented with carbonates. One of the samples had less than 0.1 percent retained on the 16 sieve,
however, all failed to meet API-recommended size distribution specifications because they had
more than 1.0 percent retained on the 100 and finer sieves. None of the samples had more than
90 percent retained on the 20/40 or 40/70 sieves.
All of the samples from the Hulett Sandstone Member of the Sundance Formation appeared
to consist of predominantly quartz with only minor amounts of minerals other than quartz. The
majority of the grains for all samples are angular and would not meet API sphericity and
roundness specifications.
Unkpapa Sandstone
Of the six samples collected from the Unkpapa Sandstone, three had less than 0.1 percent
retained on the 16 sieve. However, all samples failed to meet API-recommended size distribution
specifications because they had more than 1.0 percent retained on the 100 and finer sieves. None
of the samples had more than 90 percent retained on the 20/40 or 40/70 sieves.
All of the samples collected from the Unkpapa Sandstone appear to consist predominantly of
quartz with only minor amounts of minerals other than quartz.
Lakota Formation
Of the 28 samples collected from the Lakota Formation, 14 had less than 0.1 percent retained
on the 16 sieve. However, all samples failed to meet API-recommended size distribution
specifications because all had more than 1.0 percent retained on the 100 and finer sieves. None
of the samples had more than 90 percent retained on the 20/40 or 40/70 sieves.
The majority of the Lakota Formation samples contain a significant amount of minerals other
than quartz or rock fragments, and most of the quartz grains are too angular to meet API
sphericity and roundness specifications.
18
Fall River Sandstone
Of the 21 samples collected from the Fall River Sandstone, 5 had less than 0.1 percent
retained on the 16 sieve. However, all samples failed to meet API-recommended size distribution
specifications because they had more than 1.0 percent retained on the 100 and finer sieves. None
of the samples had more than 90 percent retained on the 20/40 or 40/70 sieves.
The majority of the Fall River Sandstone samples contain a significant amount of clay,
minerals other than quartz, or rock fragments. For those few samples that appear to be
dominantly quartz, the majority of the grains are angular and would not meet API sphericity and
roundness specifications.
Lakota Formation or Fall River Sandstone
A single sample was collected from an undifferentiated sandstone in the Inyan Kara Group
and could not be determined in the field to be definitively from either the Lakota Formation or
the Fall River Sandstone. Thus, for the purposes of this study, the geologic unit was assigned as
Lakota-Fall River Sandstone. This sample failed to meet API-recommended size distribution
specifications because more than 0.1 percent was retained on the 16 sieve and more than 1.0
percent was retained on the 100 and finer sieves. This sample did not have more than 90 percent
retained on the 20/40 or 40/70 sieves.
This sample consists predominantly of quartz with only minor amounts of minerals other
than quartz.
Fox Hills Sandstone
Of the 37 samples collected from the Fox Hills Sandstone, 8 had less than 0.1 percent
retained on the 16 sieve. However, all samples failed to meet API-recommended size distribution
specifications because they had more than 1.0 percent retained on the 100 and finer sieves. None
of the samples had more than 90 percent retained on the 20/40 or 40/70 sieves.
In addition, all of the Fox Hills Sandstone samples contain a significant amount of clay,
minerals other than quartz, and/or rock fragments.
White River Group
Two samples were collected from the White River Group. These samples failed to meet API-
recommended size distribution specifications because they had more than 0.1 percent retained on
the 16 sieve and more than 1.0 percent retained on the 100 and finer sieves. Neither sample had
more than 90 percent retained on the 20/40 or 40/70 sieves.
19
One of the White River Group samples contains a moderate amount of minerals other than
quartz. The majority of the grains are angular and would not meet API sphericity and roundness
specifications. The other White River Group sample is composed almost entirely of clay.
Arikaree Group
Of the five samples collected from the Arikaree Group, two had less than 0.1 percent retained
on the 16 sieve. However, all samples failed to meet API-recommended size distribution
specifications because they had more than 1.0 percent retained on the 100 and finer sieves. None
of the samples had more than 90 percent retained on the 20/40 or 40/70 sieves.
All Arikaree Group samples contain a significant amount of minerals other than quartz
and/or rock fragments.
Ogallala Group
Of the eight samples collected from the Ogallala Group, two had less than 0.1 percent
retained on the 16 sieve. However, all samples failed to meet API-recommended size distribution
specifications because they had more than 1.0 percent retained on the 100 and finer sieves. None
of the samples had more than 90 percent retained on the 20/40 or 40/70 sieves.
Two samples are unconsolidated and the grains have relatively high sphericity and
roundness, but all of the Ogallala Group samples contain a significant amount of clay, minerals
other than quartz, and/or rock fragments.
Outwash, valley train
A single sample was collected from a glacial valley train outwash. This sample failed to meet
API-recommended size distribution specifications because it had more than 0.1 percent retained
on the 16 sieve and more than 1.0 percent retained on the 100 and finer sieves. This sample did
not have more than 90 percent retained on the 20/40 or 40/70 sieves.
The glacial outwash sample is unconsolidated, has rounded and spherical to angular and
elongated grains, and contains a significant amount of minerals other than quartz.
Terrace deposits
All six samples collected from terrace deposits failed to meet API-recommended size
distribution specifications. All of the samples had more than 0.1 percent retained on the 16 sieve
and more than 1.0 percent retained on the 100 and finer sieves. None of the samples had more
than 90 percent retained on the 20/40 or 40/70 sieves.
20
All of the terrace-deposit samples are unconsolidated. However, all of the samples contain a
moderate to significant amount of minerals other than quartz, and/or rock fragments. Grains
range from being fairly rounded and spherical to angular and elongated.
Sand Hills Formation
All three samples collected from the Sand Hills Formation had less than 0.1 percent retained
on the 16 sieve. However, all samples failed to meet API-recommended size distribution
specifications because they had more than 1.0 percent retained on the 100 and finer sieves. None
of the samples had more than 90 percent retained on the 20/40 or 40/70 sieves.
All Sand Hills Formation samples contain a significant amount of minerals other than quartz,
although most grains are well rounded and spherical.
Alluvium
All three of the samples collected from alluvium failed to meet API-recommended size
distribution specifications. All of the samples had more than 0.1 percent retained on the 16 sieve
and more than 1.0 percent retained on the 100 and finer sieves. None of the samples had more
than 90 percent retained on the 20/40 or 40/70 sieves.
All alluvial deposit samples contain a moderate to significant amount of minerals other than
quartz, rock fragments and/or aggregates. Grains range from being fairly rounded and spherical,
to angular and elongated.
Unknown
Six samples received by fine-aggregate operators were classified as originating from an
unknown geologic unit because insufficient information was provided by the operator. All of
these samples failed to meet API-recommended size distribution specifications. All of the
samples had more than 0.1 percent retained on the 16 sieve and more than 1.0 percent retained
on the 100 and finer sieves. None of the samples had more than 90 percent retained on the 20/40
or 40/70 sieves.
All of the samples classified as originating from an unknown geologic unit contain a
moderate to significant amount of minerals other than quartz or rock fragments. Grains range
from being fairly rounded and spherical, to angular and elongated.
21
CONCLUSIONS
Recommendations by API regarding sampling and testing are for samples that are being
supplied by the sand supplier or service company to the user, meaning that the sand has
potentially undergone several processing steps. Data from this study should be considered as
being acquired from “raw” materials that have undergone only one processing step (crushing).
As noted in a publication by the Wisconsin Department of Natural Resources (2012), larger
mines may have crushing plants with a primary and secondary crusher. Once the rock is broken
down by the crushers, the resulting material is conveyed to a screen plant where it is sorted by
size. Particles that are of the desired size are moved to stockpiles and larger particles that have
not been fully disaggregated are recycled within the crushers until they have been disaggregated
to the desired size. Once disaggregated, the sand goes through a processing plant where it is
washed, dried, and sorted (fig. 2). Washing removes unwanted minerals, silt, clays, or other
inorganic fines. After washing, the sand may be dried and further sorted by screening.
A total of 243 sand samples were analyzed for their suitability as natural proppant for
hydraulic fracturing. None of the samples collected for this study met API recommended
specifications that at least 90 percent of tested sand sample fall between the 20/40 or 40/70
designated sieve sizes. In fact, none of the samples had 90 percent of the tested sample fall
between the 20/70 sieve sizes. Several samples met the API recommendation that no more than
0.1 percent should be larger than the first sieve size but all the samples failed to meet the
recommendation that no more than 1.0 percent of the sample be smaller than the last sieve size.
The crushing techniques used in this study could not fully disaggregate samples which were
cemented, leaving many aggregates in the processed sample. Some beds within a geologic unit
may be more friable while others are harder and more cemented. If both the friable and harder
beds were included in a single field sample, laboratory sample processing was affected because
larger, harder fragments were difficult to break down and “shielded” smaller aggregates from
being broken down further during rolling pin processing. Additional crushing and washing of
samples obtained from this study may liberate more grains from aggregates and rid the sample of
unwanted minerals, silt, clays, or other inorganic fines. Further disaggregation of these samples
would change the weight distribution on the sieves and therefore would affect the sieve weight
data.
When the photomicrographs shown in figure 1 are compared to those acquired in this study,
it is evident that none of the samples from this study approach the quality of sand that is
currently being mined in Wisconsin. Most samples acquired for this study were too fine-grained,
were too hard, contained a significant amount of minerals other than quartz, and would require
significant washing and/or mechanical and chemical processing in order to approach API
specifications.
A few of the samples from this study likely contain some percentage of grains that would
meet some of the API-recommended specifications. The challenge noted by Anderson (2011) for
North Dakota sand resources is extracting a marketable volume of proppant sand from a deposit
containing a wide range of grain sizes. Significant volumes of coarser or finer material would
also require markets in order to fully utilize the deposit. This “multiple markets approach” is
22
detailed in Anderson (2011) and holds true for sand sources in South Dakota; none are suitable to
be mined solely as hydraulic fracturing sand but if there is demand for other uses, then some of
South Dakota’s sand may be economical to mine.
A literature review revealed that no bauxite deposits have been mapped or described, nor is
there definitive data to indicate the presence of significant kaolinite-rich sediments in South
Dakota. Thus, it is not likely that South Dakota has the necessary raw materials needed for the
manufacturing of ceramic proppants.
ACKNOWLEDGEMENTS
The authors thank Dr. Mark Sweeny at the University of South Dakota for use of a Leica
EZ4HD stereo microscope. Also, we thank the fine-aggregate mine operators who supplied
samples for this study.
REFERENCES
Agnew, A.F., and Tychsen, P.C., 1965, A guide to the stratigraphy of South Dakota: South
Dakota Geological Survey Bulletin 14, 195 p.
American National Standards Institute/American Petroleum Institute, 2008, Measurement of
properties of proppants used in hydraulic fracturing and gravel-packing operations:
ANSI/API Recommended Practice 19C, 30 p.
American Petroleum Institute, 1995, Recommended practices for testing sand used in hydraulic
fracturing operations: API Recommended Practice 56, 12 p.
Anderson, F.J., 2011, Investigation of Sand Resources in North Dakota: Sedimentological
characterization of surficial sand deposits for potential use as Proppant: North Dakota
Geological Survey Report of Investigation 110, 77 p.
Baker, C.L., 1952, Geology of Harding County: South Dakota Geological Survey Report of
Investigations 68, 28 p., 2 maps.
Bolin, E.J., 1956a, Areal geology of the Sorum quadrangle: South Dakota Geological Survey 15
minute series Geologic Quadrangle Map, scale 1:62,500.
_____1956b, Areal geology of the Strool quadrangle: South Dakota Geological Survey 15
minute series Geologic Quadrangle Map, scale 1:62,500.
Chadima, S.A., 2012, Report on remnant materials at a former sand and gravel mining
operation near Veblen, South Dakota: South Dakota Geological Survey Oil and Gas
Investigation 4, 43 p.
Ching, P.D., 1973, An investigation of the Cambrian Deadwood Sandstone in the central and
southern Black Hills, South Dakota, as potential industrial silica sands: Rapid City, S. Dak.,
South Dakota School of Mines and Technology, M.S. thesis, 181 p.
Clechenko, E.R., 2004, Discerning Paleocene/Eocene paleoenvironment in the Williston Basin
using clay mineral assemblages: Geological Society of America, Abstracts with Programs,
November, 2004, v. 36, I. 5, p. 293.
Collins, S.G., 1959, Geology of the Martin quadrangle, South Dakota: South Dakota Geological
Survey 15 minute series Geologic Quadrangle Map, 1:62,500 scale.
23
_____1960, Geology of the Patricia quadrangle, South Dakota: South Dakota Geological Survey
15 minute series Geological Quadrangle Map, 1:62,500 scale.
Curtiss, R.E., 1955a, Areal Geology of the Cash Quadrangle: South Dakota Geological Survey
15 minute series Geologic Quadrangle Map, scale 1:62,500.
_____1955b, Areal Geology of the Date Quadrangle: South Dakota Geological Survey 15
minute series Geologic Quadrangle Map, scale 1:62,500.
Denson, N.M.; Bachman, G.O.; and Zeller, H.D., 1959; Uranium-bearing lignite in northwestern
South Dakota and adjacent states: United States Geological Survey Bulletin 1055, Chapter
B, p. 11-57.
Filipovic, D., 2011, Hydrogeologic assessment of the High Plains aquifer in Bennett County,
South Dakota: South Dakota Geological Survey Open File Report 92-UR, 26 p.
Folk, R.L., 1980, Petrology of sedimentary rocks: Austin, Tex., Hemphill Publishing Co., 194 p.
Gott, G.B., Wolcott, D.E., and Bowles, C.G., 1974, Stratigraphy of the Inyan Kara Group and
localization of uranium deposits, southern Black Hills, South Dakota and Wyoming: United
States Geological Survey Professional Paper 763, 57 p.
Gries, J.P., 1952, Mesozoic stratigraphy of the Dakota Basin: Billings Geological Society
Guidebook, 3rd Annual Field Conference, p. 73-78.
Haggar, T.N., McCormick, K.A., Chadima, S.A., and Schulz, L.D., 2002, Grain-size analysis of
post-Cretaceous sand and gravel units in southeastern South Dakota: South Dakota
Geological Survey Report of Investigation 114, 56 p.
Harksen, J.C., 1965, Geology of the Sharps Corner quadrangle, South Dakota: South Dakota
Geological Survey 15 minute series Geological Quadrangle Map, 1:62,500 scale.
Harksen, J.C., and Macdonald, J.R., 1969, Guidebook to the major Cenozoic deposits of
southwestern South Dakota: South Dakota Geological Survey Guidebook 2, 103 p.
Hickey, L.J., 1977, Stratigraphy and paleobotany of the Golden Valley Formation (Early
Tertiary) of western North Dakota: Geological Society of America Memoir 150, 183 p.
Hoganson, J.W., 2007, Dinosaurs, sharks, and wooly mammoths: Glimpses of life in North
Dakota’s prehistoric past: North Dakota Geological Survey Educational Series 31, 60 p.
Huq, S.Y., 1983, Potential sand-frac deposits in the basal Deadwood Formation, eastern Black
Hills, South Dakota: Rapid City, S. Dak., South Dakota School of Mines and Technology,
M.S. thesis, 117 p.
Imlay, R.W., 1947, Marine Jurassic of Black Hills area, South Dakota and Wyoming: American
Association of Petroleum Geologists Bulletin, v. 31, p. 227-273.
Jain, R.K., and Hall, J.W., 1969, A contribution to the Early Tertiary record of the Salviniaceae:
American Journal of Botany, v. 56, p. 527-539.
Jennings, T.V., 1959, Faunal Zonation of the Minnelusa Formation, Black Hills, South Dakota:
Journal of Paleontology, v. 33, n. 6, p. 986-1000.
Krumbein, W.C. and Sloss, L.L., 1963, Stratigraphy and Sedimentation, 2nd edition: San
Francisco, Calif., W.H. Freeman and Company, 660 p.
Malhotra, C.L., and Tegland, E.R., 1960, A new Tertiary formation in Harding County, South
Dakota: South Dakota Academy of Science Proceedings, 60th series, v.38, n. 2, p. 263-274.
Martin, J.E., Gorden, B.L., Jr., Schumacher, B.A., and Sawyer, J.F., 1996, Geology and
paleontology of Late Cretaceous marine deposits of the southern Black Hills region: Road
Log, Field Trip 8: Paterson, C.J., and Kirchner, J.G., editors, Guidebook to the Geology of
the Black Hills, South Dakota, Rapid City. S. Dak., South Dakota School of Mines and
Technology Bulletin 19, p. 51-77.
24
Martin, J.E., Sawyer, J.F., Fahrenbach, M.D., Tomhave, D.W., and Schulz, L.D., 2004, Geologic
map of South Dakota: South Dakota Geological Survey General Map 10, 1:500,000 scale.
Murphy, E.C., 2012a, Alumina content of the Bear Den Member and the Rhame bed in North
Dakota, North Dakota Geological Survey Geologic Investigations 158.
_____2012b, Southwestern North Dakota kaolinite study: North Dakota Geological Survey
Newsletter January, 2012.
_____2013, The alumina content of the Bear Den Member (Golden Valley Formation) and the
Rhame bed (Slope Formation) in Western North Dakota: North Dakota Geological Survey
Report of Investigations 112, 271 p.
Pallanich J., 2013, Making frac proppants go farther: Upstream Technology,
http://www.fairmountminerals.com/Documents/Santrol/Upstream-Technology-Santrol.aspx,
viewed March 12, 2014.
Pipiringos, G.N., Chisholm, W.A., and Kepferle, R.C., 1965, Geology and uranium deposits in
the Cave Hills area, Harding County, South Dakota: United States Geological Survey
Professional Paper 476-A, p. A1-A64.
Rautman, C.A., 1978, Sedimentary of Late Jurassic barrier-island complex-lower Sundance
Formation of Black Hills: The American Association of Petroleum Geologists Bulletin,
v. 62, n. 11, p. 2275-2289.
Redden, J.A. and DeWitt, E., 2008, Maps showing geology, structure, and geophysics of the
central Black Hills, South Dakota, U.S. Geological Survey Scientific Investigations Map
2777, 1:100,000 scale.
Santrol, 2014, Why choose resin-coated proppant over frac sand for moderate well conditions?:
http://www.fairmountminerals.com/Documents/Santrol/Tech-Data-Sheets/13-FMS-0158-
Resin-VS-Raw-Sht-lores.aspx, viewed March 12, 2014.
Schultz, C.B., 1938, The Miocene of western Nebraska: American Journal of Science, v. 35,
n. 210, 441-444.
Sevon, W.D., 1960, Geology of the Spring Creek quadrangle: South Dakota Geological Survey
15 minute series Geologic Quadrangle Map, 1:62,500 scale.
Skinner, M.F., 1951, The Oligocene of western North Dakota: Society of Vertebrate
Paleontologists Guidebook, 5th Field Conference, August 29-September 1, 1959, p. 51-58.
Todd, J.E., 1898, A reconnaissance into northwestern South Dakota: South Dakota Geological
Survey Bulletin 2, 139 p.
Waage, K.M., 1959, Stratigraphy of the Inyan Kara Group in the Black Hills: United States
Geological Survey Bulletin 1081-B, 90 p.
Wehrfritz, B.D., 1978, The Rhame bed (Slope Formation, Paleocene), a silcrete and deep-
weathering profile, in southwestern North Dakota: Grand Forks, N. Dak., University of
North Dakota, M.S. thesis, 158 p.
Winchester, D.E., Hares, C.J., Lloyd, E.R., and Parks, E.M., 1916, The lignite field of
northwestern South Dakota: United States Geological Survey Bulletin 627, 169 p.
Wisconsin Department of Natural Resources, 2012, Silica sand mining in Wisconsin, January
2012, 42 p.
Wisconsin Geological and Natural History Survey, 2014, Frac sand in Wisconsin: Factsheet 5,
2 p.

25
APPENDIX
Sample locations and summary of sieve weight data
26
Sample number
County
Location
Percent retained on
16 sieve
20/40 sieves
40/70 sieves
100 and finer
sieves
Deadwood Formation
HFSC-2012-010 Lawrence NE¼ SW¼ sec. 1, T. 3 N., R. 2 E. 37.06 20.04 20.82 24.90
HFSC-2012-011 Lawrence SE¼ SE¼ sec. 31, T. 4 N., R. 2 E. 10.71 28.05 48.00 20.82
HFSC-2012-012 Lawrence NW¼ SE¼ sec. 8, T. 3 N., R. 3 E. 18.85 17.74 33.27 33.36
HFSC-2012-013 Lawrence NW¼ NE¼ sec. 27, T. 3 N., R. 5 E. 2.54 51.65 37.70 18.19
HFSC-2012-020 Meade SW¼ SW¼ sec. 32, T. 5 N., R. 5 E. 46.47 19.42 20.33 17.17
HFSC-2012-021 Meade NE¼ SE¼ sec. 30, T. 4 N., R. 5 E. 7.90 35.44 55.64 13.21
HFSC-2012-022 Lawrence NE¼ NE¼ sec. 16, T. 3 N., R. 5 E. 21.21 24.21 37.90 23.35
HFSC-2012-025 Meade SW¼ SW¼ sec. 5, T. 3 N., R. 6 E. 37.66 21.34 35.61 12.40
HFSC-2012-029 Lawrence NE¼ SW¼ sec. 23, T. 5 N., R. 3 E. 32.92 15.21 30.76 24.53
HFSC-2012-031 Pennington NW¼ NW¼ sec. 14, T. 1 N., R. 6 E. 21.65 21.35 18.90 41.57
HFSC-2012-031-Duplicate Pennington NW¼ NW¼ sec. 14, T. 1 N., R. 6 E. 29.24 20.86 17.24 35.81
HFSC-2012-032 Pennington NW¼ NW¼ sec. 10, T. 1 N., R. 6 E. 25.98 23.91 21.49 32.30
HFSC-2012-033 Pennington NW¼ NE¼ sec. 5, T. 1 N., R. 6 E. 6.80 58.77 42.08 5.95
HFSC-2012-039 Lawrence NW¼ SW¼ sec. 26, T. 3 N., R. 3 E. 12.46 39.04 53.41 9.34
HFSC-2012-044 Lawrence SW¼ NE¼ sec. 21, T. 3 N., R. 5 E. 5.74 16.38 45.74 37.87
HFSC-2012-045 Lawrence SE¼ NE¼ sec. 1, T. 3 N., R. 4 E. 2.21 8.30 51.28 40.91
HFSC-2012-046 Lawrence SE¼ NW¼ sec. 17, T. 2 N., R. 6 E. 2.63 22.72 72.03 12.31
HFSC-2012-053 Pennington NW¼ NE¼ sec. 13, T. 1 S., R. 6 E. 56.53 10.24 7.42 27.15
HFSC-2012-054 Pennington NW¼ NE¼ sec. 25, T. 1 S., R. 6 E. 25.27 39.19 36.83 10.17
HFSC-2012-055 Pennington SW¼ NW¼ sec. 13, T. 2 S., R. 6 E. 47.65 16.23 15.66 22.86
HFSC-2012-056 Pennington SE¼ NW¼ sec. 2, T. 2 S., R. 7 E. 22.31 14.38 23.68 42.56
HFSC-2012-067 Pennington SE¼ SW¼ sec. 25, T. 1 S., R. 6 E. 71.77 10.80 11.35 8.45
HFSC-2012-071 Custer SE¼ NE¼ sec. 25, T. 2 S., R. 6 E. 39.13 20.65 32.50 13.26
HFSC-2013-090 Pennington SW¼ SE¼ sec. 2, T. 2 N., R. 6 E. 12.68 27.29 55.55 14.52
HFSC-2013-096 Custer SE¼ NW¼ sec. 27, T. 3 S., R. 3 E. 51.17 21.95 14.93 15.33
HFSC-2013-097 Custer NW¼ SE¼ sec. 34, T. 3 S., R. 3 E. 1.29 23.12 59.62 23.24
HFSC-2013-098 Custer NW¼ NW¼ sec. 15, T. 3 S., R. 3 E. 5.68 31.10 47.74 24.26
HFSC-2013-099 Custer NE¼ NW¼ sec. 3, T. 3 S., R. 3 E. 2.39 30.44 43.42 31.77
HFSC-2013-101 Pennington SE¼ NE¼ sec. 23, T. 1 S., R. 2 E. 13.81 40.27 38.41 14.87
HFSC-2013-102 Pennington NE¼ NE¼ sec. 11, T. 1 S., R. 2 E. 8.16 28.60 49.72 21.12
HFSC-2013-103 Pennington SW¼ NW¼ sec. 35, T. 1 N., R. 2 E. 62.28 14.16 8.68 16.60
HFSC-2013-104 Pennington NE¼ SE¼ sec. 36, T. 2 N., R. 1 E. 36.13 26.75 13.50 26.75
HFSC-2013-105 Pennington NW¼ NW¼ sec. 5, T. 1 N., R. 2 E. 49.37 17.64 13.68 21.76
HFSC-2013-107 Pennington SW¼ SE¼ sec. 15, T. 1 N., R. 2 E. 63.42 15.06 7.88 15.50
HFSC-2013-108 Pennington SE¼ NE¼ sec. 27, T. 1 S., R. 3 E. 66.73 16.78 11.15 7.80
HFSC-2013-109 Pennington NE¼ SW¼ sec. 12, T. 1 N., R. 2 E. 49.80 14.50 10.13 27.56
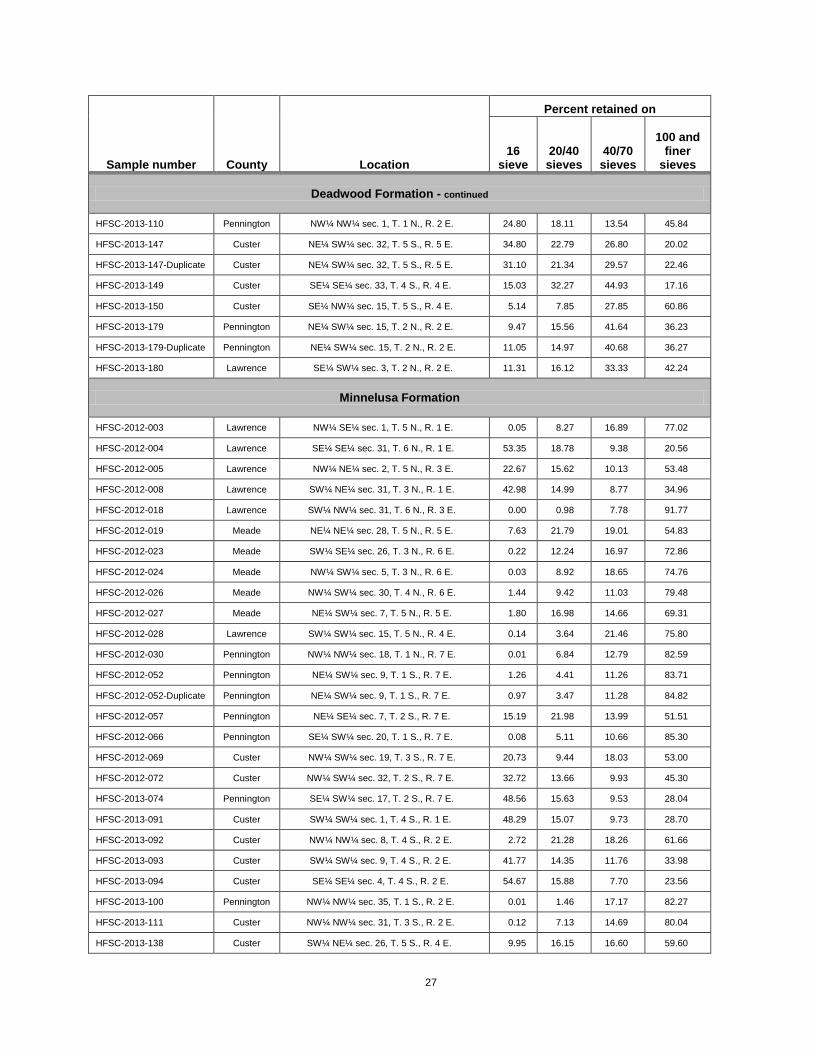
27
Sample number
County
Location
Percent retained on
16 sieve
20/40 sieves
40/70 sieves
100 and finer
sieves
Deadwood Formation - continued
HFSC-2013-110 Pennington NW¼ NW¼ sec. 1, T. 1 N., R. 2 E. 24.80 18.11 13.54 45.84
HFSC-2013-147 Custer NE¼ SW¼ sec. 32, T. 5 S., R. 5 E. 34.80 22.79 26.80 20.02
HFSC-2013-147-Duplicate Custer NE¼ SW¼ sec. 32, T. 5 S., R. 5 E. 31.10 21.34 29.57 22.46
HFSC-2013-149 Custer SE¼ SE¼ sec. 33, T. 4 S., R. 4 E. 15.03 32.27 44.93 17.16
HFSC-2013-150 Custer SE¼ NW¼ sec. 15, T. 5 S., R. 4 E. 5.14 7.85 27.85 60.86
HFSC-2013-179 Pennington NE¼ SW¼ sec. 15, T. 2 N., R. 2 E. 9.47 15.56 41.64 36.23
HFSC-2013-179-Duplicate Pennington NE¼ SW¼ sec. 15, T. 2 N., R. 2 E. 11.05 14.97 40.68 36.27
HFSC-2013-180 Lawrence SE¼ SW¼ sec. 3, T. 2 N., R. 2 E. 11.31 16.12 33.33 42.24
Minnelusa Formation
HFSC-2012-003 Lawrence NW¼ SE¼ sec. 1, T. 5 N., R. 1 E. 0.05 8.27 16.89 77.02
HFSC-2012-004 Lawrence SE¼ SE¼ sec. 31, T. 6 N., R. 1 E. 53.35 18.78 9.38 20.56
HFSC-2012-005 Lawrence NW¼ NE¼ sec. 2, T. 5 N., R. 3 E. 22.67 15.62 10.13 53.48
HFSC-2012-008 Lawrence SW¼ NE¼ sec. 31, T. 3 N., R. 1 E. 42.98 14.99 8.77 34.96
HFSC-2012-018 Lawrence SW¼ NW¼ sec. 31, T. 6 N., R. 3 E. 0.00 0.98 7.78 91.77
HFSC-2012-019 Meade NE¼ NE¼ sec. 28, T. 5 N., R. 5 E. 7.63 21.79 19.01 54.83
HFSC-2012-023 Meade SW¼ SE¼ sec. 26, T. 3 N., R. 6 E. 0.22 12.24 16.97 72.86
HFSC-2012-024 Meade NW¼ SW¼ sec. 5, T. 3 N., R. 6 E. 0.03 8.92 18.65 74.76
HFSC-2012-026 Meade NW¼ SW¼ sec. 30, T. 4 N., R. 6 E. 1.44 9.42 11.03 79.48
HFSC-2012-027 Meade NE¼ SW¼ sec. 7, T. 5 N., R. 5 E. 1.80 16.98 14.66 69.31
HFSC-2012-028 Lawrence SW¼ SW¼ sec. 15, T. 5 N., R. 4 E. 0.14 3.64 21.46 75.80
HFSC-2012-030 Pennington NW¼ NW¼ sec. 18, T. 1 N., R. 7 E. 0.01 6.84 12.79 82.59
HFSC-2012-052 Pennington NE¼ SW¼ sec. 9, T. 1 S., R. 7 E. 1.26 4.41 11.26 83.71
HFSC-2012-052-Duplicate Pennington NE¼ SW¼ sec. 9, T. 1 S., R. 7 E. 0.97 3.47 11.28 84.82
HFSC-2012-057 Pennington NE¼ SE¼ sec. 7, T. 2 S., R. 7 E. 15.19 21.98 13.99 51.51
HFSC-2012-066 Pennington SE¼ SW¼ sec. 20, T. 1 S., R. 7 E. 0.08 5.11 10.66 85.30
HFSC-2012-069 Custer NW¼ SW¼ sec. 19, T. 3 S., R. 7 E. 20.73 9.44 18.03 53.00
HFSC-2012-072 Custer NW¼ SW¼ sec. 32, T. 2 S., R. 7 E. 32.72 13.66 9.93 45.30
HFSC-2013-074 Pennington SE¼ SW¼ sec. 17, T. 2 S., R. 7 E. 48.56 15.63 9.53 28.04
HFSC-2013-091 Custer SW¼ SW¼ sec. 1, T. 4 S., R. 1 E. 48.29 15.07 9.73 28.70
HFSC-2013-092 Custer NW¼ NW¼ sec. 8, T. 4 S., R. 2 E. 2.72 21.28 18.26 61.66
HFSC-2013-093 Custer SW¼ SW¼ sec. 9, T. 4 S., R. 2 E. 41.77 14.35 11.76 33.98
HFSC-2013-094 Custer SE¼ SE¼ sec. 4, T. 4 S., R. 2 E. 54.67 15.88 7.70 23.56
HFSC-2013-100 Pennington NW¼ NW¼ sec. 35, T. 1 S., R. 2 E. 0.01 1.46 17.17 82.27
HFSC-2013-111 Custer NW¼ NW¼ sec. 31, T. 3 S., R. 2 E. 0.12 7.13 14.69 80.04
HFSC-2013-138 Custer SW¼ NE¼ sec. 26, T. 5 S., R. 4 E. 9.95 16.15 16.60 59.60
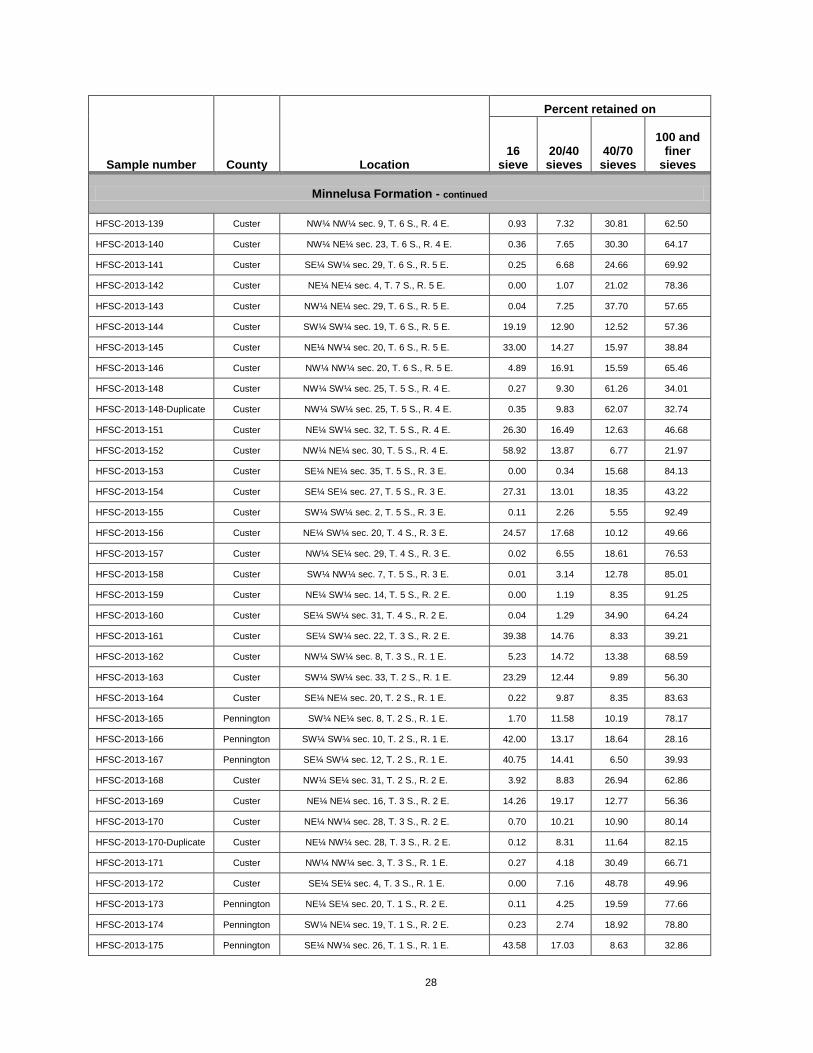
28
Sample number
County
Location
Percent retained on
16 sieve
20/40 sieves
40/70 sieves
100 and finer
sieves
Minnelusa Formation - continued
HFSC-2013-139 Custer NW¼ NW¼ sec. 9, T. 6 S., R. 4 E. 0.93 7.32 30.81 62.50
HFSC-2013-140 Custer NW¼ NE¼ sec. 23, T. 6 S., R. 4 E. 0.36 7.65 30.30 64.17
HFSC-2013-141 Custer SE¼ SW¼ sec. 29, T. 6 S., R. 5 E. 0.25 6.68 24.66 69.92
HFSC-2013-142 Custer NE¼ NE¼ sec. 4, T. 7 S., R. 5 E. 0.00 1.07 21.02 78.36
HFSC-2013-143 Custer NW¼ NE¼ sec. 29, T. 6 S., R. 5 E. 0.04 7.25 37.70 57.65
HFSC-2013-144 Custer SW¼ SW¼ sec. 19, T. 6 S., R. 5 E. 19.19 12.90 12.52 57.36
HFSC-2013-145 Custer NE¼ NW¼ sec. 20, T. 6 S., R. 5 E. 33.00 14.27 15.97 38.84
HFSC-2013-146 Custer NW¼ NW¼ sec. 20, T. 6 S., R. 5 E. 4.89 16.91 15.59 65.46
HFSC-2013-148 Custer NW¼ SW¼ sec. 25, T. 5 S., R. 4 E. 0.27 9.30 61.26 34.01
HFSC-2013-148-Duplicate Custer NW¼ SW¼ sec. 25, T. 5 S., R. 4 E. 0.35 9.83 62.07 32.74
HFSC-2013-151 Custer NE¼ SW¼ sec. 32, T. 5 S., R. 4 E. 26.30 16.49 12.63 46.68
HFSC-2013-152 Custer NW¼ NE¼ sec. 30, T. 5 S., R. 4 E. 58.92 13.87 6.77 21.97
HFSC-2013-153 Custer SE¼ NE¼ sec. 35, T. 5 S., R. 3 E. 0.00 0.34 15.68 84.13
HFSC-2013-154 Custer SE¼ SE¼ sec. 27, T. 5 S., R. 3 E. 27.31 13.01 18.35 43.22
HFSC-2013-155 Custer SW¼ SW¼ sec. 2, T. 5 S., R. 3 E. 0.11 2.26 5.55 92.49
HFSC-2013-156 Custer NE¼ SW¼ sec. 20, T. 4 S., R. 3 E. 24.57 17.68 10.12 49.66
HFSC-2013-157 Custer NW¼ SE¼ sec. 29, T. 4 S., R. 3 E. 0.02 6.55 18.61 76.53
HFSC-2013-158 Custer SW¼ NW¼ sec. 7, T. 5 S., R. 3 E. 0.01 3.14 12.78 85.01
HFSC-2013-159 Custer NE¼ SW¼ sec. 14, T. 5 S., R. 2 E. 0.00 1.19 8.35 91.25
HFSC-2013-160 Custer SE¼ SW¼ sec. 31, T. 4 S., R. 2 E. 0.04 1.29 34.90 64.24
HFSC-2013-161 Custer SE¼ SW¼ sec. 22, T. 3 S., R. 2 E. 39.38 14.76 8.33 39.21
HFSC-2013-162 Custer NW¼ SW¼ sec. 8, T. 3 S., R. 1 E. 5.23 14.72 13.38 68.59
HFSC-2013-163 Custer SW¼ SW¼ sec. 33, T. 2 S., R. 1 E. 23.29 12.44 9.89 56.30
HFSC-2013-164 Custer SE¼ NE¼ sec. 20, T. 2 S., R. 1 E. 0.22 9.87 8.35 83.63
HFSC-2013-165 Pennington SW¼ NE¼ sec. 8, T. 2 S., R. 1 E. 1.70 11.58 10.19 78.17
HFSC-2013-166 Pennington SW¼ SW¼ sec. 10, T. 2 S., R. 1 E. 42.00 13.17 18.64 28.16
HFSC-2013-167 Pennington SE¼ SW¼ sec. 12, T. 2 S., R. 1 E. 40.75 14.41 6.50 39.93
HFSC-2013-168 Custer NW¼ SE¼ sec. 31, T. 2 S., R. 2 E. 3.92 8.83 26.94 62.86
HFSC-2013-169 Custer NE¼ NE¼ sec. 16, T. 3 S., R. 2 E. 14.26 19.17 12.77 56.36
HFSC-2013-170 Custer NE¼ NW¼ sec. 28, T. 3 S., R. 2 E. 0.70 10.21 10.90 80.14
HFSC-2013-170-Duplicate Custer NE¼ NW¼ sec. 28, T. 3 S., R. 2 E. 0.12 8.31 11.64 82.15
HFSC-2013-171 Custer NW¼ NW¼ sec. 3, T. 3 S., R. 1 E. 0.27 4.18 30.49 66.71
HFSC-2013-172 Custer SE¼ SE¼ sec. 4, T. 3 S., R. 1 E. 0.00 7.16 48.78 49.96
HFSC-2013-173 Pennington NE¼ SE¼ sec. 20, T. 1 S., R. 2 E. 0.11 4.25 19.59 77.66
HFSC-2013-174 Pennington SW¼ NE¼ sec. 19, T. 1 S., R. 2 E. 0.23 2.74 18.92 78.80
HFSC-2013-175 Pennington SE¼ NW¼ sec. 26, T. 1 S., R. 1 E. 43.58 17.03 8.63 32.86
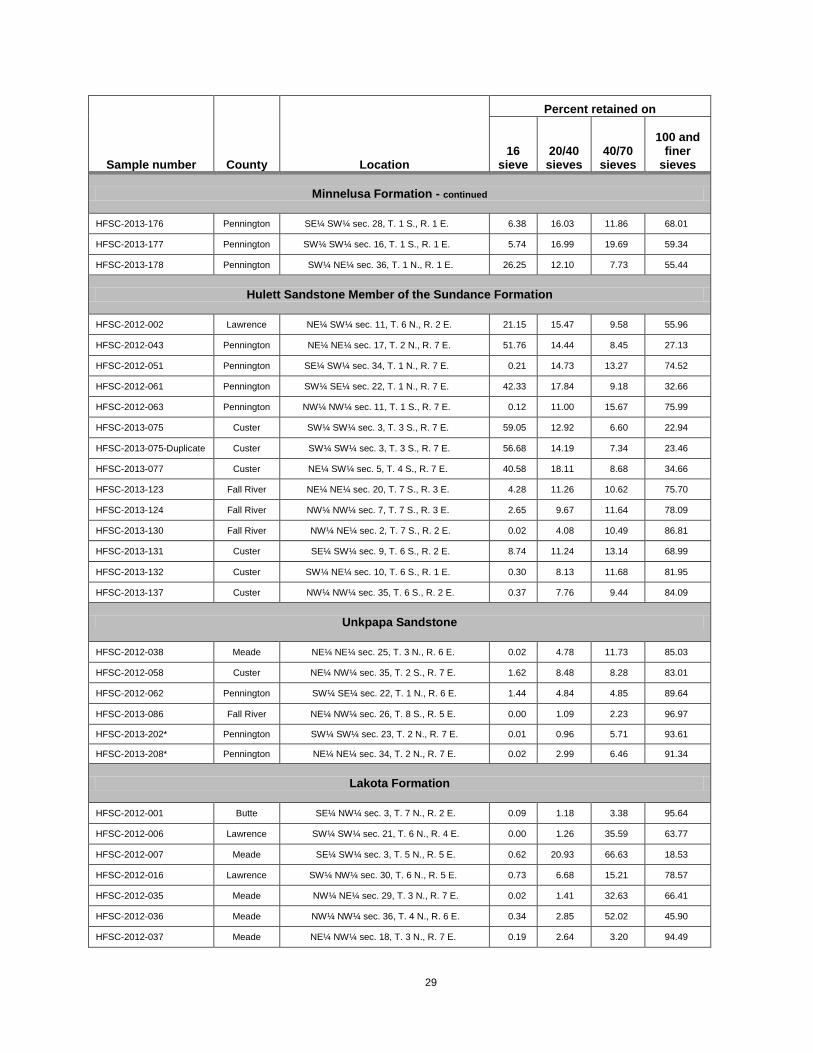
29
Sample number
County
Location
Percent retained on
16 sieve
20/40 sieves
40/70 sieves
100 and finer
sieves
Minnelusa Formation - continued
HFSC-2013-176 Pennington SE¼ SW¼ sec. 28, T. 1 S., R. 1 E. 6.38 16.03 11.86 68.01
HFSC-2013-177 Pennington SW¼ SW¼ sec. 16, T. 1 S., R. 1 E. 5.74 16.99 19.69 59.34
HFSC-2013-178 Pennington SW¼ NE¼ sec. 36, T. 1 N., R. 1 E. 26.25 12.10 7.73 55.44
Hulett Sandstone Member of the Sundance Formation
HFSC-2012-002 Lawrence NE¼ SW¼ sec. 11, T. 6 N., R. 2 E. 21.15 15.47 9.58 55.96
HFSC-2012-043 Pennington NE¼ NE¼ sec. 17, T. 2 N., R. 7 E. 51.76 14.44 8.45 27.13
HFSC-2012-051 Pennington SE¼ SW¼ sec. 34, T. 1 N., R. 7 E. 0.21 14.73 13.27 74.52
HFSC-2012-061 Pennington SW¼ SE¼ sec. 22, T. 1 N., R. 7 E. 42.33 17.84 9.18 32.66
HFSC-2012-063 Pennington NW¼ NW¼ sec. 11, T. 1 S., R. 7 E. 0.12 11.00 15.67 75.99
HFSC-2013-075 Custer SW¼ SW¼ sec. 3, T. 3 S., R. 7 E. 59.05 12.92 6.60 22.94
HFSC-2013-075-Duplicate Custer SW¼ SW¼ sec. 3, T. 3 S., R. 7 E. 56.68 14.19 7.34 23.46
HFSC-2013-077 Custer NE¼ SW¼ sec. 5, T. 4 S., R. 7 E. 40.58 18.11 8.68 34.66
HFSC-2013-123 Fall River NE¼ NE¼ sec. 20, T. 7 S., R. 3 E. 4.28 11.26 10.62 75.70
HFSC-2013-124 Fall River NW¼ NW¼ sec. 7, T. 7 S., R. 3 E. 2.65 9.67 11.64 78.09
HFSC-2013-130 Fall River NW¼ NE¼ sec. 2, T. 7 S., R. 2 E. 0.02 4.08 10.49 86.81
HFSC-2013-131 Custer SE¼ SW¼ sec. 9, T. 6 S., R. 2 E. 8.74 11.24 13.14 68.99
HFSC-2013-132 Custer SW¼ NE¼ sec. 10, T. 6 S., R. 1 E. 0.30 8.13 11.68 81.95
HFSC-2013-137 Custer NW¼ NW¼ sec. 35, T. 6 S., R. 2 E. 0.37 7.76 9.44 84.09
Unkpapa Sandstone
HFSC-2012-038 Meade NE¼ NE¼ sec. 25, T. 3 N., R. 6 E. 0.02 4.78 11.73 85.03
HFSC-2012-058 Custer NE¼ NW¼ sec. 35, T. 2 S., R. 7 E. 1.62 8.48 8.28 83.01
HFSC-2012-062 Pennington SW¼ SE¼ sec. 22, T. 1 N., R. 6 E. 1.44 4.84 4.85 89.64
HFSC-2013-086 Fall River NE¼ NW¼ sec. 26, T. 8 S., R. 5 E. 0.00 1.09 2.23 96.97
HFSC-2013-202* Pennington SW¼ SW¼ sec. 23, T. 2 N., R. 7 E. 0.01 0.96 5.71 93.61
HFSC-2013-208* Pennington NE¼ NE¼ sec. 34, T. 2 N., R. 7 E. 0.02 2.99 6.46 91.34
Lakota Formation
HFSC-2012-001 Butte SE¼ NW¼ sec. 3, T. 7 N., R. 2 E. 0.09 1.18 3.38 95.64
HFSC-2012-006 Lawrence SW¼ SW¼ sec. 21, T. 6 N., R. 4 E. 0.00 1.26 35.59 63.77
HFSC-2012-007 Meade SE¼ SW¼ sec. 3, T. 5 N., R. 5 E. 0.62 20.93 66.63 18.53
HFSC-2012-016 Lawrence SW¼ NW¼ sec. 30, T. 6 N., R. 5 E. 0.73 6.68 15.21 78.57
HFSC-2012-035 Meade NW¼ NE¼ sec. 29, T. 3 N., R. 7 E. 0.02 1.41 32.63 66.41
HFSC-2012-036 Meade NW¼ NW¼ sec. 36, T. 4 N., R. 6 E. 0.34 2.85 52.02 45.90
HFSC-2012-037 Meade NE¼ NW¼ sec. 18, T. 3 N., R. 7 E. 0.19 2.64 3.20 94.49
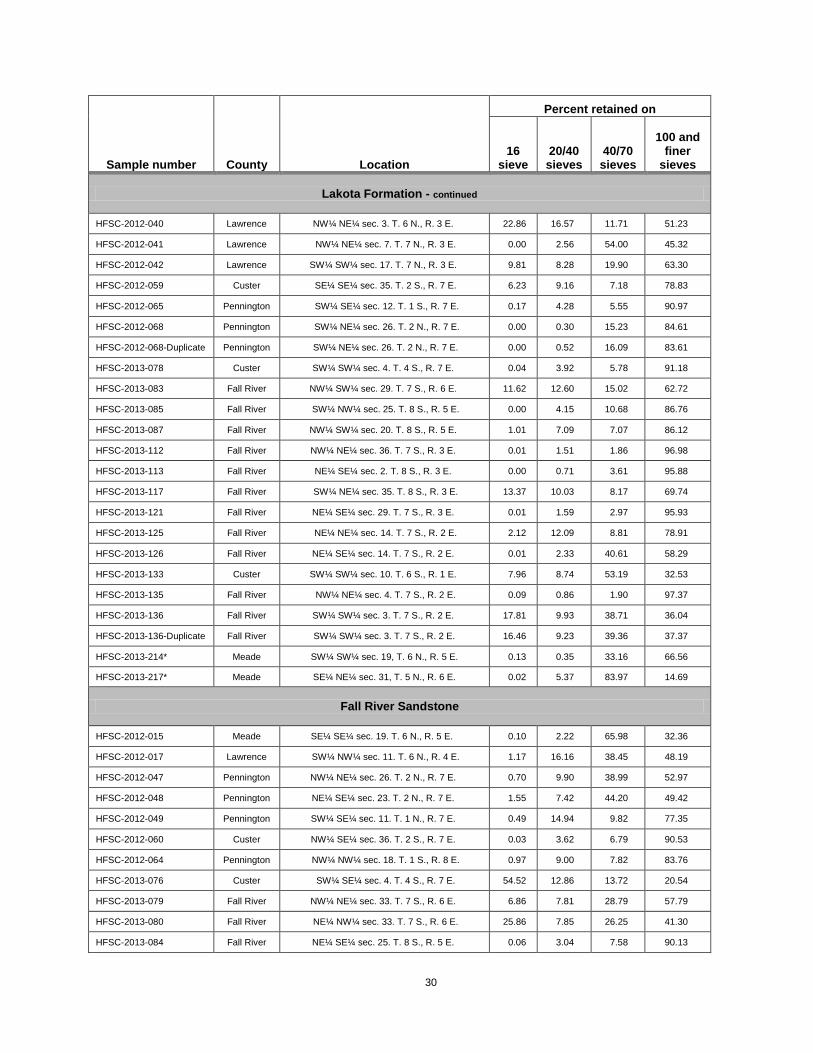
30
Sample number
County
Location
Percent retained on
16 sieve
20/40 sieves
40/70 sieves
100 and finer
sieves
Lakota Formation - continued
HFSC-2012-040 Lawrence NW¼ NE¼ sec. 3. T. 6 N., R. 3 E. 22.86 16.57 11.71 51.23
HFSC-2012-041 Lawrence NW¼ NE¼ sec. 7. T. 7 N., R. 3 E. 0.00 2.56 54.00 45.32
HFSC-2012-042 Lawrence SW¼ SW¼ sec. 17. T. 7 N., R. 3 E. 9.81 8.28 19.90 63.30
HFSC-2012-059 Custer SE¼ SE¼ sec. 35. T. 2 S., R. 7 E. 6.23 9.16 7.18 78.83
HFSC-2012-065 Pennington SW¼ SE¼ sec. 12. T. 1 S., R. 7 E. 0.17 4.28 5.55 90.97
HFSC-2012-068 Pennington SW¼ NE¼ sec. 26. T. 2 N., R. 7 E. 0.00 0.30 15.23 84.61
HFSC-2012-068-Duplicate Pennington SW¼ NE¼ sec. 26. T. 2 N., R. 7 E. 0.00 0.52 16.09 83.61
HFSC-2013-078 Custer SW¼ SW¼ sec. 4. T. 4 S., R. 7 E. 0.04 3.92 5.78 91.18
HFSC-2013-083 Fall River NW¼ SW¼ sec. 29. T. 7 S., R. 6 E. 11.62 12.60 15.02 62.72
HFSC-2013-085 Fall River SW¼ NW¼ sec. 25. T. 8 S., R. 5 E. 0.00 4.15 10.68 86.76
HFSC-2013-087 Fall River NW¼ SW¼ sec. 20. T. 8 S., R. 5 E. 1.01 7.09 7.07 86.12
HFSC-2013-112 Fall River NW¼ NE¼ sec. 36. T. 7 S., R. 3 E. 0.01 1.51 1.86 96.98
HFSC-2013-113 Fall River NE¼ SE¼ sec. 2. T. 8 S., R. 3 E. 0.00 0.71 3.61 95.88
HFSC-2013-117 Fall River SW¼ NE¼ sec. 35. T. 8 S., R. 3 E. 13.37 10.03 8.17 69.74
HFSC-2013-121 Fall River NE¼ SE¼ sec. 29. T. 7 S., R. 3 E. 0.01 1.59 2.97 95.93
HFSC-2013-125 Fall River NE¼ NE¼ sec. 14. T. 7 S., R. 2 E. 2.12 12.09 8.81 78.91
HFSC-2013-126 Fall River NE¼ SE¼ sec. 14. T. 7 S., R. 2 E. 0.01 2.33 40.61 58.29
HFSC-2013-133 Custer SW¼ SW¼ sec. 10. T. 6 S., R. 1 E. 7.96 8.74 53.19 32.53
HFSC-2013-135 Fall River NW¼ NE¼ sec. 4. T. 7 S., R. 2 E. 0.09 0.86 1.90 97.37
HFSC-2013-136 Fall River SW¼ SW¼ sec. 3. T. 7 S., R. 2 E. 17.81 9.93 38.71 36.04
HFSC-2013-136-Duplicate Fall River SW¼ SW¼ sec. 3. T. 7 S., R. 2 E. 16.46 9.23 39.36 37.37
HFSC-2013-214* Meade SW¼ SW¼ sec. 19, T. 6 N., R. 5 E. 0.13 0.35 33.16 66.56
HFSC-2013-217* Meade SE¼ NE¼ sec. 31, T. 5 N., R. 6 E. 0.02 5.37 83.97 14.69
Fall River Sandstone
HFSC-2012-015 Meade SE¼ SE¼ sec. 19. T. 6 N., R. 5 E. 0.10 2.22 65.98 32.36
HFSC-2012-017 Lawrence SW¼ NW¼ sec. 11. T. 6 N., R. 4 E. 1.17 16.16 38.45 48.19
HFSC-2012-047 Pennington NW¼ NE¼ sec. 26. T. 2 N., R. 7 E. 0.70 9.90 38.99 52.97
HFSC-2012-048 Pennington NE¼ SE¼ sec. 23. T. 2 N., R. 7 E. 1.55 7.42 44.20 49.42
HFSC-2012-049 Pennington SW¼ SE¼ sec. 11. T. 1 N., R. 7 E. 0.49 14.94 9.82 77.35
HFSC-2012-060 Custer NW¼ SE¼ sec. 36. T. 2 S., R. 7 E. 0.03 3.62 6.79 90.53
HFSC-2012-064 Pennington NW¼ NW¼ sec. 18. T. 1 S., R. 8 E. 0.97 9.00 7.82 83.76
HFSC-2013-076 Custer SW¼ SE¼ sec. 4. T. 4 S., R. 7 E. 54.52 12.86 13.72 20.54
HFSC-2013-079 Fall River NW¼ NE¼ sec. 33. T. 7 S., R. 6 E. 6.86 7.81 28.79 57.79
HFSC-2013-080 Fall River NE¼ NW¼ sec. 33. T. 7 S., R. 6 E. 25.86 7.85 26.25 41.30
HFSC-2013-084 Fall River NE¼ SE¼ sec. 25. T. 8 S., R. 5 E. 0.06 3.04 7.58 90.13
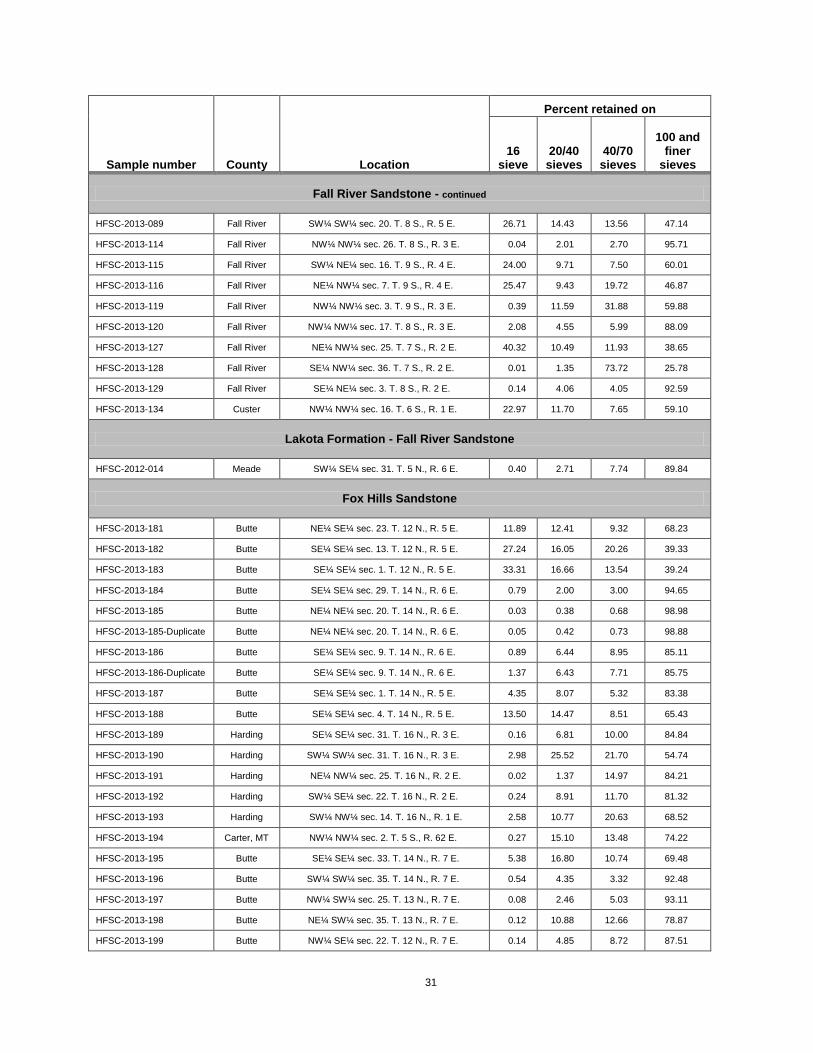
31
Sample number
County
Location
Percent retained on
16 sieve
20/40 sieves
40/70 sieves
100 and finer
sieves
Fall River Sandstone - continued
HFSC-2013-089 Fall River SW¼ SW¼ sec. 20. T. 8 S., R. 5 E. 26.71 14.43 13.56 47.14
HFSC-2013-114 Fall River NW¼ NW¼ sec. 26. T. 8 S., R. 3 E. 0.04 2.01 2.70 95.71
HFSC-2013-115 Fall River SW¼ NE¼ sec. 16. T. 9 S., R. 4 E. 24.00 9.71 7.50 60.01
HFSC-2013-116 Fall River NE¼ NW¼ sec. 7. T. 9 S., R. 4 E. 25.47 9.43 19.72 46.87
HFSC-2013-119 Fall River NW¼ NW¼ sec. 3. T. 9 S., R. 3 E. 0.39 11.59 31.88 59.88
HFSC-2013-120 Fall River NW¼ NW¼ sec. 17. T. 8 S., R. 3 E. 2.08 4.55 5.99 88.09
HFSC-2013-127 Fall River NE¼ NW¼ sec. 25. T. 7 S., R. 2 E. 40.32 10.49 11.93 38.65
HFSC-2013-128 Fall River SE¼ NW¼ sec. 36. T. 7 S., R. 2 E. 0.01 1.35 73.72 25.78
HFSC-2013-129 Fall River SE¼ NE¼ sec. 3. T. 8 S., R. 2 E. 0.14 4.06 4.05 92.59
HFSC-2013-134 Custer NW¼ NW¼ sec. 16. T. 6 S., R. 1 E. 22.97 11.70 7.65 59.10
Lakota Formation - Fall River Sandstone
HFSC-2012-014 Meade SW¼ SE¼ sec. 31. T. 5 N., R. 6 E. 0.40 2.71 7.74 89.84
Fox Hills Sandstone
HFSC-2013-181 Butte NE¼ SE¼ sec. 23. T. 12 N., R. 5 E. 11.89 12.41 9.32 68.23
HFSC-2013-182 Butte SE¼ SE¼ sec. 13. T. 12 N., R. 5 E. 27.24 16.05 20.26 39.33
HFSC-2013-183 Butte SE¼ SE¼ sec. 1. T. 12 N., R. 5 E. 33.31 16.66 13.54 39.24
HFSC-2013-184 Butte SE¼ SE¼ sec. 29. T. 14 N., R. 6 E. 0.79 2.00 3.00 94.65
HFSC-2013-185 Butte NE¼ NE¼ sec. 20. T. 14 N., R. 6 E. 0.03 0.38 0.68 98.98
HFSC-2013-185-Duplicate Butte NE¼ NE¼ sec. 20. T. 14 N., R. 6 E. 0.05 0.42 0.73 98.88
HFSC-2013-186 Butte SE¼ SE¼ sec. 9. T. 14 N., R. 6 E. 0.89 6.44 8.95 85.11
HFSC-2013-186-Duplicate Butte SE¼ SE¼ sec. 9. T. 14 N., R. 6 E. 1.37 6.43 7.71 85.75
HFSC-2013-187 Butte SE¼ SE¼ sec. 1. T. 14 N., R. 5 E. 4.35 8.07 5.32 83.38
HFSC-2013-188 Butte SE¼ SE¼ sec. 4. T. 14 N., R. 5 E. 13.50 14.47 8.51 65.43
HFSC-2013-189 Harding SE¼ SE¼ sec. 31. T. 16 N., R. 3 E. 0.16 6.81 10.00 84.84
HFSC-2013-190 Harding SW¼ SW¼ sec. 31. T. 16 N., R. 3 E. 2.98 25.52 21.70 54.74
HFSC-2013-191 Harding NE¼ NW¼ sec. 25. T. 16 N., R. 2 E. 0.02 1.37 14.97 84.21
HFSC-2013-192 Harding SW¼ SE¼ sec. 22. T. 16 N., R. 2 E. 0.24 8.91 11.70 81.32
HFSC-2013-193 Harding SW¼ NW¼ sec. 14. T. 16 N., R. 1 E. 2.58 10.77 20.63 68.52
HFSC-2013-194 Carter, MT NW¼ NW¼ sec. 2. T. 5 S., R. 62 E. 0.27 15.10 13.48 74.22
HFSC-2013-195 Butte SE¼ SE¼ sec. 33. T. 14 N., R. 7 E. 5.38 16.80 10.74 69.48
HFSC-2013-196 Butte SW¼ SW¼ sec. 35. T. 14 N., R. 7 E. 0.54 4.35 3.32 92.48
HFSC-2013-197 Butte NW¼ SW¼ sec. 25. T. 13 N., R. 7 E. 0.08 2.46 5.03 93.11
HFSC-2013-198 Butte NE¼ SW¼ sec. 35. T. 13 N., R. 7 E. 0.12 10.88 12.66 78.87
HFSC-2013-199 Butte NW¼ SE¼ sec. 22. T. 12 N., R. 7 E. 0.14 4.85 8.72 87.51
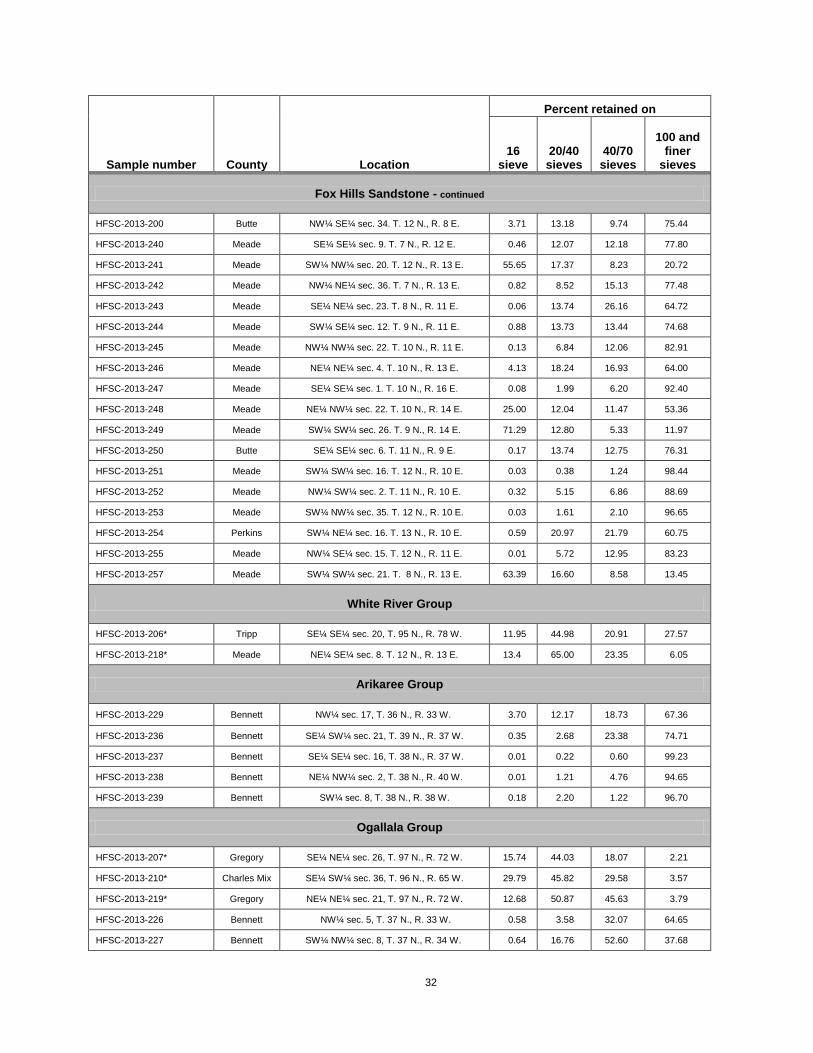
32
Sample number
County
Location
Percent retained on
16 sieve
20/40 sieves
40/70 sieves
100 and finer
sieves
Fox Hills Sandstone - continued
HFSC-2013-200 Butte NW¼ SE¼ sec. 34. T. 12 N., R. 8 E. 3.71 13.18 9.74 75.44
HFSC-2013-240 Meade SE¼ SE¼ sec. 9. T. 7 N., R. 12 E. 0.46 12.07 12.18 77.80
HFSC-2013-241 Meade SW¼ NW¼ sec. 20. T. 12 N., R. 13 E. 55.65 17.37 8.23 20.72
HFSC-2013-242 Meade NW¼ NE¼ sec. 36. T. 7 N., R. 13 E. 0.82 8.52 15.13 77.48
HFSC-2013-243 Meade SE¼ NE¼ sec. 23. T. 8 N., R. 11 E. 0.06 13.74 26.16 64.72
HFSC-2013-244 Meade SW¼ SE¼ sec. 12. T. 9 N., R. 11 E. 0.88 13.73 13.44 74.68
HFSC-2013-245 Meade NW¼ NW¼ sec. 22. T. 10 N., R. 11 E. 0.13 6.84 12.06 82.91
HFSC-2013-246 Meade NE¼ NE¼ sec. 4. T. 10 N., R. 13 E. 4.13 18.24 16.93 64.00
HFSC-2013-247 Meade SE¼ SE¼ sec. 1. T. 10 N., R. 16 E. 0.08 1.99 6.20 92.40
HFSC-2013-248 Meade NE¼ NW¼ sec. 22. T. 10 N., R. 14 E. 25.00 12.04 11.47 53.36
HFSC-2013-249 Meade SW¼ SW¼ sec. 26. T. 9 N., R. 14 E. 71.29 12.80 5.33 11.97
HFSC-2013-250 Butte SE¼ SE¼ sec. 6. T. 11 N., R. 9 E. 0.17 13.74 12.75 76.31
HFSC-2013-251 Meade SW¼ SW¼ sec. 16. T. 12 N., R. 10 E. 0.03 0.38 1.24 98.44
HFSC-2013-252 Meade NW¼ SW¼ sec. 2. T. 11 N., R. 10 E. 0.32 5.15 6.86 88.69
HFSC-2013-253 Meade SW¼ NW¼ sec. 35. T. 12 N., R. 10 E. 0.03 1.61 2.10 96.65
HFSC-2013-254 Perkins SW¼ NE¼ sec. 16. T. 13 N., R. 10 E. 0.59 20.97 21.79 60.75
HFSC-2013-255 Meade NW¼ SE¼ sec. 15. T. 12 N., R. 11 E. 0.01 5.72 12.95 83.23
HFSC-2013-257 Meade SW¼ SW¼ sec. 21. T. 8 N., R. 13 E. 63.39 16.60 8.58 13.45
White River Group
HFSC-2013-206* Tripp SE¼ SE¼ sec. 20, T. 95 N., R. 78 W. 11.95 44.98 20.91 27.57
HFSC-2013-218* Meade NE¼ SE¼ sec. 8. T. 12 N., R. 13 E. 13.4 65.00 23.35 6.05
Arikaree Group
HFSC-2013-229 Bennett NW¼ sec. 17, T. 36 N., R. 33 W. 3.70 12.17 18.73 67.36
HFSC-2013-236 Bennett SE¼ SW¼ sec. 21, T. 39 N., R. 37 W. 0.35 2.68 23.38 74.71
HFSC-2013-237 Bennett SE¼ SE¼ sec. 16, T. 38 N., R. 37 W. 0.01 0.22 0.60 99.23
HFSC-2013-238 Bennett NE¼ NW¼ sec. 2, T. 38 N., R. 40 W. 0.01 1.21 4.76 94.65
HFSC-2013-239 Bennett SW¼ sec. 8, T. 38 N., R. 38 W. 0.18 2.20 1.22 96.70
Ogallala Group
HFSC-2013-207* Gregory SE¼ NE¼ sec. 26, T. 97 N., R. 72 W. 15.74 44.03 18.07 2.21
HFSC-2013-210* Charles Mix SE¼ SW¼ sec. 36, T. 96 N., R. 65 W. 29.79 45.82 29.58 3.57
HFSC-2013-219* Gregory NE¼ NE¼ sec. 21, T. 97 N., R. 72 W. 12.68 50.87 45.63 3.79
HFSC-2013-226 Bennett NW¼ sec. 5, T. 37 N., R. 33 W. 0.58 3.58 32.07 64.65
HFSC-2013-227 Bennett SW¼ NW¼ sec. 8, T. 37 N., R. 34 W. 0.64 16.76 52.60 37.68
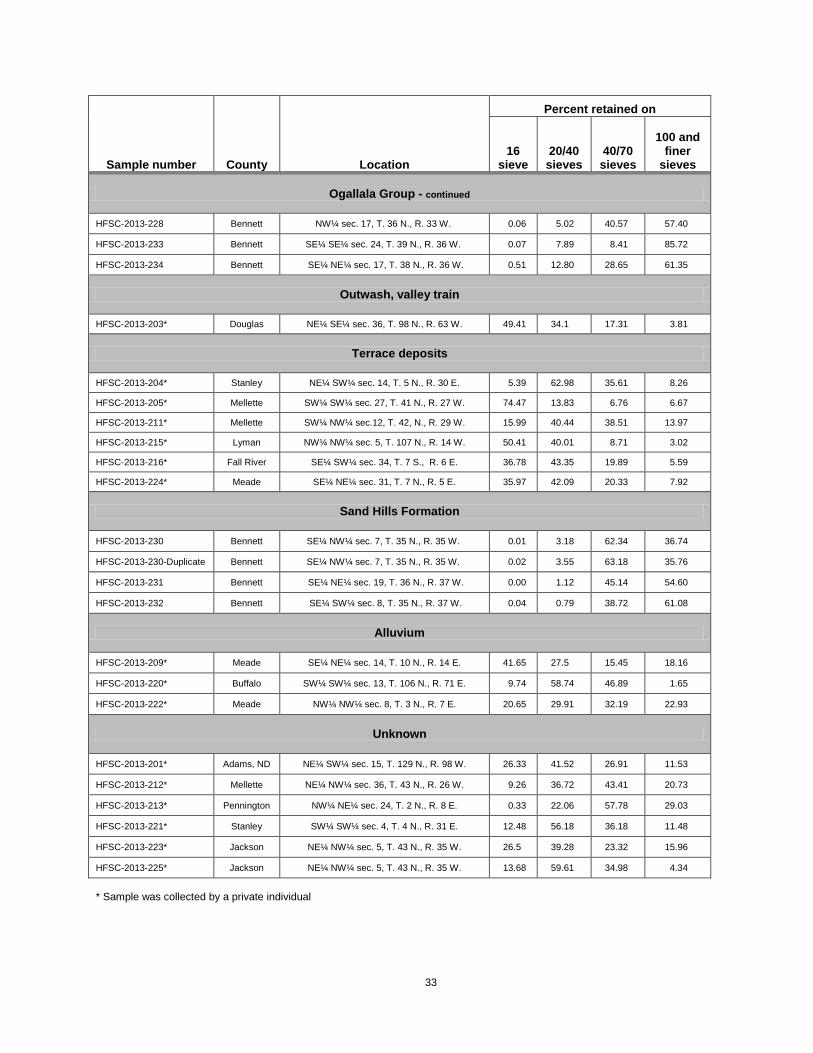
33
Sample number
County
Location
Percent retained on
16 sieve
20/40 sieves
40/70 sieves
100 and finer
sieves
Ogallala Group - continued
HFSC-2013-228 Bennett NW¼ sec. 17, T. 36 N., R. 33 W. 0.06 5.02 40.57 57.40
HFSC-2013-233 Bennett SE¼ SE¼ sec. 24, T. 39 N., R. 36 W. 0.07 7.89 8.41 85.72
HFSC-2013-234 Bennett SE¼ NE¼ sec. 17, T. 38 N., R. 36 W. 0.51 12.80 28.65 61.35
Outwash, valley train
HFSC-2013-203* Douglas NE¼ SE¼ sec. 36, T. 98 N., R. 63 W. 49.41 34.1 17.31 3.81
Terrace deposits
HFSC-2013-204* Stanley NE¼ SW¼ sec. 14, T. 5 N., R. 30 E. 5.39 62.98 35.61 8.26
HFSC-2013-205* Mellette SW¼ SW¼ sec. 27, T. 41 N., R. 27 W. 74.47 13.83 6.76 6.67
HFSC-2013-211* Mellette SW¼ NW¼ sec.12, T. 42, N., R. 29 W. 15.99 40.44 38.51 13.97
HFSC-2013-215* Lyman NW¼ NW¼ sec. 5, T. 107 N., R. 14 W. 50.41 40.01 8.71 3.02
HFSC-2013-216* Fall River SE¼ SW¼ sec. 34, T. 7 S., R. 6 E. 36.78 43.35 19.89 5.59
HFSC-2013-224* Meade SE¼ NE¼ sec. 31, T. 7 N., R. 5 E. 35.97 42.09 20.33 7.92
Sand Hills Formation
HFSC-2013-230 Bennett SE¼ NW¼ sec. 7, T. 35 N., R. 35 W. 0.01 3.18 62.34 36.74
HFSC-2013-230-Duplicate Bennett SE¼ NW¼ sec. 7, T. 35 N., R. 35 W. 0.02 3.55 63.18 35.76
HFSC-2013-231 Bennett SE¼ NE¼ sec. 19, T. 36 N., R. 37 W. 0.00 1.12 45.14 54.60
HFSC-2013-232 Bennett SE¼ SW¼ sec. 8, T. 35 N., R. 37 W. 0.04 0.79 38.72 61.08
Alluvium
HFSC-2013-209* Meade SE¼ NE¼ sec. 14, T. 10 N., R. 14 E. 41.65 27.5 15.45 18.16
HFSC-2013-220* Buffalo SW¼ SW¼ sec. 13, T. 106 N., R. 71 E. 9.74 58.74 46.89 1.65
HFSC-2013-222* Meade NW¼ NW¼ sec. 8, T. 3 N., R. 7 E. 20.65 29.91 32.19 22.93
Unknown
HFSC-2013-201* Adams, ND NE¼ SW¼ sec. 15, T. 129 N., R. 98 W. 26.33 41.52 26.91 11.53
HFSC-2013-212* Mellette NE¼ NW¼ sec. 36, T. 43 N., R. 26 W. 9.26 36.72 43.41 20.73
HFSC-2013-213* Pennington NW¼ NE¼ sec. 24, T. 2 N., R. 8 E. 0.33 22.06 57.78 29.03
HFSC-2013-221* Stanley SW¼ SW¼ sec. 4, T. 4 N., R. 31 E. 12.48 56.18 36.18 11.48
HFSC-2013-223* Jackson NE¼ NW¼ sec. 5, T. 43 N., R. 35 W. 26.5 39.28 23.32 15.96
HFSC-2013-225* Jackson NE¼ NW¼ sec. 5, T. 43 N., R. 35 W. 13.68 59.61 34.98 4.34
* Sample was collected by a private individual