Embed Size (px)
Citation preview

1
Assessment of Statewide Health Needs - 2007
Selected Data from State Demographics, Vital Events, Chronic and Communicable Disease, Health
Behaviors, and Health Systems
Prepared by members of the Data Analysis Team, Public Health System Development and Data Commission (PHSDD), Indiana State Department of Health. Editorial assistance was skillfully provided by Teresa Barlow.

2
Overview
• The material comprising this assessment was selected primarily from published reports of vital events prepared by the Indiana State Department of Health (ISDH) Data Analysis Team, annual Indiana and United States Behavioral Risk Factor Surveillance System (BRFSS) reports, ISDH Epidemiology Newsletters, the Enteric Epidemiology files, and the U.S. Census Bureau and STATS Indiana Web sites.
• Annual state vital events and BRFSS reports may be accessed at http://www.in.gov/isdh/dataandstats/data_and_statistics.htm.• National BRFSS data are available at http://www.cdc.gov/brfss/. Both prevalence and trend data are available here.• Current and archived issues of the ISDH Epidemiology Newsletter are available at http://www.in.gov/isdh/dataandstats/epidem/epinews_index.htm• The U.S. Census Bureau Web site may be accessed at http://www.census.gov/.• The STATS Indiana Web pages are available at http://www.stats.indiana.edu/.

3
Overview (continued)
• The information provided is not intended to be exhaustive but, rather, to present five or ten years of data to more clearly illustrate trends in Hoosier health.
• This material has not been presented in this format before, although year-by-year data are available from annual reports.
• Information on important environmental health issues and programs, e.g., Lead Poisoning Prevention, Radon, and Mercury, are not included in this assessment.
ISDH annual reports of vital events and other data reports may be accessed through the general index located at http://www.in.gov/isdh/dataandstats/data_and_statistics.htm.Lead Poisoning Prevention information may be accessed at http://www.in.gov/isdh/programs/lead/index.htm.Environmental Epidemiology information may be accessed at http://www.in.gov/isdh/programs/environmental/index.htm.Radon information may be accessed at http://www.in.gov/isdh/regsvcs/radhealth/radon.htm.
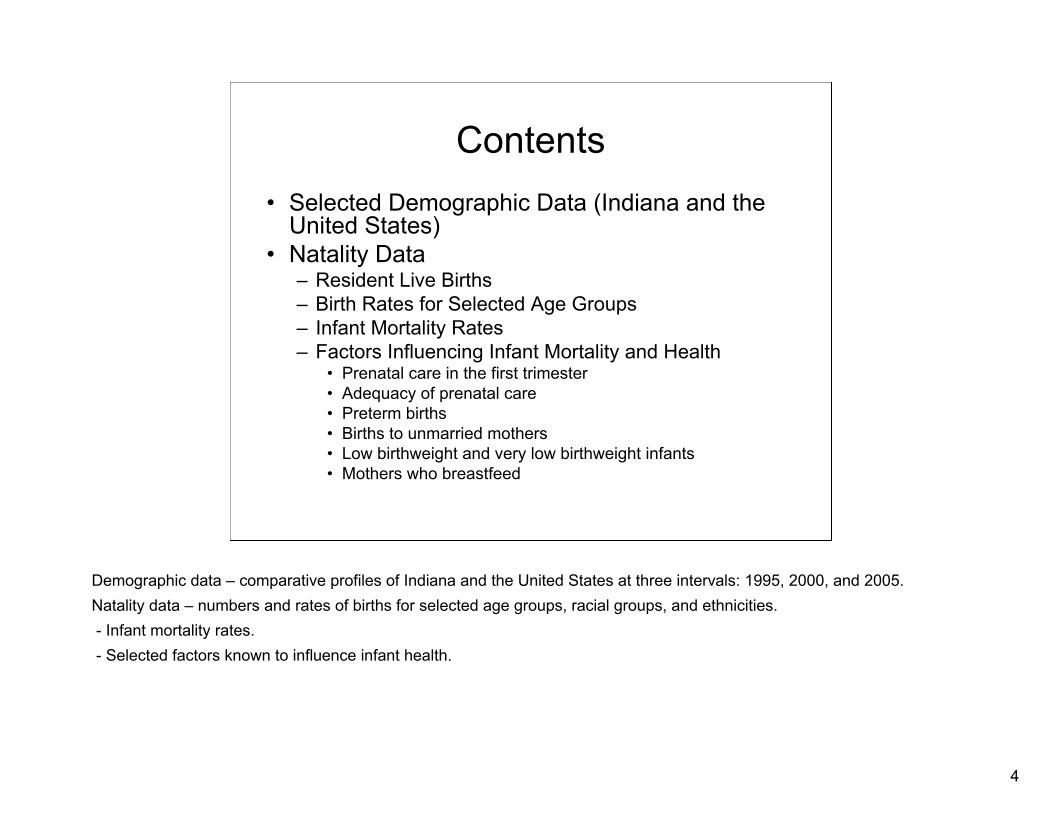
4
Contents• Selected Demographic Data (Indiana and the
United States)• Natality Data
– Resident Live Births– Birth Rates for Selected Age Groups– Infant Mortality Rates– Factors Influencing Infant Mortality and Health
• Prenatal care in the first trimester• Adequacy of prenatal care• Preterm births• Births to unmarried mothers• Low birthweight and very low birthweight infants• Mothers who breastfeed
Demographic data – comparative profiles of Indiana and the United States at three intervals: 1995, 2000, and 2005.Natality data – numbers and rates of births for selected age groups, racial groups, and ethnicities. - Infant mortality rates.- Selected factors known to influence infant health.
5
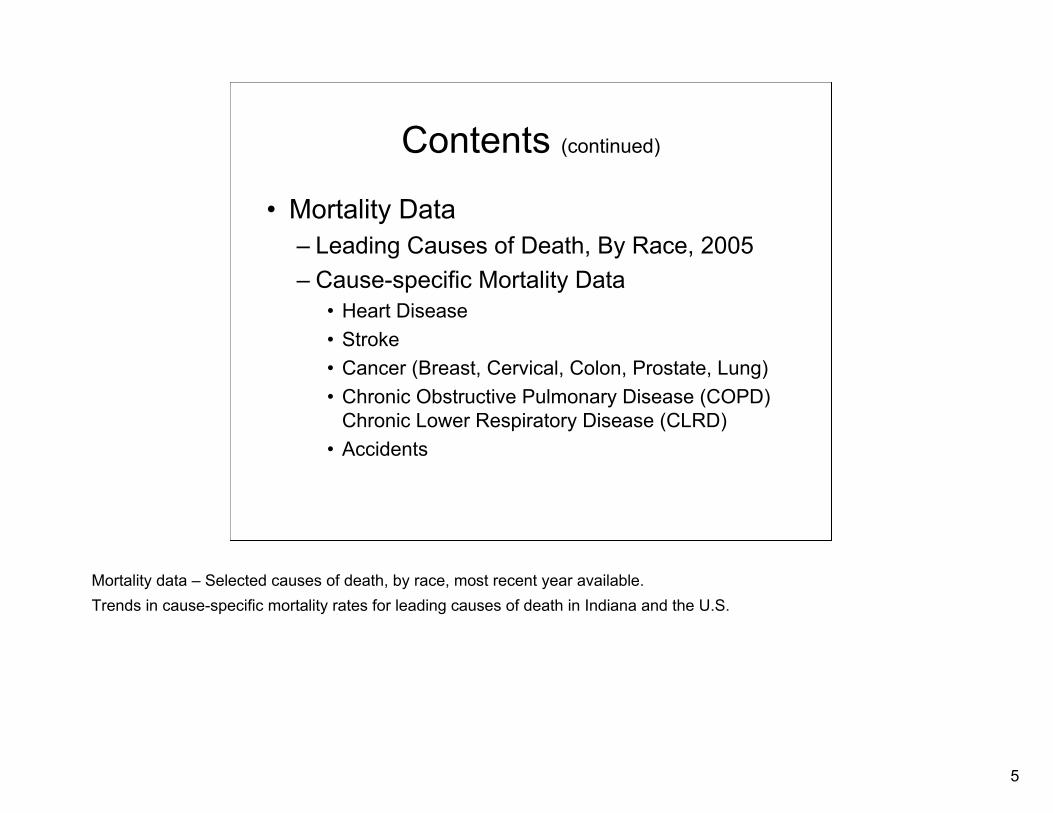
Contents (continued)
• Mortality Data– Leading Causes of Death, By Race, 2005– Cause-specific Mortality Data
• Heart Disease• Stroke• Cancer (Breast, Cervical, Colon, Prostate, Lung)• Chronic Obstructive Pulmonary Disease (COPD)
Chronic Lower Respiratory Disease (CLRD)• Accidents
Mortality data – Selected causes of death, by race, most recent year available.Trends in cause-specific mortality rates for leading causes of death in Indiana and the U.S.
6
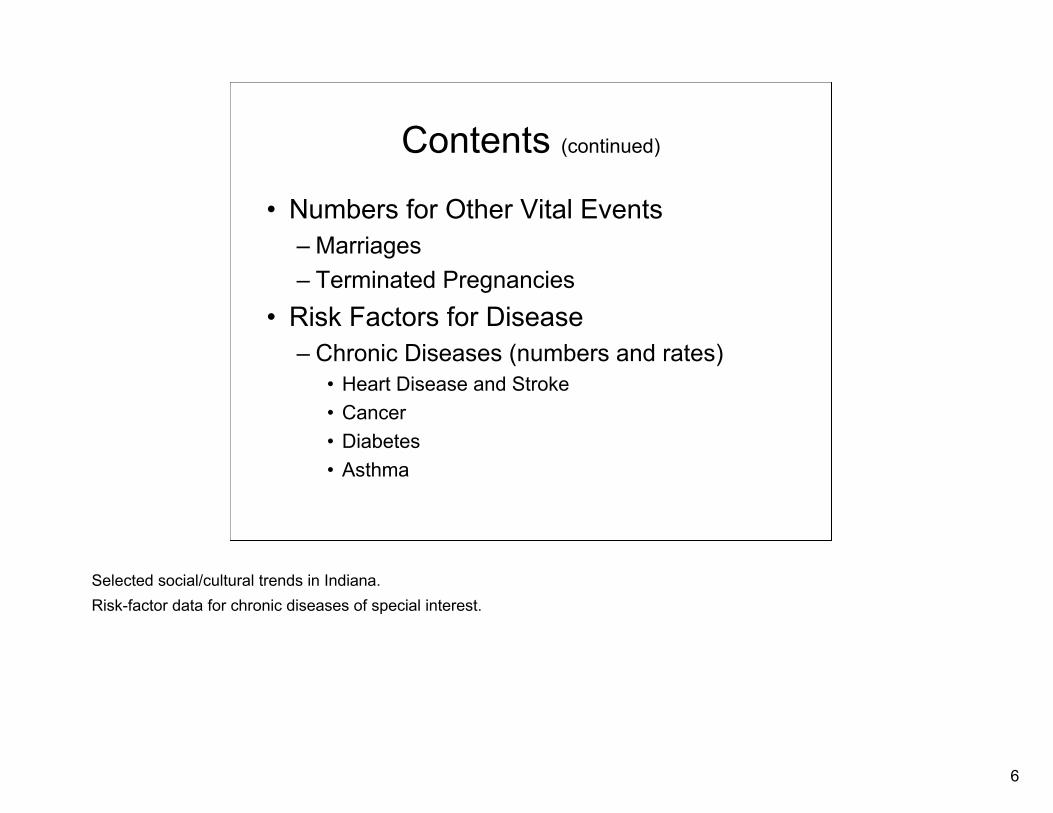
Contents (continued)
• Numbers for Other Vital Events– Marriages– Terminated Pregnancies
• Risk Factors for Disease– Chronic Diseases (numbers and rates)
• Heart Disease and Stroke• Cancer• Diabetes• Asthma
Selected social/cultural trends in Indiana.Risk-factor data for chronic diseases of special interest.

7
Contents (continued)
• Risk Factors for Disease (continued)
– Communicable Diseases (numbers and rates)• HIV/AIDS• Hepatitis B and C• Chlamydia and Gonorrhea• Primary and Secondary Syphilis• Pneumonia• Influenza• E. Coli O157:H7• Tuberculosis• Foodborne Illness
Selected communicable disease information of relevance to public health.
8
Contents (continued)
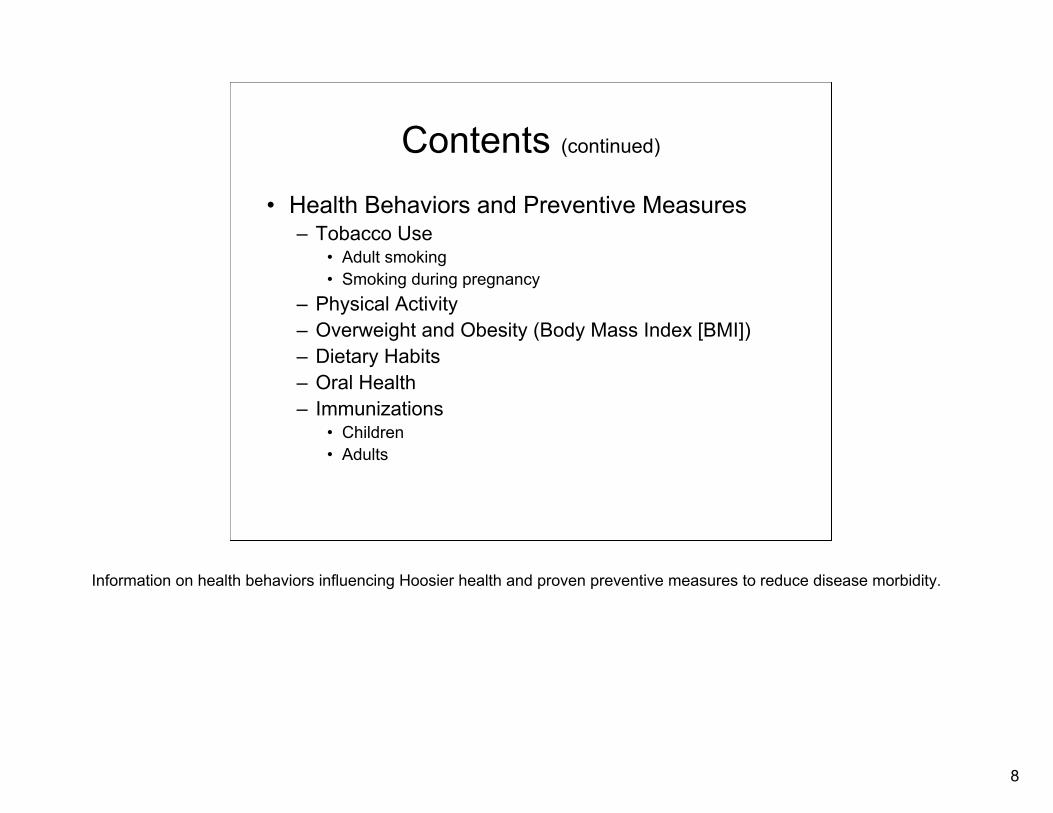
• Health Behaviors and Preventive Measures– Tobacco Use
• Adult smoking• Smoking during pregnancy
– Physical Activity– Overweight and Obesity (Body Mass Index [BMI])– Dietary Habits– Oral Health– Immunizations
• Children• Adults
Information on health behaviors influencing Hoosier health and proven preventive measures to reduce disease morbidity.

9
Contents (continued)
• Health Systems– Licensed Health Professionals– Maps of Indiana Medically Underserved
Areas (MUA) and Health Professional Shortage Areas (HPSA)
– Health Care Facilities and Statistics– Selected Hospital Data
• Acknowledgements
Overview of Indiana health systems: health professionals, medically underserved areas, number of health care facilities, and trends in inpatient and outpatient numbers.
10
I. Selected Demographic Data
Indiana and the United States,1995, 2000, and 2005
11
1995 2000(Census)
2005 1995 2000(Census)
2005
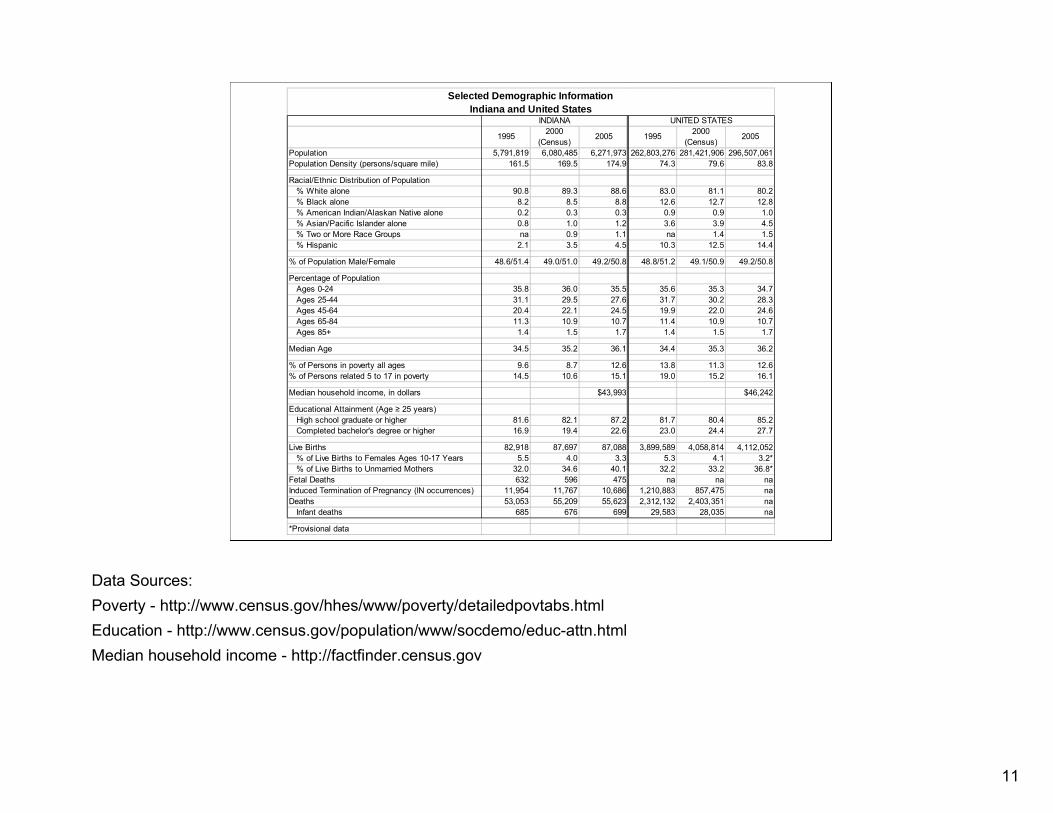
Population 5,791,819 6,080,485 6,271,973 262,803,276 281,421,906 296,507,061Population Density (persons/square mile) 161.5 169.5 174.9 74.3 79.6 83.8
Racial/Ethnic Distribution of Population % White alone 90.8 89.3 88.6 83.0 81.1 80.2% Black alone 8.2 8.5 8.8 12.6 12.7 12.8% American Indian/Alaskan Native alone 0.2 0.3 0.3 0.9 0.9 1.0% Asian/Pacific Islander alone 0.8 1.0 1.2 3.6 3.9 4.5% Two or More Race Groups na 0.9 1.1 na 1.4 1.5% Hispanic 2.1 3.5 4.5 10.3 12.5 14.4
% of Population Male/Female 48.6/51.4 49.0/51.0 49.2/50.8 48.8/51.2 49.1/50.9 49.2/50.8
Percentage of Population Ages 0-24 35.8 36.0 35.5 35.6 35.3 34.7Ages 25-44 31.1 29.5 27.6 31.7 30.2 28.3Ages 45-64 20.4 22.1 24.5 19.9 22.0 24.6Ages 65-84 11.3 10.9 10.7 11.4 10.9 10.7Ages 85+ 1.4 1.5 1.7 1.4 1.5 1.7
Median Age 34.5 35.2 36.1 34.4 35.3 36.2
% of Persons in poverty all ages 9.6 8.7 12.6 13.8 11.3 12.6% of Persons related 5 to 17 in poverty 14.5 10.6 15.1 19.0 15.2 16.1
Median household income, in dollars $43,993 $46,242
Educational Attainment (Age ≥ 25 years)High school graduate or higher 81.6 82.1 87.2 81.7 80.4 85.2Completed bachelor's degree or higher 16.9 19.4 22.6 23.0 24.4 27.7
Live Births 82,918 87,697 87,088 3,899,589 4,058,814 4,112,052% of Live Births to Females Ages 10-17 Years 5.5 4.0 3.3 5.3 4.1 3.2*% of Live Births to Unmarried Mothers 32.0 34.6 40.1 32.2 33.2 36.8*
Fetal Deaths 632 596 475 na na naInduced Termination of Pregnancy (IN occurrences) 11,954 11,767 10,686 1,210,883 857,475 naDeaths 53,053 55,209 55,623 2,312,132 2,403,351 na
Infant deaths 685 676 699 29,583 28,035 na
*Provisional data
Selected Demographic InformationIndiana and United States
INDIANA UNITED STATES
Data Sources: Poverty - http://www.census.gov/hhes/www/poverty/detailedpovtabs.htmlEducation - http://www.census.gov/population/www/socdemo/educ-attn.htmlMedian household income - http://factfinder.census.gov
12
II. Natality Data
A. Resident Live Births
13
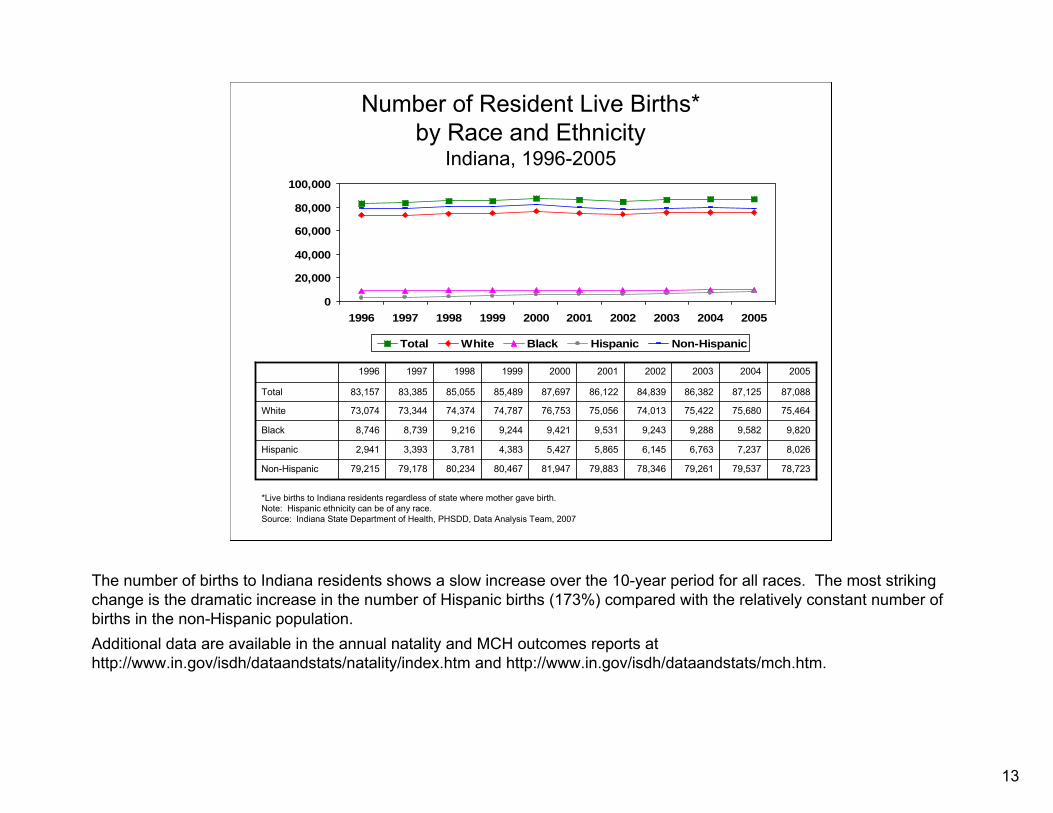
Number of Resident Live Births*by Race and Ethnicity
Indiana, 1996-2005
0
20,000
40,000
60,000
80,000
100,000
1996 1997 1998 1999 2000 2001 2002 2003 2004 2005
Total White Black Hispanic Non-Hispanic
9,8209,5829,2889,2439,5319,4219,2449,2168,7398,746Black
8,0267,2376,7636,1455,8655,4274,3833,7813,3932,941Hispanic
79,215
73,074
83,157
1996
79,178
73,344
83,385
1997
80,234
74,374
85,055
1998
80,467
74,787
85,489
1999
81,947
76,753
87,697
2000
78,72379,53779,26178,34679,883Non-Hispanic
75,46475,68075,42274,01375,056White
87,08887,12586,38284,83986,122Total
20052004200320022001
*Live births to Indiana residents regardless of state where mother gave birth.Note: Hispanic ethnicity can be of any race.Source: Indiana State Department of Health, PHSDD, Data Analysis Team, 2007
The number of births to Indiana residents shows a slow increase over the 10-year period for all races. The most striking change is the dramatic increase in the number of Hispanic births (173%) compared with the relatively constant number of births in the non-Hispanic population.Additional data are available in the annual natality and MCH outcomes reports at http://www.in.gov/isdh/dataandstats/natality/index.htm and http://www.in.gov/isdh/dataandstats/mch.htm.

14
II. Natality Data
B. Birth Rates for Selected Age Groups

15
Age-Specific Birth Rates*Teenage Females by Age Group, All Races/Ethnicities
Indiana Residents, 1996-2005
0
20
40
60
80
100
1996 1997 1998 1999 2000 2001 2002 2003 2004 2005
15-17 Years 18-19 Years 15-19 Years
55.8
90.9
32.7
1996
54.1
87.5
32.1
1997
53.2
89.4
28.9
1998
51.3
86.3
27.4
1999
49.1
80.8
26.2
2000
43.243.543.444.545.715-19 Years
78.878.177.278.376.118-19 Years
20.520.921.522.523.715-17 Years
20052004200320022001
*Rate per 1,000 live births to females in age group.Source: Indiana State Department of Health, PHSDD, Data Analysis Team, 2007
Birth rates for all age groups of teenage females have been declining over the 10-year period, a very positive trend.Additional data are available in the annual natality reports at http://www.in.gov/isdh/dataandstats/natality/index.htm.
16
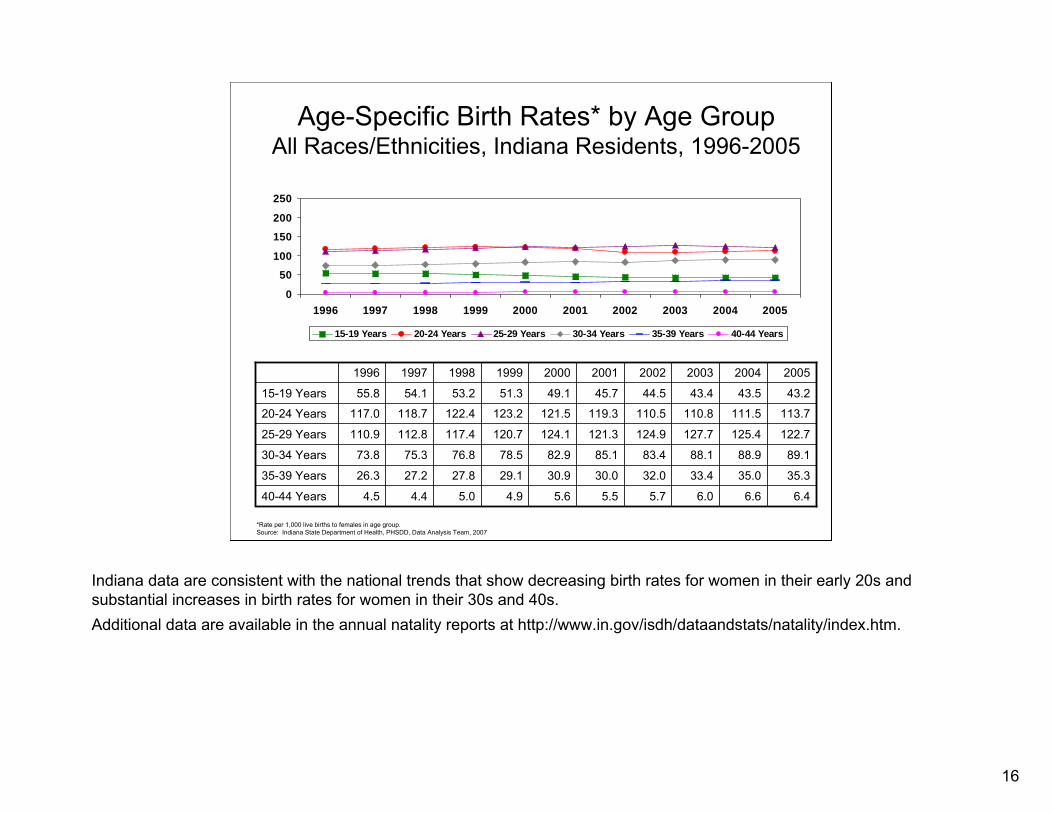
Age-Specific Birth Rates* by Age GroupAll Races/Ethnicities, Indiana Residents, 1996-2005
0
50100
150
200
250
1996 1997 1998 1999 2000 2001 2002 2003 2004 2005
15-19 Years 20-24 Years 25-29 Years 30-34 Years 35-39 Years 40-44 Years
35.335.033.432.030.030.929.127.827.226.335-39 Years
122.7125.4127.7124.9121.3124.1120.7117.4112.8110.925-29 Years
89.188.988.183.485.182.978.576.875.373.830-34 Years
4.5
117.0
55.8
1996
4.4
118.7
54.1
1997
5.0
122.4
53.2
1998
4.9
123.2
51.3
1999
5.6
121.5
49.1
2000
6.46.66.05.75.540-44 Years
113.7111.5110.8110.5119.320-24 Years
43.243.543.444.545.715-19 Years
20052004200320022001
*Rate per 1,000 live births to females in age group.Source: Indiana State Department of Health, PHSDD, Data Analysis Team, 2007
Indiana data are consistent with the national trends that show decreasing birth rates for women in their early 20s and substantial increases in birth rates for women in their 30s and 40s. Additional data are available in the annual natality reports at http://www.in.gov/isdh/dataandstats/natality/index.htm.
17
II. Natality Data
C. Infant Mortality Rates

18
Infant Mortality Rates by RaceIndiana Residents, 1996-2005
0
5
10
15
20
25
1996 1997 1998 1999 2000 2001 2002 2003 2004 2005
Total White Black
15.9
6.7
7.7
2000
17.0
6.8
7.8
1999
17.1
6.3
7.5
1998
15.6
7.2
8.1
1997
18.4
7.5
8.7
1996
16.917.115.915.613.6Black
6.96.96.46.56.8White
8.08.17.47.67.6Total
20052004200320022001
Source: Indiana State Department of Health, PHSDD, Data Analysis Team, 2007
Rate per 1,000 live births
Overall, infant mortality rates have shown a very slow downward trend during the 10-year period. The mortality rates for black infants remain consistently higher than the rates for white infants. Additional data are available in the annual mortality and MCH outcomes reports at http://www.in.gov/isdh/dataandstats/mortality/mortality_index.htm and http://www.in.gov/isdh/dataandstats/mch.htm.

19
Infant Mortality Rates by EthnicityIndiana Residents, 1996-2005
0
5
10
15
20
25
1996 1997 1998 1999 2000 2001 2002 2003 2004 2005
Total Non-Hispanic Hispanic
5.2
7.9
7.7
2000
7.1
7.9
7.8
1999
8.2
7.5
7.5
1998
7.4
8.1
8.1
1997
7.1
8.7
8.7
1996
8.19.05.68.08.5Hispanic
8.08.07.67.67.5Non-Hispanic
8.08.17.47.67.6Total
20052004200320022001
Source: Indiana State Department of Health, PHSDD, Data Analysis Team, 2007
Rate per 1,000 live births
The infant mortality rates for Hispanic infants show little difference from the rates for non-Hispanic infants. Apparent differences may be due to the instability of rates based on relatively small numbers.Additional data are available in the annual mortality and MCH outcomes reports at http://www.in.gov/isdh/dataandstats/mortality/mortality_index.htm and http://www.in.gov/isdh/dataandstats/mch.htm.
20
II. Natality Data
D. Factors Influencing Infant Mortality and Health

21
Percent of Infants Born to Mothers ReceivingPrenatal Care in the First Trimester by Race
Indiana Residents, 1996-2005
0
20
40
60
80
100
1996 1997 1998 1999 2000 2001 2002 2003 2004 2005
Total White Black
61.6
80.6
78.5
1996
64.0
80.3
78.5
1997
63.9
80.6
78.7
1998
65.5
81.3
79.5
1999
67.1
81.6
80.0
2000
64.867.168.268.667.6Black
80.880.882.182.181.4White
78.979.380.680.579.8Total
20052004200320022001
*The values are percentages of live births and include the unknowns.Source: Indiana State Department of Health, PHSDD, Data Analysis Team, 2007
Percent*
Although the gap between the two racial groups has been narrowing somewhat, black mothers are still less likely to receive prenatal care in the first trimester than white mothers. The difference is almost 20 percent. Improvement in the percent of black mothers receiving prenatal care in the first trimester also seems to be faltering.Additional data are available in the annual natality and MCH outcomes reports at http://www.in.gov/isdh/dataandstats/natality/index.htm and http://www.in.gov/isdh/dataandstats/mch.htm.
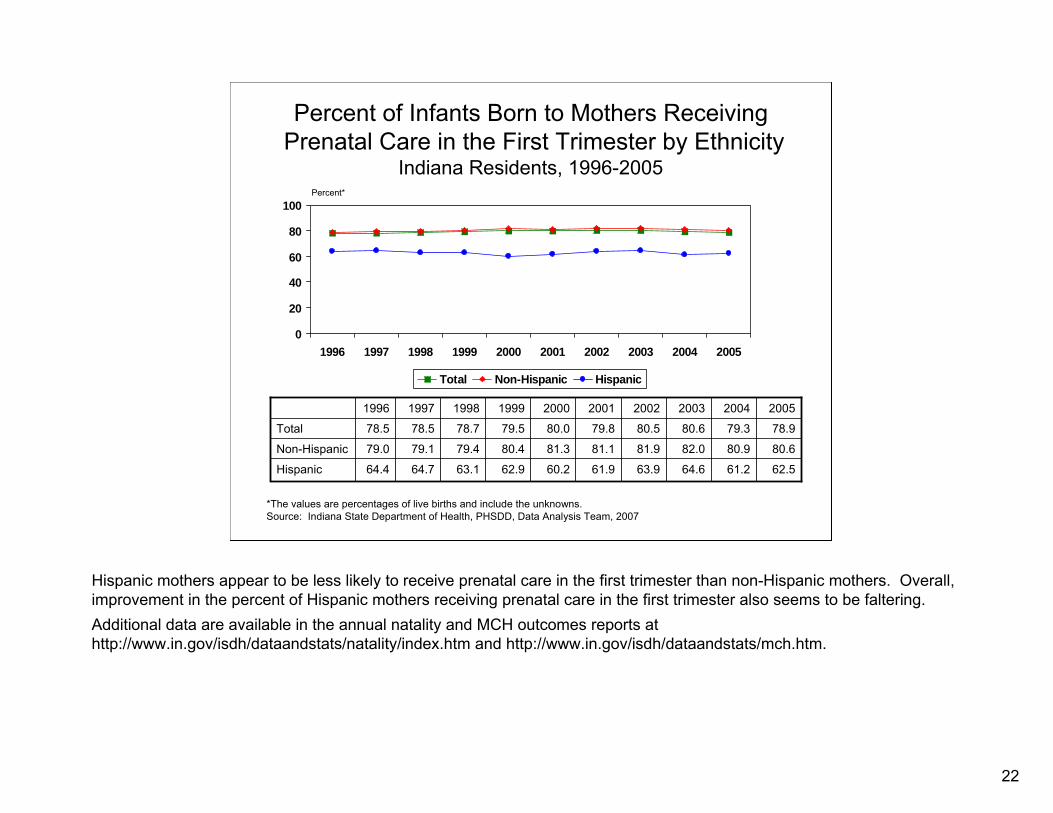
22
Percent of Infants Born to Mothers ReceivingPrenatal Care in the First Trimester by Ethnicity
Indiana Residents, 1996-2005
0
20
40
60
80
100
1996 1997 1998 1999 2000 2001 2002 2003 2004 2005
Total Non-Hispanic Hispanic
64.4
79.0
78.5
1996
64.7
79.1
78.5
1997
63.1
79.4
78.7
1998
62.9
80.4
79.5
1999
60.2
81.3
80.0
2000
62.561.264.663.961.9Hispanic
80.680.982.081.981.1Non-Hispanic
78.979.380.680.579.8Total
20052004200320022001
*The values are percentages of live births and include the unknowns.Source: Indiana State Department of Health, PHSDD, Data Analysis Team, 2007
Percent*
Hispanic mothers appear to be less likely to receive prenatal care in the first trimester than non-Hispanic mothers. Overall, improvement in the percent of Hispanic mothers receiving prenatal care in the first trimester also seems to be faltering.Additional data are available in the annual natality and MCH outcomes reports at http://www.in.gov/isdh/dataandstats/natality/index.htm and http://www.in.gov/isdh/dataandstats/mch.htm.

23
Adequacy of Prenatal Care Utilization(Kotelchuck Index)
All Races/Ethnicities, Indiana Residents, 1996-2005
0102030405060
1996 1997 1998 1999 2000 2001 2002 2003 2004 2005
Adequate Plus Adequate Intermediate Inadequate No Care
0.9
11.7
13.8
46.5
27.1
1996
0.9
11.9
13.1
45.3
28.9
1997
0.9
12.0
12.4
43.5
31.2
1998
0.8
11.7
12.4
44.2
31.1
1999
0.8
11.8
12.9
43.7
30.8
2000
41.042.442.943.643.4Adequate
13.613.613.212.513.0Intermediate
0.70.80.60.70.8No Care
12.312.311.511.411.9Inadequate
32.431.031.831.831.0Adequate Plus
20052004200320022001
*The values are percentages of live births and do not include the unknowns.Source: Indiana State Department of Health, Maternal and Child Health (MCH), 2007
Percent*t*
0102030405060
1996 1997 1998 1999 2000 2001 2002 2003 2004 2005
Adequate Plus Adequate Intermediate Inadequate No Care
The percentage of mothers receiving “Adequate Plus” prenatal care has increased over the 10-year period; there has been an accompanying decrease in the percentage classified as only “Adequate”. There does not appear to be a net increase in the percentage of mothers receiving these two highest levels of prenatal care.Additional data are available in the annual MCH outcomes reports at http://www.in.gov/isdh/dataandstats/mch.htm.

24
Percent of Preterm* Birthsby Race of Mother
Indiana Residents, 1996-2005
0
5
10
15
20
1996 1997 1998 1999 2000 2001 2002 2003 2004 2005
Total White Black
12.8
7.6
8.1
1996
12.4
7.6
8.0
1997
12.7
8.0
8.5
1998
11.8
8.3
8.7
1999
12.7
8.5
9.0
2000
13.713.913.312.512.3Black
10.19.99.59.08.7White
10.510.29.99.49.1Total
20052004200320022001
*Delivery of a liveborn infant prior to 37 weeks gestation.Source: Indiana State Department of Health, PHSDD, Data Analysis Team, 2007
There has been a steady increase in the number of preterm births to mothers of both racial groups. Preterm births to black mothers remain consistently higher.Additional data are available in the annual natality and MCH outcomes reports at http://www.in.gov/isdh/dataandstats/natality/index.htm and http://www.in.gov/isdh/dataandstats/mch.htm.

25
Percent of Preterm* Birthsby Ethnicity of Mother
Indiana Residents, 1996-2005
0
5
10
15
20
1996 1997 1998 1999 2000 2001 2002 2003 2004 2005
Total Non-Hispanic Hispanic
7.5
8.1
8.1
1996
7.3
8.1
8.0
1997
7.6
8.5
8.5
1998
7.2
8.8
8.7
1999
6.5
9.1
9.0
2000
8.68.07.37.78.1Hispanic
10.710.510.19.59.1Non-Hispanic
10.510.29.99.49.1Total
20052004200320022001
*Delivery of a liveborn infant prior to 37 weeks gestation.Source: Indiana State Department of Health, PHSDD, Data Analysis Team, 2007
There has been a steady increase in the number of preterm births to mothers of both ethnicities, although the increase among Hispanic mothers may be at a slower rate.Additional data are available in the annual natality and MCH outcomes reports at http://www.in.gov/isdh/dataandstats/natality/index.htm and http://www.in.gov/isdh/dataandstats/mch.htm.
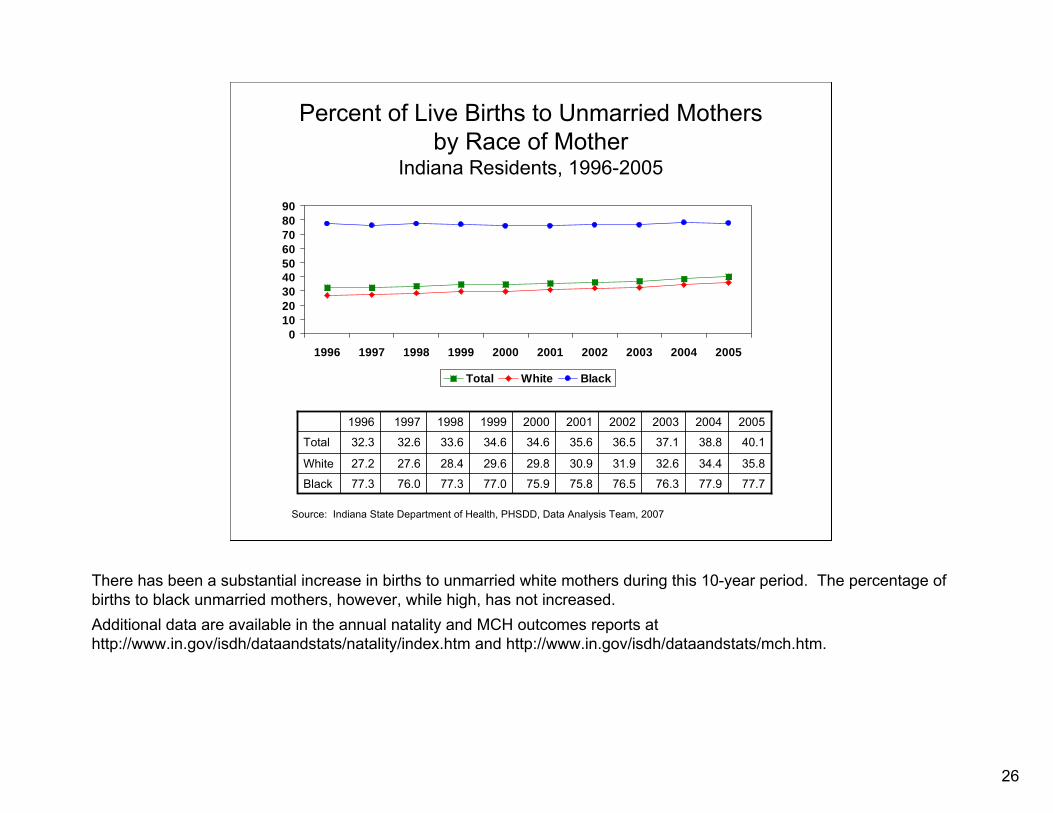
26
Percent of Live Births to Unmarried Mothersby Race of Mother
Indiana Residents, 1996-2005
0102030405060708090
1996 1997 1998 1999 2000 2001 2002 2003 2004 2005
Total White Black
77.3
27.2
32.3
1996
76.0
27.6
32.6
1997
77.3
28.4
33.6
1998
77.0
29.6
34.6
1999
75.9
29.8
34.6
2000
77.777.976.376.575.8Black
35.834.432.631.930.9White
40.138.837.136.535.6Total
20052004200320022001
Source: Indiana State Department of Health, PHSDD, Data Analysis Team, 2007
There has been a substantial increase in births to unmarried white mothers during this 10-year period. The percentage of births to black unmarried mothers, however, while high, has not increased.Additional data are available in the annual natality and MCH outcomes reports at http://www.in.gov/isdh/dataandstats/natality/index.htm and http://www.in.gov/isdh/dataandstats/mch.htm.

27
Percent of Live Births to Unmarried Mothersby Ethnicity of Mother
Indiana Residents, 1996-2005
0
20
40
60
80
100
1996 1997 1998 1999 2000 2001 2002 2003 2004 2005
Total Non-Hispanic Hispanic
41.4
32.1
32.3
1996
40.5
32.3
32.6
1997
42.2
33.3
33.6
1998
45.2
34.1
34.6
1999
47.5
33.7
34.6
2000
54.552.850.349.747.9Hispanic
38.737.535.935.534.7Non-Hispanic
40.138.837.136.535.6Total
20052004200320022001
Note: Hispanic ethnicity can be of any race.Source: Indiana State Department of Health, PHSDD, Data Analysis Team, 2007
There has been a substantial increase in births to unmarried non-Hispanic mothers during this 10-year period. The percentage of births to Hispanic unmarried mothers remains higher and has increased at a faster rate.Additional data are available in the annual natality and MCH outcomes reports at http://www.in.gov/isdh/dataandstats/natality/index.htm and http://www.in.gov/isdh/dataandstats/mch.htm.

28
Percent of Low Birthweight* Infantsby Race of Mother
Indiana Residents, 1996-2005
0
5
10
15
20
1996 1997 1998 1999 2000 2001 2002 2003 2004 2005
Total White Black
13.8
6.8
7.6
1996
13.6
7.0
7.7
1997
13.5
7.2
7.9
1998
12.9
7.2
7.8
1999
12.7
6.7
7.3
2000
13.413.713.312.912.9Black
7.67.47.26.97.0White
8.38.17.97.67.6Total
20052004200320022001
*Birthweight less than 2,500 grams (5 lb 8 oz).Source: Indiana State Department of Health, PHSDD, Data Analysis Team, 2007
The percent of low birthweight infants born to white mothers has increased during the 10-year period. While the percent of low birthweight infants born to black mothers remains higher, it has not increased.Additional data are available in the annual natality and MCH outcomes reports at http://www.in.gov/isdh/dataandstats/natality/index.htm and http://www.in.gov/isdh/dataandstats/mch.htm.

29
Percent of Low Birthweight* Infantsby Ethnicity of Mother
Indiana Residents, 1996-2005
0
5
10
15
20
1996 1997 1998 1999 2000 2001 2002 2003 2004 2005
Total Non-Hispanic Hispanic
7.1
7.6
7.6
1996
6.9
7.7
7.7
1997
7.0
8.0
7.9
1998
6.5
7.9
7.8
1999
5.3
7.5
7.3
2000
6.66.35.96.36.5Hispanic
8.58.38.07.77.7Non-Hispanic
8.38.17.97.67.6Total
20052004200320022001
*Birthweight less than 2,500 grams (5 lb 8 oz).Source: Indiana State Department of Health, PHSDD, Data Analysis Team, 2007
The percent of low birthweight infants born to non-Hispanic mothers has increased slightly. The percent born to Hispanic mothers is lower and may actually have decreased from the 1996-1998 peak.Additional data are available in the annual natality and MCH outcomes reports at http://www.in.gov/isdh/dataandstats/natality/index.htm and http://www.in.gov/isdh/dataandstats/mch.htm.

30
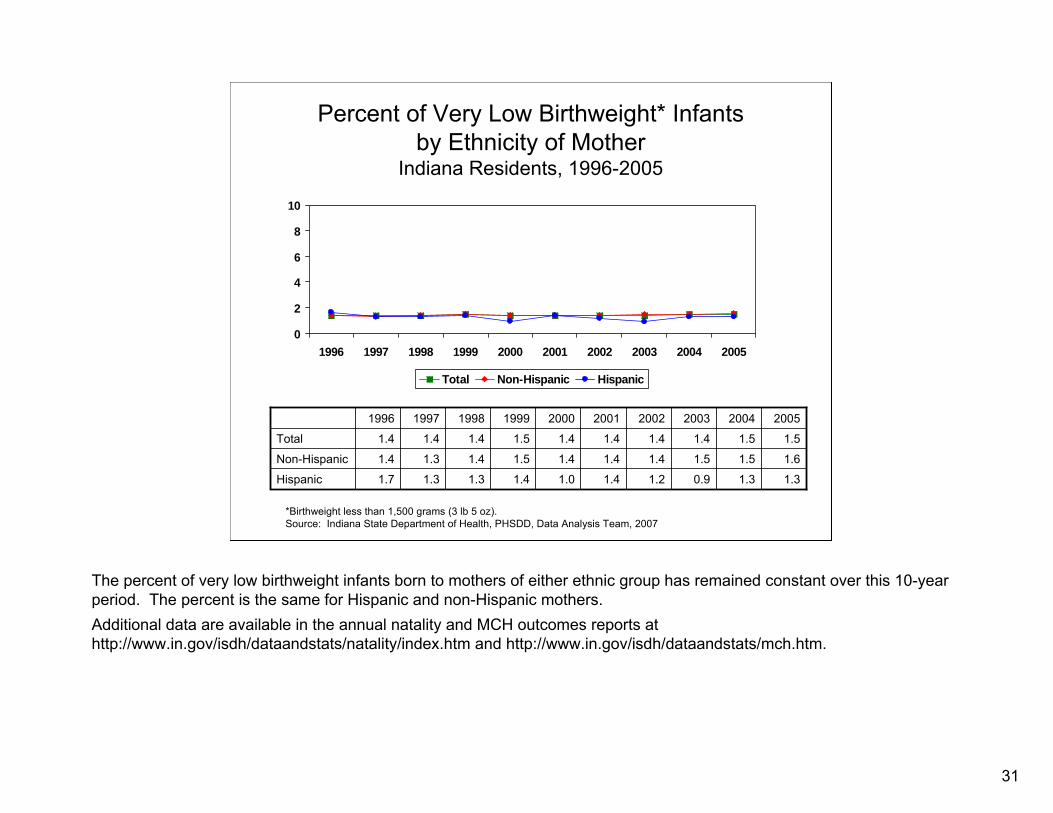
Percent of Very Low Birthweight* Infantsby Race of Mother
Indiana Residents, 1996-2005
0
2
4
6
8
10
1996 1997 1998 1999 2000 2001 2002 2003 2004 2005
Total White Black
3.1
1.2
1.4
1996
2.8
1.2
1.4
1997
3.0
1.2
1.4
1998
3.1
1.3
1.5
1999
2.9
1.2
1.4
2000
3.33.03.32.62.9Black
1.31.31.21.21.2White
1.51.51.41.41.4Total
20052004200320022001
*Birthweight less than 1,500 grams (3 lb 5 oz).Source: Indiana State Department of Health, PHSDD, Data Analysis Team, 2007
The percent of very low birthweight infants born to mothers of either racial group has remained relatively constant over this 10-year period.Additional data are available in the annual natality and MCH outcomes reports at http://www.in.gov/isdh/dataandstats/natality/index.htm and http://www.in.gov/isdh/dataandstats/mch.htm.
31
Percent of Very Low Birthweight* Infantsby Ethnicity of Mother
Indiana Residents, 1996-2005
0
2
4
6
8
10
1996 1997 1998 1999 2000 2001 2002 2003 2004 2005
Total Non-Hispanic Hispanic
1.7
1.4
1.4
1996
1.3
1.3
1.4
1997
1.3
1.4
1.4
1998
1.4
1.5
1.5
1999
1.0
1.4
1.4
2000
1.31.30.91.21.4Hispanic
1.61.51.51.41.4Non-Hispanic
1.51.51.41.41.4Total
20052004200320022001
*Birthweight less than 1,500 grams (3 lb 5 oz).Source: Indiana State Department of Health, PHSDD, Data Analysis Team, 2007
The percent of very low birthweight infants born to mothers of either ethnic group has remained constant over this 10-year period. The percent is the same for Hispanic and non-Hispanic mothers.Additional data are available in the annual natality and MCH outcomes reports at http://www.in.gov/isdh/dataandstats/natality/index.htm and http://www.in.gov/isdh/dataandstats/mch.htm.

32
Percent of Mothers Who BreastfedTheir Infants at Hospital Discharge by Race
Indiana Residents, 1996-2005
0
20
40
60
80
100
1996 1997 1998 1999 2000 2001 2002 2003 2004 2005
Total White Black
29.5
54.6
52.2
1996
31.9
56.1
53.8
1997
36.6
58.0
55.9
1998
36.4
59.0
56.8
1999
38.1
60.2
58.0
2000
45.544.642.643.542.9Black
67.665.865.564.463.1White
65.363.863.262.461.1Total
20052004200320022001
Source: Indiana State Department of Health, PHSDD, Data Analysis Team, 2007
Overall, the percent of mothers who are breastfeeding their infants at hospital discharge has been increasing. However, black mothers are less likely to be breastfeeding their infants at discharge than white mothers.Additional data are available in the annual natality and MCH outcomes reports at http://www.in.gov/isdh/dataandstats/natality/index.htm and http://www.in.gov/isdh/dataandstats/mch.htm.

33
Percent of Mothers Who BreastfedTheir Infants at Hospital Discharge by Ethnicity
Indiana Residents, 1996-2005
0
20
40
60
80
100
1996 1997 1998 1999 2000 2001 2002 2003 2004 2005
Total Non-Hispanic Hispanic
58.1
52.5
52.2
1996
58.6
53.9
53.8
1997
64.7
56.1
55.9
1998
66.7
56.5
56.8
1999
71.6
57.2
58.0
2000
79.879.177.776.674.2Hispanic
63.962.462.161.460.2Non-Hispanic
65.363.863.262.461.1Total
20052004200320022001
Source: Indiana State Department of Health, PHSDD, Data Analysis Team, 2007
Overall, the percent of mothers who are breastfeeding their infants at hospital discharge has been increasing among both Hispanic and non-Hispanic mothers. However, Hispanic mothers, at nearly 80 percent, are more likely to be breastfeeding their infants at discharge than non-Hispanic mothers.Additional data are available in the annual natality and MCH outcomes reports at http://www.in.gov/isdh/dataandstats/natality/index.htm and http://www.in.gov/isdh/dataandstats/mch.htm.

34
III. Mortality Data

35
Total Number of DeathsIndiana Residents, 1996-2005
010,00020,00030,00040,00050,00060,00070,000
1996 1997 1998 1999 2000 2001 2002 2003 2004 2005
52,927
1996
53,015
1997
53,285
1998
54,761
1999
55,209
2000
55,62354,21355,74755,12354,944Total
20052004200320022001
Source: Indiana State Department of Health, PHSDD, Data Analysis Team, 2007
Additional data are available in the annual mortality reports athttp://www.in.gov/isdh/dataandstats/mortality/mortality_index.htm and from the National Center for Health Statistics at http://www.cdc.gov/nchs/fastats/deaths.htm.
36
III. Mortality Data
A. Selected Leading Causes of Death, By Race and Sex, 2005

37
Latest available data: 2005.Additional data are available in the annual mortality reports athttp://www.in.gov/isdh/dataandstats/mortality/mortality_index.htm.
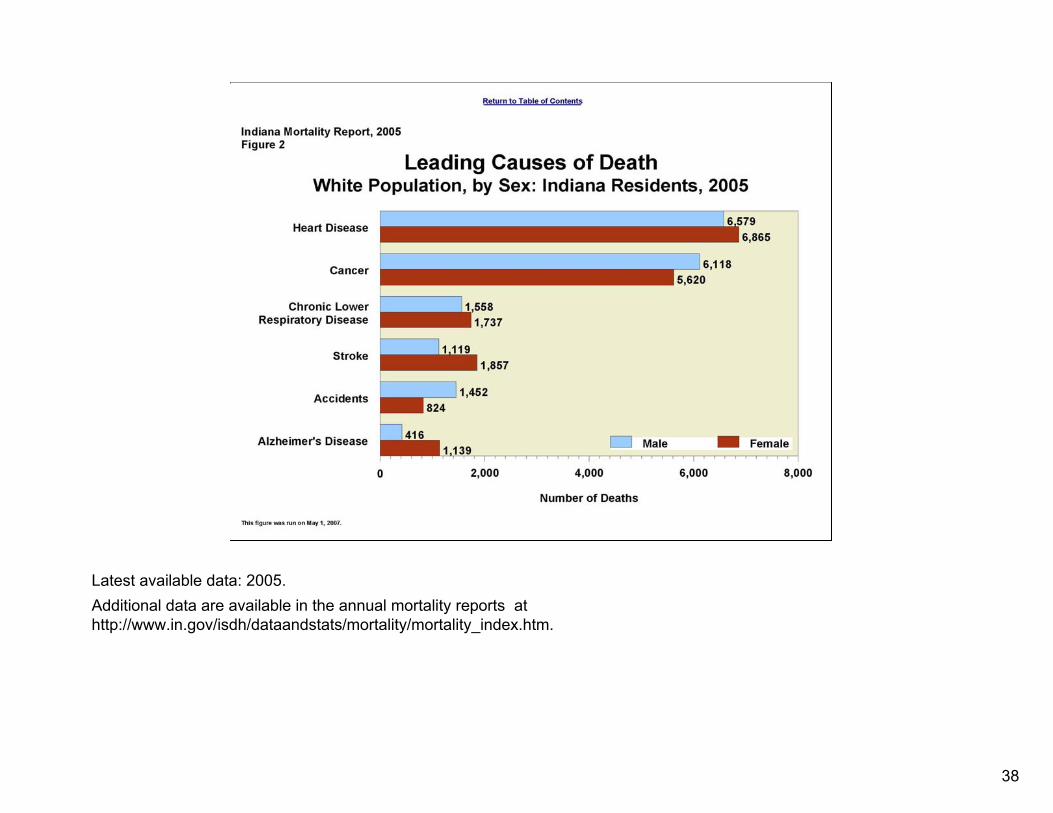
38
Latest available data: 2005.Additional data are available in the annual mortality reports at http://www.in.gov/isdh/dataandstats/mortality/mortality_index.htm.

39
Latest available data: 2005.Additional data are available in the annual mortality reports at http://www.in.gov/isdh/dataandstats/mortality/mortality_index.htm.

40
III. Mortality Data
B. Cause-specific Mortality Data
41
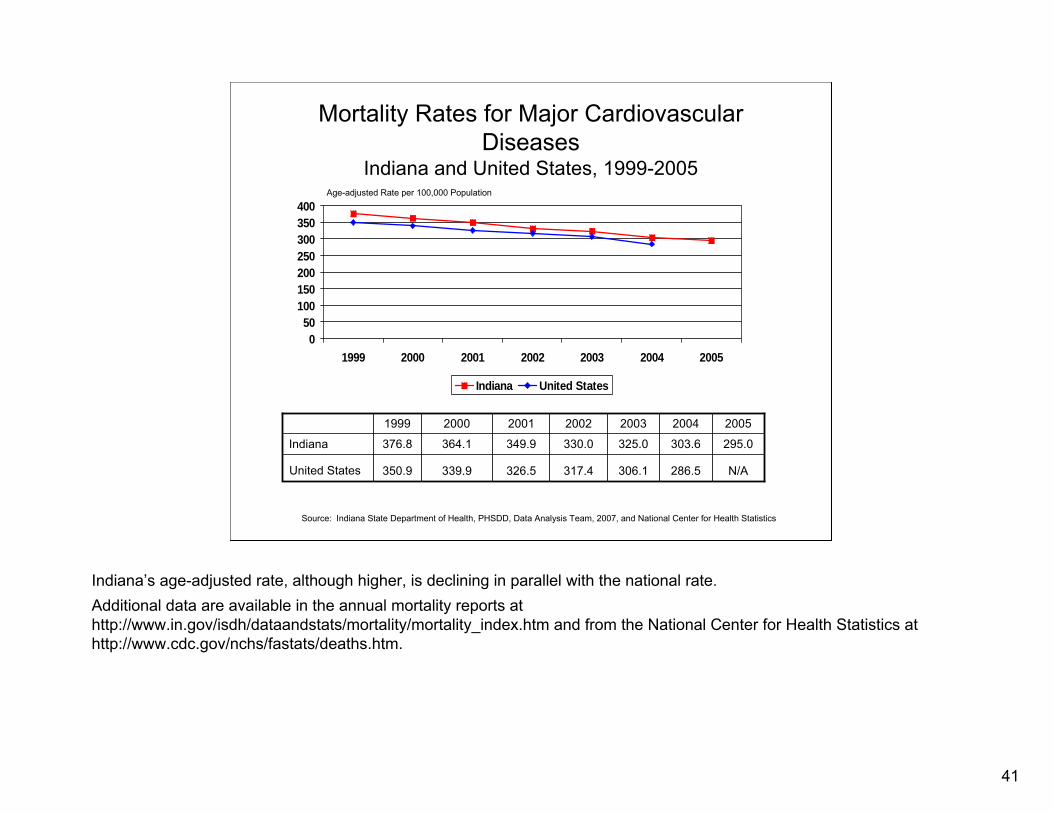
Mortality Rates for Major Cardiovascular Diseases
Indiana and United States, 1999-2005
050
100150200250300350400
1999 2000 2001 2002 2003 2004 2005
Indiana United States
286.5
303.6
2004
306.1
325.0
2003
350.9
376.8
1999
339.9
364.1
2000
326.5
349.9
2001
317.4
330.0
2002
N/A
295.0
2005
United States
Indiana
Source: Indiana State Department of Health, PHSDD, Data Analysis Team, 2007, and National Center for Health Statistics
Age-adjusted Rate per 100,000 Population
Indiana’s age-adjusted rate, although higher, is declining in parallel with the national rate.Additional data are available in the annual mortality reports athttp://www.in.gov/isdh/dataandstats/mortality/mortality_index.htm and from the National Center for Health Statistics at http://www.cdc.gov/nchs/fastats/deaths.htm.

42
Mortality Rates for Heart DiseaseAll Ages by Race
Indiana Residents, 2001-2005
050
100150200250300350
2001 2002 2003 2004 2005
Total White Black
322.4
260.1
261.7
2001
295.6
244.3
246.1
2002
309.4
242.5
245.4
2003
274.3
225.8
227.7
2004
254.5
220.5
222.0
2005
Black
White
Total
Source: Indiana State Department of Health, PHSDD, Data Analysis Team, 2007
Age-adjusted Rate per 100,000 Population
The age-adjusted mortality rate for heart disease for both races has declined during the five-year period. While the rate remains higher among blacks, the gap between the races appears to be closing.Additional data are available in the annual mortality reports athttp://www.in.gov/isdh/dataandstats/mortality/mortality_index.htm. U.S. data are available from the National Center for Health Statistics at http://www.cdc.gov/nchs/fastats/deaths.htm.

43
Mortality Rates for Heart DiseaseAll Ages by Ethnicity
Indiana Residents, 2001-2005
0
50
100
150
200
250
300
2001 2002 2003 2004 2005
Total Non-Hispanic Hispanic
121.6
262.9
261.7
2001
172.7
246.9
246.1
2002
135.8
246.7
245.4
2003
111.0
229.1
227.7
2004
114.7
223.4
222.0
2005
Hispanic
Non-Hispanic
Total
Note: Hispanic ethnicity can be of any race.Source: Indiana State Department of Health, PHSDD, Data Analysis Team, 2007
Age-adjusted Rate per 100,000 Population
While age-adjusted mortality rates for heart disease are substantially lower for the Hispanic population than for the non-Hispanic, both are declining.Additional data are available in the annual mortality reports athttp://www.in.gov/isdh/dataandstats/mortality/mortality_index.htm. U.S. data are available from the National Center for Health Statistics at http://www.cdc.gov/nchs/fastats/deaths.htm.

44
Mortality Rates for Cerebrovascular Diseases (Stroke)Indiana and United States, 1999-2005
0
20
40
60
80
1999 2000 2001 2002 2003 2004 2005
Indiana United States
53.5
57.4
2003
50.0
53.8
2004
61.8
67.8
1999
60.8
70.9
2000
57.9
64.8
2001
56.2
59.4
2002
N/A
50.2
2005
United States
Indiana
Source: Indiana State Department of Health, PHSDD, Data Analysis Team, 2007 and National Center for Health Statistics
Age-adjusted Rate per 100,000 Population
Age-adjusted mortality rates for cerebrovascular disease (stroke) in Indiana appear to be slightly higher than the nation as a whole, but both are declining.Additional data are available in the annual mortality reports athttp://www.in.gov/isdh/dataandstats/mortality/mortality_index.htm and from the National Center for Health Statistics at http://www.cdc.gov/nchs/fastats/deaths.htm.
45
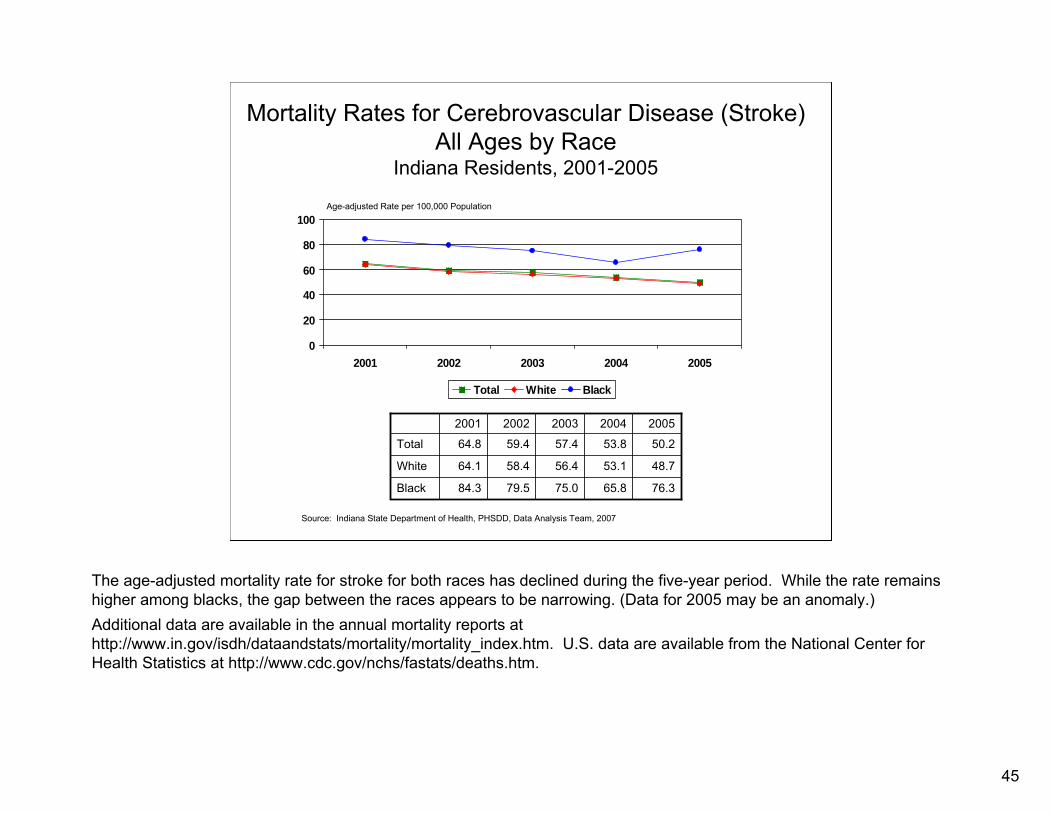
Mortality Rates for Cerebrovascular Disease (Stroke)All Ages by Race
Indiana Residents, 2001-2005
0
20
40
60
80
100
2001 2002 2003 2004 2005
Total White Black
84.3
64.1
64.8
2001
79.5
58.4
59.4
2002
75.0
56.4
57.4
2003
65.8
53.1
53.8
2004
76.3
48.7
50.2
2005
Black
White
Total
Source: Indiana State Department of Health, PHSDD, Data Analysis Team, 2007
Age-adjusted Rate per 100,000 Population
The age-adjusted mortality rate for stroke for both races has declined during the five-year period. While the rate remains higher among blacks, the gap between the races appears to be narrowing. (Data for 2005 may be an anomaly.)Additional data are available in the annual mortality reports athttp://www.in.gov/isdh/dataandstats/mortality/mortality_index.htm. U.S. data are available from the National Center for Health Statistics at http://www.cdc.gov/nchs/fastats/deaths.htm.

46
Mortality Rates for Cerebrovascular Disease (Stroke)All Ages by Ethnicity
Indiana Residents, 2001-2005
0
20
40
60
80
100
2001 2002 2003 2004 2005
Total Non-Hispanic Hispanic
43.6
65.0
64.8
2001
31.9
59.7
59.4
2002
33.4
57.6
57.4
2003
43.1
53.8
53.8
2004
24.6
50.5
50.2
2005
Hispanic
Non-Hispanic
Total
Note: Hispanic ethnicity can be of any race.Source: Indiana State Department of Health, PHSDD, Data Analysis Team, 2007
Age-adjusted Rate per 100,000 Population
While age-adjusted mortality rates for stroke are lower for the Hispanic population than for the non-Hispanic, both appear to be declining.Additional data are available in the annual mortality reports athttp://www.in.gov/isdh/dataandstats/mortality/mortality_index.htm. U.S. data are available from the National Center for Health Statistics at http://www.cdc.gov/nchs/fastats/deaths.htm.
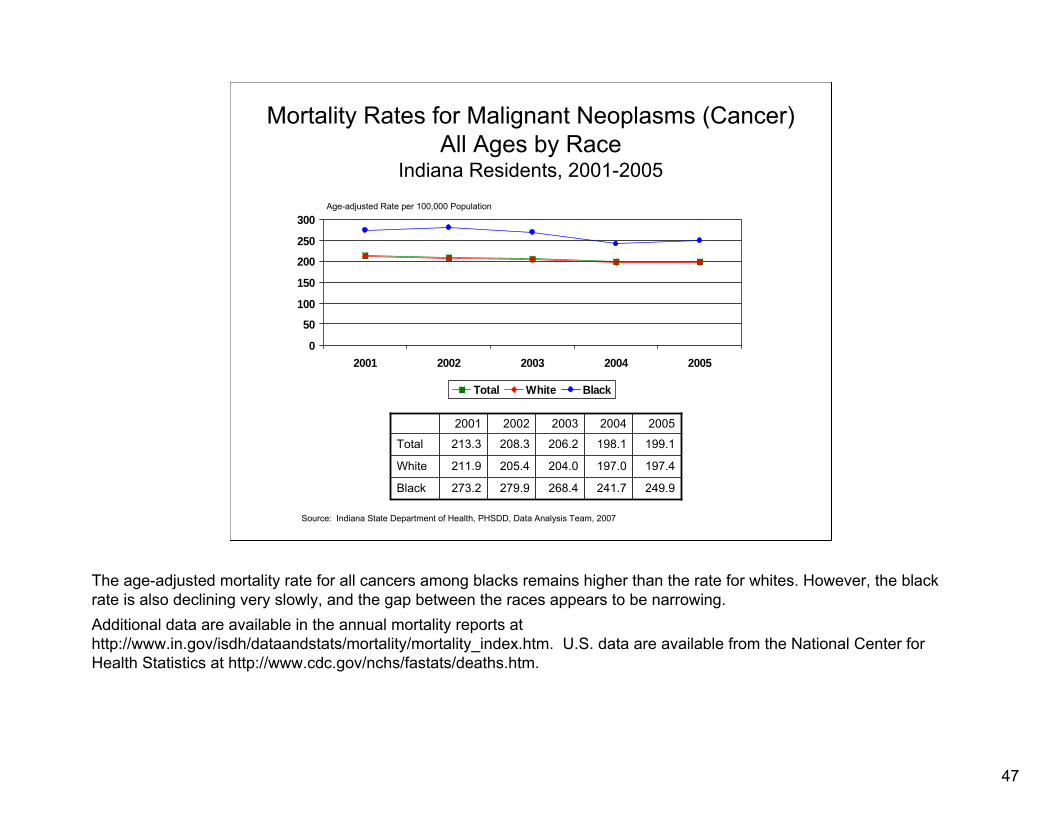
47
Mortality Rates for Malignant Neoplasms (Cancer)All Ages by Race
Indiana Residents, 2001-2005
0
50
100
150
200
250
300
2001 2002 2003 2004 2005
Total White Black
273.2
211.9
213.3
2001
279.9
205.4
208.3
2002
268.4
204.0
206.2
2003
241.7
197.0
198.1
2004
249.9
197.4
199.1
2005
Black
White
Total
Source: Indiana State Department of Health, PHSDD, Data Analysis Team, 2007
Age-adjusted Rate per 100,000 Population
The age-adjusted mortality rate for all cancers among blacks remains higher than the rate for whites. However, the black rate is also declining very slowly, and the gap between the races appears to be narrowing.Additional data are available in the annual mortality reports athttp://www.in.gov/isdh/dataandstats/mortality/mortality_index.htm. U.S. data are available from the National Center for Health Statistics at http://www.cdc.gov/nchs/fastats/deaths.htm.
48
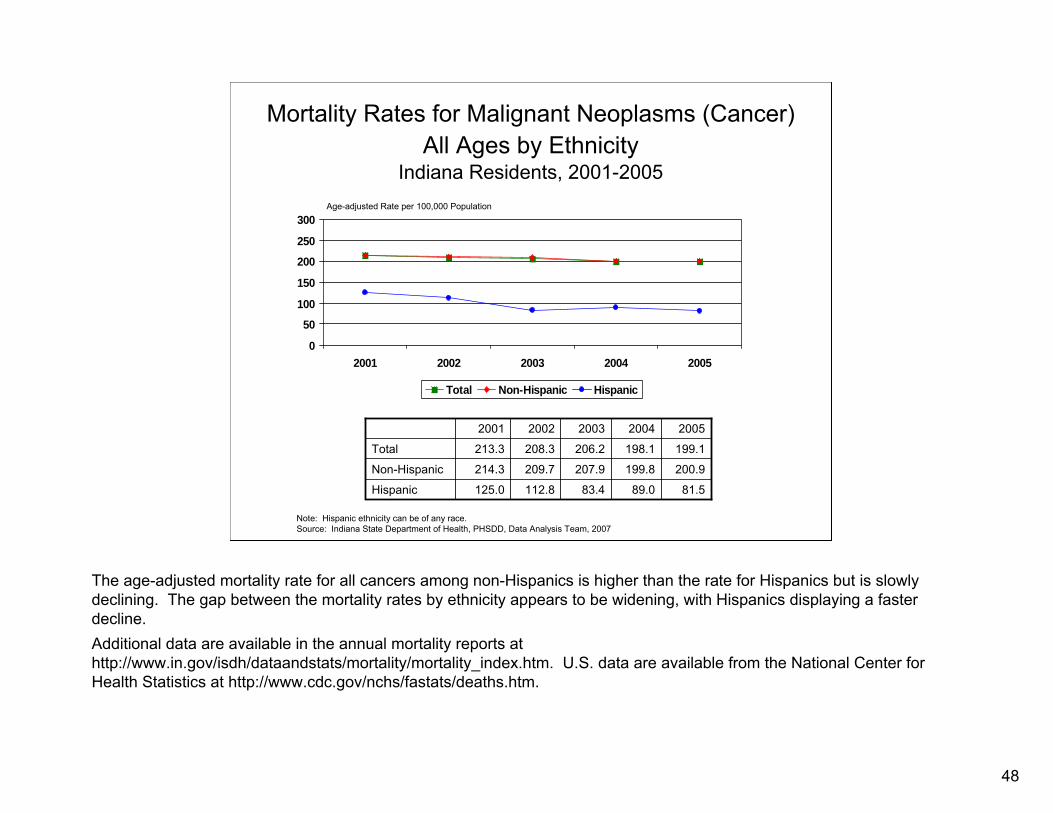
Mortality Rates for Malignant Neoplasms (Cancer)All Ages by Ethnicity
Indiana Residents, 2001-2005
0
50
100
150
200
250
300
2001 2002 2003 2004 2005
Total Non-Hispanic Hispanic
125.0
214.3
213.3
2001
112.8
209.7
208.3
2002
83.4
207.9
206.2
2003
89.0
199.8
198.1
2004
81.5
200.9
199.1
2005
Hispanic
Non-Hispanic
Total
Note: Hispanic ethnicity can be of any race.Source: Indiana State Department of Health, PHSDD, Data Analysis Team, 2007
Age-adjusted Rate per 100,000 Population
The age-adjusted mortality rate for all cancers among non-Hispanics is higher than the rate for Hispanics but is slowly declining. The gap between the mortality rates by ethnicity appears to be widening, with Hispanics displaying a faster decline.Additional data are available in the annual mortality reports athttp://www.in.gov/isdh/dataandstats/mortality/mortality_index.htm. U.S. data are available from the National Center for Health Statistics at http://www.cdc.gov/nchs/fastats/deaths.htm.
49
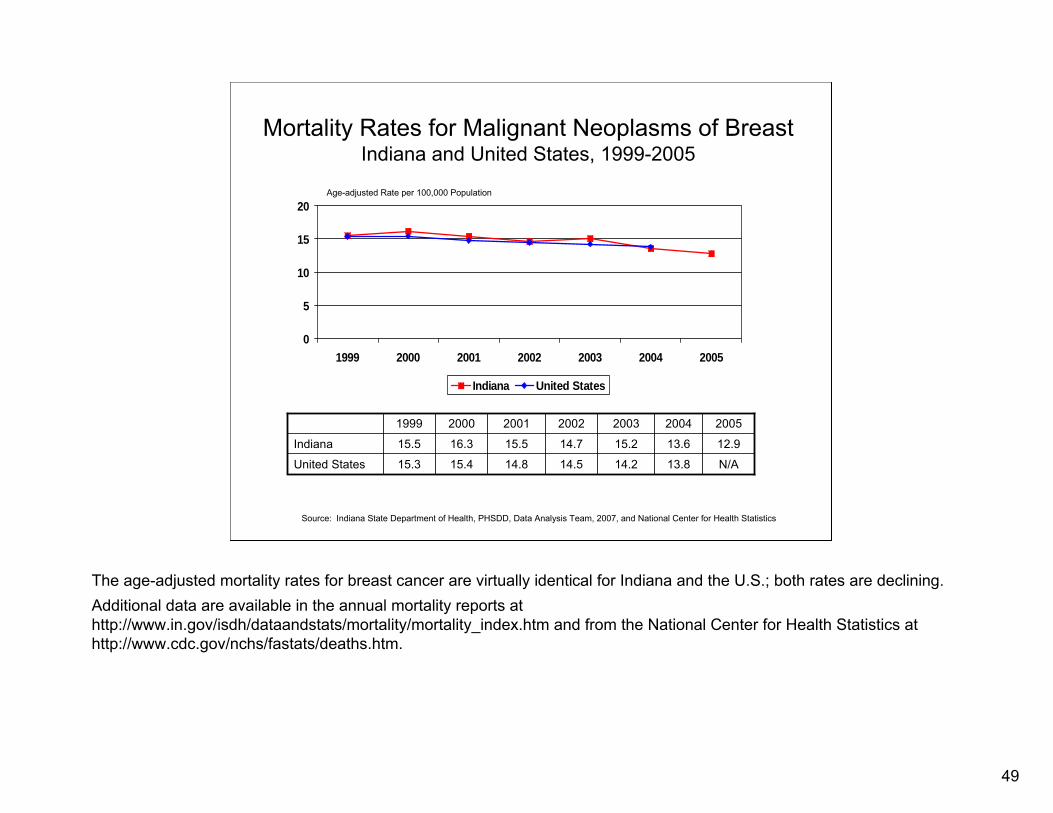
Mortality Rates for Malignant Neoplasms of BreastIndiana and United States, 1999-2005
0
5
10
15
20
1999 2000 2001 2002 2003 2004 2005
Indiana United States
14.2
15.2
2003
13.8
13.6
2004
15.3
15.5
1999
15.4
16.3
2000
14.8
15.5
2001
14.5
14.7
2002
N/A
12.9
2005
United States
Indiana
Source: Indiana State Department of Health, PHSDD, Data Analysis Team, 2007, and National Center for Health Statistics
Age-adjusted Rate per 100,000 Population
The age-adjusted mortality rates for breast cancer are virtually identical for Indiana and the U.S.; both rates are declining.Additional data are available in the annual mortality reports athttp://www.in.gov/isdh/dataandstats/mortality/mortality_index.htm and from the National Center for Health Statistics at http://www.cdc.gov/nchs/fastats/deaths.htm.

50
Mortality Rates for Malignant Neoplasms of Cervix Uteri
Indiana and United States, 1999-2005
0
1
2
3
4
5
1999 2000 2001 2002 2003 2004 2005
Indiana United States
1.3
1.5
2003
1.3
1.4
2004
1.6
1.4
1999
1.5
1.6
2000
1.4
1.3
2001
1.3
1.3
2002
N/A
1.4
2005
United States
Indiana
Source: Indiana State Department of Health, PHSDD, Data Analysis Team, 2007, and National Center for Health Statistics
Age-adjusted Rate per 100,000 Population
The age-adjusted mortality rates for cervical cancer are virtually identical for Indiana and the U.S. Both are relatively low and have remained constant in recent years.Additional data are available in the annual mortality reports athttp://www.in.gov/isdh/dataandstats/mortality/mortality_index.htm and from the National Center for Health Statistics at http://www.cdc.gov/nchs/fastats/deaths.htm.

51
Mortality Rates for Malignant Neoplasms of Colon, Rectum and Anus
Indiana and United States, 1999-2005
0
5
10
15
20
25
1999 2000 2001 2002 2003 2004 2005
Indiana United States
19.1
20.4
2003
18.0
19.9
2004
21.1
23.5
1999
20.9
21.9
2000
20.1
22.6
2001
19.7
21.3
2002
N/A
19.4
2005
United States
Indiana
Source: Indiana State Department of Health, PHSDD, Data Analysis Team, 2007, and National Center for Health Statistics
Age-adjusted Rate per 100,000 Population
While the age-adjusted death rate for colorectal cancer in Indiana appears to be marginally higher than the rate for the U.S., both rates are slowly decreasing.Additional data are available in the annual mortality reports athttp://www.in.gov/isdh/dataandstats/mortality/mortality_index.htm and from the National Center for Health Statistics at http://www.cdc.gov/nchs/fastats/deaths.htm.
52
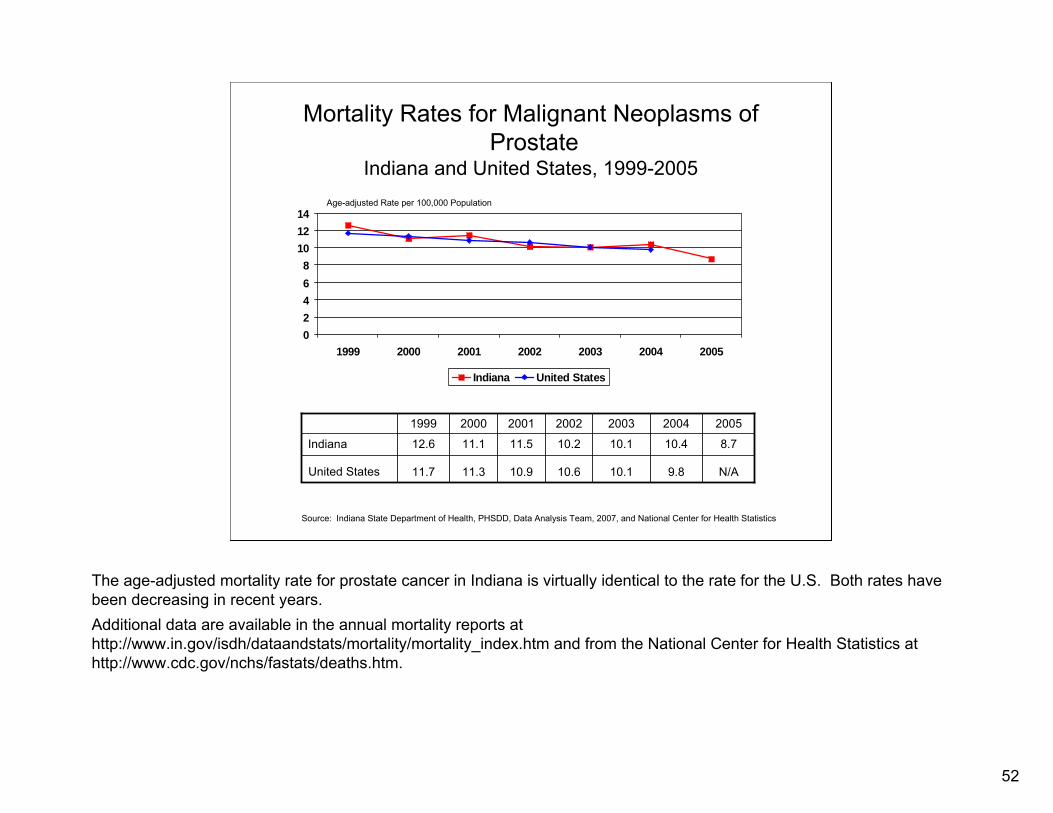
Mortality Rates for Malignant Neoplasms ofProstate
Indiana and United States, 1999-2005
02468
101214
1999 2000 2001 2002 2003 2004 2005
Indiana United States
10.1
10.1
2003
9.8
10.4
2004
11.7
12.6
1999
11.3
11.1
2000
10.9
11.5
2001
10.6
10.2
2002
N/A
8.7
2005
United States
Indiana
Source: Indiana State Department of Health, PHSDD, Data Analysis Team, 2007, and National Center for Health Statistics
Age-adjusted Rate per 100,000 Population
The age-adjusted mortality rate for prostate cancer in Indiana is virtually identical to the rate for the U.S. Both rates have been decreasing in recent years.Additional data are available in the annual mortality reports athttp://www.in.gov/isdh/dataandstats/mortality/mortality_index.htm and from the National Center for Health Statistics at http://www.cdc.gov/nchs/fastats/deaths.htm.
53
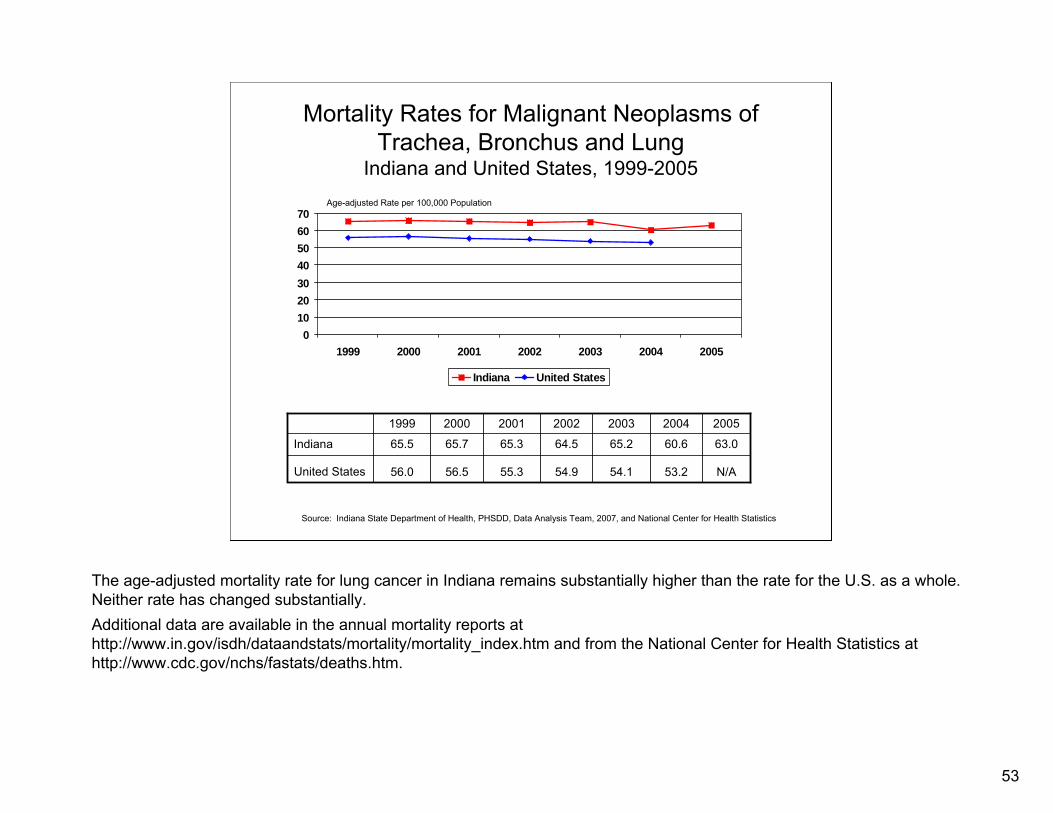
Mortality Rates for Malignant Neoplasms of Trachea, Bronchus and Lung
Indiana and United States, 1999-2005
010203040506070
1999 2000 2001 2002 2003 2004 2005
Indiana United States
54.1
65.2
2003
53.2
60.6
2004
56.0
65.5
1999
56.5
65.7
2000
55.3
65.3
2001
54.9
64.5
2002
N/A
63.0
2005
United States
Indiana
Source: Indiana State Department of Health, PHSDD, Data Analysis Team, 2007, and National Center for Health Statistics
Age-adjusted Rate per 100,000 Population
The age-adjusted mortality rate for lung cancer in Indiana remains substantially higher than the rate for the U.S. as a whole. Neither rate has changed substantially.Additional data are available in the annual mortality reports athttp://www.in.gov/isdh/dataandstats/mortality/mortality_index.htm and from the National Center for Health Statistics at http://www.cdc.gov/nchs/fastats/deaths.htm.
54
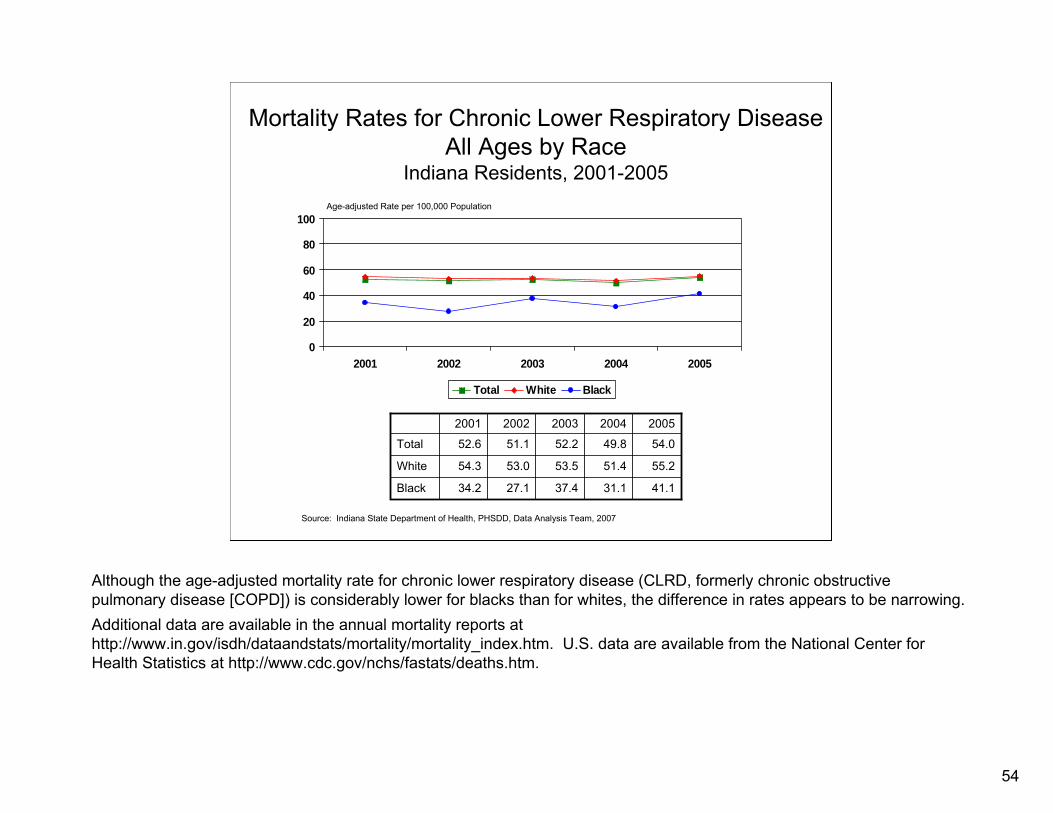
Mortality Rates for Chronic Lower Respiratory DiseaseAll Ages by Race
Indiana Residents, 2001-2005
0
20
40
60
80
100
2001 2002 2003 2004 2005
Total White Black
34.2
54.3
52.6
2001
27.1
53.0
51.1
2002
37.4
53.5
52.2
2003
31.1
51.4
49.8
2004
41.1
55.2
54.0
2005
Black
White
Total
Source: Indiana State Department of Health, PHSDD, Data Analysis Team, 2007
Age-adjusted Rate per 100,000 Population
Although the age-adjusted mortality rate for chronic lower respiratory disease (CLRD, formerly chronic obstructive pulmonary disease [COPD]) is considerably lower for blacks than for whites, the difference in rates appears to be narrowing.Additional data are available in the annual mortality reports athttp://www.in.gov/isdh/dataandstats/mortality/mortality_index.htm. U.S. data are available from the National Center for Health Statistics at http://www.cdc.gov/nchs/fastats/deaths.htm.
55
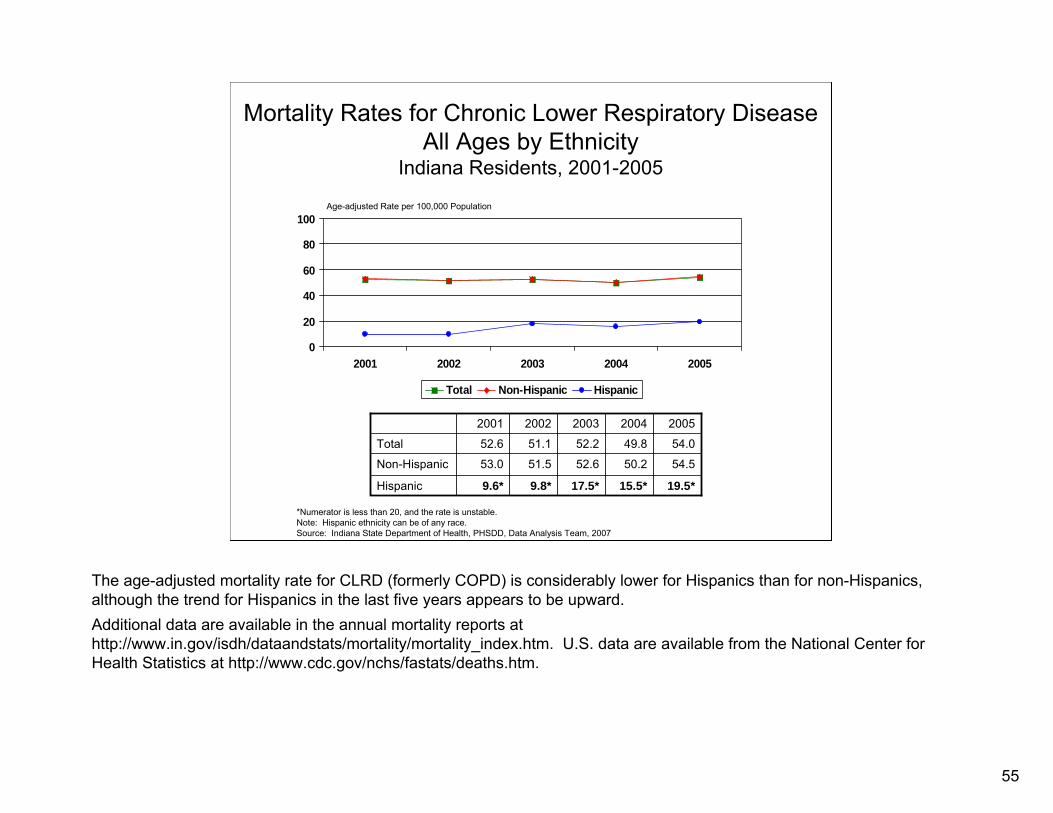
Mortality Rates for Chronic Lower Respiratory DiseaseAll Ages by Ethnicity
Indiana Residents, 2001-2005
0
20
40
60
80
100
2001 2002 2003 2004 2005
Total Non-Hispanic Hispanic
9.6*
53.0
52.6
2001
9.8*
51.5
51.1
2002
17.5*
52.6
52.2
2003
15.5*
50.2
49.8
2004
19.5*
54.5
54.0
2005
Hispanic
Non-Hispanic
Total
*Numerator is less than 20, and the rate is unstable.Note: Hispanic ethnicity can be of any race.Source: Indiana State Department of Health, PHSDD, Data Analysis Team, 2007
Age-adjusted Rate per 100,000 Population
The age-adjusted mortality rate for CLRD (formerly COPD) is considerably lower for Hispanics than for non-Hispanics, although the trend for Hispanics in the last five years appears to be upward.Additional data are available in the annual mortality reports athttp://www.in.gov/isdh/dataandstats/mortality/mortality_index.htm. U.S. data are available from the National Center for Health Statistics at http://www.cdc.gov/nchs/fastats/deaths.htm.
56
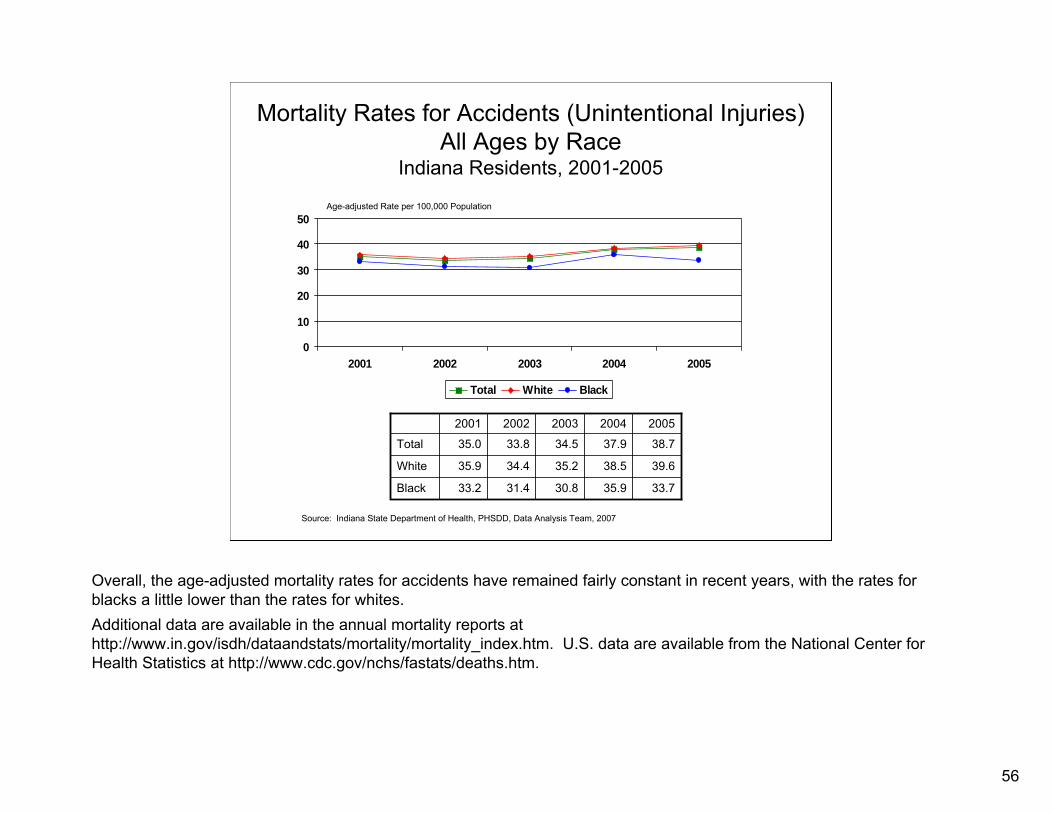
Mortality Rates for Accidents (Unintentional Injuries)All Ages by Race
Indiana Residents, 2001-2005
0
10
20
30
40
50
2001 2002 2003 2004 2005
Total White Black
33.2
35.9
35.0
2001
31.4
34.4
33.8
2002
30.8
35.2
34.5
2003
35.9
38.5
37.9
2004
33.7
39.6
38.7
2005
Black
White
Total
Source: Indiana State Department of Health, PHSDD, Data Analysis Team, 2007
Age-adjusted Rate per 100,000 Population
Overall, the age-adjusted mortality rates for accidents have remained fairly constant in recent years, with the rates for blacks a little lower than the rates for whites.Additional data are available in the annual mortality reports athttp://www.in.gov/isdh/dataandstats/mortality/mortality_index.htm. U.S. data are available from the National Center for Health Statistics at http://www.cdc.gov/nchs/fastats/deaths.htm.
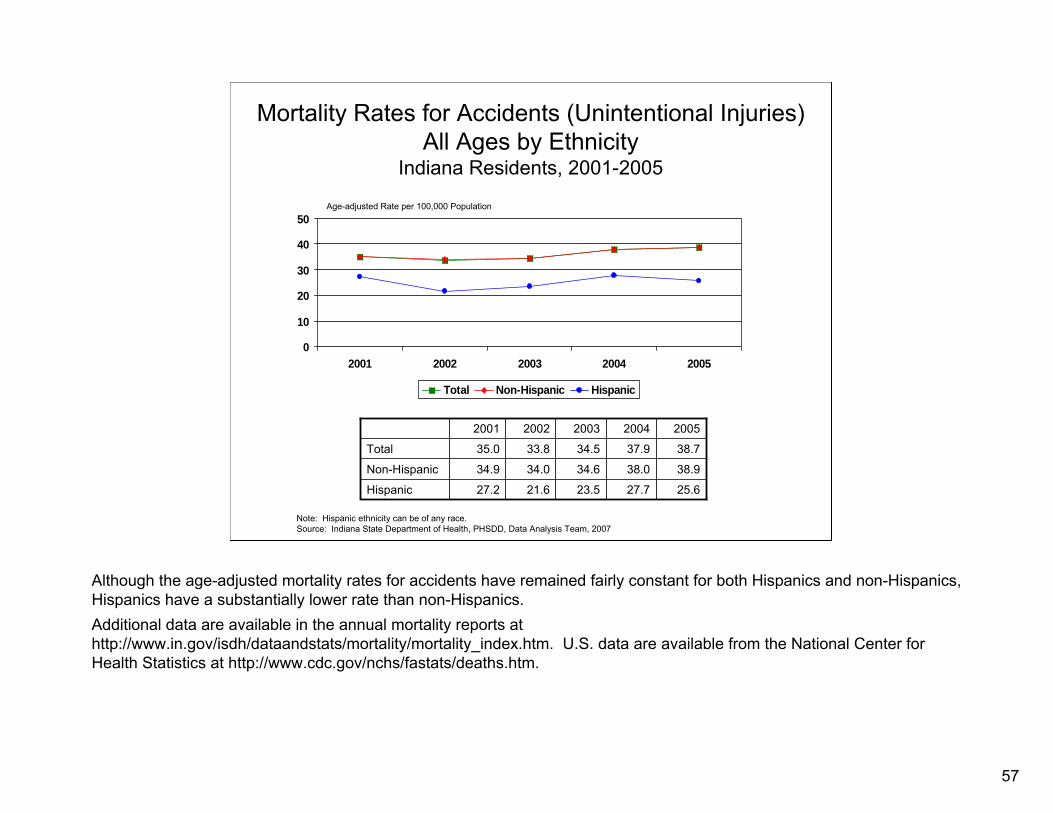
57
Mortality Rates for Accidents (Unintentional Injuries)All Ages by Ethnicity
Indiana Residents, 2001-2005
0
10
20
30
40
50
2001 2002 2003 2004 2005
Total Non-Hispanic Hispanic
27.2
34.9
35.0
2001
21.6
34.0
33.8
2002
23.5
34.6
34.5
2003
27.7
38.0
37.9
2004
25.6
38.9
38.7
2005
Hispanic
Non-Hispanic
Total
Note: Hispanic ethnicity can be of any race.Source: Indiana State Department of Health, PHSDD, Data Analysis Team, 2007
Age-adjusted Rate per 100,000 Population
Although the age-adjusted mortality rates for accidents have remained fairly constant for both Hispanics and non-Hispanics, Hispanics have a substantially lower rate than non-Hispanics.Additional data are available in the annual mortality reports athttp://www.in.gov/isdh/dataandstats/mortality/mortality_index.htm. U.S. data are available from the National Center for Health Statistics at http://www.cdc.gov/nchs/fastats/deaths.htm.

58
IV. Numbers of Other Vital Events
A. MarriagesB. Pregnancy Terminations
59
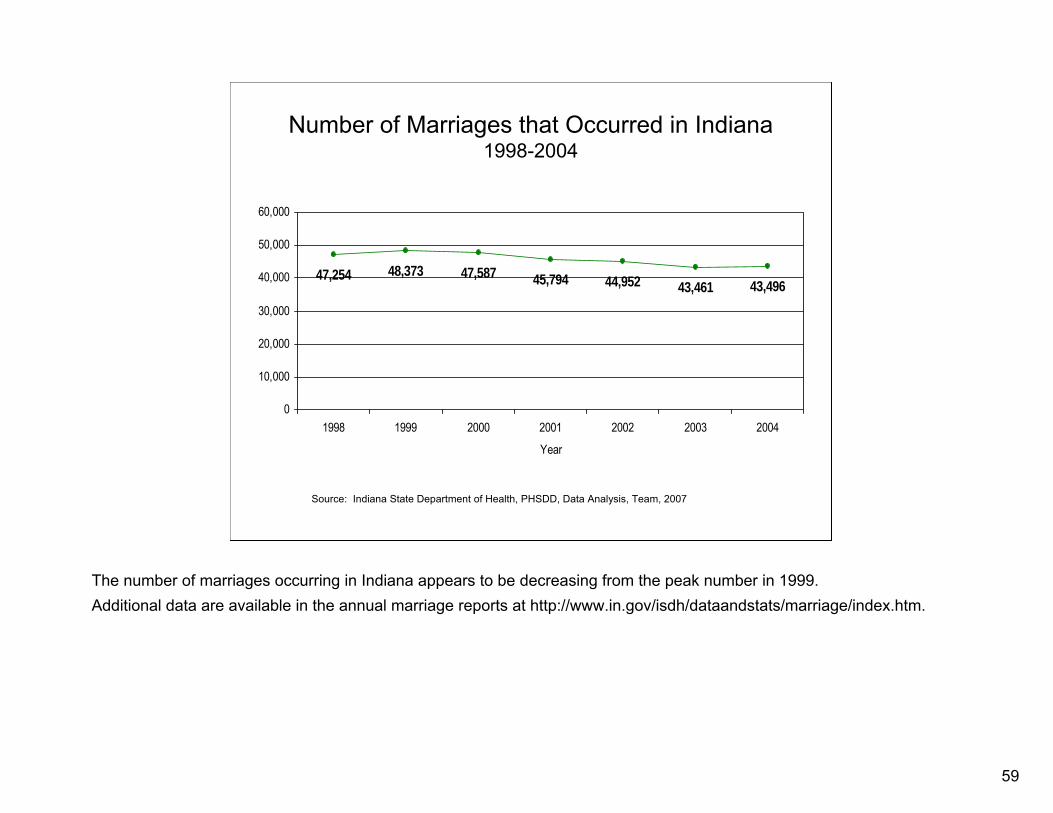
Number of Marriages that Occurred in Indiana1998-2004
47,254 48,373 47,587 45,794 44,952 43,461 43,496
0
10,000
20,000
30,000
40,000
50,000
60,000
1998 1999 2000 2001 2002 2003 2004
Year
Source: Indiana State Department of Health, PHSDD, Data Analysis, Team, 2007
The number of marriages occurring in Indiana appears to be decreasing from the peak number in 1999.Additional data are available in the annual marriage reports at http://www.in.gov/isdh/dataandstats/marriage/index.htm.

60
Number of Induced Terminated PregnanciesIndiana Residents, 1996-2005
12,875 12,66511,983 11,676 11,767 11,369
10,398 10,93610,036 10,224
0
2,000
4,000
6,000
8,000
10,000
12,000
14,000
1996 1997 1998 1999 2000 2001 2002 2003 2004 2005
Year
Source: Indiana State Department of Health, PHSDD, Data Analysis Team, 2007
The number of induced terminated pregnancies has declined steadily during the 10-year period 1996-2005.Additional data are available in the annual terminated pregnancy reports at http://www.in.gov/isdh/dataandstats/itp/index.htm.

61
V. Risk Factors for Disease
A. Chronic Diseases
The following slides present data on some of the known risk factors for a number of chronic diseases affecting Hoosiers: heart disease and stroke, as well as various cancers. Prevalence data for diabetes and asthma are also included. Certain questions on the BRFSS survey are asked only every other year because year-to-year changes are generally small. Adults are defined as non-institutionalized persons, 18 years of age and older.Additional data and detail are available in the annual Indiana and national BRFSS surveys at http://www.in.gov/isdh/dataandstats/brfss/brfss_index.htm and http://www.cdc.gov/brfss/.

62
Percent of Adults Ever Told Blood Pressure HighIndiana and National Median
0
5
10
15
20
25
30
1999 2001 2003 2005
Indiana US Median
23.9
25.7
1999
25.6
25.8
2001
24.8
27.0
2003
25.5
26.2
2005
National Median
Indiana
Source: Behavioral Risk Factor Surveillance System Survey
Percent of Adults
The self-reported prevalence of hypertension in Indiana and the U.S. appears to be very similar (about 25% of adults).Additional data and detail are available in the annual Indiana and national BRFSS surveys at http://www.in.gov/isdh/dataandstats/brfss/brfss_index.htm and http://www.cdc.gov/brfss/.
63
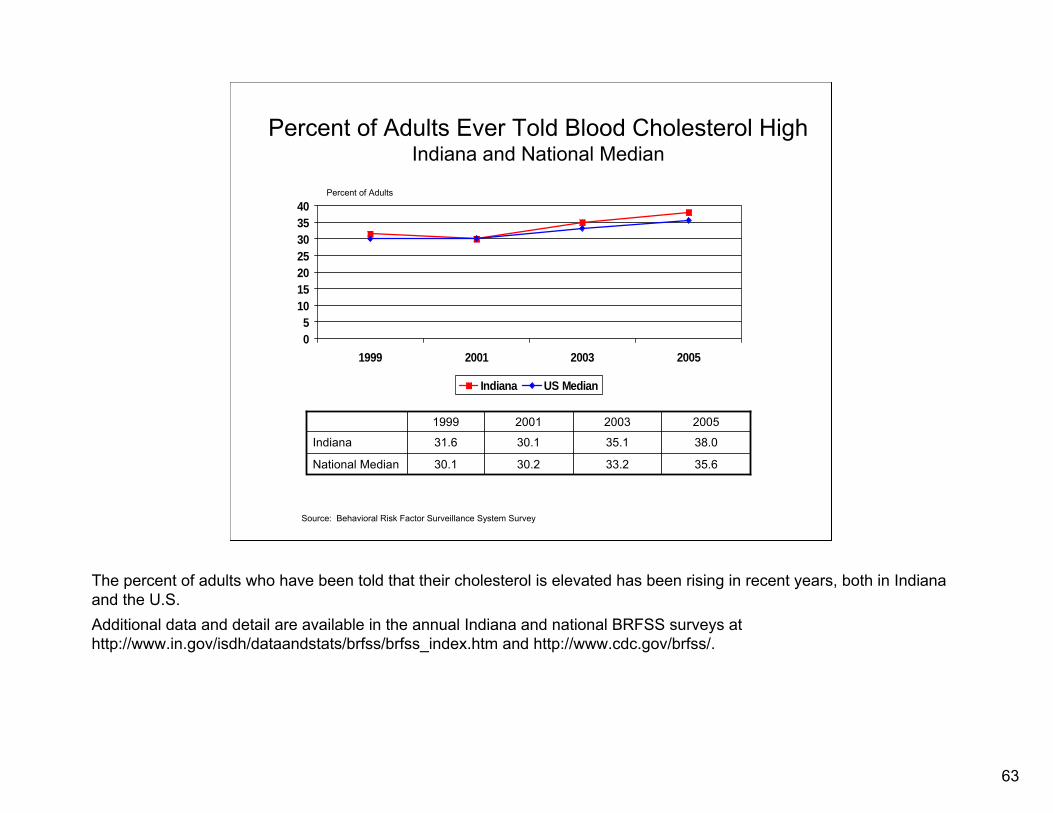
Percent of Adults Ever Told Blood Cholesterol HighIndiana and National Median
05
10152025303540
1999 2001 2003 2005
Indiana US Median
30.1
31.6
1999
30.2
30.1
2001
33.2
35.1
2003
35.6
38.0
2005
National Median
Indiana
Source: Behavioral Risk Factor Surveillance System Survey
Percent of Adults
The percent of adults who have been told that their cholesterol is elevated has been rising in recent years, both in Indiana and the U.S. Additional data and detail are available in the annual Indiana and national BRFSS surveys at http://www.in.gov/isdh/dataandstats/brfss/brfss_index.htm and http://www.cdc.gov/brfss/.
64
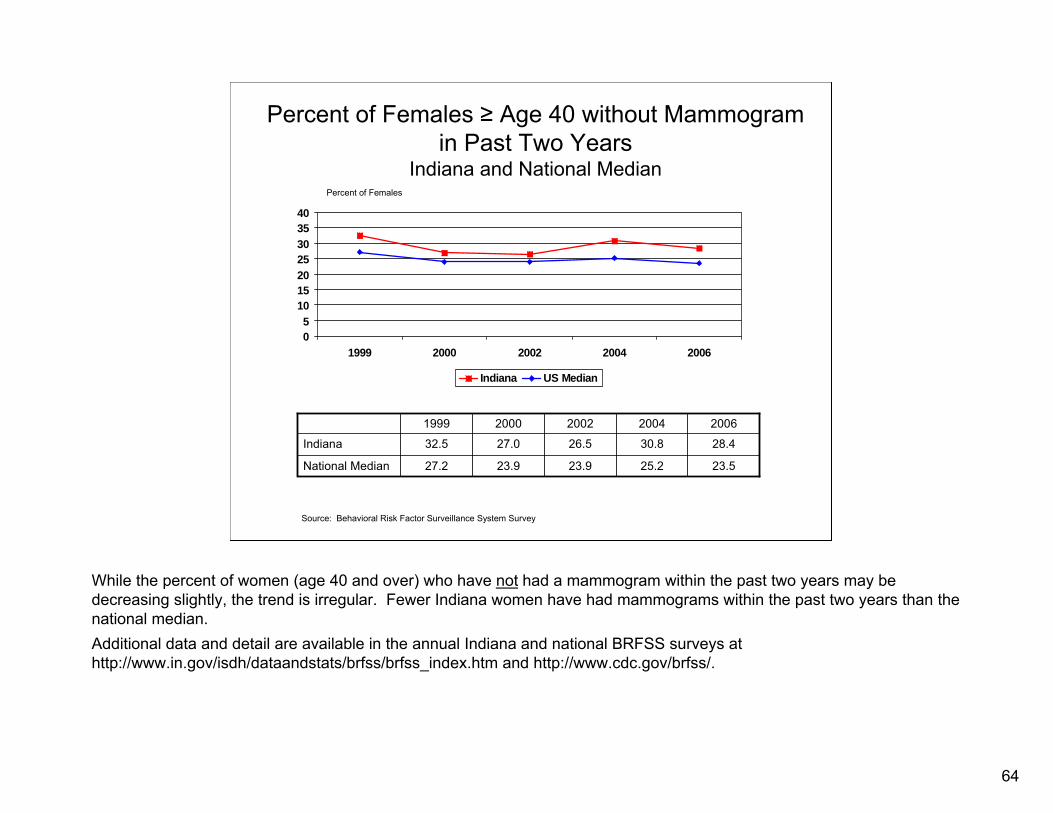
Percent of Females ≥ Age 40 without Mammogram in Past Two Years
Indiana and National Median
05
10152025303540
1999 2000 2002 2004 2006
Indiana US Median
27.2
32.5
1999
23.9
27.0
2000
23.9
26.5
2002
25.2
30.8
2004
23.5
28.4
2006
National Median
Indiana
Source: Behavioral Risk Factor Surveillance System Survey
Percent of Females
While the percent of women (age 40 and over) who have not had a mammogram within the past two years may be decreasing slightly, the trend is irregular. Fewer Indiana women have had mammograms within the past two years than the national median.Additional data and detail are available in the annual Indiana and national BRFSS surveys at http://www.in.gov/isdh/dataandstats/brfss/brfss_index.htm and http://www.cdc.gov/brfss/.

65
Percent of Females ≥ Age 18 with Pap Test Within Past Three YearsIndiana and National Median
0
20
40
60
80
100
1999 2000 2002 2004 2006
Indiana US Median
85.5
82.4
1999
86.8
84.7
2000
87.2
85.2
2002
86.0
82.5
2004
84.0
81.0
2006
National Median
Indiana
Source: Behavioral Risk Factor Surveillance System Survey
Percent of Females
The percent of females (age 18 and over) who have had a Pap test within the past three years does not appear to have changed substantially over this eight-year period in either Indiana or the U.S.Additional data and detail are available in the annual Indiana and national BRFSS surveys at http://www.in.gov/isdh/dataandstats/brfss/brfss_index.htm and http://www.cdc.gov/brfss/.
66
Percent of Adults Age ≥ 50 with Blood Stool Test within Past Two Years
Indiana and National Median
05
10152025303540
1999 2002 2004 2006
Indiana US Median
Source: Behavioral Risk Factor Surveillance System Survey
Percent of Adults
26.5
23.3
2004
26.2
22.4
1999
30.0
26.4
2002
24.2
21.1
2006
National Median
Indiana
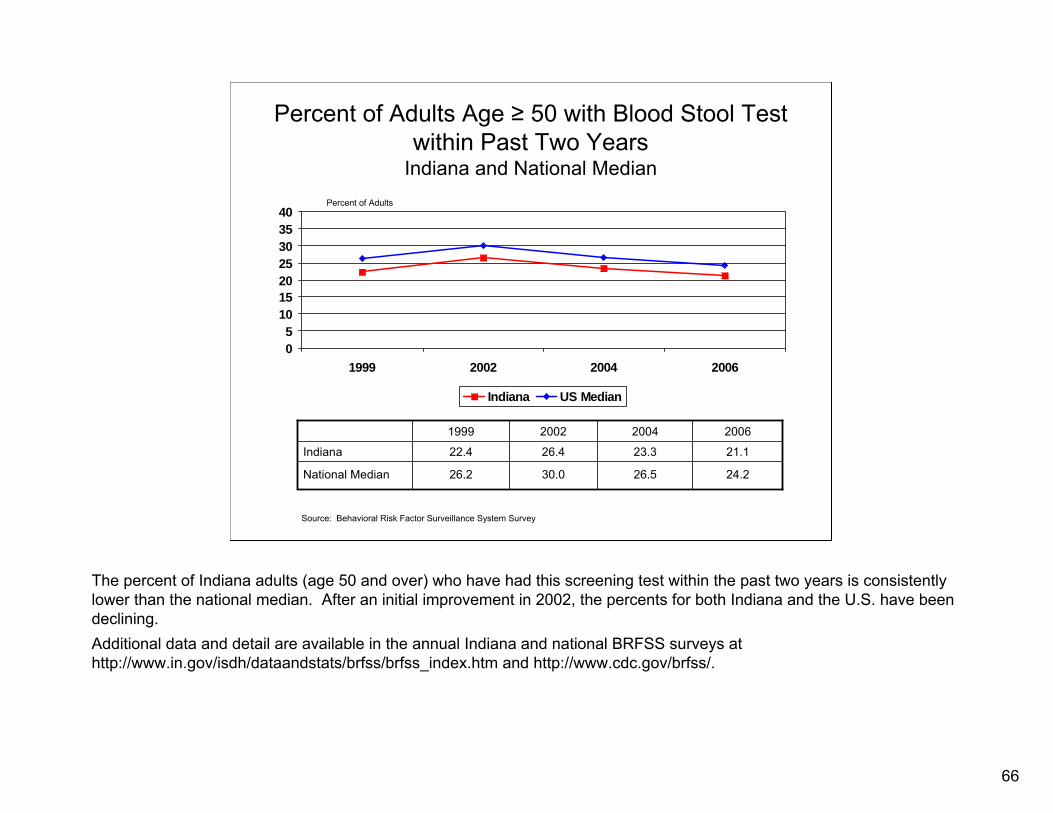
The percent of Indiana adults (age 50 and over) who have had this screening test within the past two years is consistently lower than the national median. After an initial improvement in 2002, the percents for both Indiana and the U.S. have been declining.Additional data and detail are available in the annual Indiana and national BRFSS surveys at http://www.in.gov/isdh/dataandstats/brfss/brfss_index.htm and http://www.cdc.gov/brfss/.

67
Percent of Adults Age ≥ 50 Who Have Ever Had a Sigmoidoscopy or Colonoscopy
Indiana and National Median
0
10
20
30
40
50
60
1999 2002 2004 2006
Indiana US Median
53.5
50.5
2004
43.9
43.4
1999
48.6
44.1
2002
57.1
56.4
2006
National Median
Indiana
Source: Behavioral Risk Factor Surveillance System Survey
Percent of Adults
The trends for both Indiana and the nation are encouraging. The percent of Indiana adults who have had this screening procedure rose from about 43 percent in 1999 to 56 percent in 2006.Additional data and detail are available in the annual Indiana and national BRFSS surveys at http://www.in.gov/isdh/dataandstats/brfss/brfss_index.htm and http://www.cdc.gov/brfss/.

68
Percent of Males Age ≥ 40 with a PSA Test within the Past Two Years
Indiana and National Median
0
10
20
30
40
50
60
2002 2004 2006
Indiana US Median
51.8
48.9
2004
53.8
48.0
2002
53.5
49.6
2006
National Median
Indiana
Source: Behavioral Risk Factor Surveillance System Survey
Percent of Males
The percent of men (age 40 and over) who have had a PSA screening test performed within the past two years has remained constant. Only half the number of men for whom this test is recommended have had it performed, both in Indiana and the nation.Additional data and detail are available in the annual Indiana and national BRFSS surveys at http://www.in.gov/isdh/dataandstats/brfss/brfss_index.htm and http://www.cdc.gov/brfss/.
69
Percent of Adults Ever Diagnosed with DiabetesIndiana and National Median
0
2
4
6
8
10
2000 2001 2002 2003 2004 2005 2006
Indiana US Median
6.1
6.0
2000
7.1
7.8
2003
6.5
7.4
2002
6.5
6.5
2001
7.3
8.3
2005
7.0
7.7
2004
7.5
8.1
2006
National Median
Indiana
Source: Behavioral Risk Factor Surveillance System Survey
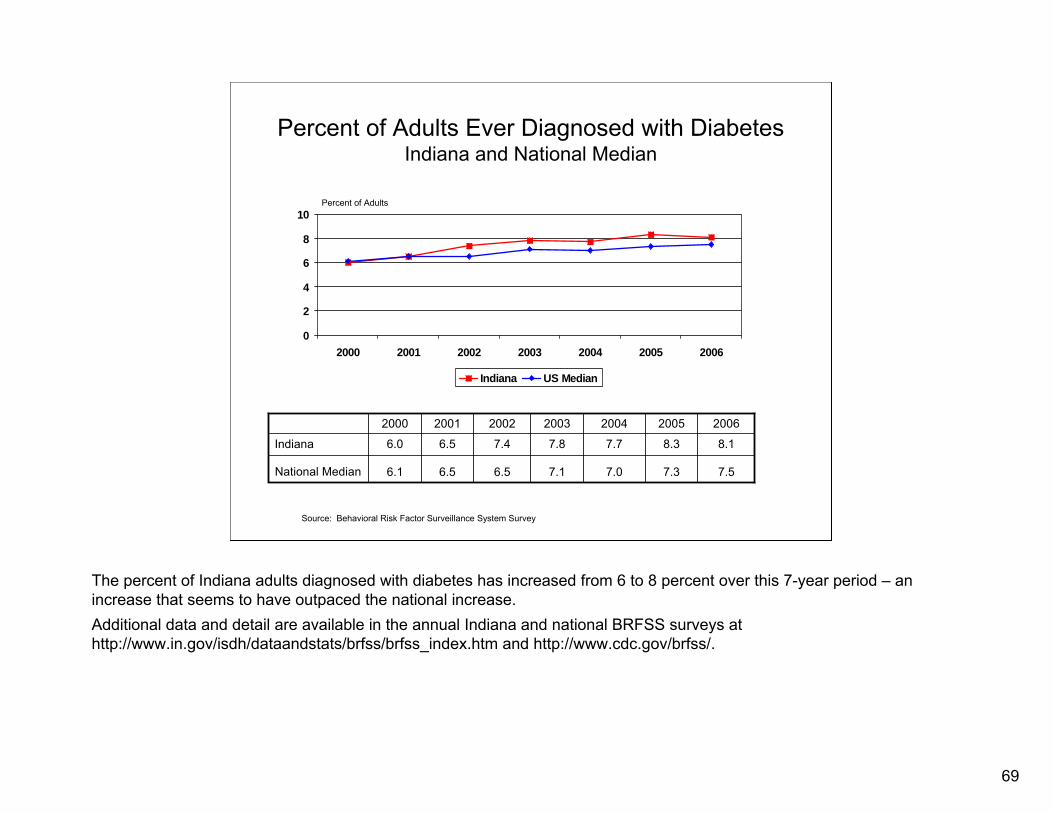
Percent of Adults
The percent of Indiana adults diagnosed with diabetes has increased from 6 to 8 percent over this 7-year period – an increase that seems to have outpaced the national increase.Additional data and detail are available in the annual Indiana and national BRFSS surveys at http://www.in.gov/isdh/dataandstats/brfss/brfss_index.htm and http://www.cdc.gov/brfss/.
70
Percent of Adults with Current AsthmaIndiana and National Median
0
2
4
6
8
10
2000 2001 2002 2003 2004 2005 2006
Indiana US Median
7.3
8.1
2000
7.6
8.1
2003
7.6
7.5
2002
7.3
7.5
2001
8.0
8.2
2005
8.4
8.4
2004
8.5
8.4
2006
National Median
Indiana
Source: Behavioral Risk Factor Surveillance System Survey
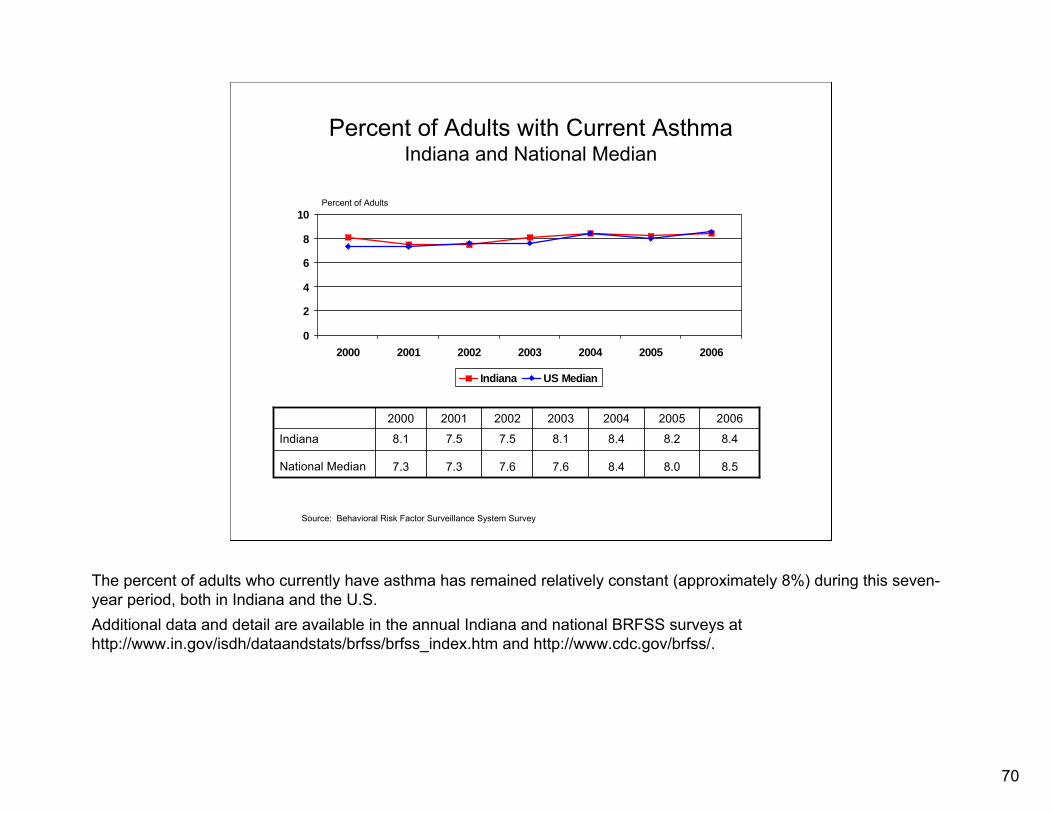
Percent of Adults
The percent of adults who currently have asthma has remained relatively constant (approximately 8%) during this seven-year period, both in Indiana and the U.S.Additional data and detail are available in the annual Indiana and national BRFSS surveys at http://www.in.gov/isdh/dataandstats/brfss/brfss_index.htm and http://www.cdc.gov/brfss/.

71
V. Risk Factors for Disease
B. Communicable Diseases

72
Rates of Total HIV-Positive, Alive, and without AIDSand Total AIDS Cases Alive
Indiana 2002-2006, Point Prevalence
0
20
40
60
80
100
2002 2003 2004 2005 2006
Total HIV+, Alive, & without AIDS Total AIDS Cases Alive
52.58
60.44
2002
58.82
61.56
2003
59.06
59.33
2004
62.12
59.13
2005
74.08
63.46
2006
Total AIDS Cases Alive
Total HIV+, Alive, & without AIDS
Note: Point-prevalence data as of November 30 for each year in 2002-2006. Rates based on year 2000 population of 6,080,485.Source: Indiana State Department of Health, December Epidemiology Newsletters for 2002-2006
Cases per 100,000 Population
The number of cases of HIV+ individuals, alive, and without AIDS has remained relatively constant over the five-year period. The number of individuals living with AIDS (per 100,000 population) has increased.Additional detail is available in the monthly Epidemiology Newsletters at http://www.in.gov/isdh/dataandstats/epidem/epinews_index.htm and the HIV/STD report site at http://www.in.gov/isdh/programs/hivstd/spotlight/spotlight_index_page.htm.
73
Number of Reported Cases of Hepatitis BIndiana, 1996-2005
020406080
100120140160
1996 1997 1998 1999 2000 2001 2002 2003 2004 2005
Indiana
77
2001
92
2000
77
1999
101
1998
148
1996
71
2003
85
2002
89
1997
57
2005
80
2004
Indiana
Source: Indiana State Department of Health, Epidemiology Newsletters and Annual Reports of Infectious Diseases
Number
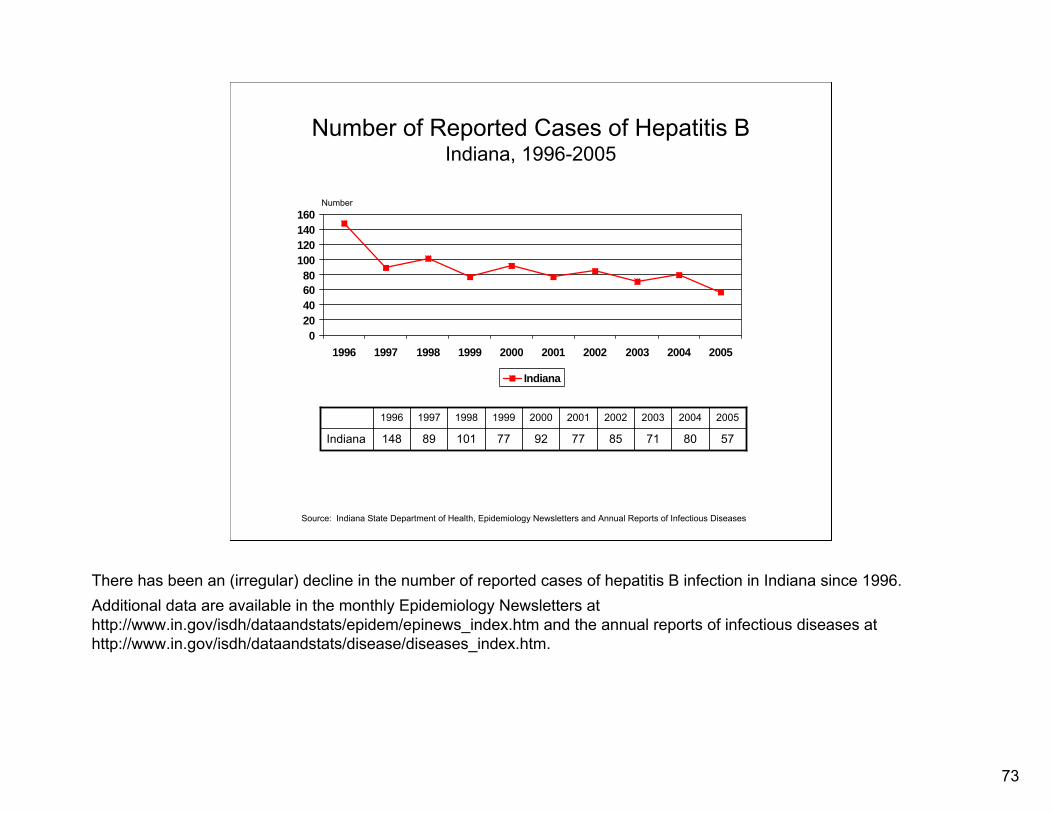
There has been an (irregular) decline in the number of reported cases of hepatitis B infection in Indiana since 1996.Additional data are available in the monthly Epidemiology Newsletters at http://www.in.gov/isdh/dataandstats/epidem/epinews_index.htm and the annual reports of infectious diseases at http://www.in.gov/isdh/dataandstats/disease/diseases_index.htm.
74
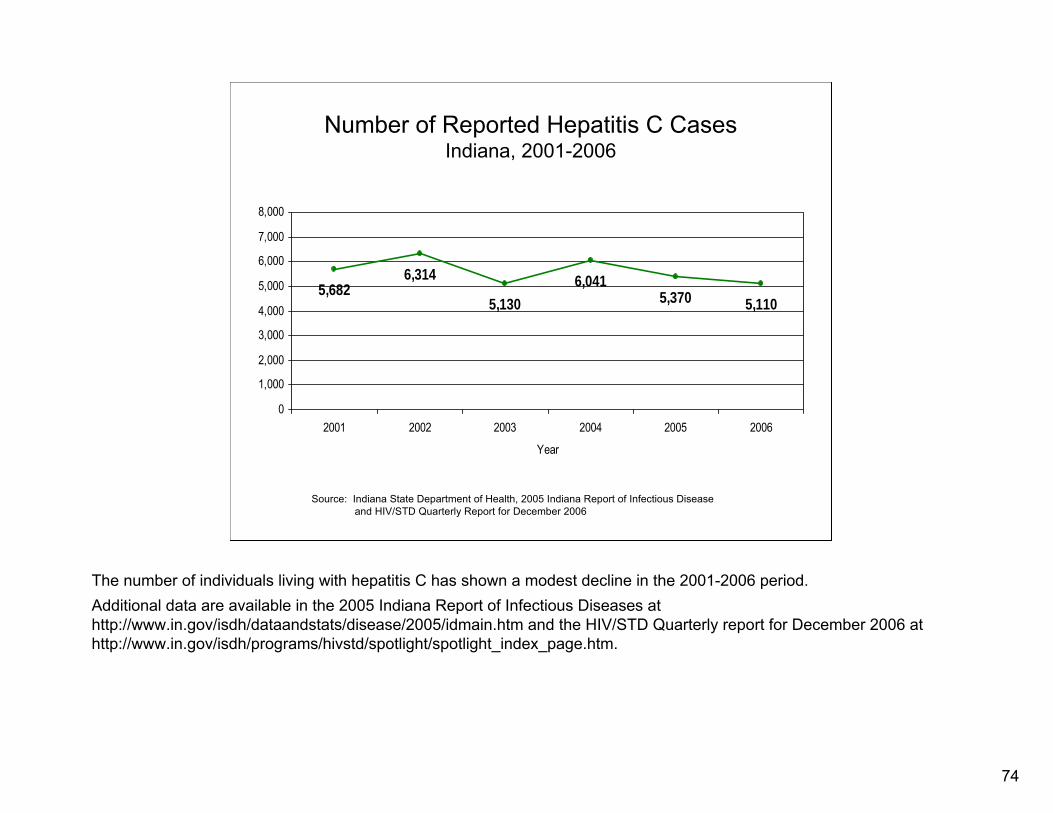
Number of Reported Hepatitis C CasesIndiana, 2001-2006
5,6826,314
5,1306,041
5,370 5,110
0
1,000
2,000
3,000
4,000
5,000
6,000
7,000
8,000
2001 2002 2003 2004 2005 2006
Year
Source: Indiana State Department of Health, 2005 Indiana Report of Infectious Diseaseand HIV/STD Quarterly Report for December 2006
The number of individuals living with hepatitis C has shown a modest decline in the 2001-2006 period.Additional data are available in the 2005 Indiana Report of Infectious Diseases at http://www.in.gov/isdh/dataandstats/disease/2005/idmain.htm and the HIV/STD Quarterly report for December 2006 at http://www.in.gov/isdh/programs/hivstd/spotlight/spotlight_index_page.htm.

75
Chlamydia Rates per 100,000 PopulationIndiana and United States, 2000-2005
050
100150200250300350
2000 2001 2002 2003 2004 2005
Indiana United States
321.6295.6275.6277.6249.0230.8Indiana
274.5
2001
251.4
2000
301.7
2003
289.4
2002
332.5
2005
316.5
2004
United States
Source: Indiana State Department of Health, Epidemiology Resource Center
Rate per 100,000 Population
Chlamydia rates for both Indiana and the U.S. have shown a substantial increase in the 2000-2005 period. According to the Centers for Disease Control and Prevention (CDC), this increase is due, in part, to more and better screening tests.Additional data are available in the monthly Epidemiology Newsletters at http://www.in.gov/isdh/dataandstats/epidem/epinews_index.htm and the annual reports of infectious diseases at http://www.in.gov/isdh/dataandstats/disease/diseases_index.htm. The data above were obtained from CDC’s STD Surveillance Reports available at http://www.cdc.gov/std/.

76
Gonorrhea Rates per 100,000 PopulationIndiana and United States, 2000-2005
020406080
100120140
2000 2001 2002 2003 2004 2005
Indiana United States
129.8109.8107.8120.1113.8107.1Indiana
126.8
2001
128.7
2000
115.2
2003
122.0
2002
115.6
2005
112.4
2004
United States
Source: Indiana State Department of Health, Epidemiology Resource Center
Rate per 100,000 Population
Gonorrhea rates for the U.S. have declined slightly during this six-year period. In Indiana, the rate per 100,000 population has increased, becoming higher than the U.S. rate for the first time in 2005. Additional data are available in the monthly Epidemiology Newsletters at http://www.in.gov/isdh/dataandstats/epidem/epinews_index.htm and the annual reports of infectious diseases at http://www.in.gov/isdh/dataandstats/disease/diseases_index.htm. The data above were obtained from CDC’s STD Surveillance Reports available at http://www.cdc.gov/std/.

77
Primary and Secondary SyphilisRates per 100,000 Population
Indiana and United States, 2000-2005
0
2
4
6
8
2000 2001 2002 2003 2004 2005
Indiana United States
1.01.00.81.02.55.9Indiana
2.1
2001
2.1
2000
2.5
2003
2.4
2002
3.0
2005
2.7
2004
United States
Source: Indiana State Department of Health, Epidemiology Resource Center
Rate per 100,000 Population
The rate of primary and secondary syphilis infection in Indiana has dropped substantially since 2000, with the Indiana rate becoming much lower than the U.S. rate (which is rising) since 2002.Additional data are available in the monthly Epidemiology Newsletters at http://www.in.gov/isdh/dataandstats/epidem/epinews_index.htm and the annual reports of infectious diseases at http://www.in.gov/isdh/dataandstats/disease/diseases_index.htm. The data above were obtained from CDC’s STD Surveillance Reports available at http://www.cdc.gov/std/.
78
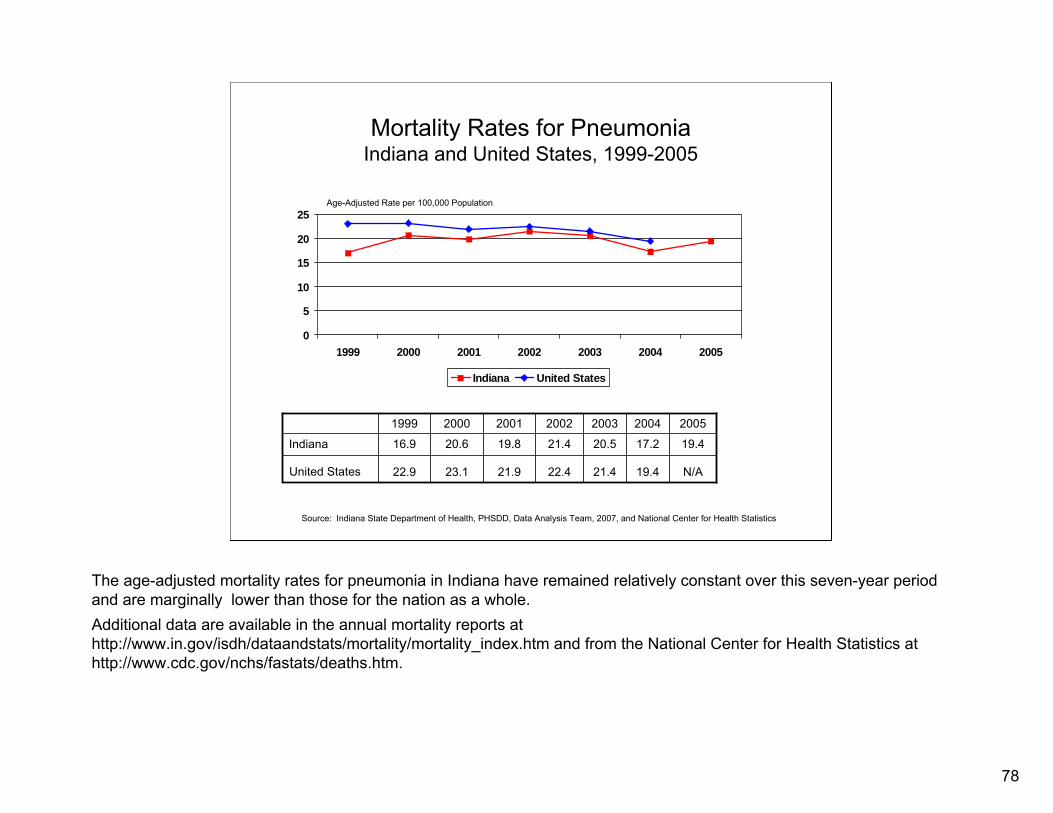
Mortality Rates for PneumoniaIndiana and United States, 1999-2005
0
5
10
15
20
25
1999 2000 2001 2002 2003 2004 2005
Indiana United States
21.4
20.5
2003
19.4
17.2
2004
22.9
16.9
1999
23.1
20.6
2000
21.9
19.8
2001
22.4
21.4
2002
N/A
19.4
2005
United States
Indiana
Source: Indiana State Department of Health, PHSDD, Data Analysis Team, 2007, and National Center for Health Statistics
Age-Adjusted Rate per 100,000 Population
The age-adjusted mortality rates for pneumonia in Indiana have remained relatively constant over this seven-year period and are marginally lower than those for the nation as a whole.Additional data are available in the annual mortality reports athttp://www.in.gov/isdh/dataandstats/mortality/mortality_index.htm and from the National Center for Health Statistics at http://www.cdc.gov/nchs/fastats/deaths.htm.
79
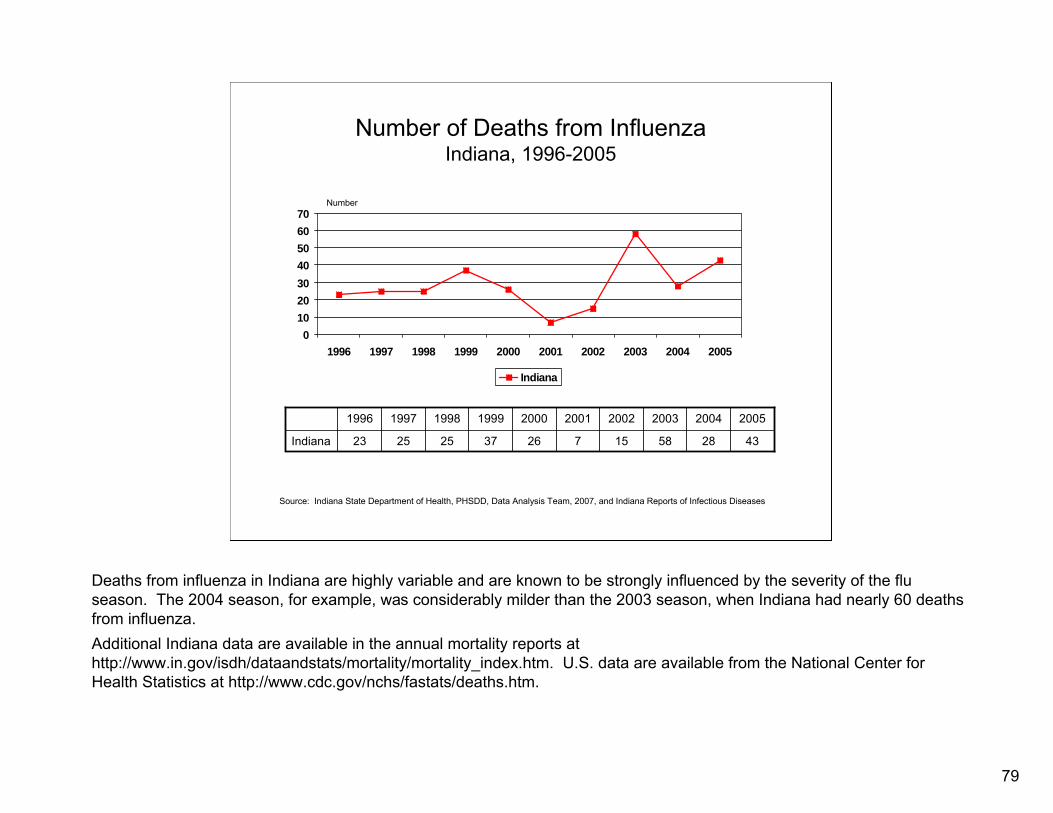
Number of Deaths from InfluenzaIndiana, 1996-2005
010203040506070
1996 1997 1998 1999 2000 2001 2002 2003 2004 2005
Indiana
25
1998
25
1997
23
1996
58
2003
28
2004
37
1999
26
2000
7
2001
15
2002
43
2005
Indiana
Source: Indiana State Department of Health, PHSDD, Data Analysis Team, 2007, and Indiana Reports of Infectious Diseases
Number
Deaths from influenza in Indiana are highly variable and are known to be strongly influenced by the severity of the flu season. The 2004 season, for example, was considerably milder than the 2003 season, when Indiana had nearly 60 deaths from influenza.Additional Indiana data are available in the annual mortality reports at http://www.in.gov/isdh/dataandstats/mortality/mortality_index.htm. U.S. data are available from the National Center for Health Statistics at http://www.cdc.gov/nchs/fastats/deaths.htm.

80
Number of Reported Cases of E. coli O157:H7 Infection
Indiana, 1996-2005
020406080
100120140
1996 1997 1998 1999 2000 2001 2002 2003 2004 2005
Indiana
91
1998
75
1997
83
1996
91
2003
58
2004
107
1999
131
2000
90
2001
87
2002
77
2005
Indiana
Source: Indiana State Department of Health, Indiana Reports of Infectious Diseases
Number
The number of reported cases of infection with this especially troublesome strain of E. coli has varied widely in this 10-year period. More recent cases have been linked to the consumption of contaminated spinach and lettuce. Additional data are available in the monthly Epidemiology Newsletters at http://www.in.gov/isdh/dataandstats/epidem/epinews_index.htm and the annual reports of infectious diseases at http://www.in.gov/isdh/dataandstats/disease/diseases_index.htm.

81
Number of Reported Cases of, and Deaths from, Tuberculosis
Indiana, 1996-2005
0
40
80
120
160
200
1996 1997 1998 1999 2000 2001 2002 2003 2004 2005
Cases Deaths
19
128
2002
13
115
2001
15
145
2000
18
143
2003
9
128
2004
24
202
1996
17
168
1997
23
188
1998
13
150
1999
12
146
2005
Deaths
Cases
Source: Indiana State Department of Health, PHSDD, Data Analysis Team, 2007, and the ISDH Reports of Infectious Diseases.
Number
The number of reported cases of tuberculosis in Indiana has leveled off in recent years from the 1996 peak of 202. Deaths from tuberculosis have been declining from the 1996 peak of 24.Additional data are available in the monthly Epidemiology Newsletters at http://www.in.gov/isdh/dataandstats/epidem/epinews_index.htm, the annual reports of infectious diseases at http://www.in.gov/isdh/dataandstats/disease/diseases_index.htm, and the mortality reports at http://www.in.gov/isdh/dataandstats/mortality/mortality_index.htm.

82
Number of Cases of Illness due to Three Enteric Pathogens
Indiana Residents, 1997-2006
0
200
400
600
800
1000
1997 1998 1999 2000 2001 2002 2003 2004 2005 2006
Campylobacter E. coli 0157:H7 Salmonella
549
90
505
2001
678
131
591
2000
572
107
512
1999
677
91
605
1998
586
76
571
1997
899686527587599Salmonella
9577589187E. coli 0157:H7
578473445555511Campylobacter
20062005200420032002
Source: Indiana State Department of Health, Enteric Epidemiology Files
Approximately half the cases of transmissible enteric illnesses are due to the norovirus (calicivirus) group of agents and are not reportable because the viruses are considered endemic. The other half are due to infection primarily with Campylobacter, E. coli, and Salmonella. Of these three, the number of cases of illness due to Salmonella strains has shown a substantial increase in 2005 and 2006.Additional data are available in the monthly Epidemiology Newsletters at http://www.in.gov/isdh/dataandstats/epidem/epinews_index.htm, the annual reports of infectious diseases at http://www.in.gov/isdh/dataandstats/disease/diseases_index.htm, and Enteric Epidemiology.
83
VI. Health Behaviors and Preventive Measures
The following slides present data on some behaviors and preventive measures known to have an impact on one’s health. Certain questions on the BRFSS survey are asked only every other year because year-to-year changes are generally small. Adults are defined as non-institutionalized persons, 18 years of age and older.

84
Percent of Adults Who Are Current SmokersIndiana and National Median
0
6
12
18
24
30
2000 2001 2002 2003 2004 2005 2006
Indiana US Median
23.2
26.9
2000
22.0
26.1
2003
23.2
27.6
2002
23.2
27.4
2001
20.6
27.3
2005
20.9
24.9
2004
20.0
24.1
2006
National Median
Indiana
Source: Behavioral Risk Factor Surveillance System Survey
Percent of Adults
Although the percent of Indiana adults who are current smokers (24.1% in 2006) has declined in recent years, Indiana remains above the national median by about 4 percent.Additional data and detail are presented in the annual Indiana and national BRFSS surveys http://www.in.gov/isdh/dataandstats/brfss/brfss_index.htm and http://www.cdc.gov/brfss/.
85
Percent of Births to Mothers Who Smoked During PregnancyIndiana and United States, 1999-2005
0
5
10
15
20
25
1999 2000 2001 2002 2003 2004 2005
Indiana United States
12.6
20.9
1999
11.4
19.1
2002
12.0
20.2
2001
12.2
20.2
2000
10.2
18.0
2004
10.7
18.5
2003
N/A
17.9
2005
United States
Indiana
Percent of Mothers
Source: Indiana State Department of Health, PHSDD, Data Analysis Team, 2007
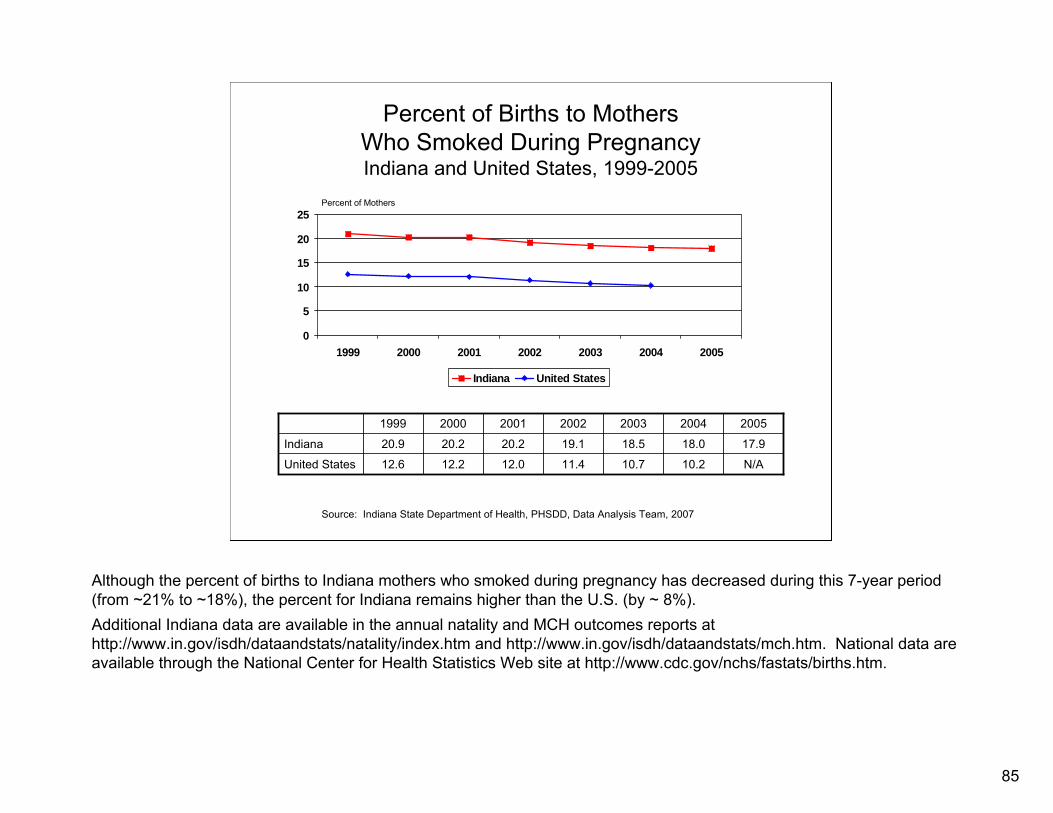
Although the percent of births to Indiana mothers who smoked during pregnancy has decreased during this 7-year period (from ~21% to ~18%), the percent for Indiana remains higher than the U.S. (by ~ 8%).Additional Indiana data are available in the annual natality and MCH outcomes reports at http://www.in.gov/isdh/dataandstats/natality/index.htm and http://www.in.gov/isdh/dataandstats/mch.htm. National data are available through the National Center for Health Statistics Web site at http://www.cdc.gov/nchs/fastats/births.htm.

86
Percent of Births to MothersWho Smoked During Pregnancy by Race
Indiana Residents, 1996-2005
05
101520253035
1996 1997 1998 1999 2000 2001 2002 2003 2004 2005
Total White Black
16.5
21.9
21.1
1996
14.3
22.3
21.3
1997
16.3
22.1
21.3
1998
15.8
21.8
20.9
1999
15.2
21.1
20.2
2000
14.014.415.215.215.6Black
18.718.819.119.921.0White
17.918.018.519.120.2Total
20052004200320022001
Source: Indiana State Department of Health, PHSDD, Data Analysis Team, 2007
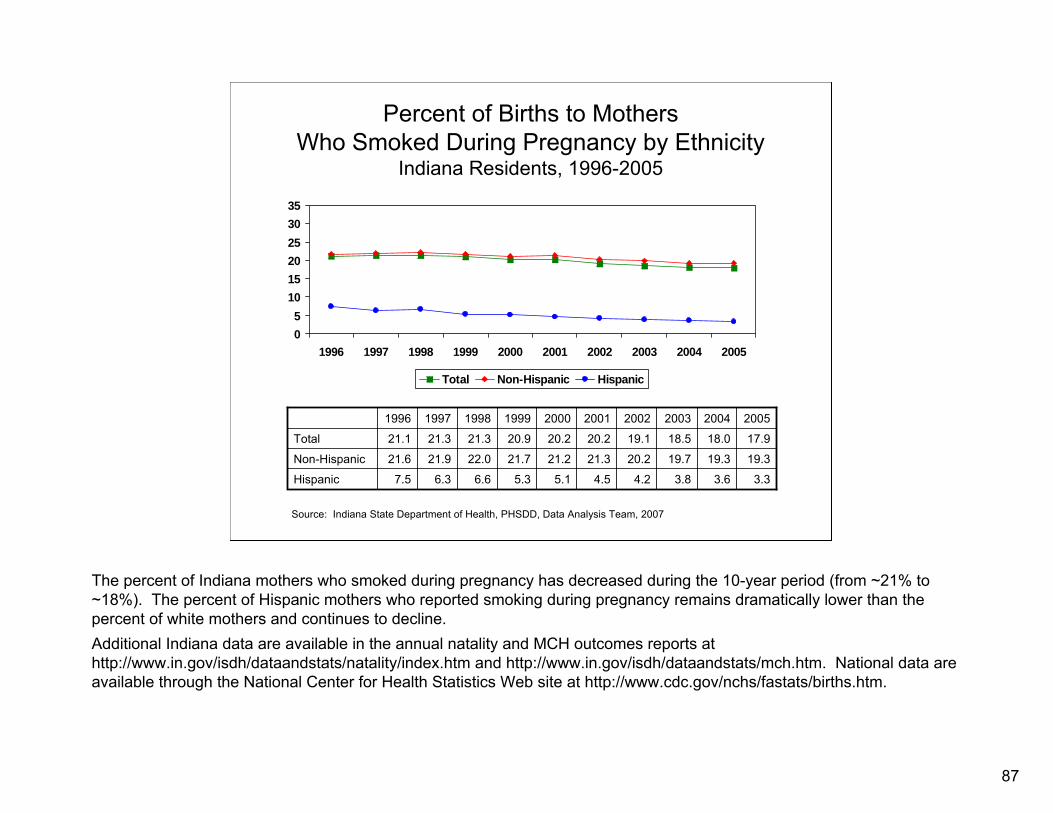
The percent of Indiana mothers who smoked during pregnancy has decreased over the 10-year period (from ~21% to ~18%). While the percent of black mothers who reported smoking during pregnancy has remained lower than the percent of white mothers, the difference between the two may be narrowing.Additional Indiana data are available in the annual natality and MCH outcomes reports at http://www.in.gov/isdh/dataandstats/natality/index.htm and http://www.in.gov/isdh/dataandstats/mch.htm. National data are available through the National Center for Health Statistics Web site at http://www.cdc.gov/nchs/fastats/births.htm.
87
Percent of Births to MothersWho Smoked During Pregnancy by Ethnicity
Indiana Residents, 1996-2005
05
101520253035
1996 1997 1998 1999 2000 2001 2002 2003 2004 2005
Total Non-Hispanic Hispanic
7.5
21.6
21.1
1996
6.3
21.9
21.3
1997
6.6
22.0
21.3
1998
5.3
21.7
20.9
1999
5.1
21.2
20.2
2000
3.33.63.84.24.5Hispanic
19.319.319.720.221.3Non-Hispanic
17.918.018.519.120.2Total
20052004200320022001
Source: Indiana State Department of Health, PHSDD, Data Analysis Team, 2007
The percent of Indiana mothers who smoked during pregnancy has decreased during the 10-year period (from ~21% to ~18%). The percent of Hispanic mothers who reported smoking during pregnancy remains dramatically lower than the percent of white mothers and continues to decline.Additional Indiana data are available in the annual natality and MCH outcomes reports at http://www.in.gov/isdh/dataandstats/natality/index.htm and http://www.in.gov/isdh/dataandstats/mch.htm. National data are available through the National Center for Health Statistics Web site at http://www.cdc.gov/nchs/fastats/births.htm.
88
Percent of Adults Reporting No Leisure Time Physical Activity in Past Month
Indiana and National Median, 2000-2006
0
5
10
15
20
25
30
2000 2001 2002 2003 2004 2005 2006
Indiana National Median
26.7
25.4
2000
22.7
26.2
2003
24.1
27.5
2002
25.4
26.2
2001
23.8
26.9
2005
22.5
25.3
2004
22.6
25.3
2006
National Median
Indiana
Source: Behavioral Risk Factor Surveillance System Survey
Percent of Adults
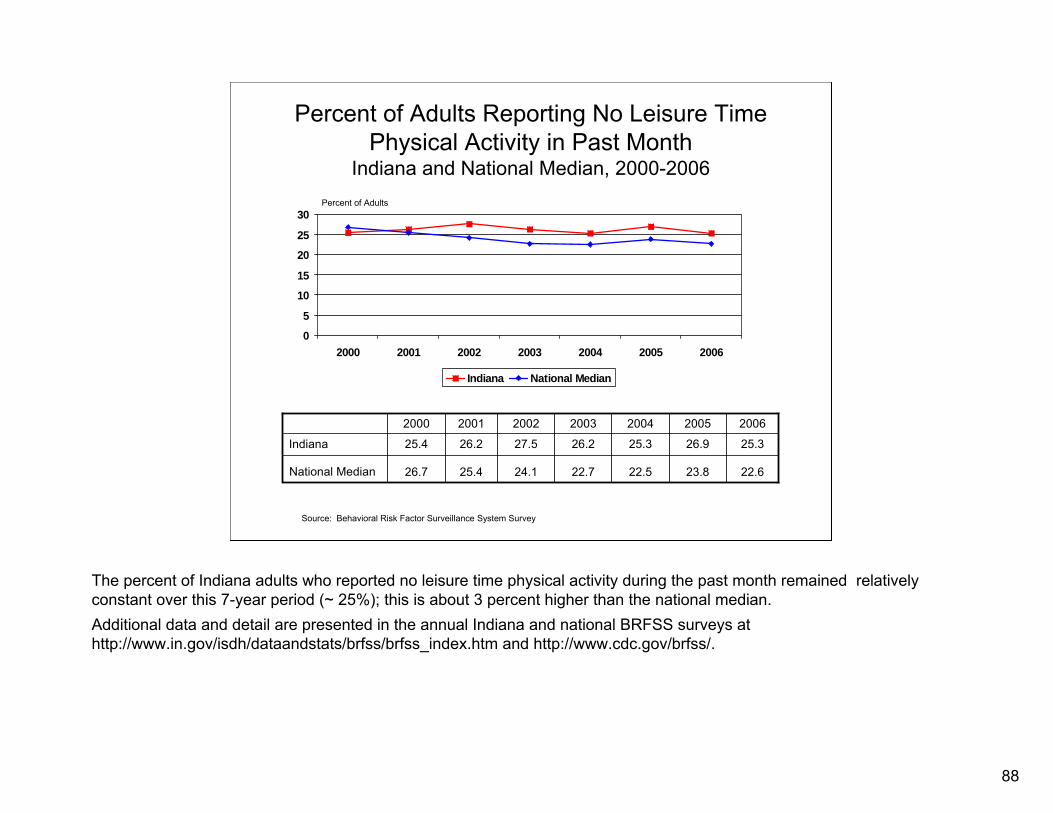
The percent of Indiana adults who reported no leisure time physical activity during the past month remained relatively constant over this 7-year period (~ 25%); this is about 3 percent higher than the national median.Additional data and detail are presented in the annual Indiana and national BRFSS surveys at http://www.in.gov/isdh/dataandstats/brfss/brfss_index.htm and http://www.cdc.gov/brfss/.
89
Percent of Adults Classified as Obese Based on Body Mass Index
Indiana and National Median, 2000-2006
0
5
10
15
20
25
30
2000 2001 2002 2003 2004 2005 2006
Indiana National Median
20.0
21.8
2000
22.9
26.0
2003
21.9
24.1
2002
20.9
24.5
2001
24.4
27.2
2005
23.2
25.5
2004
25.1
27.8
2006
National Median
Indiana
Source: Behavioral Risk Factor Surveillance System Survey
Percent of Adults
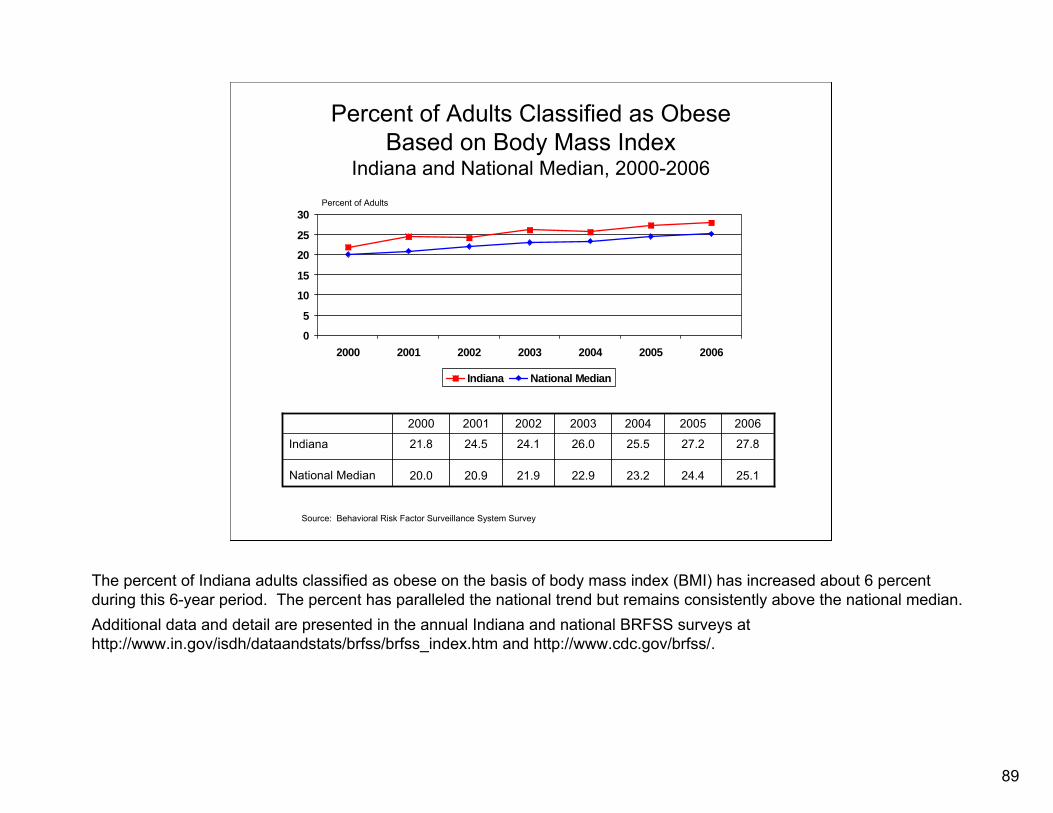
The percent of Indiana adults classified as obese on the basis of body mass index (BMI) has increased about 6 percent during this 6-year period. The percent has paralleled the national trend but remains consistently above the national median.Additional data and detail are presented in the annual Indiana and national BRFSS surveys at http://www.in.gov/isdh/dataandstats/brfss/brfss_index.htm and http://www.cdc.gov/brfss/.

90
Percent of Adults Consuming at Least Five Servings of Fruits/Vegetables Daily
Indiana and National Median
0
10
20
30
2000 2002 2003 2005
Indiana National Median
23.2
20.0
2000
23.2
22.0
2005
22.6
22.0
2003
22.6
21.7
2002
National Median
Indiana
Source: Behavioral Risk Factor Surveillance System Survey
Percent of Adults
The percent of adults who report consuming at least five servings of fruits and vegetables each day has not changed substantially during this six-year period, either in Indiana or the U.S. In both cases, only about 20 percent of adults meet the recommendations.Additional data and detail are presented in the annual Indiana and national BRFSS surveys at http://www.in.gov/isdh/dataandstats/brfss/brfss_index.htm and http://www.cdc.gov/brfss/.
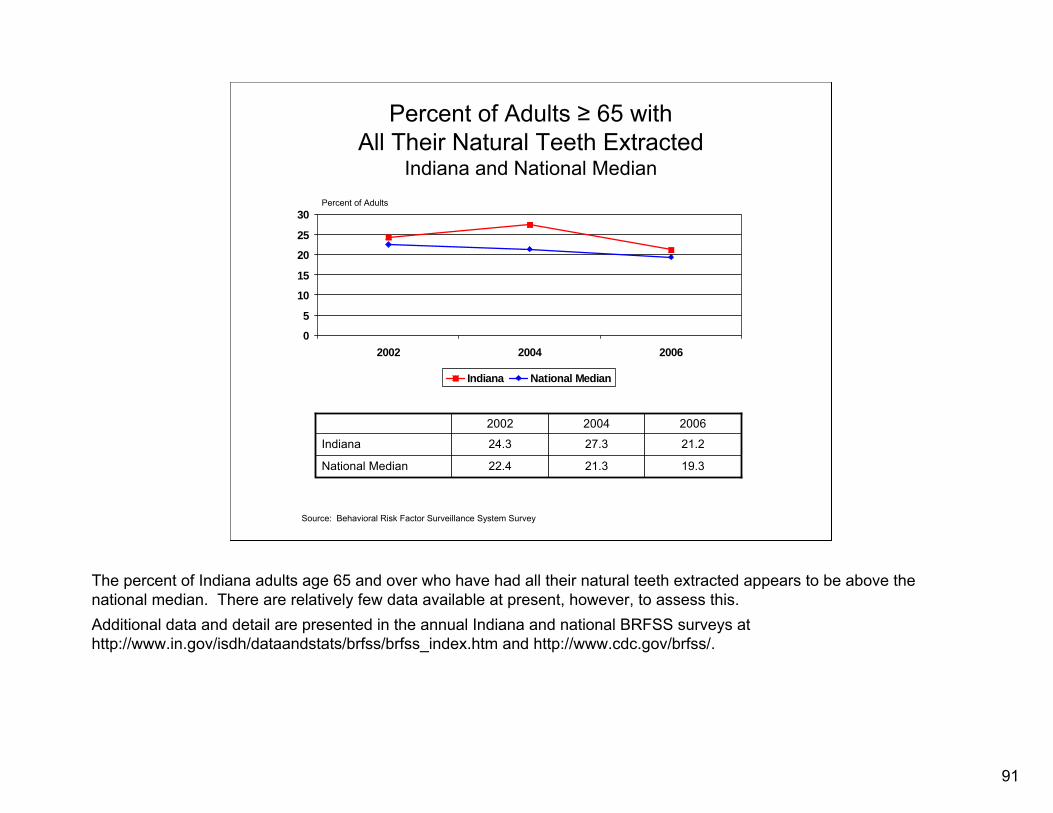
91
Percent of Adults ≥ 65 with All Their Natural Teeth Extracted
Indiana and National Median
0
5
10
15
20
25
30
2002 2004 2006
Indiana National Median
21.3
27.3
2004
19.3
21.2
2006
22.4
24.3
2002
National Median
Indiana
Source: Behavioral Risk Factor Surveillance System Survey
Percent of Adults
The percent of Indiana adults age 65 and over who have had all their natural teeth extracted appears to be above the national median. There are relatively few data available at present, however, to assess this.Additional data and detail are presented in the annual Indiana and national BRFSS surveys at http://www.in.gov/isdh/dataandstats/brfss/brfss_index.htm and http://www.cdc.gov/brfss/.

92
Percent of Adults with a Dental Visit within the Past Year
Indiana and National Median
0
20
40
60
80
1999 2002 2004 2006
Indiana National Median
70.9
68.9
2002
70.8
66.6
2004
70.3
68.0
2006
69.8
68.3
1999
National Median
Indiana
Source: Behavioral Risk Factor Surveillance System Survey
Percent of Adults
The percent of Indiana adults who have had a dental visit within the past year has remained constant at about 67 percent, slightly lower than the national median.Additional data and detail are presented in the annual Indiana and national BRFSS surveys at http://www.in.gov/isdh/dataandstats/brfss/brfss_index.htm and http://www.cdc.gov/brfss/.
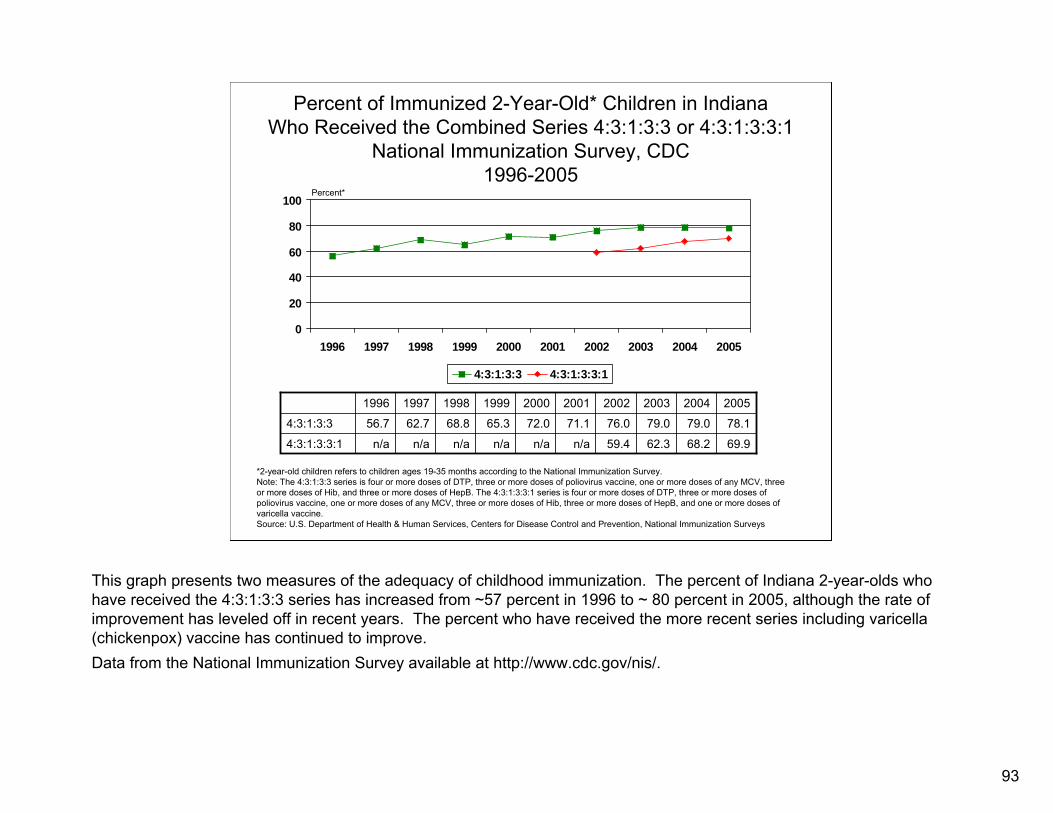
93
Percent of Immunized 2-Year-Old* Children in IndianaWho Received the Combined Series 4:3:1:3:3 or 4:3:1:3:3:1
National Immunization Survey, CDC1996-2005
0
20
40
60
80
100
1996 1997 1998 1999 2000 2001 2002 2003 2004 2005
4:3:1:3:3 4:3:1:3:3:1
n/a
56.7
1996
n/a
62.7
1997
n/a
68.8
1998
n/a
65.3
1999
n/a
72.0
2000
69.968.262.359.4n/a4:3:1:3:3:1
78.179.079.076.071.14:3:1:3:3
20052004200320022001
*2-year-old children refers to children ages 19-35 months according to the National Immunization Survey.Note: The 4:3:1:3:3 series is four or more doses of DTP, three or more doses of poliovirus vaccine, one or more doses of any MCV, three or more doses of Hib, and three or more doses of HepB. The 4:3:1:3:3:1 series is four or more doses of DTP, three or more doses of poliovirus vaccine, one or more doses of any MCV, three or more doses of Hib, three or more doses of HepB, and one or more doses of varicella vaccine.Source: U.S. Department of Health & Human Services, Centers for Disease Control and Prevention, National Immunization Surveys
Percent*
This graph presents two measures of the adequacy of childhood immunization. The percent of Indiana 2-year-olds who have received the 4:3:1:3:3 series has increased from ~57 percent in 1996 to ~ 80 percent in 2005, although the rate of improvement has leveled off in recent years. The percent who have received the more recent series including varicella(chickenpox) vaccine has continued to improve.Data from the National Immunization Survey available at http://www.cdc.gov/nis/.
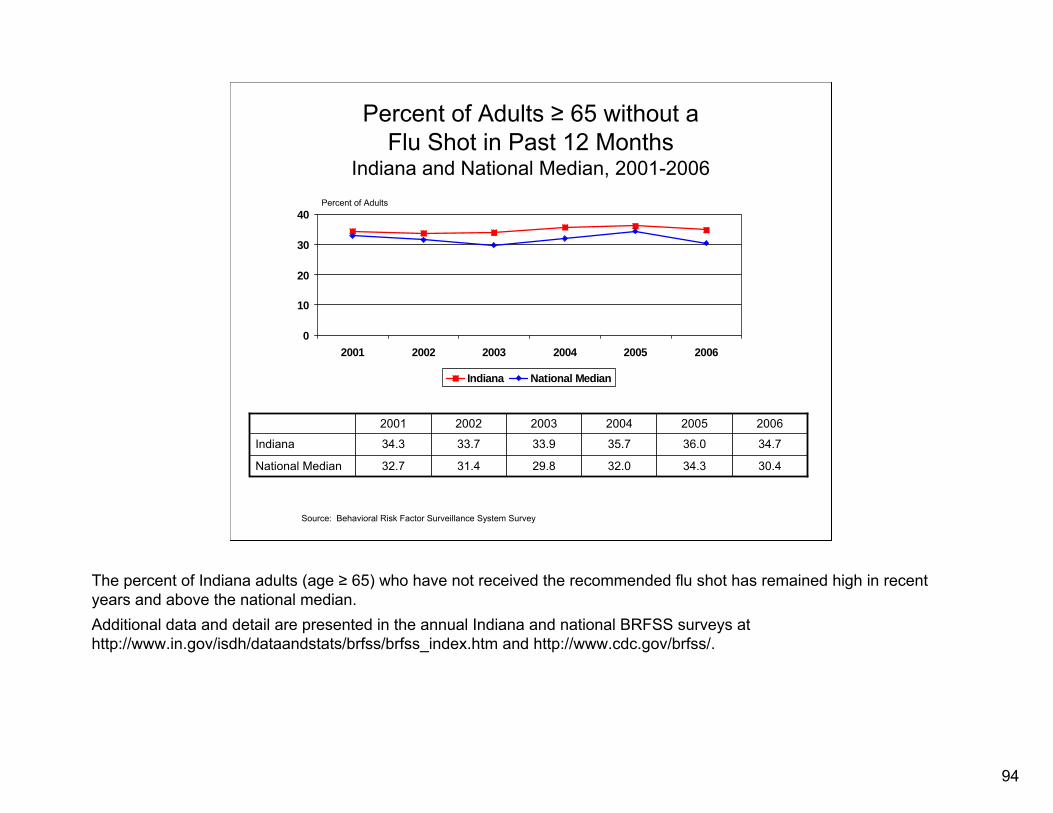
94
Percent of Adults ≥ 65 without a Flu Shot in Past 12 Months
Indiana and National Median, 2001-2006
0
10
20
30
40
2001 2002 2003 2004 2005 2006
Indiana National Median
32.0
35.7
2004
29.8
33.9
2003
32.7
34.3
2001
30.4
34.7
2006
34.3
36.0
2005
31.4
33.7
2002
National Median
Indiana
Source: Behavioral Risk Factor Surveillance System Survey
Percent of Adults
The percent of Indiana adults (age ≥ 65) who have not received the recommended flu shot has remained high in recent years and above the national median.Additional data and detail are presented in the annual Indiana and national BRFSS surveys at http://www.in.gov/isdh/dataandstats/brfss/brfss_index.htm and http://www.cdc.gov/brfss/.
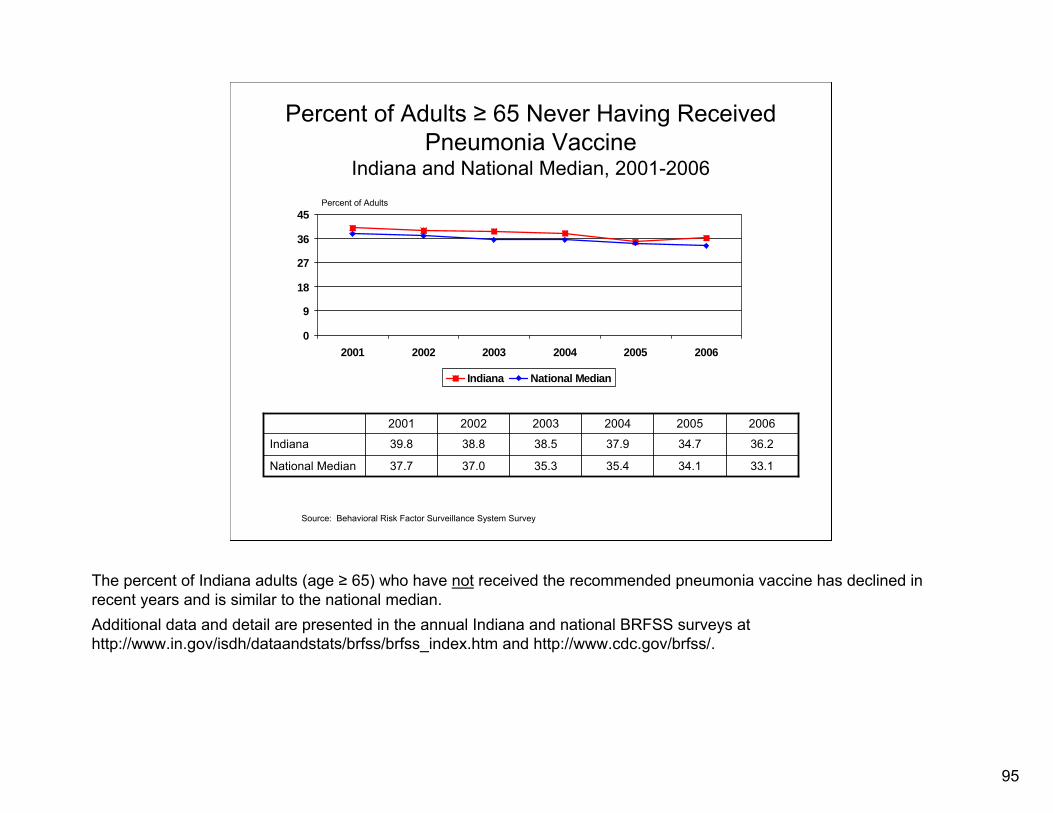
95
Percent of Adults ≥ 65 Never Having Received Pneumonia Vaccine
Indiana and National Median, 2001-2006
0
9
18
27
36
45
2001 2002 2003 2004 2005 2006
Indiana National Median
35.4
37.9
2004
35.3
38.5
2003
37.7
39.8
2001
33.1
36.2
2006
34.1
34.7
2005
37.0
38.8
2002
National Median
Indiana
Source: Behavioral Risk Factor Surveillance System Survey
Percent of Adults
The percent of Indiana adults (age ≥ 65) who have not received the recommended pneumonia vaccine has declined in recent years and is similar to the national median.Additional data and detail are presented in the annual Indiana and national BRFSS surveys at http://www.in.gov/isdh/dataandstats/brfss/brfss_index.htm and http://www.cdc.gov/brfss/.

96
VII. Health Systems
A. Licensed Health Professionals, Medically Underserved Areas
(MUA), and Health Professional Shortage Areas (HPSA)

97
Licensed Health Professionals: Indiana 2005
PhysiciansPhysician 13,275Osteopathic Physician 743Medical Resident Pmt 980
Dentists and HygienistsDentist 3,133Dental Hygienist 3,472
NursesRegistered Nurse 67,950Clinical Nurse Specialist 133Licensed Practical Nurse 23,232Nurse Practitioner 1,590Certified Nurse/Midwife 75Nurse/Midwife 57
Source: http://www.stats.indiana.edu/web/county/hprof05.html
Data on MUAs and HPSAs are available at:http://www.in.gov/isdh/publications/partner_rel/shortages/shortage.htm
These data provide a brief summary of the number of currently (2005) licensed health professionals practicing in Indiana and a link to additional information.Statistical data on MUAs and HPSAs are available on the ISDH Web site at http://www.in.gov/isdh/publications/llo/shortages/shortage.htm. Additional information may be found in the following maps of Primary Care, Dental, and Mental Health HPSAs and Indiana MUAs.
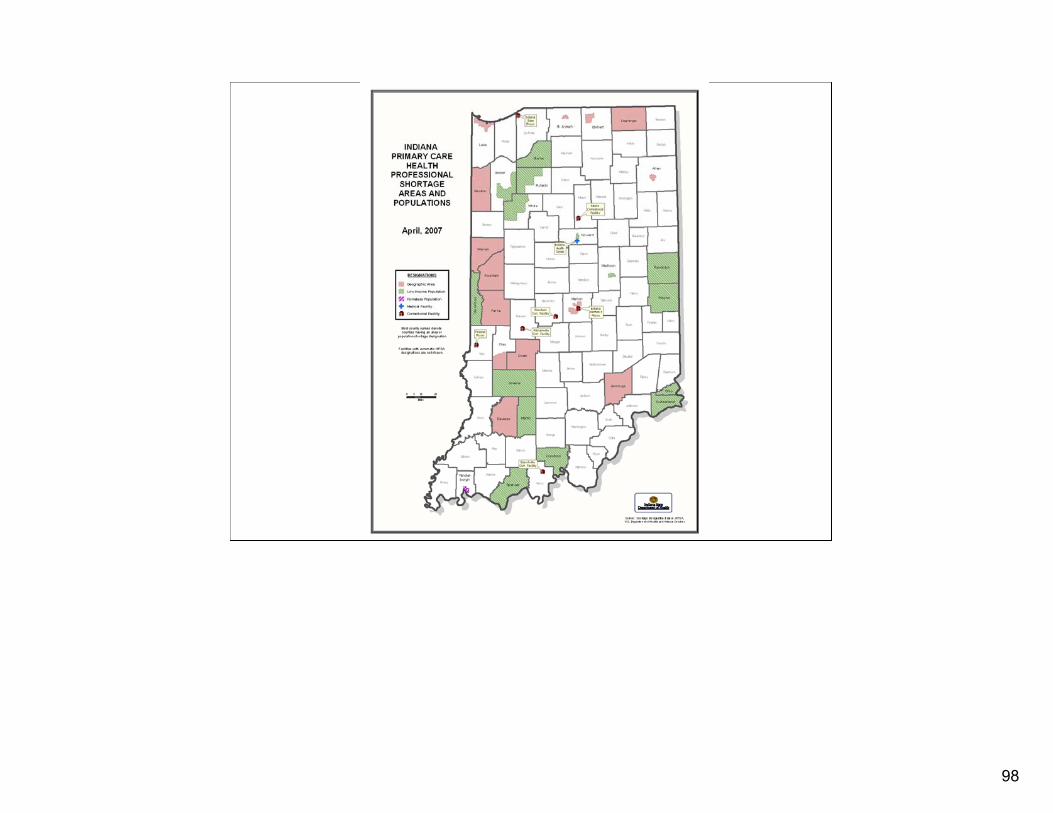
98
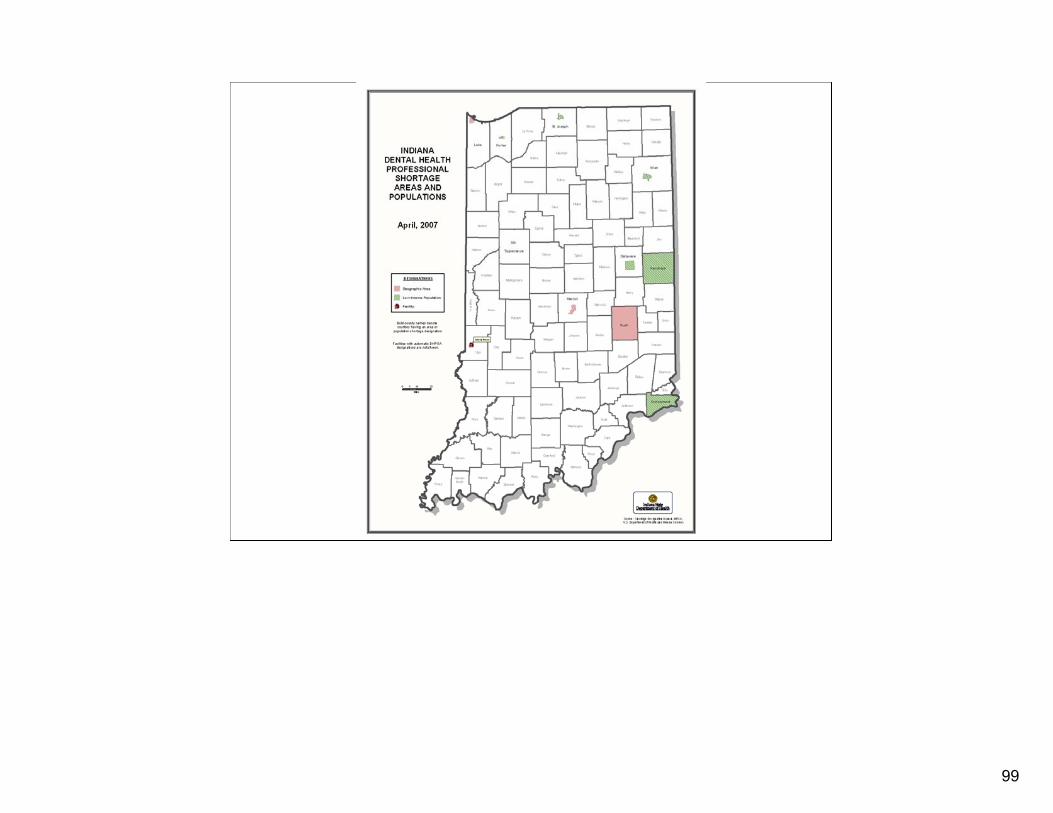
99

100
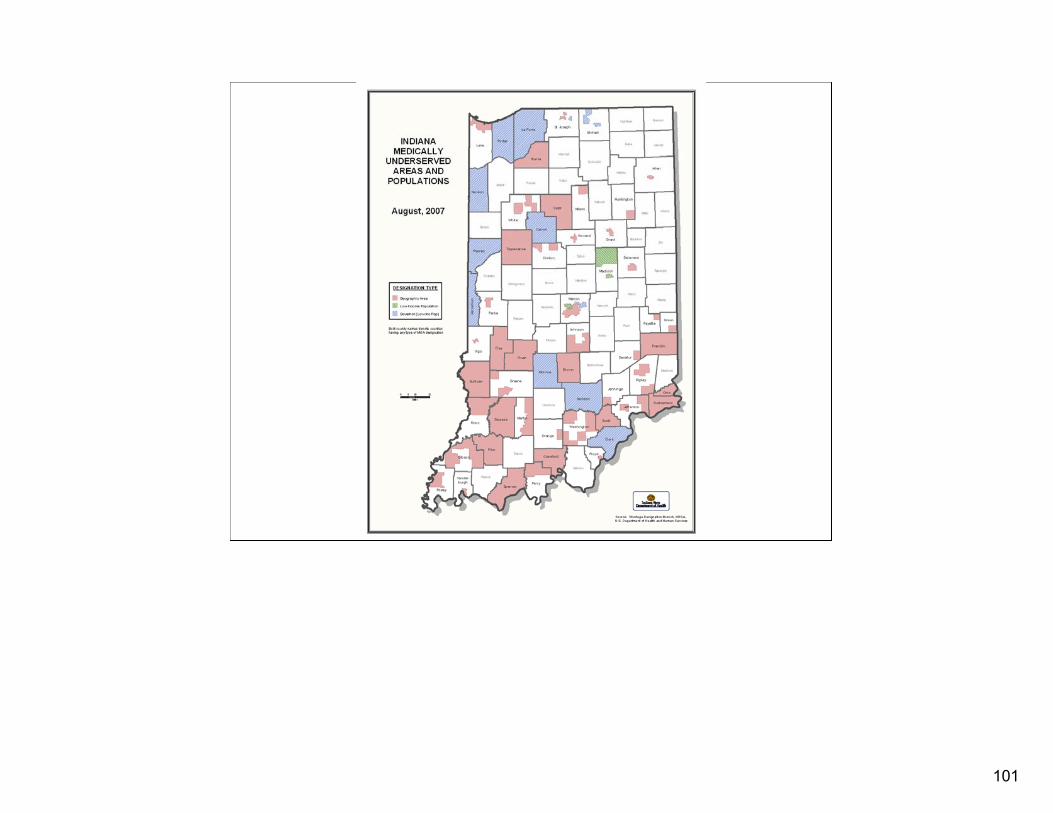
101

102
VII. Health Systems
B. Health Care Facilities and Statistics
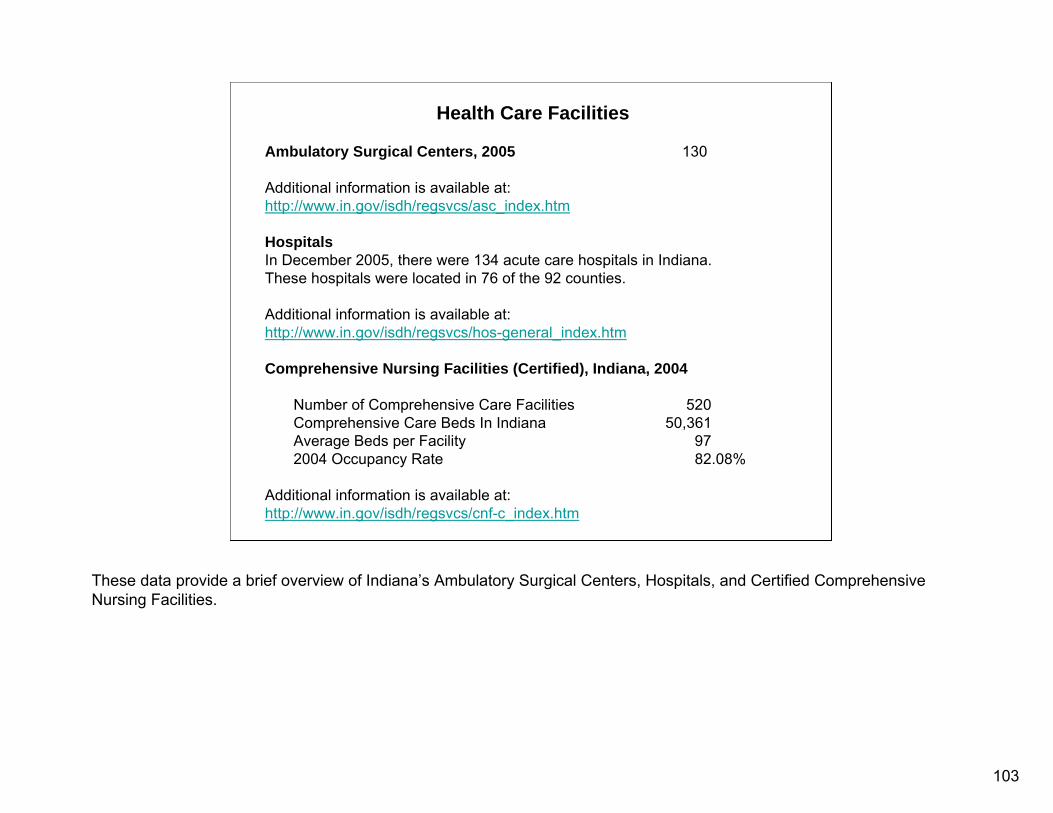
103
Health Care Facilities
Ambulatory Surgical Centers, 2005 130
Additional information is available at: http://www.in.gov/isdh/regsvcs/asc_index.htm
HospitalsIn December 2005, there were 134 acute care hospitals in Indiana. These hospitals were located in 76 of the 92 counties.
Additional information is available at: http://www.in.gov/isdh/regsvcs/hos-general_index.htm
Comprehensive Nursing Facilities (Certified), Indiana, 2004
Number of Comprehensive Care Facilities 520 Comprehensive Care Beds In Indiana 50,361 Average Beds per Facility 97 2004 Occupancy Rate 82.08%
Additional information is available at: http://www.in.gov/isdh/regsvcs/cnf-c_index.htm
These data provide a brief overview of Indiana’s Ambulatory Surgical Centers, Hospitals, and Certified Comprehensive Nursing Facilities.
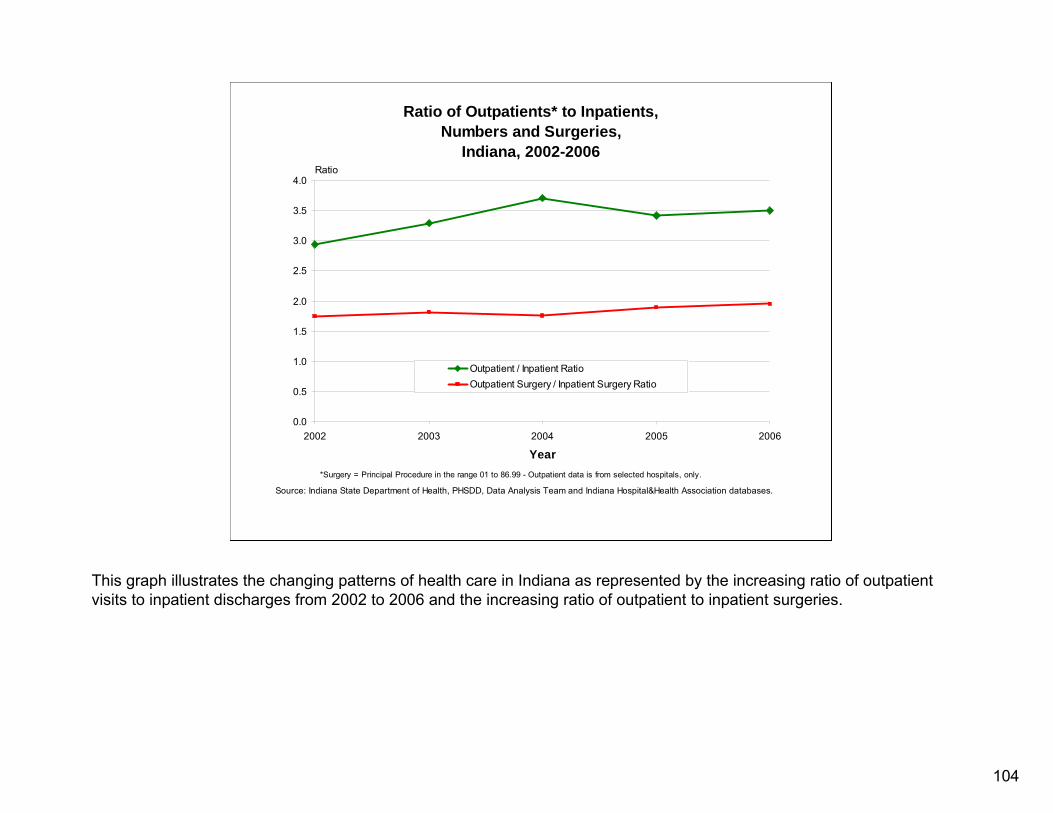
104
Ratio of Outpatients* to Inpatients,Numbers and Surgeries,
Indiana, 2002-2006
0.0
0.5
1.0
1.5
2.0
2.5
3.0
3.5
4.0
2002 2003 2004 2005 2006
Year
Ratio
Outpatient / Inpatient RatioOutpatient Surgery / Inpatient Surgery Ratio
*Surgery = Principal Procedure in the range 01 to 86.99 - Outpatient data is from selected hospitals, only.
Source: Indiana State Department of Health, PHSDD, Data Analysis Team and Indiana Hospital&Health Association databases.
This graph illustrates the changing patterns of health care in Indiana as represented by the increasing ratio of outpatient visits to inpatient discharges from 2002 to 2006 and the increasing ratio of outpatient to inpatient surgeries.

105
Acknowledgements
• The Data Analysis Team-- Susan Dorrell -- Kristy Holzhausen-- Gary Ordway -- Michele Starkey-- Linda Stemnock
• Lynae Granzow• Robert Teclaw, State Epidemiologist
• Christopher Waldron
Jon E. Lewis12/17/07
Individuals who have supplied the majority of information for this assessment.

[ Open Foundation Page Controls ]
● ISDH Home
● About the Agency
[ Open Sub Navigation ]
�❍ Mission & Vision
�❍ Contact Information
�❍ Family Helpline
�❍ Health Commissioner
�❍ Deputy Health Commissioner
�❍ Oranizational Chart
�❍ Employment Oppurtunities
● Dr. Monroe's Rx for Indiana
● Meetings & Events
● Forms
● Health Facility Licensing
[ Open Sub Navigation ]
�❍ Health Care Regulatory Services Commission
�❍ Acute Care/Hospitals
�❍ Long Term Care/Nursing Homes
�❍ Professional Licensing Agency (PLA)
● Office of Minority Health
● Office of Women's Health
● Publications
[ Open Sub Navigation ]
�❍ Epidemiology Newsletters
�❍ HIV/STD Quarterly Spotlight
● Rules
● Health Information by Topic
● Health Information A-Z >>
● Advisories and Recalls
● Consumer Protection Programs
[ Open Sub Navigation ]
�❍ Environmental Health Licensing & Inspection
�❍ Food Protection
Assessment of Statewide Health Needs - 2007
Additional Content Quick Actions
IN.gov - Skip NavigationNote: This message is displayed if (1) your browser is not standards-compliant or (2) you have you disabled CSS. Read our Policies for more information. ID:
17212
Assessment of Statewide Health Needs - 2007
https://webcms.in.gov/CMS/ioRD.asp?Action=RedDot&Mode=1&projectg...=33C0A86AC59546CB9A15BB823859D949&languagevariantid=ENU&islink=2 (1 of 2) [2/25/2008 3:09:01 PM]

Assessment of Statewide Health Needs - 2007
�❍ Medical Radiology Services
�❍ Sanitary Engineering
�❍ Weights & Measures
● Healthy Indiana Plan
● Immunizations
[ Open Sub Navigation ]
● Pandemic Influenza
● Public Health Preparedness
● Tobacco Prevention & Cessation
● Travelers Health
● Reports & Statistics
● Behavioral Risk Factor Surveillance System (BRFSS)
● Birth Reports (Natality)
● Cancer Reports
● Death Reports (Mortality)
● Fireworks Injury Reports
● Fish Consumption Advisory
● HIV/STD Reports
● Medical Errors Reporting System
● Youth Risk Behavior Survey (YRBS)
● More Reports & Statistics >>
Breadcrumb DEMO: Start Page > ISDH > More Reports & Statistics >> > Assessment of Statewide Health Needs - 2007
https://webcms.in.gov/CMS/ioRD.asp?Action=RedDot&Mode=1&projectg...=33C0A86AC59546CB9A15BB823859D949&languagevariantid=ENU&islink=2 (2 of 2) [2/25/2008 3:09:01 PM]