Embed Size (px)
Citation preview
2151-805X/11/$35.00 © 2011 by Begell House, Inc. 1
Critical Reviews™ in Physical and Rehabilitation Medicine, 23(1–4), 1–14 (2011)
Assessment of Strength and Function in Ambulatory Children with Cerebral Palsy by GMFCS Level and Age: A Cross-Sectional Study
Sahar Hassani,a Joseph Krzak,a Ann Flanagan,a Anita Bagley,b George Gorton,c Mark Romness,d Chester Tylkowski,e Mark Abel,d Barbara Johnson,f & Donna Oeffingere
aShriners Hospitals for Children–Chicago, Chicago, IL. b Shriners Hospitals for Children–Northern California, Sacramento, CA. cShriners Hospitals for Children–Springfield, Springfield, MA. dUni-versity of Virginia, Charlottesville, VA. eShriners Hospitals for Children–Lexington, Lexington, KY. fShriners Hospitals for Children–Salt Lake City, Salt Lake City, UT
*Address all correspondence to: Sahar Hassani, MS, Director of Research Administration, Shriners Hospitals for Children–Chicago, 2211 N. Oak Park Avenue, Chicago, IL 60707; Tel.: 773-385-5457; Fax: 773-385-5459; [email protected]
ABSTRACT: The purpose of this work is to provide comparison data for muscle strength and measures of activity and participation stratified by GMFCS level, age, and cerebral palsy (CP) type. Clinicians can use the data to determine treatment goals based on the patients’ matched peer group. Methods used were data were collected on 377 individuals with hemiplegia and diplegia, GMFCS levels I–III, ages eight to18 years. Lower extrem-ity muscle strength, Gillette gait index (GGI), one-minute walk test (1MWT), and timed up-and-go (TUG) were collected. Results showed that strength differed among GMFCS levels and age for both CP types. The GGI and 1 MWT discriminated among GMFCS levels within each CP type. The TUG discriminated between GMFCS levels I and III and levels II and III for the diplegic group. We conclude that differences in strength and mea-sures of activity and participation were found across GMFCS levels and CP type. The reported stratified data can serve as an important clinical tool in determining realistic treatment goals and clinical outcomes.
KEY WORDS: muscle strength; one-minute walk test (1MWT), timed up-and-go (TUG), Gillette gait index (GGI), cerebral palsy
ABBREVIATIONS: CP: cerebral palsy; GMFCS: gross motor function classification system; 1MWT: one-minute walk test; TUG: timed up-and-go; GGI: Gillette gait index
I. INTRODUCTION
Comparison of function in children with cerebral palsy (CP) based on severity, age, and distribution of limb involvement is fundamental when determining appropriate clinical care and conducting clinical research. Standardized outcome tools are rou-tinely used to quantify body functions and structures, activities and participation for individuals with CP.1–5
Critical Reviews™ in Physical and Rehabilitation Medicine
2 Hassani et al
Investigators previously reported descriptive characteristics of several outcome tools in ambulatory children with CP stratified by severity level.6–8. Oeffinger et al.6,9 found a direct relationship between gross motor function classification system (GMFCS) level2 and the pediatric outcomes data collection instrument (PODCI),4 pediatric functional independence measure (WeeFIM),3 Gillette functional assess-ment questionnaire (FAQ),1 gross motor function measure (GMFM),10 energy cost during walking (O2 cost), and temporal-spatial gait parameters. The study showed a direct relationship between increasing severity and decreasing scores on outcome tools. The results provided descriptive data, by severity level, that clinicians can use for comparison with individual children with CP.
Age has been found to be associated with gross motor function of children with CP.11 Differential rates and limits of gross motor development were found among children of different GMFCS levels.12 Wright et al.13 described patterns of gross motor development of children with CP. The GMFCS was used as a predictive measure, longitudinally tracking the rates and limits of motor function (GMFM scores) of children with similar age and severity.
In addition to severity and age, consideration of the type of CP has been shown to be important when assessing children using outcome tools. Damiano et al.14 reported descriptive characteristics of children with CP and compared those with hemiplegia to those with diplegia by GMFCS level. Results showed that children with hemiplegia presented differently from those with diplegia on the PODCI, WeeFIM, GMFM, FAQ, O2 cost , and gait metrics. Children with hemiplegia had worse upper extremity function but better gait and lower extremity function than children with diplegia.
While previous studies have focused on differences by CP type, severity level, or age, few have used all three stratifications. Strength is important in this population. Children with CP are weaker than their peers,15 which could lead to decreased function on mea-sures of activity and participation. Strength assessments are used frequently in clinical settings to determine if specific muscle weakness exists. Limited comparison data for overall lower extremity strength and individual muscle strength for ambulatory children with CP by CP type, GMFCS levels, and age are available in the literature.15,16
Assessments used to test endurance, balance, and gait deviations in individuals with CP include measures of activity and participation such as the one-minute walk test (1MWT), timed up-and-go (TUG), and the Gillette gait index (GGI). The 1MWT is a valid measure of functional mobility and endurance in children with CP.17 TUG measures basic mobility, dynamic balance, and function,18 and may be used for any population with impaired balance.19–23 TUG may serve as an accurate tool in assess-ing the efficiency of transitions and gait in children with CP. The GGI is a measure of gait deviation that incorporates 16 kinematic and temporal-spatial parameters.1,24 The GGI can distinguish between types of CP (hemiplegia and diplegia) as well as between involved and uninvolved limbs of individuals with hemiplegic CP.25,26
The purpose of this study was to assess measures of activity and participation, and the body function and structure measurement of strength using standardized outcome tools stratified by CP type, GMFCS level, and age. The results provide data
Volume 23, Issue 1–4, 2011
Strength and Function in Ambulatory Children with Cerebral Palsy 3
to clinicians that allow for comparison of individuals with CP to others with similar severity levels, age, and CP type, leading to better clinical decision making, posttreat-ment follow-up, and experimental designs. This paper builds on previous work by the Functional Assessment Research Group that evaluated multiple outcome tools stratified by GMFCS level and CP type in ambulatory children with CP6,8,9,14,27,28 and includes new measures of TUG, 1MWT, GGI, and lower extremity strength.
II. METHODS
A. Participants
This study was part of a four-year prospective multicenter study. Participants were a convenience sample of eligible patients from seven pediatric orthopedic hospitals. Institutional Review Board approval was obtained at each site and consent and Health Insurance Portability and Accountability Act forms were completed.
Inclusion criteria were: patients with a diagnosis of spastic CP, in GMFCS lev-els I–III, ages 8 to 18 years, and who were able to complete an instrumented gait analysis with or without assistive devices. Patients were excluded if they had lower extremity orthopedic surgery within the last year, botulinum toxin A injections in the past four months, or a currently implanted and operating baclofen pump. A total of 748 patients were assessed: 273 did not meet inclusion criteria; 80 declined participation. Demographic characteristics of individuals who did not participate were not different from those who did. Data from 18 participants were excluded for inconsistent or missing data, resulting in 377 in the final analysis.
B. Data Management
Before study initiation, all coordinators attended a mandatory two-day training ses-sion to review and standardize administration of the outcome tools and data col-lection processes. All participant data were entered directly into a custom database designed for study management and data collection. Encoded data from each site were compiled for analysis. Data quality and consistency was ensured by the project manager and site coordinators.
C. Assessment Tools
Each participant completed an assessment that included GMFCS, height, weight, and pubertal stage measured by self-report of the Tanner scale. Patient history was collected that included gestational age, race, limb involvement, age at walking onset, additional diagnoses, and previous surgeries. Each participant completed an instrumented gait analysis, 1MWT, and TUG as measures of activity and participation. Lower extremity strength was also collected.16 To compare current findings with our previous work,6,8,9,27 PODCI, GMFM, gait temporal-spatial parameters, and O2 cost were also collected.
Critical Reviews™ in Physical and Rehabilitation Medicine
4 Hassani et al
During the 1MWT, participants were instructed to walk using their typical walking aids, orthoses, and shoes at their fastest pace possible, without running, for 1 min. Total distance in meters walked were recorded. For the TUG, the length of time (seconds) was recorded for rising from the sitting position in a chair, walk 3 m, touch the wall, turn around, walk back, and sit down while using customary walking aids, orthoses, and shoes.
Participants were evaluated using instrumented gait analysis. All subjects walked barefoot at self-selected walking speed. GGI was calculated for three representative trials and averaged to obtain the GGI score. For children with diplegia, the GGI data from the left and right limbs were averaged to give the total GGI score. For those with hemiplegia, total GGI score and individual GGI scores of involved and uninvolved sides were calculated.
Lower extremity muscle strength of the hip flexors, extensors, abductors and adductors, knee flexors and extensors, and ankle plantar flexors and dorsiflexors were assessed using a standardized protocol with a handheld dynamometer (HHD) (JTECH PowerTrack II Commander, Salt Lake City, Utah). All examiners re-ceived training on the standardized protocol, and reliability testing was completed. Strength scores for each individual muscle was the maximum value of three trials. Two aggregate strength scores were collected. Total strength score was calculated by averaging the individual strength scores for all muscles bilaterally. Total extensor strength was the sum of hip and knee extensors, and ankle plantar flexors bilater-ally. All strength scores were normalized to body weight.
D. Statistical Analysis
Descriptive statistics were calculated for all interval variables and were analyzed by GMFCS level, type of CP (hemiplegia or diplegia), and age group. Participants with hemiplegia and diplegia were analyzed separately for all analyses. Three age groups were created: prepubescent (age group 1: 8–<11 years), pubescent (age group 2: 11–<14 years), and postpubescent (age group 3: 14–19 years). Paired t-tests were used to compare differences between CP types. ANOVAs were used to analyze dif-ferences among GMFCS levels and age groups. Post hoc tests were performed to examine significant main effects. Due to the large number of parallel tests, a p < 0.01 was set a priori as the significance level for all statistical tests.
III. RESULTS
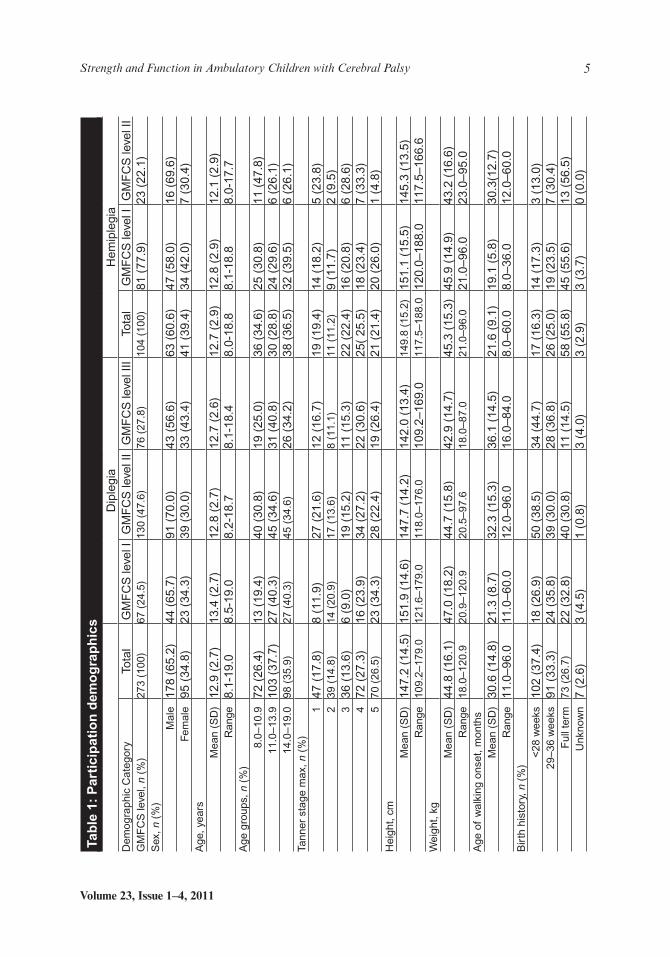
Participant demographics are reported for the diplegic and the hemiplegic groups (Table 1). Of the 377 subjects, 273 (72%) were diplegic and 104 (28%) were hemiplegic. Within the diplegic group, 67 (25%) were GMFCS level I, 130 (48%) were GMFCS level II, and 76 (28%) were GMFCS level III. Also, 72 (26%) were in age group 1, 103 (38%) in age group 2, and 98 (36%) in age group 3. One hundred and sixty (59%) previously had musculoskeletal surgery. Two hundred and fourteen (79%) were Caucasian, 19 (7%)
Volume 23, Issue 1–4, 2011
Strength and Function in Ambulatory Children with Cerebral Palsy 5
Tab
le 1
: P
arti
cip
atio
n d
emo
gra
ph
ics
D
iple
gia
Hem
iple
gia
Dem
ogra
phic
Ca
tego
ryTo
tal
GM
FC
S le
vel I
GM
FC
S le
vel I
IG
MF
CS
leve
l III
Tota
lG
MF
CS
leve
l IG
MF
CS
leve
l II
GM
FC
S le
vel,
n (%
)27
3 (1
00)
67 (
24.5
)13
0 (4
7.6)
76 (
27.8
)10
4 (1
00)
81 (
77.9
)23
(22
.1)
Sex
, n (
%)
Mal
e17
8 (6
5.2)
44 (
65.7
)91
(70
.0)
43 (
56.6
)63
(60
.6)
47 (
58.0
)16
(69
.6)
Fem
ale
95 (
34.8
)23
(34
.3)
39 (
30.0
)33
(43
.4)
41 (
39.4
)34
(42
.0)
7 (3
0.4)
Age
, yea
rsM
ean
(SD
)12
.9 (
2.7)
13.4
(2.
7)12
.8 (
2.7)
12.7
(2.
6)12
.7 (
2.9)
12.8
(2.
9)12
.1 (
2.9)
Ran
ge8.
1-19
.08.
5-19
.08.
2-18
.78.
1-18
.48.
0-18
.88.
1-18
.88.
0-17
.7A
ge g
roup
s, n
(%
)8.
0–10
.972
(26
.4)
13 (
19.4
)40
(30
.8)
19 (
25.0
)36
(34
.6)
25 (
30.8
)11
(47
.8)
11.0
–13.
910
3 (3
7.7)
27 (
40.3
)45
(34
.6)
31 (
40.8
)30
(28
.8)
24 (
29.6
)6
(26.
1)14
.0–1
9.0
98 (
35.9
)27
(40
.3)
45 (
34.6
)26
(34
.2)
38 (
36.5
)32
(39
.5)
6 (2
6.1)
Tann
er s
tage
max
, n (
%)
147
(17
.8)
8 (1
1.9)
27 (
21.6
)12
(16
.7)
19 (
19.4
)14
(18
.2)
5 (2
3.8)
239
(14
.8)
14 (
20.9
)17
(13
.6)
8 (1
1.1)
11 (
11.2
)9
(11.
7)2
(9.5
)3
36 (
13.6
)6
(9.0
)19
(15
.2)
11 (
15.3
)22
(22
.4)
16 (
20.8
)6
(28.
6)4
72 (
27.3
)16
(23
.9)
34 (
27.2
)22
(30
.6)
25(
25.5
)18
(23
.4)
7 (3
3.3)
570
(26
.5)
23 (
34.3
)28
(22
.4)
19 (
26.4
)21
(21
.4)
20 (
26.0
)1
(4.8
)H
eigh
t, cm
Mea
n (S
D)
147.
2 (1
4.5)
151.
9 (1
4.6)
147.
7 (1
4.2)
142.
0 (1
3.4)
149.
8 (1
5.2)
151.
1 (1
5.5)
145.
3 (1
3.5)
Ran
ge10
9.2–
179.
012
1.6–
179.
011
8.0–
176.
010
9.2–
169.
011
7.5–
188.
012
0.0–
188.
011
7.5–
166.
6W
eigh
t, kg
Mea
n (S
D)
44.8
(16
.1)
47.0
(18
.2)
44.7
(15
.8)
42.9
(14
.7)
45.3
(15
.3)
45.9
(14
.9)
43.2
(16
.6)
Ran
ge18
.0–1
20.9
20.9
–120
.920
.5–9
7.6
18.0
–87.
021
.0–9
6.0
21.0
–96.
023
.0–9
5.0
Age
of
wal
king
ons
et, m
onth
sM
ean
(SD
)30
.6 (
14.8
)21
.3 (
8.7)
32.3
(15
.3)
36.1
(14
.5)
21.6
(9.
1)19
.1 (
5.8)
30.3
(12.
7)R
ange
11.0
–96.
011
.0–6
0.0
12.0
–96.
016
.0–8
4.0
8.0–
60.0
8.0–
36.0
12.0
–60.
0B
irth
his
tory
, n (
%)
<28
wee
ks10
2 (3
7.4)
18 (
26.9
)50
(38
.5)
34 (
44.7
)17
(16
.3)
14 (
17.3
)3
(13.
0)29
–36
wee
ks91
(33
.3)
24 (
35.8
)39
(30
.0)
28 (
36.8
)26
(25
.0)
19 (
23.5
)7
(30.
4)F
ull t
erm
73 (
26.7
)22
(32
.8)
40 (
30.8
)11
(14
.5)
58 (
55.8
)45
(55
.6)
13 (
56.5
)U
nkno
wn
7 (2
.6)
3 (4
.5)
1 (0
.8)
3 (4
.0)
3 (2
.9)
3 (3
.7)
0 (0
.0)
Critical Reviews™ in Physical and Rehabilitation Medicine
6 Hassani et al
were African-American, 21 (8%) were Hispanic/Latino, and 16 (6%) were considered as other. Within the hemiplegic group, 81 (78%) were GMFCS level I and 23 (22%) were GMFCS level II. Thirty-six (35%) were in age group I, 30 (29%) in age group II, and 38 (36%) in age group III. Sixty-six (64%) previously had musculoskeletal surgery and 38 (36%) did not. Eighty-three (81%) were Caucasian, 7 (7%) were African-American, 7 (7%) were Hispanic/Latino, and 6 (5%) were considered as other.
Data were analyzed to assess site bias for all study measures. No differences in data collected across sites were found for any measures except for strength. The PODCI, GMFM, gait temporal-spatial, and O2 cost data were nearly identical to those previously published by Oeffinger et al.6
A. Descriptive Statistics
1. Diplegia
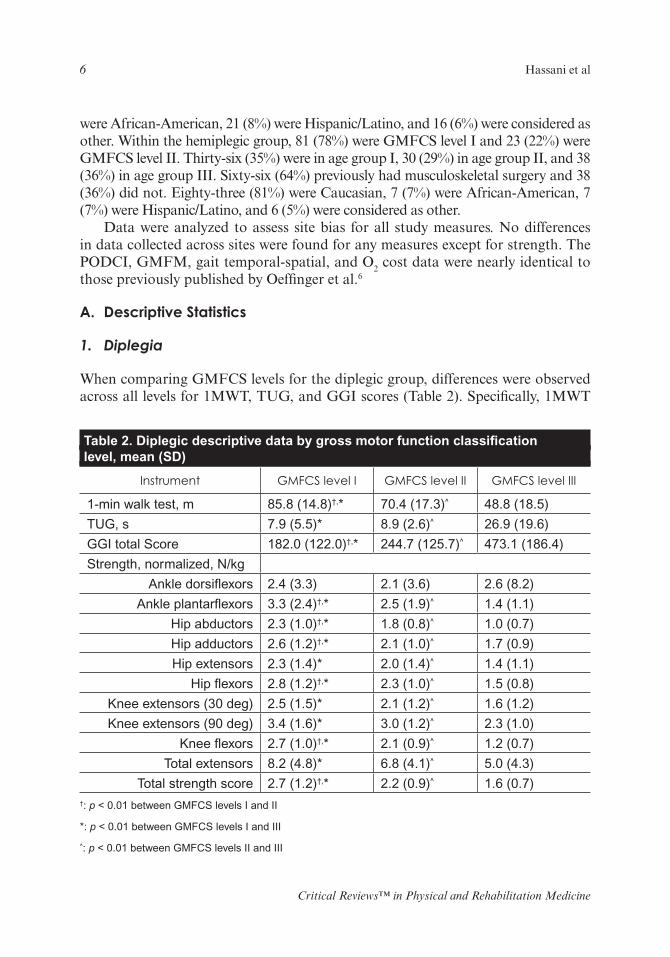
When comparing GMFCS levels for the diplegic group, differences were observed across all levels for 1MWT, TUG, and GGI scores (Table 2). Specifically, 1MWT
Table 2. Diplegic descriptive data by gross motor function classification level, mean (SD)
Instrument GMFCS level I GMFCS level II GMFCS level III
1-min walk test, m 85.8 (14.8)†,* 70.4 (17.3)^ 48.8 (18.5)
TUG, s 7.9 (5.5)* 8.9 (2.6)^ 26.9 (19.6)
GGI total Score 182.0 (122.0)†,* 244.7 (125.7)^ 473.1 (186.4)
Strength, normalized, N/kg
Ankle dorsiflexors 2.4 (3.3) 2.1 (3.6) 2.6 (8.2)
Ankle plantarflexors 3.3 (2.4)†,* 2.5 (1.9)^ 1.4 (1.1)
Hip abductors 2.3 (1.0)†,* 1.8 (0.8)^ 1.0 (0.7)
Hip adductors 2.6 (1.2)†,* 2.1 (1.0)^ 1.7 (0.9)
Hip extensors 2.3 (1.4)* 2.0 (1.4)^ 1.4 (1.1)
Hip flexors 2.8 (1.2)†,* 2.3 (1.0)^ 1.5 (0.8)
Knee extensors (30 deg) 2.5 (1.5)* 2.1 (1.2)^ 1.6 (1.2)
Knee extensors (90 deg) 3.4 (1.6)* 3.0 (1.2)^ 2.3 (1.0)
Knee flexors 2.7 (1.0)†,* 2.1 (0.9)^ 1.2 (0.7)
Total extensors 8.2 (4.8)* 6.8 (4.1)^ 5.0 (4.3)
Total strength score 2.7 (1.2)†,* 2.2 (0.9)^ 1.6 (0.7)†: p < 0.01 between GMFCS levels I and II
*: p < 0.01 between GMFCS levels I and III
^: p < 0.01 between GMFCS levels II and III
Volume 23, Issue 1–4, 2011
Strength and Function in Ambulatory Children with Cerebral Palsy 7
distances decreased and GGI scores increased (indicating more gait deviations) with increasing severity (GMFCS level). Time required to perform the TUG increased between GMFCS levels I and III and levels II and III. For the individual and ag-gregate normalized strength values, all were different across GMFCS levels with the exception of ankle dorsiflexors. Monotonic decreases in strength were found with increasing GMFCS levels for ankle plantar flexors, hip abductors and adductors, hip flexors, knee flexors, and total strength.
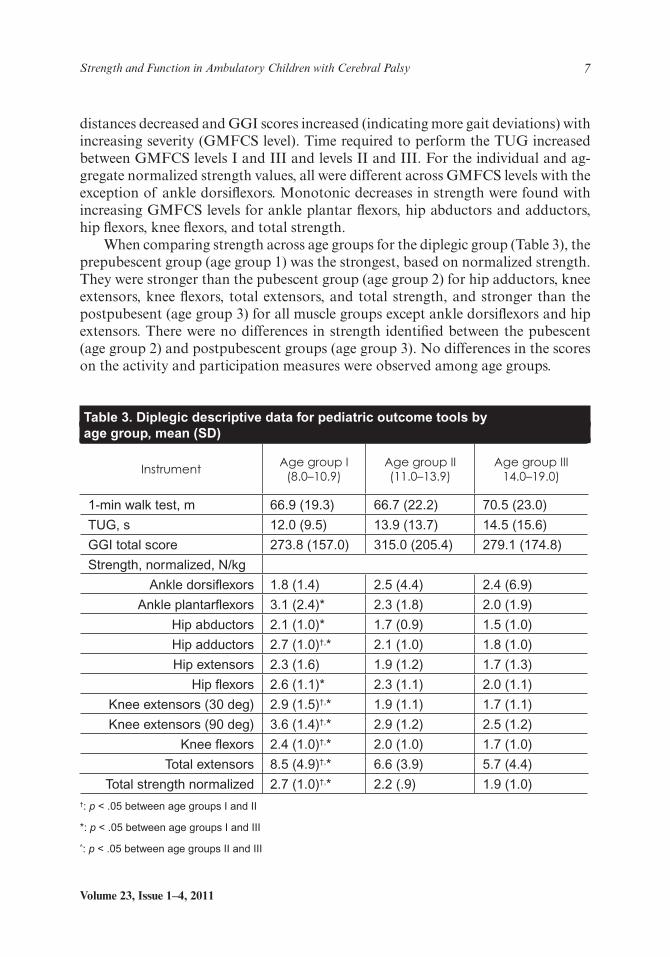
When comparing strength across age groups for the diplegic group (Table 3), the prepubescent group (age group 1) was the strongest, based on normalized strength. They were stronger than the pubescent group (age group 2) for hip adductors, knee extensors, knee flexors, total extensors, and total strength, and stronger than the postpubesent (age group 3) for all muscle groups except ankle dorsiflexors and hip extensors. There were no differences in strength identified between the pubescent (age group 2) and postpubescent groups (age group 3). No differences in the scores on the activity and participation measures were observed among age groups.
Table 3. Diplegic descriptive data for pediatric outcome tools by age group, mean (SD)
InstrumentAge group I
(8.0–10.9)Age group II (11.0–13.9)
Age group III 14.0–19.0)
1-min walk test, m 66.9 (19.3) 66.7 (22.2) 70.5 (23.0)
TUG, s 12.0 (9.5) 13.9 (13.7) 14.5 (15.6)
GGI total score 273.8 (157.0) 315.0 (205.4) 279.1 (174.8)
Strength, normalized, N/kg
Ankle dorsiflexors 1.8 (1.4) 2.5 (4.4) 2.4 (6.9)
Ankle plantarflexors 3.1 (2.4)* 2.3 (1.8) 2.0 (1.9)
Hip abductors 2.1 (1.0)* 1.7 (0.9) 1.5 (1.0)
Hip adductors 2.7 (1.0)†,* 2.1 (1.0) 1.8 (1.0)
Hip extensors 2.3 (1.6) 1.9 (1.2) 1.7 (1.3)
Hip flexors 2.6 (1.1)* 2.3 (1.1) 2.0 (1.1)
Knee extensors (30 deg) 2.9 (1.5)†,* 1.9 (1.1) 1.7 (1.1)
Knee extensors (90 deg) 3.6 (1.4)†,* 2.9 (1.2) 2.5 (1.2)
Knee flexors 2.4 (1.0)†,* 2.0 (1.0) 1.7 (1.0)
Total extensors 8.5 (4.9)†,* 6.6 (3.9) 5.7 (4.4)
Total strength normalized 2.7 (1.0)†,* 2.2 (.9) 1.9 (1.0)†: p < .05 between age groups I and II
*: p < .05 between age groups I and III
^: p < .05 between age groups II and III
Critical Reviews™ in Physical and Rehabilitation Medicine
8 Hassani et al
2. Hemiplegia
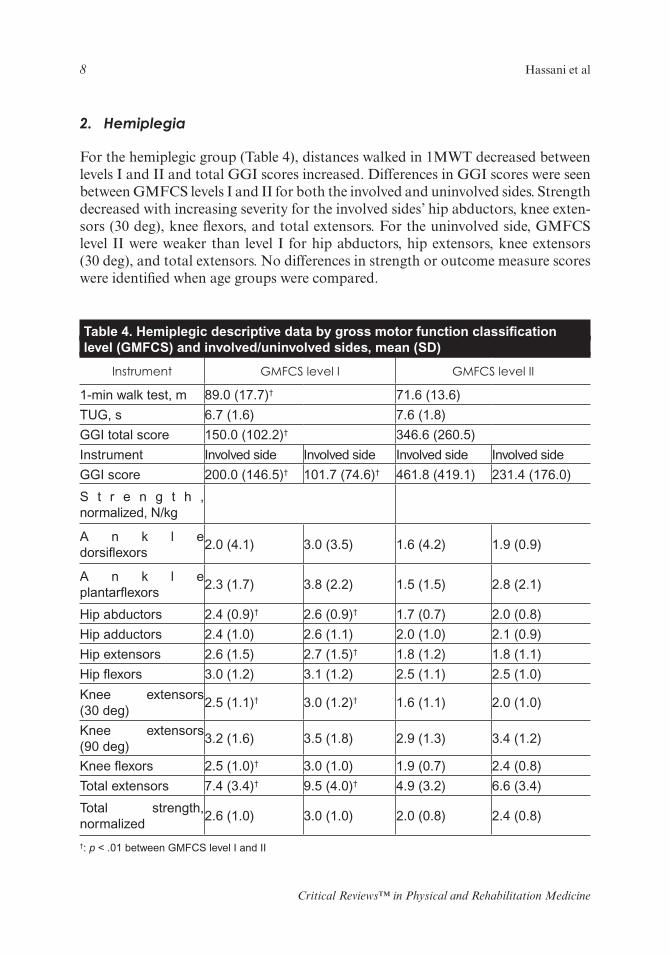
For the hemiplegic group (Table 4), distances walked in 1MWT decreased between levels I and II and total GGI scores increased. Differences in GGI scores were seen between GMFCS levels I and II for both the involved and uninvolved sides. Strength decreased with increasing severity for the involved sides’ hip abductors, knee exten-sors (30 deg), knee flexors, and total extensors. For the uninvolved side, GMFCS level II were weaker than level I for hip abductors, hip extensors, knee extensors (30 deg), and total extensors. No differences in strength or outcome measure scores were identified when age groups were compared.
Table 4. Hemiplegic descriptive data by gross motor function classification level (GMFCS) and involved/uninvolved sides, mean (SD)
Instrument GMFCS level I GMFCS level II
1-min walk test, m 89.0 (17.7)† 71.6 (13.6)
TUG, s 6.7 (1.6) 7.6 (1.8)
GGI total score 150.0 (102.2)† 346.6 (260.5)
Instrument Involved side Involved side Involved side Involved side
GGI score 200.0 (146.5)† 101.7 (74.6)† 461.8 (419.1) 231.4 (176.0)
S t r e n g t h , normalized, N/kg
A n k l e dorsiflexors
2.0 (4.1) 3.0 (3.5) 1.6 (4.2) 1.9 (0.9)
A n k l e plantarflexors
2.3 (1.7) 3.8 (2.2) 1.5 (1.5) 2.8 (2.1)
Hip abductors 2.4 (0.9)† 2.6 (0.9)† 1.7 (0.7) 2.0 (0.8)
Hip adductors 2.4 (1.0) 2.6 (1.1) 2.0 (1.0) 2.1 (0.9)
Hip extensors 2.6 (1.5) 2.7 (1.5)† 1.8 (1.2) 1.8 (1.1)
Hip flexors 3.0 (1.2) 3.1 (1.2) 2.5 (1.1) 2.5 (1.0)
Knee extensors (30 deg)
2.5 (1.1)† 3.0 (1.2)† 1.6 (1.1) 2.0 (1.0)
Knee extensors (90 deg)
3.2 (1.6) 3.5 (1.8) 2.9 (1.3) 3.4 (1.2)
Knee flexors 2.5 (1.0)† 3.0 (1.0) 1.9 (0.7) 2.4 (0.8)
Total extensors 7.4 (3.4)† 9.5 (4.0)† 4.9 (3.2) 6.6 (3.4)
Total strength, normalized
2.6 (1.0) 3.0 (1.0) 2.0 (0.8) 2.4 (0.8)
†: p < .01 between GMFCS level I and II
Volume 23, Issue 1–4, 2011
Strength and Function in Ambulatory Children with Cerebral Palsy 9
3. Diplegia versus Hemiplegia
Differences were seen between the subset of the diplegic group (GMFCS levels I and II) and hemiplegic groups for the 1MWT (diplegia: 68.6 ± 21.7 m, hemiplegia: 85.0 ± 18.5 m) and TUG (diplegia: 13.1 ± 13.1 s, hemiplegia: 6.9 ± 1.7 s), with the hemiplegic group having greater function. For total GGI score at GMFCS level II (diplegia: 244.7 ± 125.7, hemiplegia: 461.8 ± 419.1), diplegics had less gait devia-tion than hemiplegics (involved side). Strength scores were similar between those with hemiplegia and those with diplegia. Differences were seen in normalized hip abductors (diplegia: 2.0 ± .9, hemiplegia: 2.3 ± .9) and hip flexors (diplegia: 2.3 ± 1.1, hemiplegia: 2.9 ± 1.2), as well as normalized plantarflexor strength at GMFCS level I (diplegia: 3.3 ± 2.4, hemiplegia: 2.3 ± 1.7).
IV. DISCUSSION
The findings from this study are part of a broader multicenter study to identify factors that help explain the variance in measures of activity and participation accounting for CP type, severity level, and age. The descriptive statistics reported are representative of a group of ambulatory children with CP ranging from eight to 18 years of age.
The 1MWT is quick and easy, and requires minimal space to measure functional mobility and endurance. Our results are consistent with previous findings17 that the 1MWT can differentiate among severity levels and CP type. However, previous re-searchers did not stratify by CP type, and assessed only 34 participants among the four GMFCS levels.17 Based on our findings, clinicians can quickly assess and compare their patients to the mean distance of the 1MWT based on severity level and CP type.
While the TUG is a valid tool to assess balance in children with CP,18 it only detected differences between GMFCS levels I and III and levels II and III in the diplegic group. The TUG did not differentiate by severity level for the hemiplegic group. These findings are consistent with Gan et al.,29 who reported that the TUG and Berg balance scale (BBS) were unable to distinguish between GMFCS levels I and II in children with CP. However, in their study, the sample of 30 children was not stratified by CP type, and included children with diplegia, hemiplegia, quad-riplegia, ataxia, and athetosis. Although Williams et al.18 reported that the TUG can differentiate among GMFCS levels when stratified by CP type, only a small sample size was tested. Based on our findings, a more discriminative or more physi-cally challenging tool is necessary to measure differences in functional mobility in children with GMFCS levels I and II.
The GGI was able to differentiate among severity levels for children with diplegia, as well as between GMFCS levels, and the uninvolved and involved sides for children with hemiplegia. While these findings were consistent with Schutte et al.,26 the GGI only differentiated between individuals with hemiplegia and diplegia at GMFCS level II, but not for the less involved GMFCS level I group. Overall, the GGI is an accurate and reli-able tool to provide a global assessment of a patient’s gait deviations compared to peers.
Critical Reviews™ in Physical and Rehabilitation Medicine
10 Hassani et al
Surprisingly, activity and participation scores in this study did not differ by age. Previous studies reported that age is associated with gross motor function, activ-ity, and participation when stratified by GMFCS level.13,30 The GMFM has been reported to differentiate among age groups, showing that function deteriorates as a child with CP gets older primarily in levels III, IV, and V.30
Strength measures differed among age groups for both CP types. Specifically, the prepubescent group exhibited higher normalized strength values for several muscle groups when compared to the pubescent and postpubescent age groups. No previ-ous studies have stratified normalized strength values by age group, GMFCS level, and CP type. Muscle strength has been directly correlated with motor function in children with CP.31–34 Based on these findings, strength training may be indicated for children as they progress into puberty and adulthood.
In addition to age, muscle strength varied by GMFCS level for the hemiple-gic and diplegic groups. Participants exhibited greater muscle weakness as their GMFCS level increased. Wiley et al.16 reported lower extremity muscle weakness in ambulatory children with hemiplegia and diplegia compared to age-matched peers using the HHD, but did not stratify by GMFCS levels. To our knowledge, no study to date has stratified lower extremity muscle strength by both GMFCS level and CP type. The data reported from this study could assist therapists in baseline assessment and treatment goals. For example, if a child with diplegic CP (GMFCS level II) who ambulates 40 m for the 1MWT walks a significantly shorter distance than their peers (70 ± 17.3 m). Based on this comparison, a physi-cal therapist would focus on endurance and speed training to help the child reach their full potential.
A. Limitations
A potential limitation of the study was that there may have been differences be-tween evaluators for strength measurements despite standardization of the protocol and training of all assessors. Some difference may be due to the individual evalua-tor strength. Despite the significant differences in magnitude of the measurements among examiners, the study trends were the same for all evaluators. Isokinetic ma-chines could provide more accurate, reliable readings, but can be expensive and not always easily accessible or practical in a clinical setting. While the sample size was large, when the data were stratified by both CP type and GMFCS levels, the findings may be limited by the small sample size in GMFCS level II for the hemiplegic group.
V. CONCLUSION
Differences in strength and measure of activity and participation were found across GMFCS levels and CP type. For the diplegic group, strength data and the activity and participation measures of 1MWT, TUG, and GGI differed by severity level. For the hemiplegic group, the 1MWT and GGI differed by GMFCS level. The
Volume 23, Issue 1–4, 2011
Strength and Function in Ambulatory Children with Cerebral Palsy 11
1MWT, a simple, quick measure of endurance, proved to be discriminative among GMFCS levels and between CP types. The GGI was discriminative among GMFCS levels within each CP type.
This study enhanced our previous work by assessing strength and additional outcome tools to measure activity and participation across GMFCS levels, age, and CP type. Comparison data for lower extremity strength, 1MWT, TUG, and GGI by GMFCS level and CP type is provided. By comparing a child’s score to the reported data stratified by severity, age, and CP type, clinicians can use the data to determine treatment goals and assess long-term follow-up based on the patient’s matched peer group. Future work from this study includes analyzing relationships among the tools. Also, the longitudinal component of the study will allow us to measure changes in these tools over time in ambulatory children with CP.
ACKNOWLEDGMENTS
The Functional Assessment Research Group (FARG) acknowledges the funding of this work by the Shriner’s Hospitals for Children Grant No. 9158; the contribution of statistical consultant Dick Kryscio, PhD, Department of Biostatistics at the Uni-versity of Kentucky; Sylvia Õunpuu, M.Sc., coinvestigator, Connecticut Children’s Medical Center; and the research coordinators and motion analysis laboratory staff at all participating facilities for their roles in data collection, as well as the partici-pants and their families.
REFERENCES
1. Novacheck TF, Stout JL, Tervo R. Reliability and validity of the Gillette Func-tional Assessment Questionnaire as an outcome measure in children with walk-ing disabilities. J Pediatr Orthop. 2000 Jan-Feb;20(1):75–81.
2. Palisano R, Rosenbaum P, Walter S, Russell D, Wood E, Galuppi B. Develop-ment and reliability of a system to classify gross motor function in children with cerebral palsy. Dev Med Child Neurol. 1997 Apr;39(4):214–23.
3. McCabe MA, Granger CV. Content validity of a pediatric functional indepen-dence measure. Appl Nurs Res. 1990;3(3):120–2.
4. Daltroy LH, Liang MH, Fossel AH, Goldberg MJ. The POSNA pediatric mus-culoskeletal functional health questionnaire: report on reliability, validity, and sensitivity to change. Pediatric Outcomes Instrument Development Group. Pe-diatric Orthopaedic Society of North America. J Pediatr Orthop. 1998 Sep-Oct;18(5):561–71.
5. Ottenbacher KJ, Msall ME, Lyon NR, Duffy LC, Granger CV, Braun S. In-terrater agreement and stability of the Functional Independence Measure for Children (WeeFIM): use in children with developmental disabilities. Arch Phys Med Rehabil. 1997;78(12):1309–15.
Critical Reviews™ in Physical and Rehabilitation Medicine
12 Hassani et al
6. Oeffinger DJ, Tylkowski CM, Rayens MK, Davis RF, Gorton GE 3rd, D’Astous J, Nicholson DE, Damiano DL, Abel MF, Bagley AM, Luan J. Gross Motor Function Classification System and outcome tools for assessing ambulatory ce-rebral palsy: a multicenter study. Dev Med Child Neurol. 2004 May;46(5):311–9.
7. Sullivan E BD, Calmes J, Linton J, Damiano D, Oeffinger D, Tylkowski C, Abel M, Bagley A, Gorton G, Nicholson D, Rogers S. Relationships among pediatric measures utilized for assessment of functional outcomes in ambulatory chil-dren with cerebral palsy. Dev Med Child Neurol. 2007;49(5):338–44.
8. Bagley A, Gorton G, Oeffinger D, Barnes D, Calmes J, Nicholson D, Damiano D, Abel M, Kryscio R, Rogers S, Tylkowsk C. Outcome assessments in children with cerebral palsy, part II: discriminatory ability of outcome tools. Dev Med Child Neurol. 2007 Mar;49(3):181–6.
9. Oeffinger D, Gorton G, Bagley A, Nicholson D, Barnes D, Calmes J, Abel M, Damiano D, Kryscio R, Rogers S, Tylkowsk C. Outcome assessments in chil-dren with cerebral palsy, part I: descriptive characteristics of GMFCS Levels I to III. Dev Med Child Neurol. 2007 Mar;49(3):172–80.
10. Russell D, Rosenbaum, P., Avery, L., Lane, M. Gross motor function measure (gmfm-66 & gmfm-88) user’s manual. Clinics in Developmental Medicine No. 159. London: MacKeith Press; 2002.
11. Palisano RJ, Cameron D, Rosenbaum PL, Walter SD, Russell D. Stability of the gross motor function classification system. Dev Med Child Neurol. 2006 Jun;48(6):424–8.
12. Rosenbaum PL, Walter SD, Hanna SE, Palisano RJ, Russell DJ, Raina P, E. Wood E, Bartlett DJ, Galuppi BE. Prognosis for gross motor function in cerebral palsy: creation of motor development curves. Jama. 2002 Sep 18;288(11):1357–63.
13. Wright F, Rosenbaum, P, Goldsmith, C., Law, M., Fehlings, D. How do changes in body functions and structures, activity, and participation relate in children with cerebral palsy. Dev Med Child Neurol. 2008;50:283–9.
14. Damiano D, Abel M, Romness M, Oeffinger D, Tylkowski C, Gorton G, Bagley A, Nicholson D, Barnes D, Calmes J, Kryscio R, Rogers S. Comparing func-tional profiles of children with hemiplegic and diplegic cerebral palsy in GMF-CS Levels I and II: are separate classifications needed? Dev Med Child Neurol. 2006 Oct;48(10):797–803.
15. Stackhouse SA B-MS, Lee SC. Voluntary muscle activiation, contractile prop-erties, and fatigability in children with cerebral palsy: effects on gait character-istics and muscle strength. Muscle Nerve. 2005;31:594–601.
16. Wiley ME, Damiano DL. Lower-extremity strength profiles in spastic cerebral palsy. Dev Med Child Neurol. 1998 Feb;40(2):100–7.
17. McDowell BC, Kerr C, Parkes J, Cosgrove A. Validity of a 1 minute walk test for children with cerebral palsy. Dev Med Child Neurol. 2005 Nov;47(11):744–8.
Volume 23, Issue 1–4, 2011
Strength and Function in Ambulatory Children with Cerebral Palsy 13
18. Williams EN, Carroll SG, Reddihough DS, Phillips BA, Galea MP. Investiga-tion of the Timed ‘Up & Go’ test in children. Dev Med Child Neurol. 2005 Aug;47(8):518–24.
19. Andersson C, Grooten W, Hellsten M, Kaping K, Mattsson E. Adults with cerebral palsy: walking ability after progressive strength training. Dev Med Child Neurol. 2003 Apr;45(4):220–8.
20. Eekhof JA, De Bock GH, Schaapveld K, Springer MP. Short report: functional mobility assessment at home. Timed up and go test using three different chairs. Can Fam Physician. 2001 Jun;47:1205–7.
21. Geiger RA, Allen JB, O’Keefe J, Hicks RR. Balance and mobility fol-lowing stroke: effects of physical therapy interventions with and without biofeedback/forceplate training. Phys Ther. 2001 Apr;81(4):995–1005.
22. Shumway-Cook A, Brauer S, Woollacott M. Predicting the probability for falls in community-dwelling older adults using the Timed Up & Go Test. Phys Ther. 2000 Sep;80(9):896–903.
23. Westcott SL, Lowes LP, Richardson PK. Evaluation of postural stabil-ity in children: current theories and assessment tools. Phys Ther. 1997 Jun;77(6):629–45.
24. Schwartz MH, Rozumalski A. The Gait Deviation Index: a new compre-hensive index of gait pathology. Gait Posture. 2008 Oct;28(3):351–7.
25. Romei M, Galli M, Motta F, Schwartz M, Crivellini M. Use of the nor-malcy index for the evaluation of gait pathology. Gait Posture. 2004 Feb;19(1):85–90.
26. Schutte LM, Narayanan U, Stout JL, Selber P, Gage JR, Schwartz MH. An index for quantifying deviations from normal gait. Gait Posture. 2000 Feb;11(1):25–31.
27. Oeffinger D, Tylkowski C, Gorton G, Bagley A, Nicholson D, Barnes D, Calmes J, Abel M, Damiano D, Kryscio R, Rogers S. Outcome tools commonly used in ambulatory children with cerebral palsy: Part I—descriptive characteristics. Dev Med Child Neurol. 2007;49:172–80.
28. Gorton GE 3rd, Abel MF, Oeffinger DJ, Bagley A, Rogers SP, Damiano D, Romness M, Tylkowski C. A prospective cohort study of the effects of lower extremity orthopaedic surgery on outcome measures in ambulato-ry children with cerebral palsy. J Pediatr Orthop. 2009 Dec;29(8):903–9.
29. Gan S, Tung L, Tang Y, Wang C. Psychometric properties of functional balance assessment in children with cerebral palsy. Neurorehab Neural Repair. 2008;22(6):745–53.
30. Hanna S, Rosenbaum,PL, Bartlett, DJ, Palisano RJ, Walter SD, Avery L, Russell DJ. Stability and decline in gross motor function among children and youth with cerebral palsy aged 2 to 21 years. Dev Med Child Neurol. 2009;51(4):295–302.
Critical Reviews™ in Physical and Rehabilitation Medicine
14 Hassani et al
31. Kramer J, MacPhail H. Relationships among measures of walking ef-ficiency, gross motor ability, and isokinetic strength in adolescents with cerebral palsy. Pediatr Phys Ther. 1994;6:3–8.
32. MacPhail HE, Kramer JF. Effect of isokinetic strength-training on functional ability and walking efficiency in adolescents with cerebral palsy. Dev Med Child Neurol. 1995 Sep;37(9):763–75.
33. Russell DJ, Rosenbaum PL, Cadman DT, Gowland C, Hardy S, Jarvis S. The gross motor function measure: a means to evaluate the effects of physical ther-apy. Dev Med Child Neurol. 1989 Jun;31(3):341–52.
34. Damiano DL, Kelly LE, Vaughn CL. Effects of quadriceps femoris muscle strengthening on crouch gait in children with spastic diplegia. Phys Ther. 1995 Aug;75(8):658–67; discussion 68–71.