Embed Size (px)
Citation preview
7/30/2019 Assessment of Target Purity Difference for a Louisiana Sugar Mill
http://slidepdf.com/reader/full/assessment-of-target-purity-difference-for-a-louisiana-sugar-mill 1/115
ASSESSMENT OF TARGET PURITY DIFFERENCE FOR A LOUISIANA SUGAR
MILL
A Thesis
Submitted to the Graduate Faculty of theLouisiana State University andEngineering College
in partial fulfillment of therequirements for the degree of
Master of Science in Chemical Engineering
In
The Department of Chemical Engineering
byLuz Stella Polanco
B.S., Universidad del Valle, Cali-Colombia, 1989August 2009
7/30/2019 Assessment of Target Purity Difference for a Louisiana Sugar Mill
http://slidepdf.com/reader/full/assessment-of-target-purity-difference-for-a-louisiana-sugar-mill 2/115
In memory of my loving mother:
ii
Ana Maria Duque
April 27, 2007
7/30/2019 Assessment of Target Purity Difference for a Louisiana Sugar Mill
http://slidepdf.com/reader/full/assessment-of-target-purity-difference-for-a-louisiana-sugar-mill 3/115
iii
ACKNOWLEDGMENTS
I would like to thank Mr. Willard Legendre, plant manager of M. A. Patout & Son, Ltd. –
Enterprise Factory for participating on this research and to Dr. Donal Day, Professor, Audubon
Sugar Institute, for his guidance, encouragement and suggestions.
Special thank goes to Dr. Benjamin L. Legendre, Professor and Head, Audubon Sugar Institute,
for allowing me to develop and conduct this project at Enterprise Factory. In addition, I thank the
Audubon Sugar Institute faculty and staff for their collaboration, especially Jeanie Stein, Iryna
Tishechkina, Chardcie Verret and Dr. Lee Madsen.
I would like to give a special recognition to Dr. Peter Rein for his great support since I started
the Masters program and for his special recommendations throughout the development of this
project. His handbook “Cane Sugar Engineering” (Rein, 2007) was one of the most valuable
references for this work.
I also would like to thank to Dr Ralph Pike and Dr. James E. Henry from the Chemical
Engineering Department for being members of my committee.
7/30/2019 Assessment of Target Purity Difference for a Louisiana Sugar Mill
http://slidepdf.com/reader/full/assessment-of-target-purity-difference-for-a-louisiana-sugar-mill 4/115
iv
TABLE OF CONTENTS
ACKNOWLEDGMENTS……………………………………………………………………………iii
ABSTRACT…………………………………………………………………………………………vii
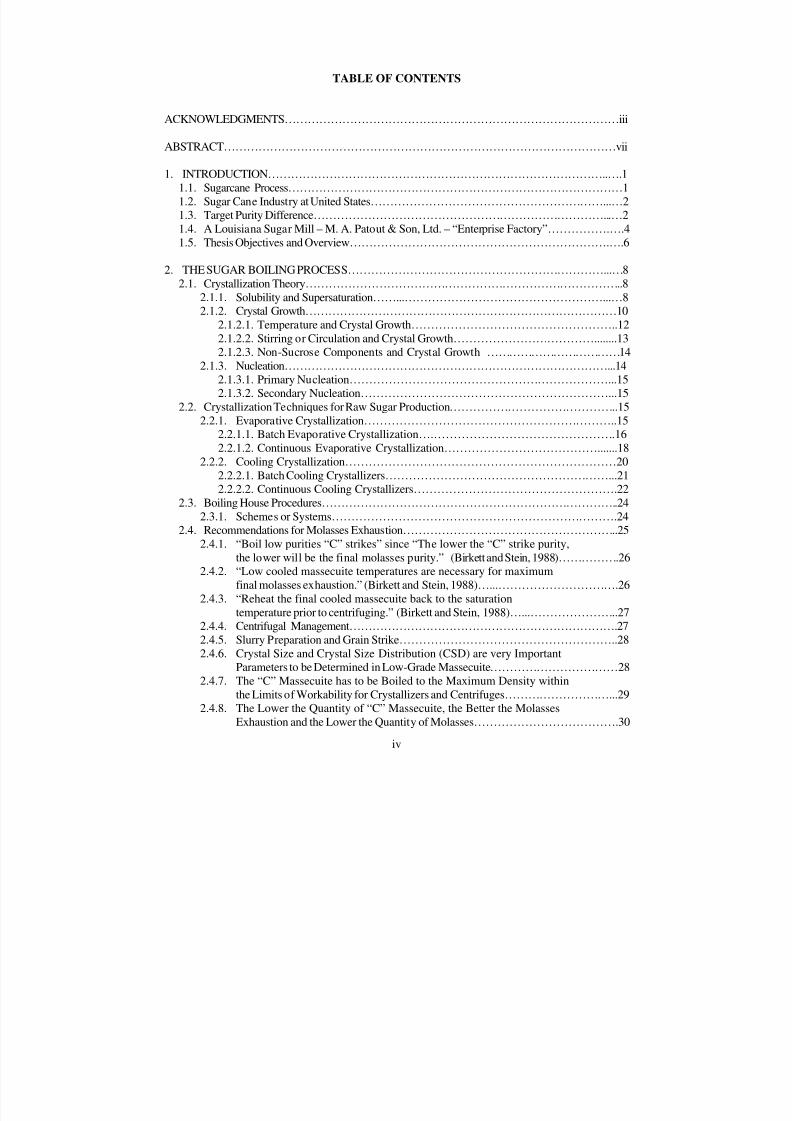
1. INTRODUCTION……………………………………………………………………………..….11.1. Sugarcane Process……………………………………………………………………………11.2. Sugar Cane Industry at United States……………………………………………………...…21.3. Target Purity Difference…………………………………………………………………...…21.4. A Louisiana Sugar Mill – M. A. Patout & Son, Ltd. – “Enterprise Factory”…………….….41.5. Thesis Objectives and Overview………………………………………………………….….6
2. THE SUGAR BOILING PROCESS…………………………………………………………...…82.1. Crystallization Theory………………………………………………………………………..8
2.1.1. Solubility and Supersaturation……...……………………………………………...…82.1.2. Crystal Growth………………………………………………………………………102.1.2.1. Temperature and Crystal Growth……………………………………………..122.1.2.2. Stirring or Circulation and Crystal Growth………………………………........132.1.2.3. Non-Sucrose Components and Crystal Growth ………………………………14
2.1.3. Nucleation…………………………………………………………………………...142.1.3.1. Primary Nucleation…………………………………………………………...152.1.3.2. Secondary Nucleation………………………………………………………...15
2.2. Crystallization Techniques for Raw Sugar Production……………………………………..152.2.1. Evaporative Crystallization………………………………………………………..15
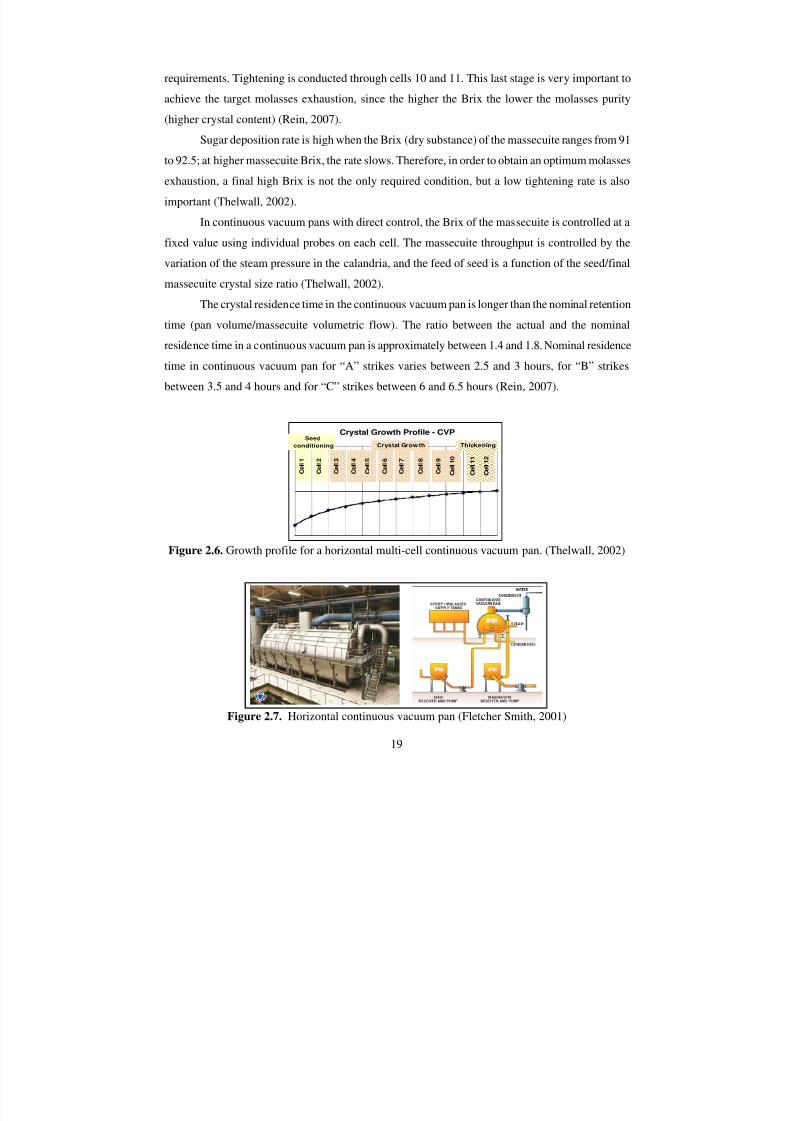
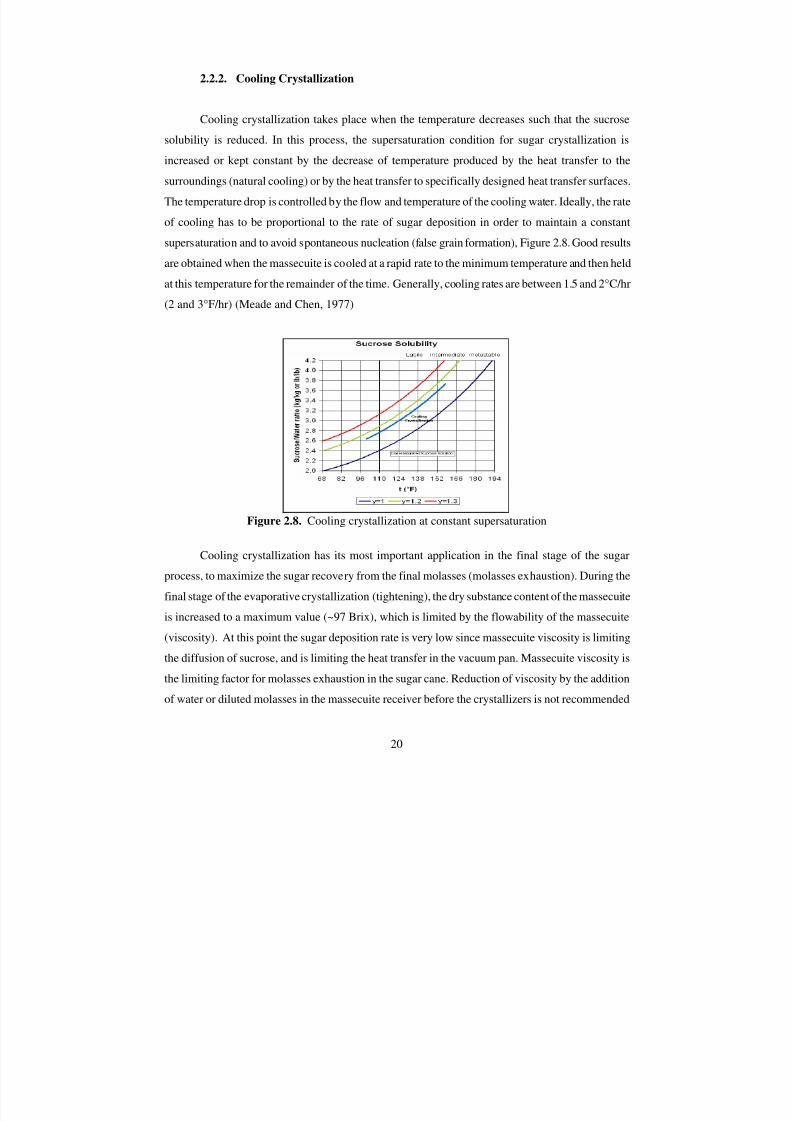
2.2.1.1. Batch Evaporative Crystallization….……………………………………….162.2.1.2. Continuous Evaporative Crystallization………………………………….......18
2.2.2. Cooling Crystallization……………………………………………………………202.2.2.1. Batch Cooling Crystallizers…………………………………………………...212.2.2.2. Continuous Cooling Crystallizers…………………………………………….22
2.3. Boiling House Procedures…………………………………………………………………..242.3.1. Schemes or Systems……………………………………………………………….24
2.4. Recommendations for Molasses Exhaustion………………………………………………..252.4.1. “Boil low purities “C” strikes” since “The lower the “C” strike purity,
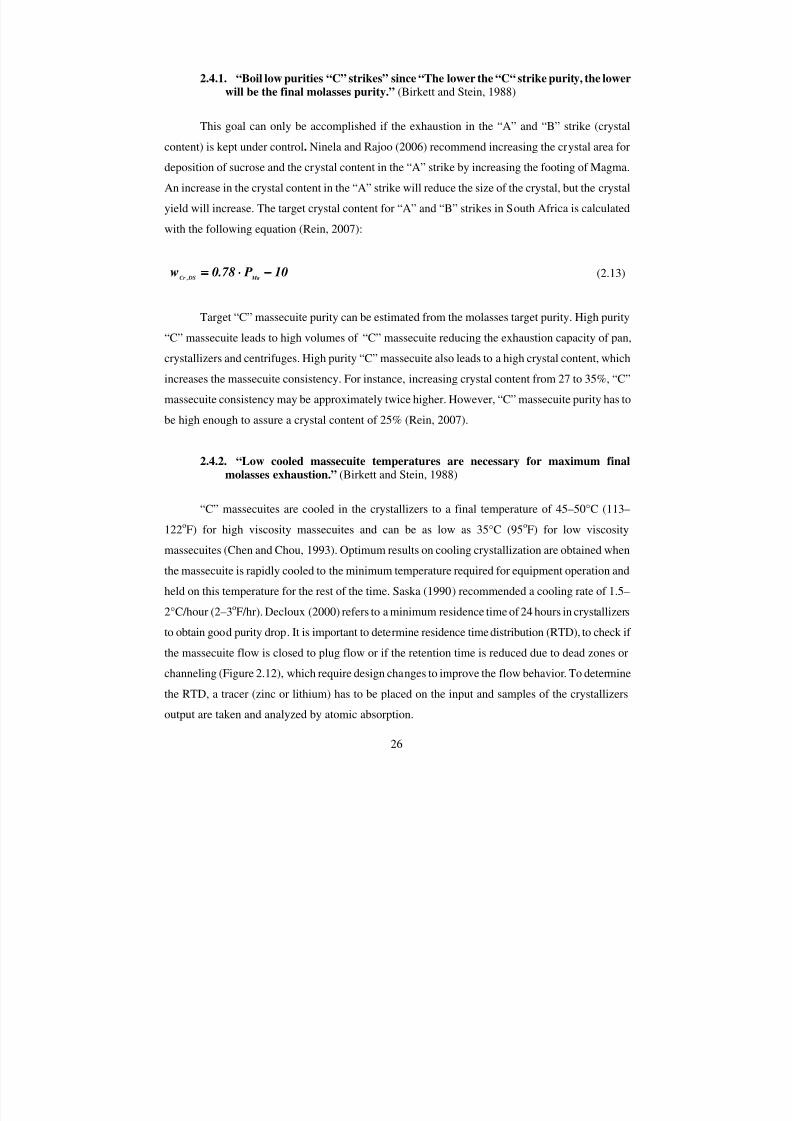
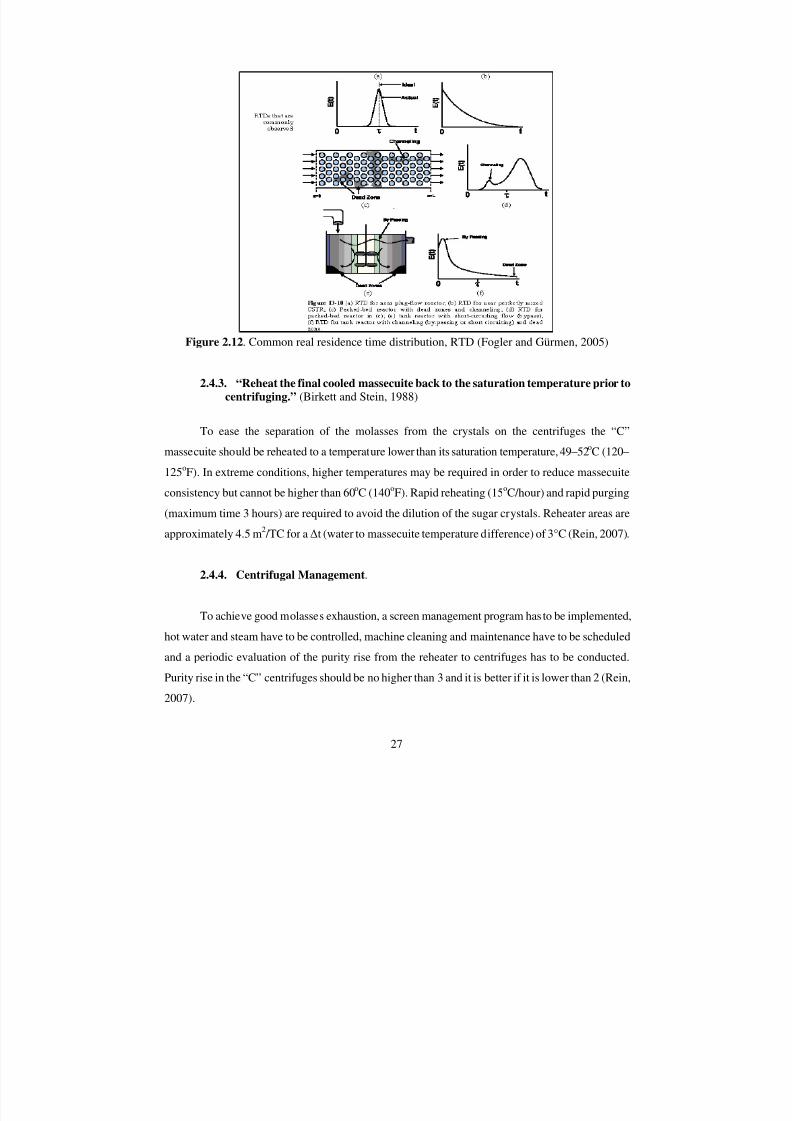
the lower will be the final molasses purity.” (Birkett and Stein, 1988)…………….262.4.2. “Low cooled massecuite temperatures are necessary for maximum
final molasses exhaustion.” (Birkett and Stein, 1988)…...………………………….262.4.3. “Reheat the final cooled massecuite back to the saturation
temperature prior to centrifuging.” (Birkett and Stein, 1988)…...…………………..272.4.4. Centrifugal Management…………………………………………………………….272.4.5. Slurry Preparation and Grain Strike………………………………………………..282.4.6. Crystal Size and Crystal Size Distribution (CSD) are very Important
Parameters to be Determined in Low-Grade Massecuite……………………………282.4.7. The “C” Massecuite has to be Boiled to the Maximum Density within
the Limits of Workability for Crystallizers and Centrifuges………………………...292.4.8. The Lower the Quantity of “C” Massecuite, the Better the Molasses
Exhaustion and the Lower the Quantity of Molasses……………………………….30
7/30/2019 Assessment of Target Purity Difference for a Louisiana Sugar Mill
http://slidepdf.com/reader/full/assessment-of-target-purity-difference-for-a-louisiana-sugar-mill 5/115
v
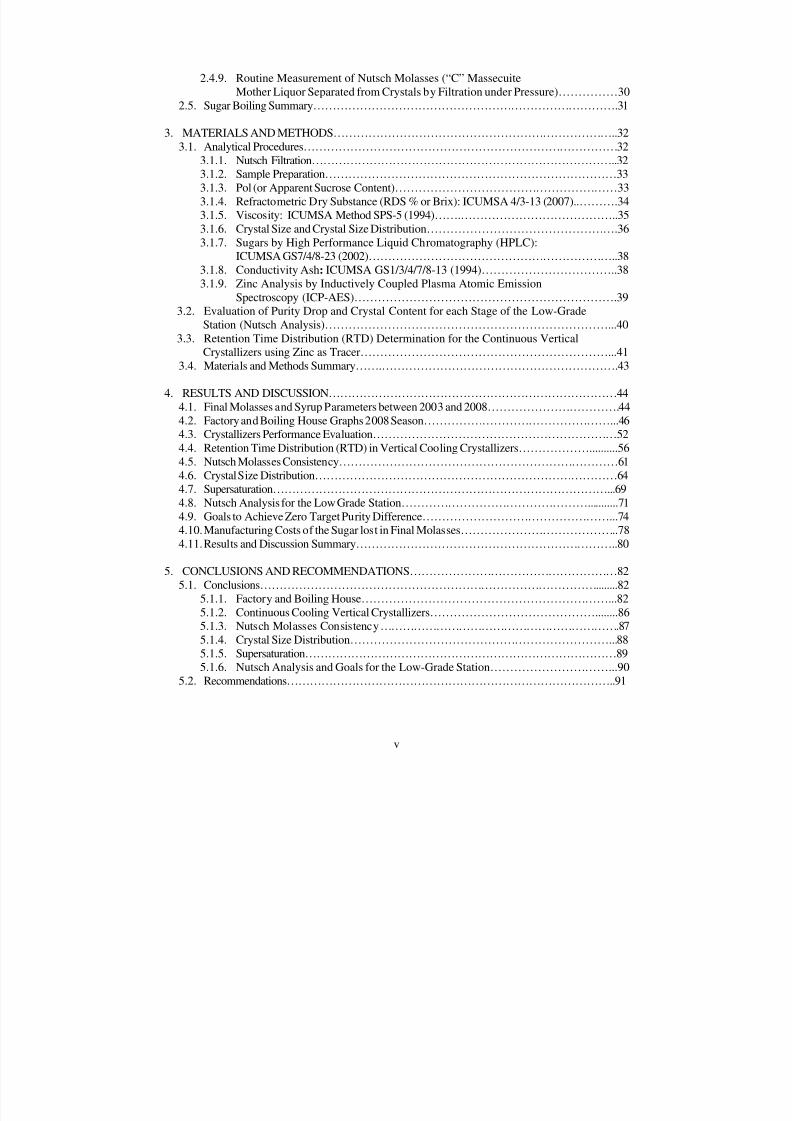
2.4.9. Routine Measurement of Nutsch Molasses (“C” MassecuiteMother Liquor Separated from Crystals by Filtration under Pressure)……………30
2.5. Sugar Boiling Summary…………………………………………………………………….31
3. MATERIALS AND METHODS………………………………………………………………..32
3.1. Analytical Procedures………………………………………………………………………323.1.1. Nutsch Filtration……………………………………………………………………..323.1.2. Sample Preparation…………………………………………………………………333.1.3. Pol (or Apparent Sucrose Content)…………………………………………………333.1.4. Refractometric Dry Substance (RDS % or Brix): ICUMSA 4/3-13 (2007)..……….343.1.5. Viscosity: ICUMSA Method SPS-5 (1994)…….…………………………………..353.1.6. Crystal Size and Crystal Size Distribution………………………………………….363.1.7. Sugars by High Performance Liquid Chromatography (HPLC):
ICUMSA GS7/4/8-23 (2002)………………………………………………………..383.1.8. Conductivity Ash: ICUMSA GS1/3/4/7/8-13 (1994)……………………………..383.1.9. Zinc Analysis by Inductively Coupled Plasma Atomic Emission
Spectroscopy (ICP-AES)………………………………………………………….393.2. Evaluation of Purity Drop and Crystal Content for each Stage of the Low-GradeStation (Nutsch Analysis)………………………………………………………………...40
3.3. Retention Time Distribution (RTD) Determination for the Continuous VerticalCrystallizers using Zinc as Tracer………………………………………………………...41
3.4. Materials and Methods Summary…….…………………………………………………….43
4. RESULTS AND DISCUSSION…………………………………………………………………444.1. Final Molasses and Syrup Parameters between 2003 and 2008…………………………….444.2. Factory and Boiling House Graphs 2008 Season…………………………………………...464.3. Crystallizers Performance Evaluation………………………………………………………524.4. Retention Time Distribution (RTD) in Vertical Cooling Crystallizers………………..........564.5. Nutsch Molasses Consistency………………………………………………………………614.6. Crystal Size Distribution……………………………………………………………………644.7. Supersaturation……………………………………………………………………………...694.8. Nutsch Analysis for the Low Grade Station…………………………………………...........714.9. Goals to Achieve Zero Target Purity Difference…………………………………………...744.10. Manufacturing Costs of the Sugar lost in Final Molasses…………………………………..784.11. Results and Discussion Summary…………………………………………………………..80
5. CONCLUSIONS AND RECOMMENDATIONS………………………………………………825.1. Conclusions……………………………………………………………………………........82
5.1.1. Factory and Boiling House………………………………………………………...825.1.2. Continuous Cooling Vertical Crystallizers……………………………………........865.1.3. Nutsch Molasses Consistency ……………………………………………………….875.1.4. Crystal Size Distribution…………………………………………………………...885.1.5. Supersaturation………………………………………………………………………895.1.6. Nutsch Analysis and Goals for the Low-Grade Station…………………………...90
5.2. Recommendations…………………………………………………………………………..91

7/30/2019 Assessment of Target Purity Difference for a Louisiana Sugar Mill
http://slidepdf.com/reader/full/assessment-of-target-purity-difference-for-a-louisiana-sugar-mill 6/115
vi
REFERENCES…………………………………………………………………………………........92
APPENDIX A. GENERAL FORMULATIONS……………………………………………….........96
APPENDIX B. TOTAL COLLECTED DATA……………………………………………….........104
VITA………………………………………………………………………………………………..108
7/30/2019 Assessment of Target Purity Difference for a Louisiana Sugar Mill
http://slidepdf.com/reader/full/assessment-of-target-purity-difference-for-a-louisiana-sugar-mill 7/115
vii
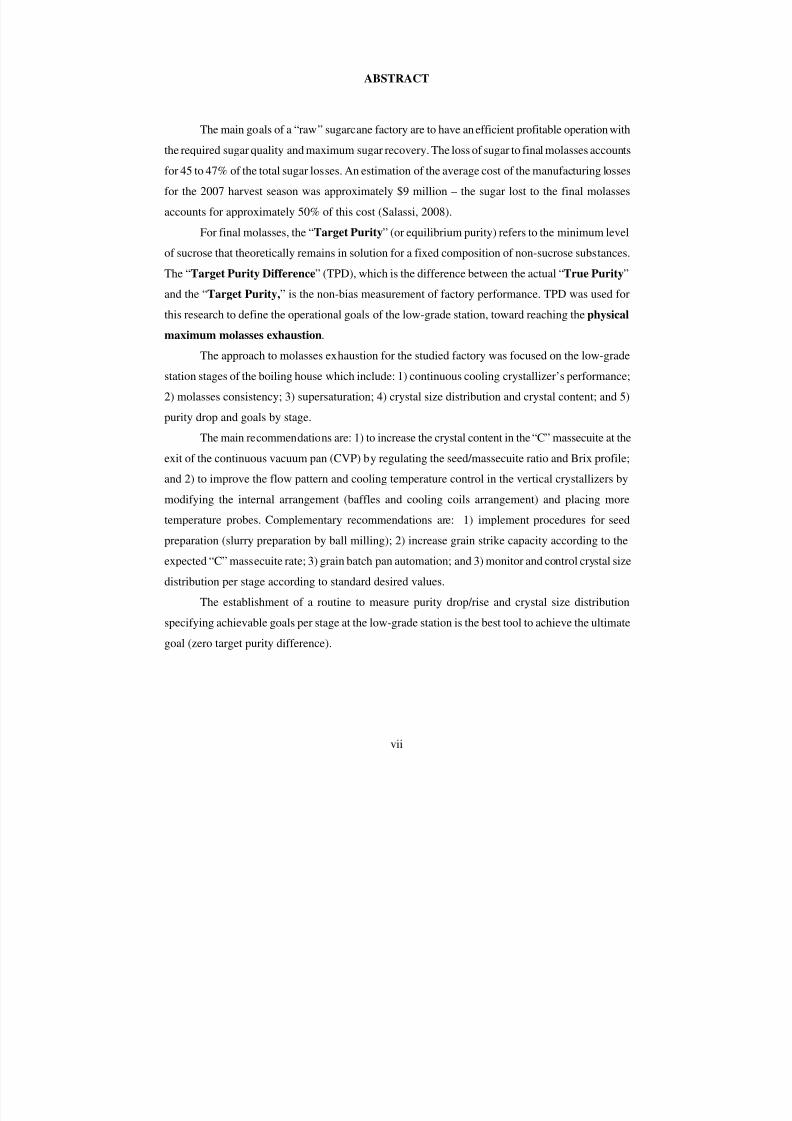
ABSTRACT
The main goals of a “raw” sugarcane factory are to have an efficient profitable operation with
the required sugar quality and maximum sugar recovery. The loss of sugar to final molasses accounts
for 45 to 47% of the total sugar losses. An estimation of the average cost of the manufacturing losses
for the 2007 harvest season was approximately $9 million – the sugar lost to the final molasses
accounts for approximately 50% of this cost (Salassi, 2008).
For final molasses, the “Target Purity” (or equilibrium purity) refers to the minimum level
of sucrose that theoretically remains in solution for a fixed composition of non-sucrose substances.
The “Target Purity Difference” (TPD), which is the difference between the actual “True Purity”
and the “Target Purity,” is the non-bias measurement of factory performance. TPD was used for
this research to define the operational goals of the low-grade station, toward reaching the physical
maximum molasses exhaustion.
The approach to molasses exhaustion for the studied factory was focused on the low-grade
station stages of the boiling house which include: 1) continuous cooling crystallizer’s performance;
2) molasses consistency; 3) supersaturation; 4) crystal size distribution and crystal content; and 5)
purity drop and goals by stage.
The main recommendations are: 1) to increase the crystal content in the “C” massecuite at the
exit of the continuous vacuum pan (CVP) by regulating the seed/massecuite ratio and Brix profile;
and 2) to improve the flow pattern and cooling temperature control in the vertical crystallizers by
modifying the internal arrangement (baffles and cooling coils arrangement) and placing more
temperature probes. Complementary recommendations are: 1) implement procedures for seed
preparation (slurry preparation by ball milling); 2) increase grain strike capacity according to the
expected “C” massecuite rate; 3) grain batch pan automation; and 3) monitor and control crystal size
distribution per stage according to standard desired values.
The establishment of a routine to measure purity drop/rise and crystal size distributionspecifying achievable goals per stage at the low-grade station is the best tool to achieve the ultimate
goal (zero target purity difference).
7/30/2019 Assessment of Target Purity Difference for a Louisiana Sugar Mill
http://slidepdf.com/reader/full/assessment-of-target-purity-difference-for-a-louisiana-sugar-mill 8/115
1
1. INTRODUCTION
1.1. Sugarcane Process
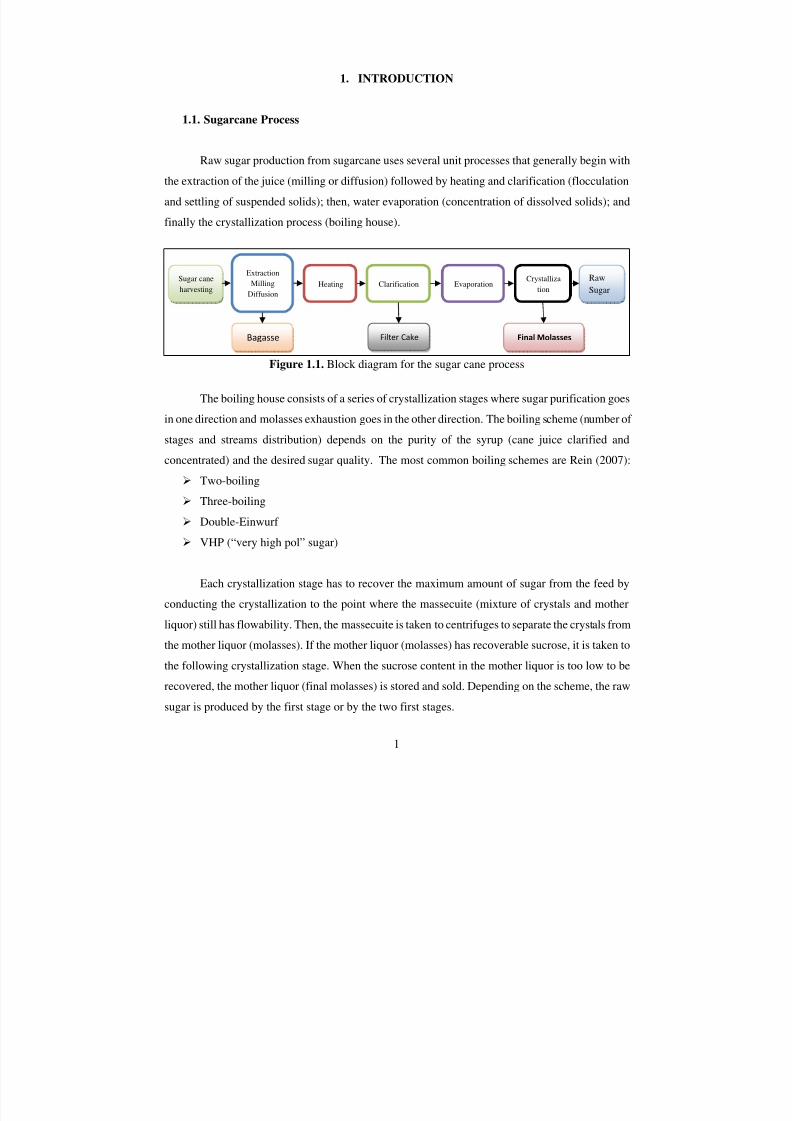
Raw sugar production from sugarcane uses several unit processes that generally begin with
the extraction of the juice (milling or diffusion) followed by heating and clarification (flocculation
and settling of suspended solids); then, water evaporation (concentration of dissolved solids); and
finally the crystallization process (boiling house).
Figure 1.1. Block diagram for the sugar cane process
The boiling house consists of a series of crystallization stages where sugar purification goes
in one direction and molasses exhaustion goes in the other direction. The boiling scheme (number of
stages and streams distribution) depends on the purity of the syrup (cane juice clarified and
concentrated) and the desired sugar quality. The most common boiling schemes are Rein (2007):
Two-boiling
Three-boiling
Double-Einwurf
VHP (“very high pol” sugar)
Each crystallization stage has to recover the maximum amount of sugar from the feed by
conducting the crystallization to the point where the massecuite (mixture of crystals and motherliquor) still has flowability. Then, the massecuite is taken to centrifuges to separate the crystals from
the mother liquor (molasses). If the mother liquor (molasses) has recoverable sucrose, it is taken to
the following crystallization stage. When the sucrose content in the mother liquor is too low to be
recovered, the mother liquor (final molasses) is stored and sold. Depending on the scheme, the raw
sugar is produced by the first stage or by the two first stages.
Bagasse Filter Cake Final Molasses
Sugar cane
harvesting
Extraction
Milling
Diffusion
Heating Clarification EvaporationCrystalliza
tion
Raw
Sugar
7/30/2019 Assessment of Target Purity Difference for a Louisiana Sugar Mill
http://slidepdf.com/reader/full/assessment-of-target-purity-difference-for-a-louisiana-sugar-mill 9/115
2
1.2. Sugar Cane Industry at United States
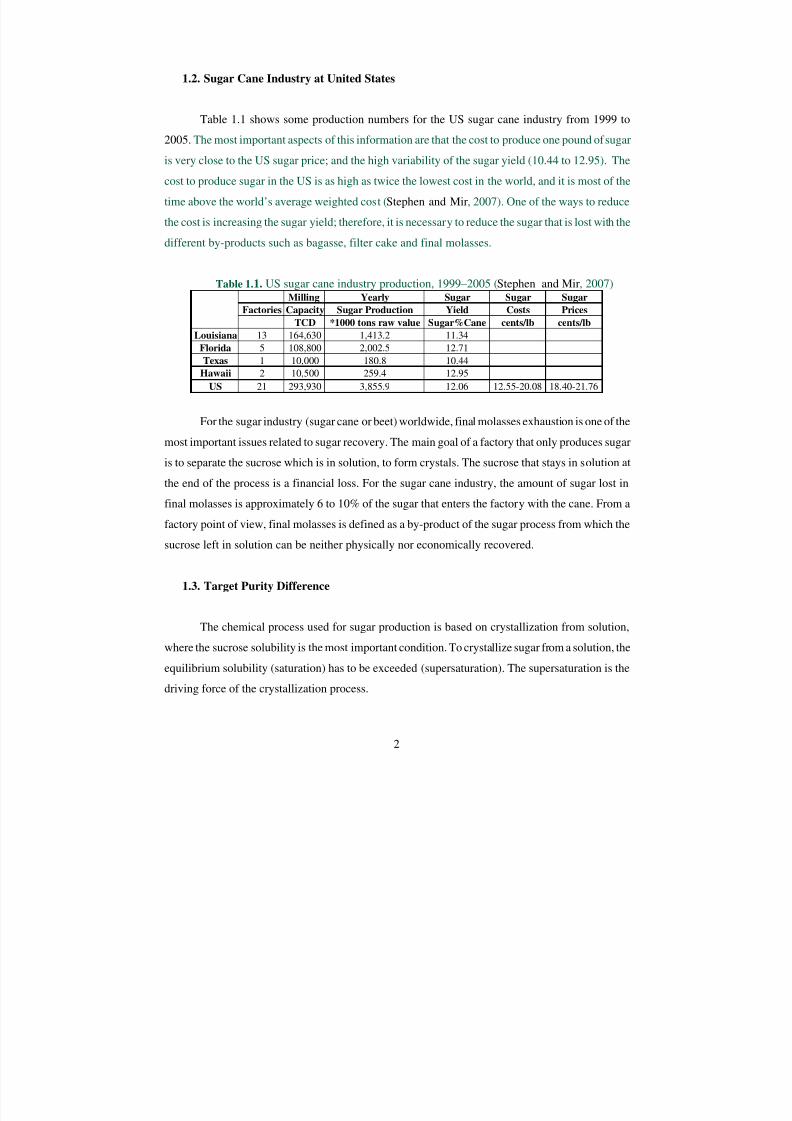
Table 1.1 shows some production numbers for the US sugar cane industry from 1999 to
2005. The most important aspects of this information are that the cost to produce one pound of sugar
is very close to the US sugar price; and the high variability of the sugar yield (10.44 to 12.95). The
cost to produce sugar in the US is as high as twice the lowest cost in the world, and it is most of the
time above the world’s average weighted cost (Stephen and Mir, 2007). One of the ways to reduce
the cost is increasing the sugar yield; therefore, it is necessary to reduce the sugar that is lost with the
different by-products such as bagasse, filter cake and final molasses.
Table 1.1. US sugar cane industry production, 1999–2005 (Stephen and Mir, 2007)
For the sugar industry (sugar cane or beet) worldwide, final molasses exhaustion is one of the
most important issues related to sugar recovery. The main goal of a factory that only produces sugar
is to separate the sucrose which is in solution, to form crystals. The sucrose that stays in solution at
the end of the process is a financial loss. For the sugar cane industry, the amount of sugar lost in
final molasses is approximately 6 to 10% of the sugar that enters the factory with the cane. From a
factory point of view, final molasses is defined as a by-product of the sugar process from which the
sucrose left in solution can be neither physically nor economically recovered.
1.3. Target Purity Difference
The chemical process used for sugar production is based on crystallization from solution,
where the sucrose solubility is the most important condition. To crystallize sugar from a solution, the
equilibrium solubility (saturation) has to be exceeded (supersaturation). The supersaturation is the
driving force of the crystallization process.
Milling Yearly Sugar Sugar Sugar
Factories Capacity Sugar Production Yield Costs Prices
TCD *1000 tons raw value Sugar%Cane cents/lb cents/lb
Louisiana 13 164,630 1,413.2 11.34
Florida 5 108,800 2,002.5 12.71
Texas 1 10,000 180.8 10.44
Hawaii 2 10,500 259.4 12.95
US 21 293,930 3,855.9 12.06 12.55-20.08 18.40-21.76
7/30/2019 Assessment of Target Purity Difference for a Louisiana Sugar Mill
http://slidepdf.com/reader/full/assessment-of-target-purity-difference-for-a-louisiana-sugar-mill 10/115
3
The equilibrium solubility (saturation) for an impure sucrose solution is not the same as that
for a pure sucrose solution. On the other hand, type and composition of the impurities in solution not
only affects the equilibrium solubility but also affects the crystallization process. The type and
composition of the impurities may increase or decrease viscosity (diffusion mechanism) and/or
change the crystal habit (sucrose attachment to a crystal site).
Decloux (2000) presented a very comprehensive literature review about molasses exhaustion
for the sugar cane and the sugar beet industries. This document states than the type and composition
of the non-sucrose substances in the sugar beet raw juice are different from that in the sugar cane
raw juice; therefore, their influences in the crystallization process are different and the approach to
the minimum level of sucrose in the final molasses is also different. While the beet industry uses the
“polish test” (exhaustion test) the sugar cane industry uses “Target Purity” (or equilibrium purity).
The “Target Purity” is the minimum amount of sucrose in solution as a % of the total amount
of dissolved solids, which can be physically achieved under specified controlled conditions. Several
target purity formulas have been proposed in the literature, and most of them correlate the molasses
“equilibrium” purity with the ratio between the reducing sugars (glucose and fructose) and the total
amount of ash (Rein, 2007). The differences can be attributed to different analytical methods and to
different exhaustion test conditions (cooling temperature and molasses viscosity). Large differences
on non-sucrose composition can also affect this correlation.
The Target Purity formula (equation 1) used by Audubon Sugar Institute was determined in
South Africa (Rein and Smith, 1981) at the laboratory level while controlling cooling temperature
(40 ºC), stirring (12 rpm), retention time (48 hours) and viscosity (above 300 Pa-s). The formula
recognizes the factory equipment limitation for handling high viscosities and that there is no further
improvement in sucrose recovery for viscosities of mother liquor above 300 Pa•s at 40°C (104°F)
Rein (2007).
“Target Purity” =
+
⋅−= Ash
FG
log13.4 33.9 PTarget (1)
G + F = Glucose plus Fructose (reducing sugars, RS) concentration by HPLC
Ash= Conductivity Ash (A)
Rein (2007) mentions several important reasons that justify the broad applicability of the
Target Purity formula; in addition, Saska (1999) tested its validity for Louisiana final molasses.
7/30/2019 Assessment of Target Purity Difference for a Louisiana Sugar Mill
http://slidepdf.com/reader/full/assessment-of-target-purity-difference-for-a-louisiana-sugar-mill 11/115
Target Purity Differenc
Target Purity for a particular fi
actual factory performance with
correspondent financial gain. A
Louisiana, a TPD=0 is not comm
best factories have a TPD betwe
producing countries showed tha
Lionnet, 1999).
A limitation of TPD is n
formation. Nevertheless, Target
the “low grade station” and also t
changes on this stage are lower t
1.4. A Louisiana Sugar Mil
M. A. Patout & Son, Lt
factory in United States), and it is
of Jeanerette, LA (M. A. Patout
Figure 1.2. “
4
e (TPD) is the difference between the actual Tr
al molasses. The final molasses TPD can be us
other factories, showing the opportunity for im
plying the same Target Purity formula used i
on, rather, average factories have a TPD betwee
en 2 and 3 (Rein, 2007). An analytical survey
t the most frequent TPDs were between 3 and
ot taking into account what happened before t
urity Difference is a very good tool to evaluate t
evaluate the performance of the whole boiling h
han the ones that have been produced downstre
l – M. A. Patout & Son, Ltd. – “Enterprise F
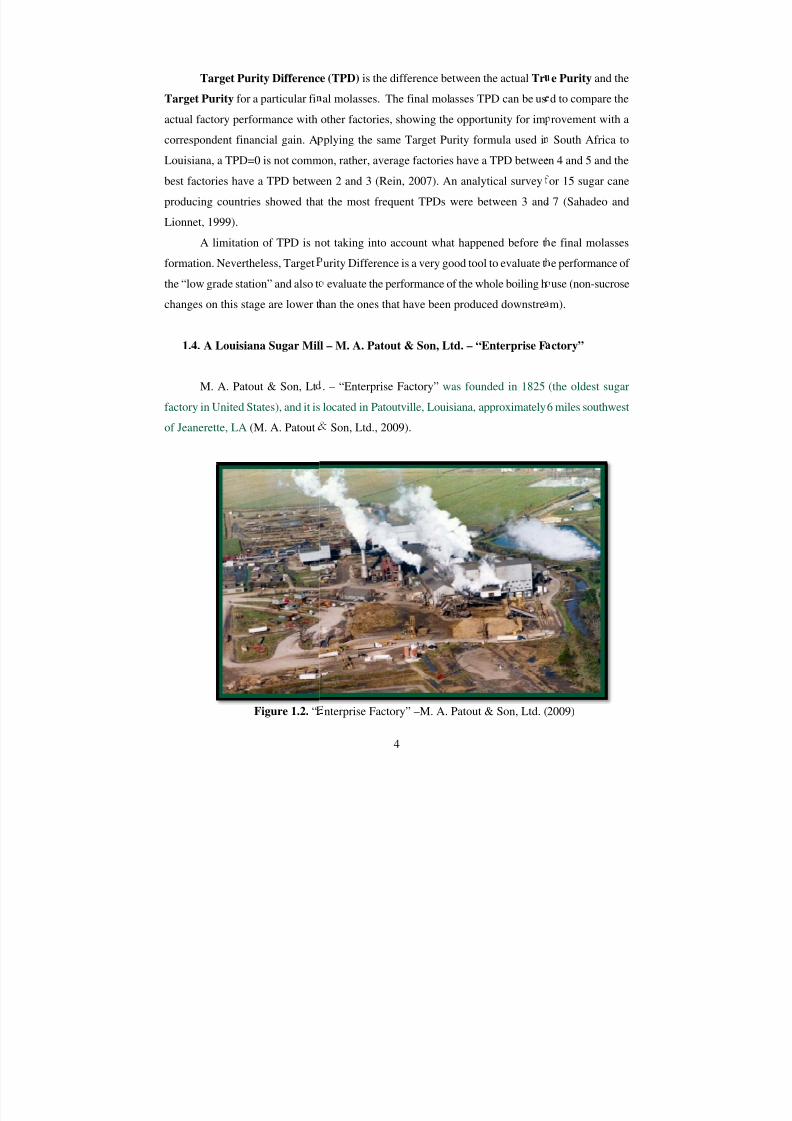
. – “Enterprise Factory” was founded in 1825
located in Patoutville, Louisiana, approximately
Son, Ltd., 2009).
nterprise Factory” –M. A. Patout & Son, Ltd. (
e Purity and the
d to compare the
rovement with a
South Africa to
n 4 and 5 and the
or 15 sugar cane
7 (Sahadeo and
e final molasses
e performance of
use (non-sucrose
m).
ctory”
(the oldest sugar
6 miles southwest
2009)
7/30/2019 Assessment of Target Purity Difference for a Louisiana Sugar Mill
http://slidepdf.com/reader/full/assessment-of-target-purity-difference-for-a-louisiana-sugar-mill 12/115
5
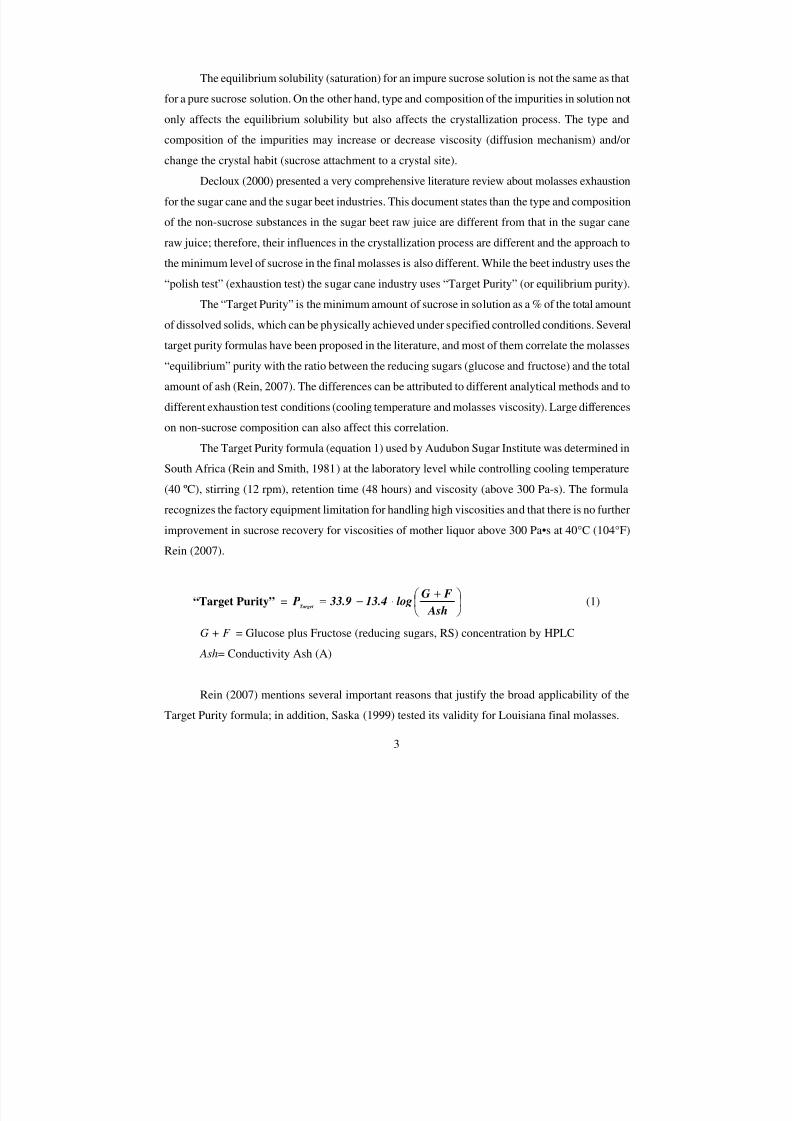
“Enterprise Factory” has a milling capacity of 22,000 tons of cane per day (TCD), from
which 10,000 tons of cane are processed in a diffuser. Figure 1.3 shows a block diagram which
approximately describes the stages and streams distribution for the double-Einwurf boiling scheme
used at Enterprise.
Figure 1.3. Double-Einwurf boiling scheme
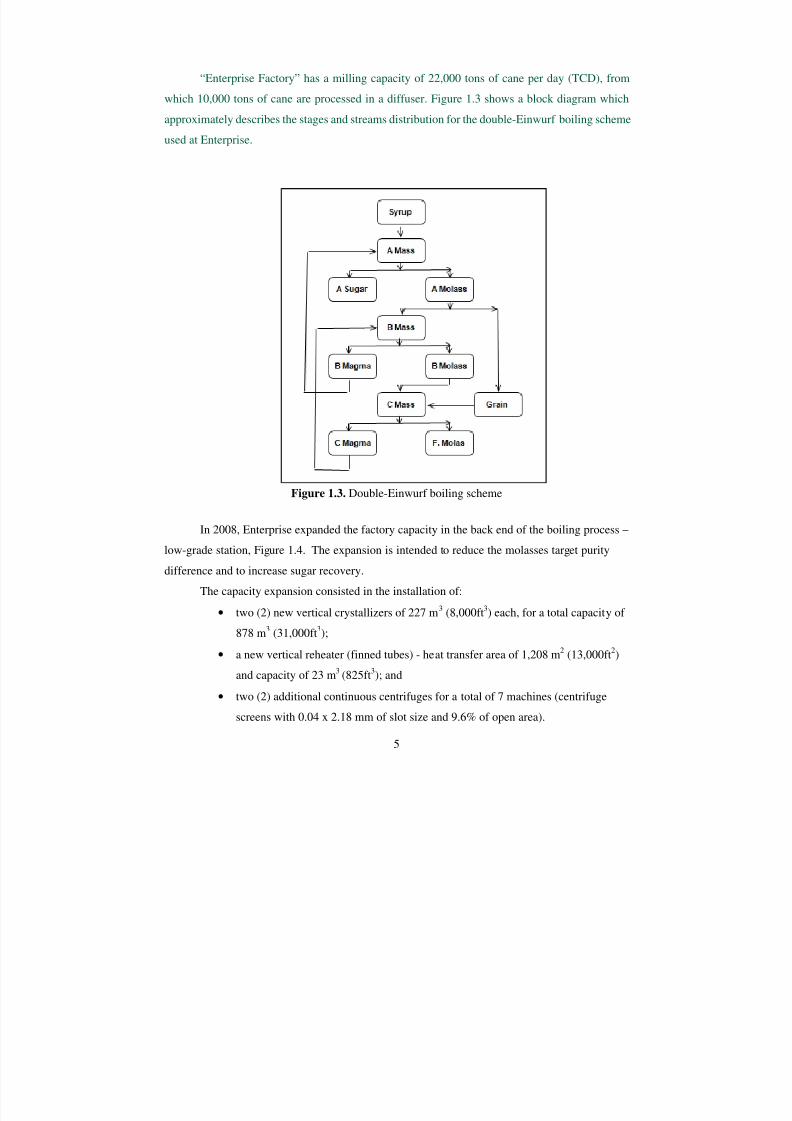
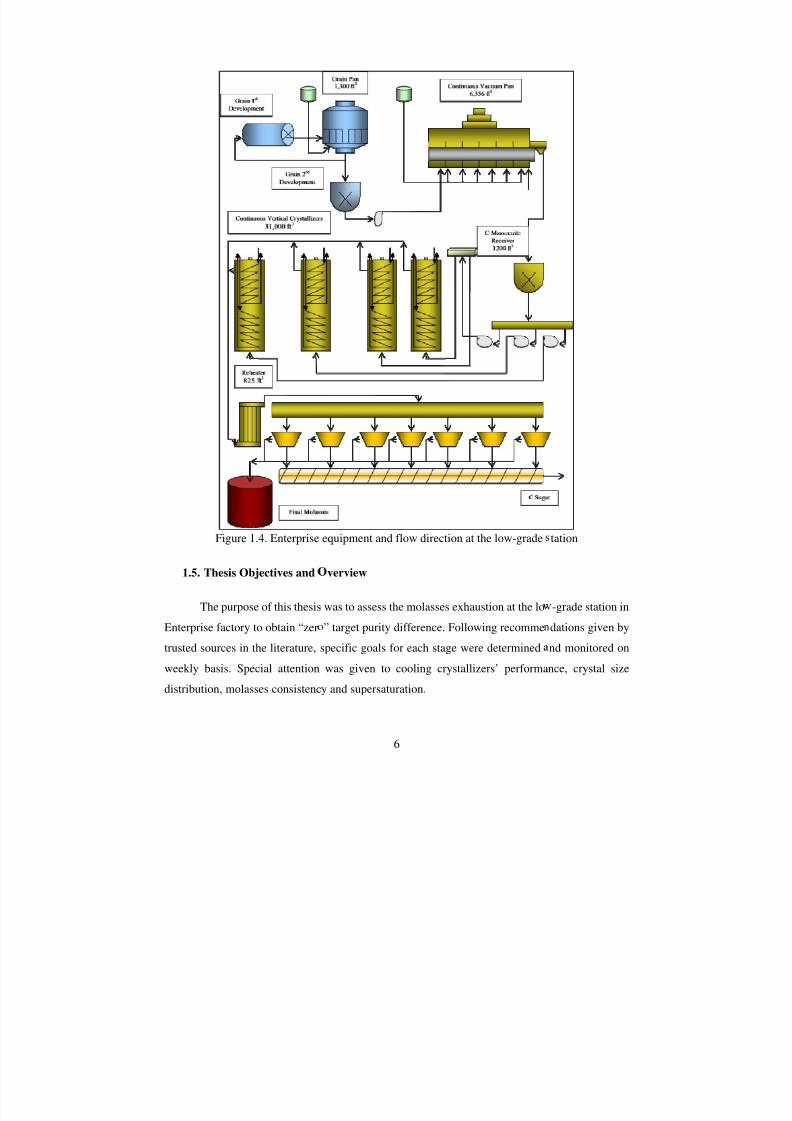
In 2008, Enterprise expanded the factory capacity in the back end of the boiling process –
low-grade station, Figure 1.4. The expansion is intended to reduce the molasses target purity
difference and to increase sugar recovery.
The capacity expansion consisted in the installation of:
• two (2) new vertical crystallizers of 227 m3 (8,000ft3) each, for a total capacity of
878 m3 (31,000ft3);
• a new vertical reheater (finned tubes) - heat transfer area of 1,208 m2
(13,000ft2)
and capacity of 23 m3
(825ft3); and
• two (2) additional continuous centrifuges for a total of 7 machines (centrifuge
screens with 0.04 x 2.18 mm of slot size and 9.6% of open area).
7/30/2019 Assessment of Target Purity Difference for a Louisiana Sugar Mill
http://slidepdf.com/reader/full/assessment-of-target-purity-difference-for-a-louisiana-sugar-mill 13/115
Figure 1.4. Enterprise
1.5. Thesis Objectives and
The purpose of this thesis
Enterprise factory to obtain “zer
trusted sources in the literature,
weekly basis. Special attention
distribution, molasses consistenc
6
equipment and flow direction at the low-grade
verview
was to assess the molasses exhaustion at the lo
” target purity difference. Following recomme
specific goals for each stage were determined
was given to cooling crystallizers’ performa
y and supersaturation.
tation
-grade station in
dations given by
nd monitored on
nce, crystal size
7/30/2019 Assessment of Target Purity Difference for a Louisiana Sugar Mill
http://slidepdf.com/reader/full/assessment-of-target-purity-difference-for-a-louisiana-sugar-mill 14/115
7
The sugar boiling process chapter gives the fundamental theory of sugar crystallization –
supersaturation as a driving force, variables that affect the crystal growth, and how the new nuclei
are formed; then, it gives the crystallization techniques that are applied at the boiling house in a
sugar cane factory; and finally, the technical recommendations that the factory could implement to
achieve a good performance respect to sugar recovery and molasses exhaustion. The materials and
methods chapter describes the procedures and sampling frequency used to collect the data.
The results and discussion chapter first shows the historical (6 years) and actual (2008
season) variation of parameters related to molasses exhaustion and sugar recovery. Then, the final
molasses exhaustion is approached by focusing in the low-grade station stages (vacuum pan, cooling
crystallizers, reheater, and centrifuges) and the main variables that affect the final molasses
exhaustion process, such as: vertical crystallizers retention time; molasses – massecuite consistency
(viscosity); crystal content, surface area, and size distribution; supersaturation; and the average stage
performance. Next, the proposed goals were compared with the actual values and the economical
return was estimated.
Conclusions and recommendations discuss the findings of this evaluation and what are the
actions that may help this factory and what actions can be applied to other sugar cane factories.
7/30/2019 Assessment of Target Purity Difference for a Louisiana Sugar Mill
http://slidepdf.com/reader/full/assessment-of-target-purity-difference-for-a-louisiana-sugar-mill 15/115
8
2. THE SUGAR BOILING PROCESS
2.1. Crystallization Theory
Crystallization is the process of formation of solid crystals precipitating from a solution or
melt. Crystallization is also a chemical solid-liquid separation technique, in which mass transfer of a
solute from the liquid solution to a pure solid crystalline phase occurs. The crystallization process
requires nucleation and crystal growth. Nucleation is the step where the solute molecules
dispersed in the solvent start to gather into clusters, on the nanometer scale (elevating solute
concentration in a small region), that become stable under the operating conditions. These stable
clusters constitute the nuclei. The clusters must reach a critical size in order to become stable nuclei,
and this is dictated by the operating conditions (temperature, supersaturation, etc.). It is at nucleation
that the atoms arrange in a defined and periodic manner that defines the crystal structure. The
crystal growth is the subsequent growth of the nuclei (Wikipedia, 2009).
The driving force for the sucrose crystallization is supersaturation; the growth of the crystal
depends on several factors such as temperature, crystal surface area, fluid dynamic conditions and
the nature and concentration of the impurities (Vaccari et al., 2003). The solubility of a solute in a
solvent at determined conditions, such as pressure, temperature and the presence of other substances
is the maximum amount of this solute that can be dissolved and stay in solution (saturation); the
solute concentration above the saturation concentration is the supersaturation. Depending upon the
conditions, either nucleation or growth may predominate, and as a result, crystals with different sizes
and shapes are obtained. Once supersaturation is exhausted, the solid-liquid system reaches
equilibrium and the crystallization is complete (van der Poel et al., 1998).
2.1.1. Solubility and Supersaturation
The solubility of sucrose in water is very high (2 parts of sucrose for 1 part of water at
saturation at 25°C and increases very sharply at higher temperatures); hence, water is considered one
of the most melassigenic (molasses producer) non-sucrose substances in the crystallization process.
In order to crystallize sucrose, the sucrose concentration must be increased to a concentration above
the saturation conditions. Control of this process requires knowledge of the sucrose concentration at
saturation for the working conditions (Rein, 2007).
7/30/2019 Assessment of Target Purity Difference for a Louisiana Sugar Mill
http://slidepdf.com/reader/full/assessment-of-target-purity-difference-for-a-louisiana-sugar-mill 16/115
9
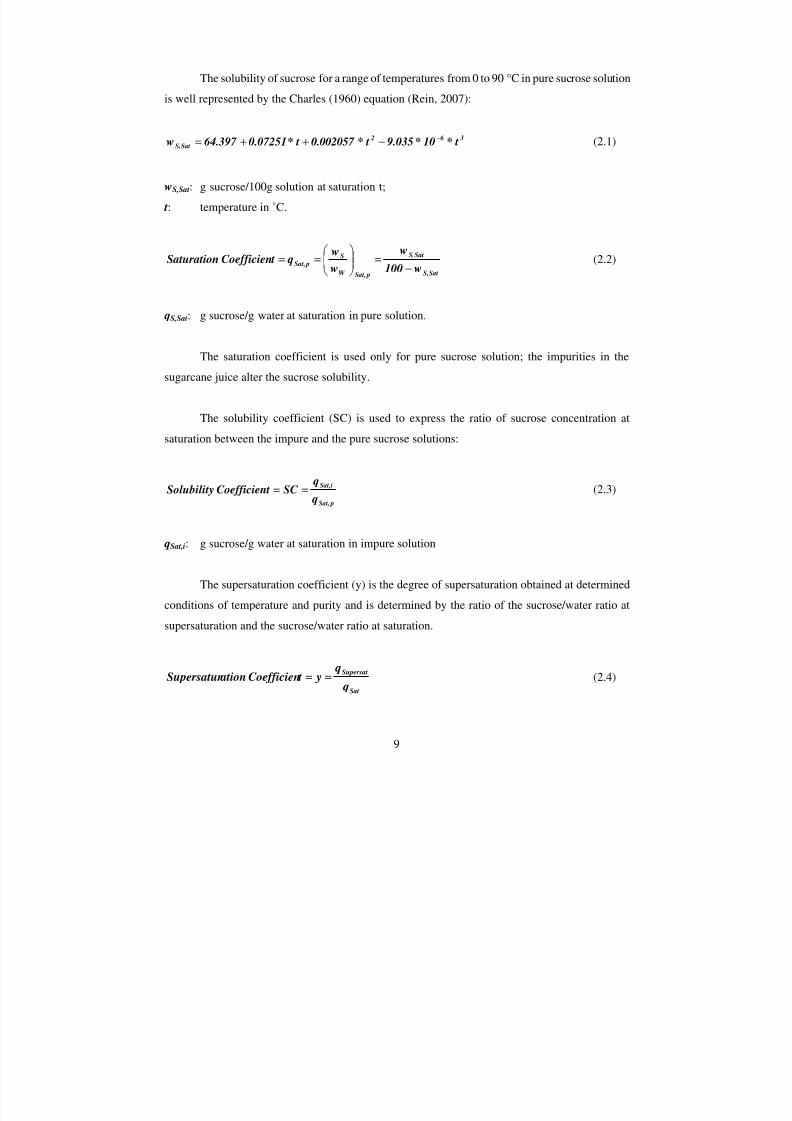
The solubility of sucrose for a range of temperatures from 0 to 90 °C in pure sucrose solution
is well represented by the Charles (1960) equation (Rein, 2007):
36 2
SatS, t*10* 9.035 t*0.002057 t*0.0725164.397 w −−++= (2.1)
wS,Sat: g sucrose/100g solution at saturation t;
t: temperature in ˚C.
SatS,
SatS,
pSat,W
S pSat,
w100
w
w
wq tCoefficienSaturation
−=
== (2.2)
qS,Sat: g sucrose/g water at saturation in pure solution.
The saturation coefficient is used only for pure sucrose solution; the impurities in the
sugarcane juice alter the sucrose solubility.
The solubility coefficient (SC) is used to express the ratio of sucrose concentration at
saturation between the impure and the pure sucrose solutions:
pSat,
iSat,
q
qSC tCoefficienSolubility == (2.3)
qSat,i: g sucrose/g water at saturation in impure solution
The supersaturation coefficient (y) is the degree of supersaturation obtained at determined
conditions of temperature and purity and is determined by the ratio of the sucrose/water ratio at
supersaturation and the sucrose/water ratio at saturation.
Sat
Supersat
q
q y tCoefficien ationSupersatur == (2.4)
7/30/2019 Assessment of Target Purity Difference for a Louisiana Sugar Mill
http://slidepdf.com/reader/full/assessment-of-target-purity-difference-for-a-louisiana-sugar-mill 17/115
10
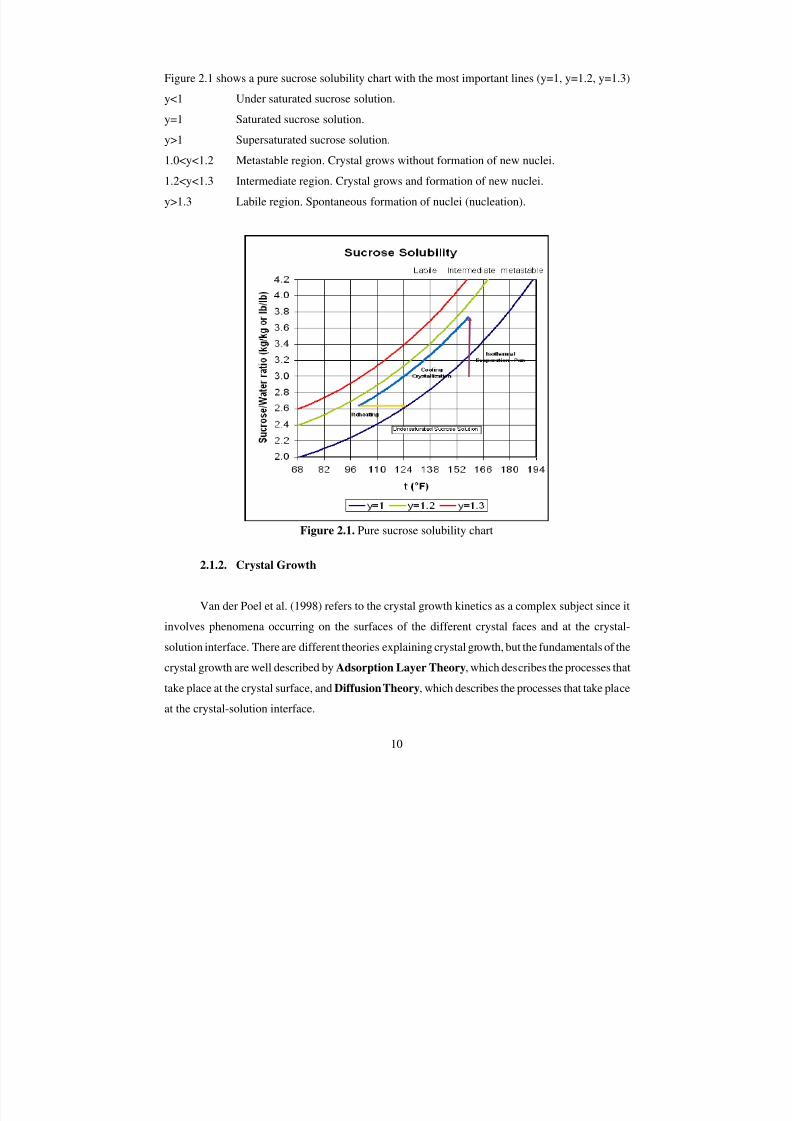
Figure 2.1 shows a pure sucrose solubility chart with the most important lines (y=1, y=1.2, y=1.3)
y<1 Under saturated sucrose solution.
y=1 Saturated sucrose solution.
y>1 Supersaturated sucrose solution.
1.0<y<1.2 Metastable region. Crystal grows without formation of new nuclei.
1.2<y<1.3 Intermediate region. Crystal grows and formation of new nuclei.
y>1.3 Labile region. Spontaneous formation of nuclei (nucleation).
Figure 2.1. Pure sucrose solubility chart
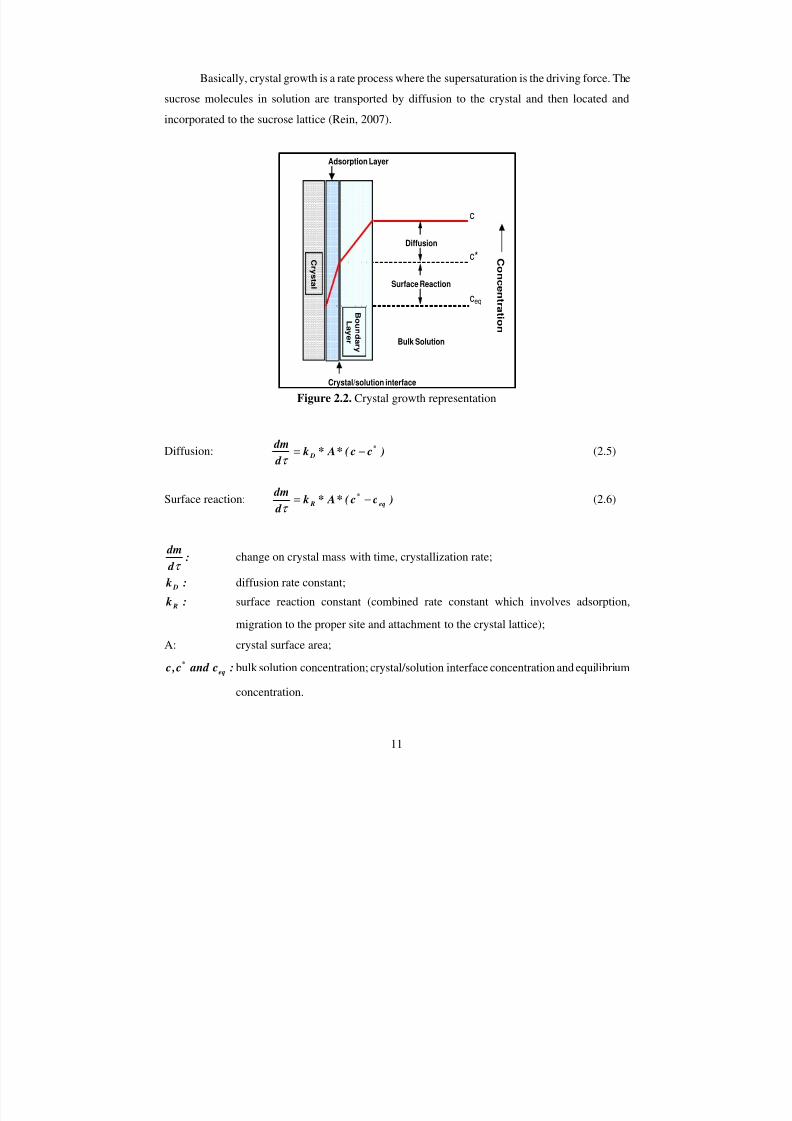
2.1.2. Crystal Growth
Van der Poel et al. (1998) refers to the crystal growth kinetics as a complex subject since it
involves phenomena occurring on the surfaces of the different crystal faces and at the crystal-
solution interface. There are different theories explaining crystal growth, but the fundamentals of the
crystal growth are well described by Adsorption Layer Theory, which describes the processes that
take place at the crystal surface, and Diffusion Theory, which describes the processes that take place
at the crystal-solution interface.
7/30/2019 Assessment of Target Purity Difference for a Louisiana Sugar Mill
http://slidepdf.com/reader/full/assessment-of-target-purity-difference-for-a-louisiana-sugar-mill 18/115
7/30/2019 Assessment of Target Purity Difference for a Louisiana Sugar Mill
http://slidepdf.com/reader/full/assessment-of-target-purity-difference-for-a-louisiana-sugar-mill 19/115
12
Combining these two equations (2.5 & 2.6):
Crystal growth = ) c c( * A* K d
dmeqG −=
τ (2.7)
KG is the overall crystal growth constant (overall mass transfer coefficient).
R D
R DG
k k
k* k K
+= (2.8)
It had been found that this reaction is the first order at high concentration differences (pan
conditions) and from order 1 to 2 for low concentration differences and in the presence of non-sucrose components. A more realistic representation of this rate process is given by (Rein, 2007):
n
eqG ) c c( * A* K d
dm−=
τ (2.9)
When k D>>>> k R then K G~ k D, the driving force for the growth process is diffusion. When
k R>>>> k D then K G~ k R, the driving force for the growth process is surface reaction. Crystallization
conditions such as temperature, stirring or natural circulation and the presence of non-sucrose
components affect the values of k D and k R, and hence, affect the value of K G (Rein, 2007).
2.1.2.1. Temperature and Crystal Growth
The dependence of the crystal growth constant on temperature is represented by the
following Arrhenius Equation (Rein, 2007):
−⋅=
RT Eexp K K A
G0G (2.10)
R: universal gas constant;
T : absolute temperature; and
E A: activation energy.
7/30/2019 Assessment of Target Purity Difference for a Louisiana Sugar Mill
http://slidepdf.com/reader/full/assessment-of-target-purity-difference-for-a-louisiana-sugar-mill 20/115
7/30/2019 Assessment of Target Purity Difference for a Louisiana Sugar Mill
http://slidepdf.com/reader/full/assessment-of-target-purity-difference-for-a-louisiana-sugar-mill 21/115
14
2.1.2.3. Non-Sucrose Components and Crystal Growth
Non-sucrose components can affect the characteristics of the sucrose solution (such as
viscosity and solubility) and/or can interact with the growing faces of the crystals (modifying the
crystal morphology). Some of the modifications of the solution characteristics are changes in the
supersaturation conditions for crystal growth (solubility increase or decrease depending on the non-
sucrose component) and changes in the viscosity of the solution (viscosity increase or decrease
which affects the relative crystal-solution velocity, which is related to the thickness of the boundary
layer). Some non-sucrose components may also “poison” specific crystal faces affecting the growth
rate on these faces, causing morphologic modifications. Non-sucrose components which produce
habit modifications and viscosity changes in sucrose crystallization are: oligosaccharides, dextran,
glucose and fructose (van der Poel et al., 1998). Other important non-sucrose components are the
salts, most of them increasing the sucrose solubility and viscosity but also they can act as catalyzers
on different reactions such as inversion or color formation (Vercellotti et al., 1996).
The effects of the non-sucrose components are most evident in the final stages of the sucrose
crystallization, where the concentrations of the non-sucrose components with respect to sucrose are
higher. An equation to represent the effect of the non-sucrose components in crystal growth was
developed in Australia by Wright and White (1974), but Love (2002) in South Africa determined a
higher value for the constant affecting the non-sucrose/water ratio (2.4 against 1.75), taken from
(Rein, 2007).
⋅−
−⋅= W NS
A0GG q75 .1
RT
Eexp K K (2.12)
q NS/W : sucrose/water ratio
2.1.3. Nucleation
Nucleation is the formation of crystal nuclei and it may occur spontaneously or induced by an
external stimulus.
7/30/2019 Assessment of Target Purity Difference for a Louisiana Sugar Mill
http://slidepdf.com/reader/full/assessment-of-target-purity-difference-for-a-louisiana-sugar-mill 22/115
7/30/2019 Assessment of Target Purity Difference for a Louisiana Sugar Mill
http://slidepdf.com/reader/full/assessment-of-target-purity-difference-for-a-louisiana-sugar-mill 23/115
16
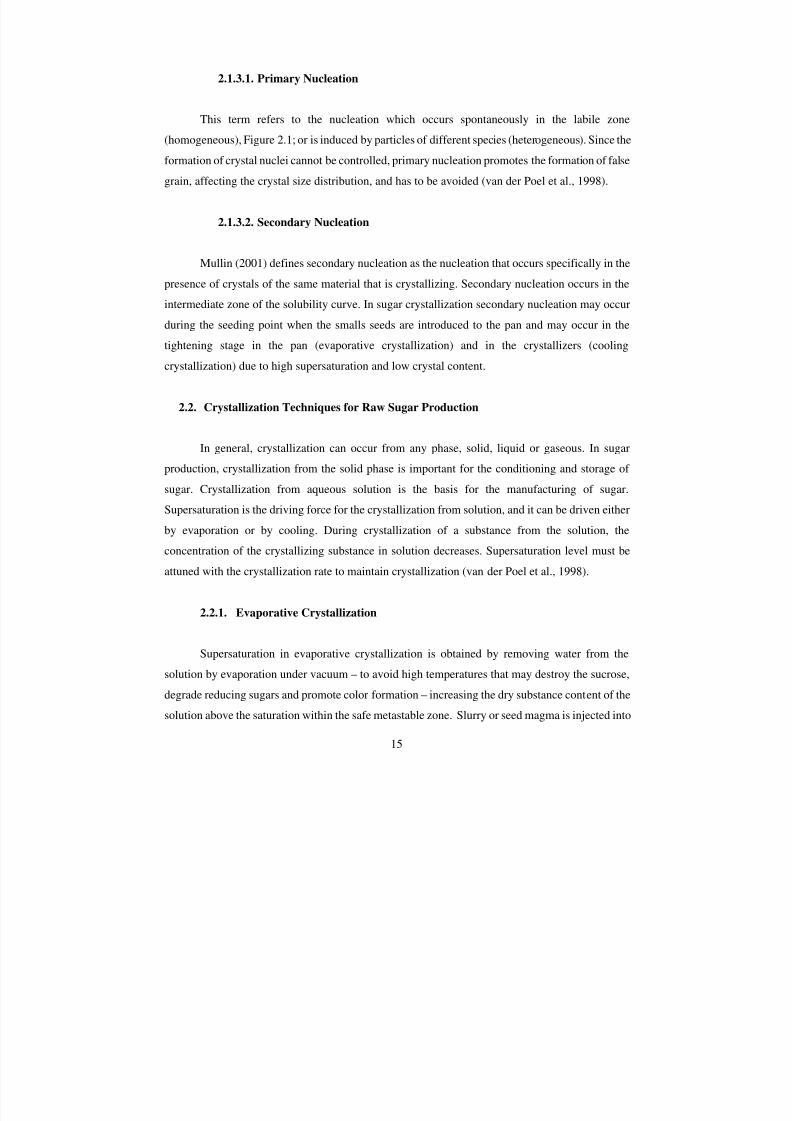
the supersaturated solution and the seeded crystals are induced to grow. Evaporative crystallization
can be conducted in batch or continuous vacuum pans (van der Poel et al., 1998). Figure 2.3.
Figure 2.3. Isothermal evaporative crystallization
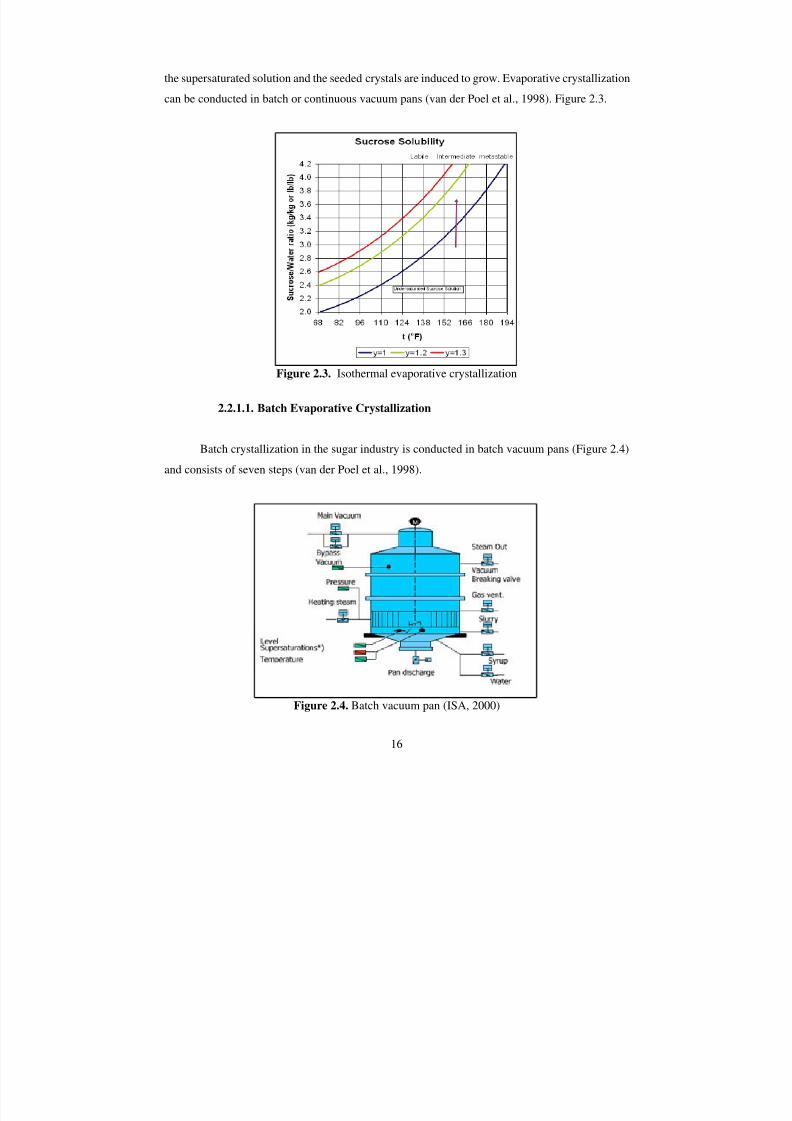
2.2.1.1. Batch Evaporative Crystallization
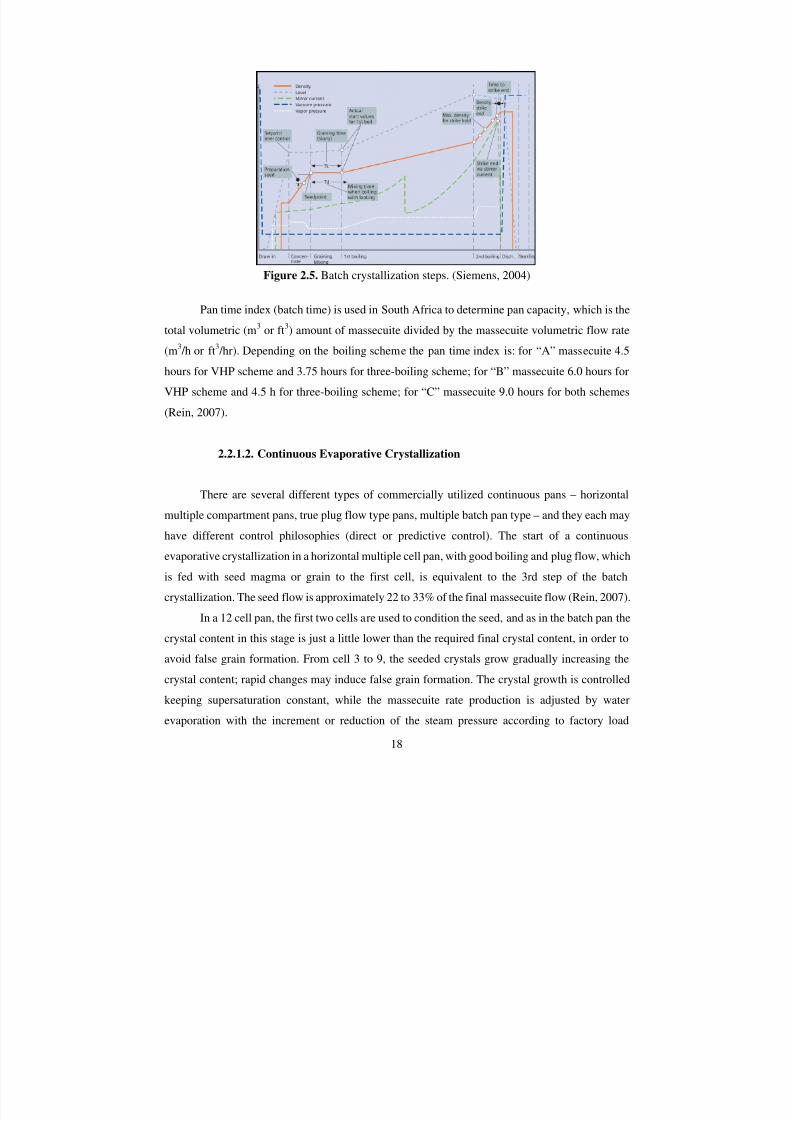
Batch crystallization in the sugar industry is conducted in batch vacuum pans (Figure 2.4)and consists of seven steps (van der Poel et al., 1998).
Figure 2.4. Batch vacuum pan (ISA, 2000)
7/30/2019 Assessment of Target Purity Difference for a Louisiana Sugar Mill
http://slidepdf.com/reader/full/assessment-of-target-purity-difference-for-a-louisiana-sugar-mill 24/115
17
− Feed: The feed (syrup or molasses) is drawn into the pan (by vacuum, 0.2 Bar) until the
level covers the calandria (required for natural circulation). Some steam is applied to
increase the feed temperature and accelerate the process. In the case of a pan with stirrer,
it is turned on as soon as it is covered by the feed.
− Concentration: Increasing the steam pressure, the water is evaporated in the calandria
(flash-evaporation) and the vapor bubbles produce turbulence, which favors the heat
transfer to the feed. The level (covering the calandria) is kept constant by the addition of
more feed .
− Seed point: Concentration ends when a specific supersaturation is reached and then
crystal seed is drawn into the pan by vacuum. For seeding with slurry (alcoholic
suspension of very fine sucrose crystals obtained by wet milling), the region of
supersaturation is between 1.1 and 1.2.
− Crystal formation or graining: The supersaturation coefficient is kept as constant as
possible for the required time (~10 min) to obtain the desired crystal size that can be seen
by a naked eye (~50µm). Crystal content at the end of this step is ~10% dry substance.
This step is not applicable when the pan is seeded with magma .
− Crystal growth: In this phase the steam pressure is increased in order to increase the
evaporation of water and the supersaturation is sustained in the metastable zone (y=1.2)
by drawing more feed or water into the pan. As the level rises and although the pressureis kept constant (~0.15 Bar), the boiling temperature increases due to the decreasing
purity of the mother liquor. For example, depending also on the temperature probe
position, the boiling temperature for “A" strike may rise from ~ 69 to 73°C.
− Tightening: This phase begins when the maximum working volume of the pan is
attained. Concentration continues until the crystal content and viscosity of the material
reaches the desired or maximum workable limits. The end of this step is determined by
direct dry substance measurement (soluble solids content measured by refractometric
index or density – Brix) or by indirect measurement of the consistency (stirrer current).
− Discharge: When the maximum allowable consistency is reached, the vacuum is
released by injecting air or water vapor (low pressure vapor from the 1st, 2
ndor 3
rdeffect
evaporator) to the pan body, and then the discharge valve is opened releasing the pan
contents to a receiver. When the pan is empty, the residual crystals adhered to the walls
are removed by injecting vapor.
7/30/2019 Assessment of Target Purity Difference for a Louisiana Sugar Mill
http://slidepdf.com/reader/full/assessment-of-target-purity-difference-for-a-louisiana-sugar-mill 25/115
7/30/2019 Assessment of Target Purity Difference for a Louisiana Sugar Mill
http://slidepdf.com/reader/full/assessment-of-target-purity-difference-for-a-louisiana-sugar-mill 26/115
7/30/2019 Assessment of Target Purity Difference for a Louisiana Sugar Mill
http://slidepdf.com/reader/full/assessment-of-target-purity-difference-for-a-louisiana-sugar-mill 27/115
20
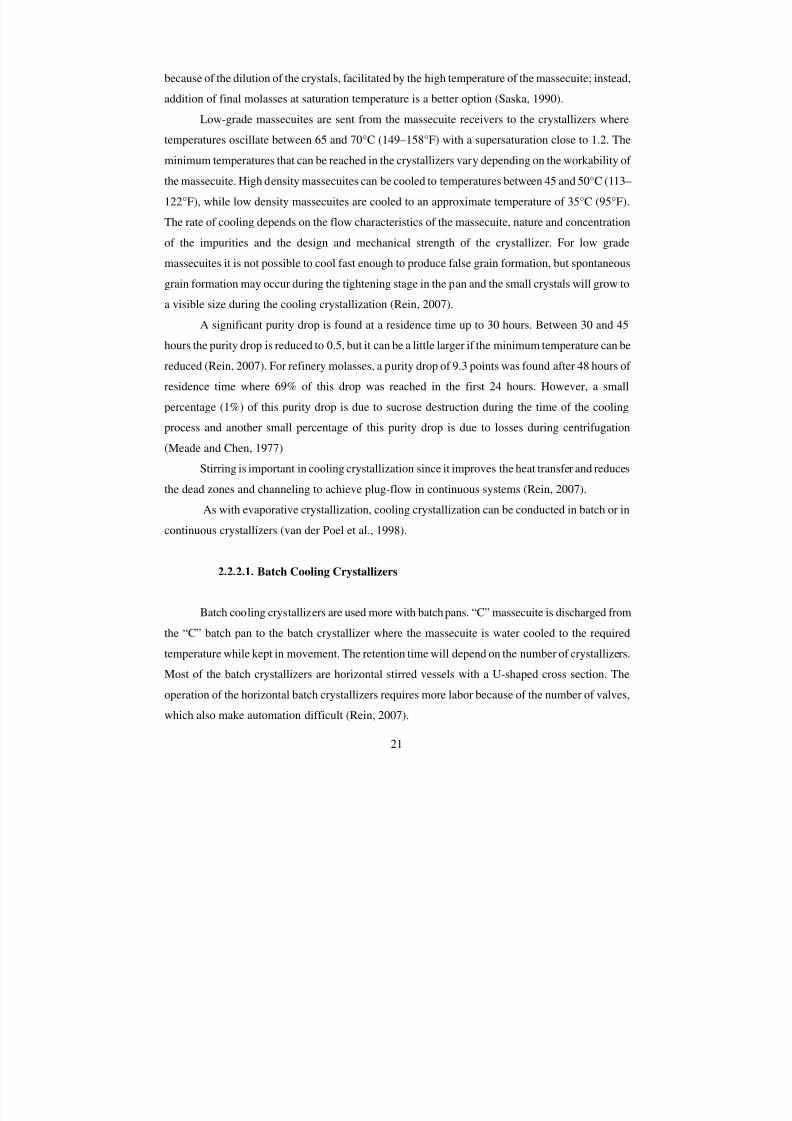
2.2.2. Cooling Crystallization
Cooling crystallization takes place when the temperature decreases such that the sucrose
solubility is reduced. In this process, the supersaturation condition for sugar crystallization is
increased or kept constant by the decrease of temperature produced by the heat transfer to the
surroundings (natural cooling) or by the heat transfer to specifically designed heat transfer surfaces.
The temperature drop is controlled by the flow and temperature of the cooling water. Ideally, the rate
of cooling has to be proportional to the rate of sugar deposition in order to maintain a constant
supersaturation and to avoid spontaneous nucleation (false grain formation), Figure 2.8. Good results
are obtained when the massecuite is cooled at a rapid rate to the minimum temperature and then held
at this temperature for the remainder of the time. Generally, cooling rates are between 1.5 and 2°C/hr
(2 and 3°F/hr) (Meade and Chen, 1977)
Figure 2.8. Cooling crystallization at constant supersaturation
Cooling crystallization has its most important application in the final stage of the sugar
process, to maximize the sugar recovery from the final molasses (molasses exhaustion). During the
final stage of the evaporative crystallization (tightening), the dry substance content of the massecuite
is increased to a maximum value (~97 Brix), which is limited by the flowability of the massecuite
(viscosity). At this point the sugar deposition rate is very low since massecuite viscosity is limiting
the diffusion of sucrose, and is limiting the heat transfer in the vacuum pan. Massecuite viscosity is
the limiting factor for molasses exhaustion in the sugar cane. Reduction of viscosity by the addition
of water or diluted molasses in the massecuite receiver before the crystallizers is not recommended
7/30/2019 Assessment of Target Purity Difference for a Louisiana Sugar Mill
http://slidepdf.com/reader/full/assessment-of-target-purity-difference-for-a-louisiana-sugar-mill 28/115
7/30/2019 Assessment of Target Purity Difference for a Louisiana Sugar Mill
http://slidepdf.com/reader/full/assessment-of-target-purity-difference-for-a-louisiana-sugar-mill 29/115
7/30/2019 Assessment of Target Purity Difference for a Louisiana Sugar Mill
http://slidepdf.com/reader/full/assessment-of-target-purity-difference-for-a-louisiana-sugar-mill 30/115
23
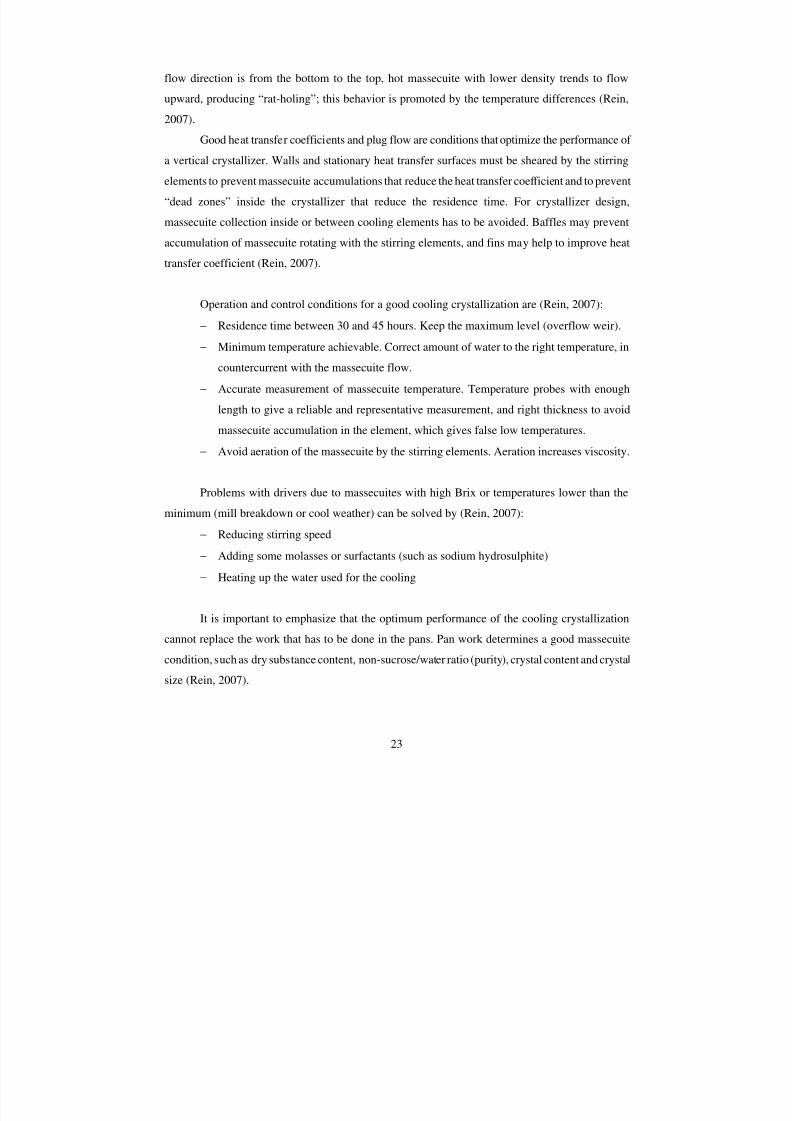
flow direction is from the bottom to the top, hot massecuite with lower density trends to flow
upward, producing “rat-holing”; this behavior is promoted by the temperature differences (Rein,
2007).
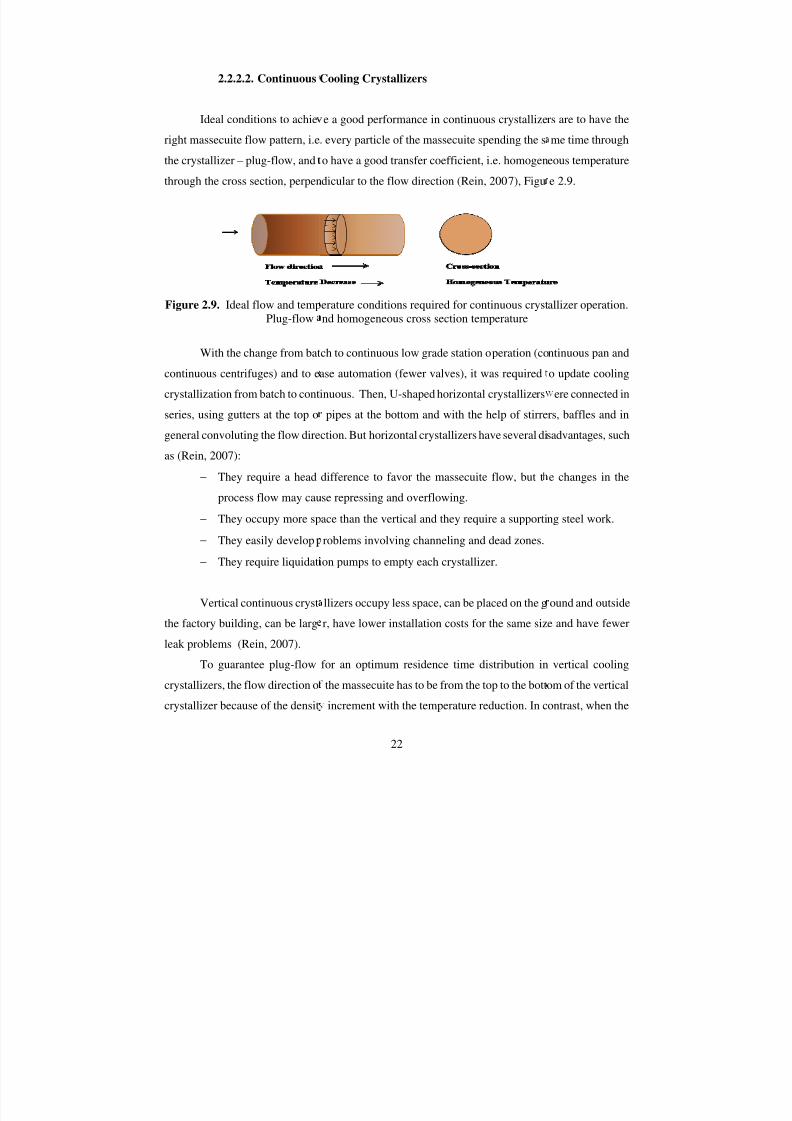
Good heat transfer coefficients and plug flow are conditions that optimize the performance of
a vertical crystallizer. Walls and stationary heat transfer surfaces must be sheared by the stirring
elements to prevent massecuite accumulations that reduce the heat transfer coefficient and to prevent
“dead zones” inside the crystallizer that reduce the residence time. For crystallizer design,
massecuite collection inside or between cooling elements has to be avoided. Baffles may prevent
accumulation of massecuite rotating with the stirring elements, and fins may help to improve heat
transfer coefficient (Rein, 2007).
Operation and control conditions for a good cooling crystallization are (Rein, 2007):
− Residence time between 30 and 45 hours. Keep the maximum level (overflow weir).
− Minimum temperature achievable. Correct amount of water to the right temperature, in
countercurrent with the massecuite flow.
− Accurate measurement of massecuite temperature. Temperature probes with enough
length to give a reliable and representative measurement, and right thickness to avoid
massecuite accumulation in the element, which gives false low temperatures.
− Avoid aeration of the massecuite by the stirring elements. Aeration increases viscosity.
Problems with drivers due to massecuites with high Brix or temperatures lower than the
minimum (mill breakdown or cool weather) can be solved by (Rein, 2007):
− Reducing stirring speed
− Adding some molasses or surfactants (such as sodium hydrosulphite)
− Heating up the water used for the cooling
It is important to emphasize that the optimum performance of the cooling crystallization
cannot replace the work that has to be done in the pans. Pan work determines a good massecuite
condition, such as dry substance content, non-sucrose/water ratio (purity), crystal content and crystal
size (Rein, 2007).
7/30/2019 Assessment of Target Purity Difference for a Louisiana Sugar Mill
http://slidepdf.com/reader/full/assessment-of-target-purity-difference-for-a-louisiana-sugar-mill 31/115
7/30/2019 Assessment of Target Purity Difference for a Louisiana Sugar Mill
http://slidepdf.com/reader/full/assessment-of-target-purity-difference-for-a-louisiana-sugar-mill 32/115
25
molasses and sugars (magmas) from the same massecuite take the same designation (“A” molasses,
“A” sugar). (Chen and Chou, 1993).
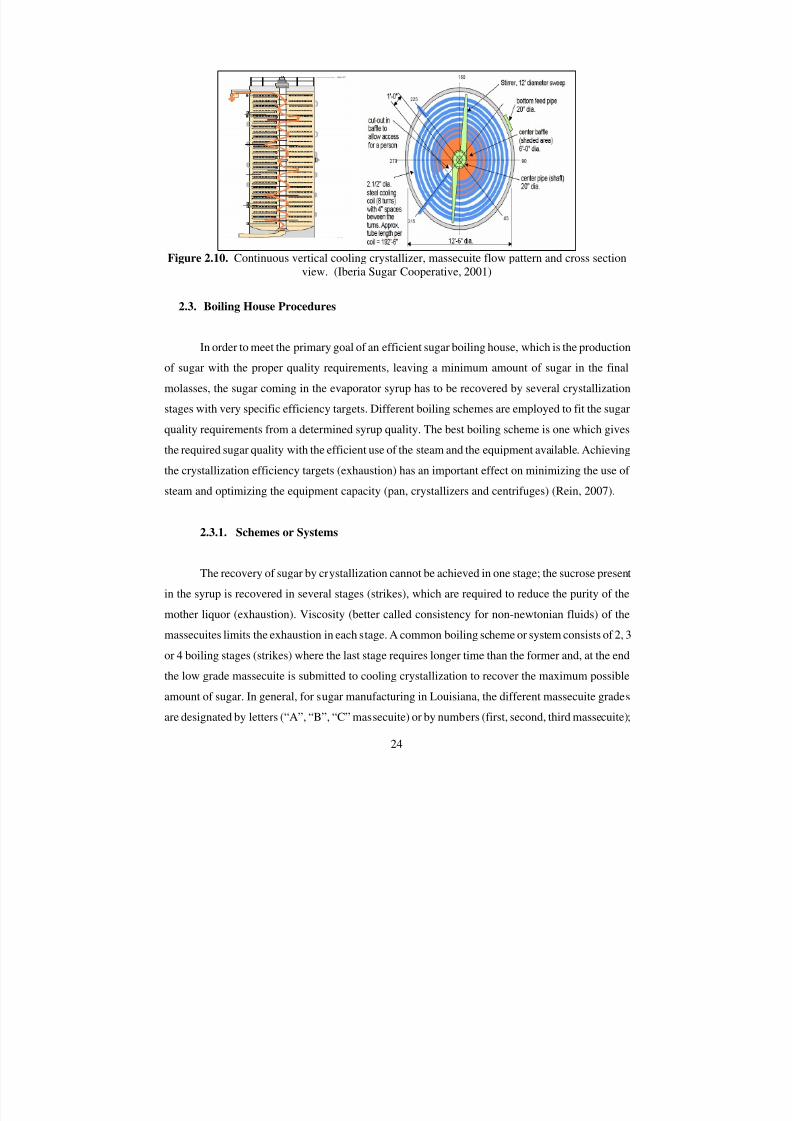
Common boiling schemes (Figure 2.11) used for raw sugar production are: two-boiling
scheme, three-boiling scheme, Double-Einwurf scheme and VHP scheme (Rein, 2007).
The choice of a boiling scheme depends on factors such as syrup purity and sugar quality,
and this choice also affects the massecuite throughput and the steam requirement (Birkett, 1978).
Figure 2.11. Boiling schemes
2.4. Recommendations for Molasses Exhaustion
Molasses exhaustion is a topic that has been studied for many years. Several researchers across
the sugar industry have discussed this subject, and they agree on the conditions required to achieve
good molasses exhaustion. The recommendations taken from some of these researchers – Birkett and
Stein (1988), Ninela and Rajoo (2006), Meade and Chen (1977), Chen and Chou (1993) and Rein
(2007) – are as follows:
7/30/2019 Assessment of Target Purity Difference for a Louisiana Sugar Mill
http://slidepdf.com/reader/full/assessment-of-target-purity-difference-for-a-louisiana-sugar-mill 33/115
7/30/2019 Assessment of Target Purity Difference for a Louisiana Sugar Mill
http://slidepdf.com/reader/full/assessment-of-target-purity-difference-for-a-louisiana-sugar-mill 34/115
7/30/2019 Assessment of Target Purity Difference for a Louisiana Sugar Mill
http://slidepdf.com/reader/full/assessment-of-target-purity-difference-for-a-louisiana-sugar-mill 35/115
28
2.4.5. Slurry Preparation and Grain Strike
A standard procedure for the preparation of slurry must be established and the proper slurry
to massecuite ratio determined. Although full seeding is the ideal to achieve an optimum crystal size
distribution, some nuclei may form when the slurry is injected to the pan. The proper amount of
slurry to be used has to be determined by experience (Rein, 2007).
The difference between seeding with powder sugar and seeding with slurry is the amount of
crystals required to give the right crystal surface area for crystallization. The smaller is the size of
the crystal, the bigger is the crystal surface area for the same number of crystals (Rein, 2007).
The purity of the grain strike has to be kept in a range between 64 and 68% using “A”
molasses and combining with “B” molasses if it is required (Rein, 2007).
2.4.6. Crystal Size and Crystal size Distribution (CSD) are very Important Parameters
to be Determined in Low-Grade Massecuite
The combination of crystal content and crystal size determines the crystal surface area
available for sucrose deposition (avoiding the formation of false grain). As was stated before, for the
same crystal content, smaller crystals have more surface area than larger crystals. However, small
crystals reduce the purging capacity of the centrifuges and increase the molasses recirculation. Also,
small crystals may pass throughout the centrifuges’ screen slots and increase the molasses purity.
The proper size is established balancing the advantage of small size crystals (higher surface area) for
the rate of crystallization versus large crystals (lower surface area) for the centrifugation. Crystal
sizes recommended for grain (“C” massecuite seed) are between 180 and 200 µm, for “C”
massecuite leaving the pan are between 250 and 300 µm and for “C” massecuite leaving the “C”
crystallizers are between 300 and 350 µm. The purity rise in centrifuges depends mainly in the
crystal size. Crystal width has to be 1.5 to 2.0 times larger than the width of the screen slot, which is
0.04 or 0.06 mm (40 or 60 µm). Minimum crystal width should be 120 µm (Rein, 2007, Chen and
Chou, 1993, and Hugot, 1960).
Meade and Chen (1977) state that crystal uniformity is a desired quality because – “with a
mixture of crystal sizes, the pore volume of sugar is reduced and drainage of molasses is slower and
less complete in the centrifugal operation”. To achieve crystal size uniformity, the steady state
parameters in a continuous pan are the key: constant production rate and regulated seed injection
(Chou, 2000).
7/30/2019 Assessment of Target Purity Difference for a Louisiana Sugar Mill
http://slidepdf.com/reader/full/assessment-of-target-purity-difference-for-a-louisiana-sugar-mill 36/115
29
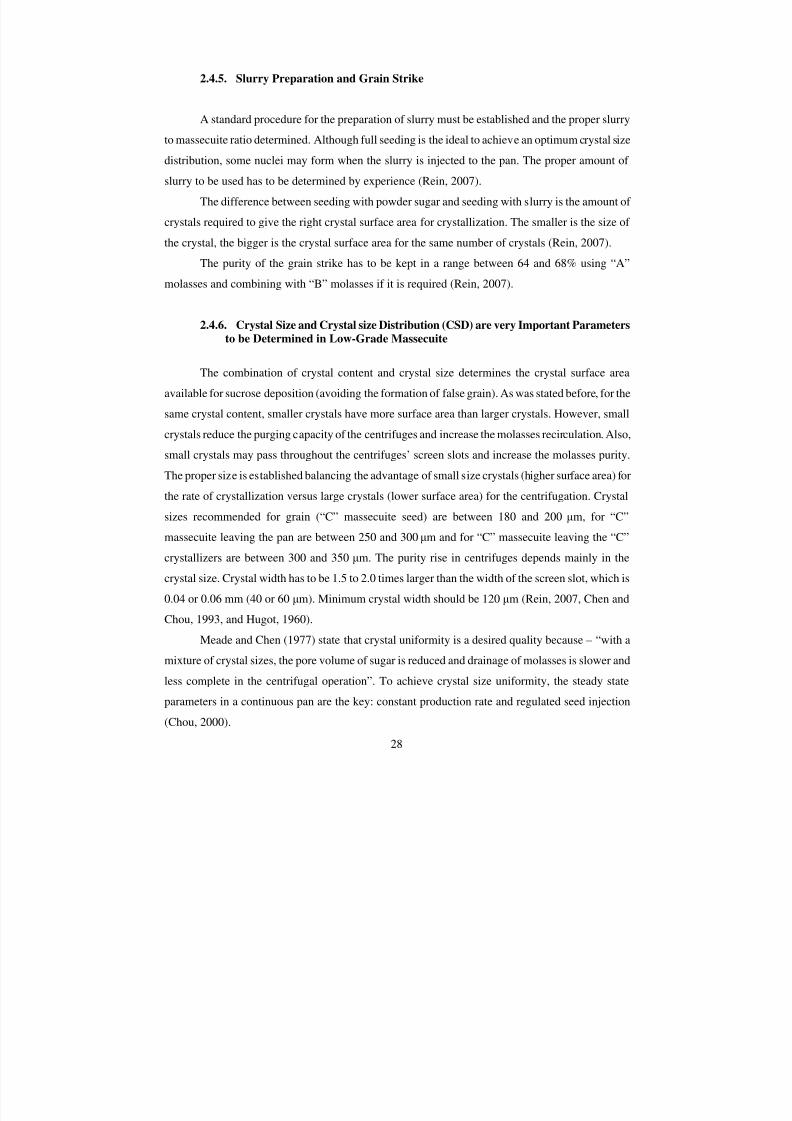
Ninela and Rajoo (2006) state that “the Crystal Size Distribution (CSD) is an important
analytical tool that assists process management to make informed decisions”. This information can
be used to adjust the seed/massecuite ratio to achieve the desired crystal content. The objective is to
boil “C” massecuites with regular grains and free of false grain.
Figure 2.13. Crystal picture and CSD analysis for “C” massecuite from CVP
2.4.7. The “C” Massecuite has to be Boiled to the Maximum Density within the Limits
of Workability for Crystallizers and Centrifuges
Mother liquor in the massecuite has to be concentrated to an optimum density (Brix) that
will give – after cooling crystallization – a final molasses saturation of about 55oC (131oF) (Meade
and Chen, 1977).
To achieve the target purity of the final molasses, the Brix (RDS) of the “C” massecuite
should be at least 97 and a plan to achieve the optimum Brix of 98 must to be implemented in small
increment. The molasses purity cannot be further reduced for molasses viscosities above
approximately 300 Pa-s (Rein, 2007).
Maximum massecuite density is limited by the massecuite viscosity. A “C” massecuite
viscosity limit about 2,000 Pa-s at 40o
C (104o
F) is recommended, which corresponds toapproximately a 4.5 non-sucrose/water ratio. The maximum viscosity of the massecuite leaving the
crystallizers can be close to 5,000 Pa-s at 40oC (104oF), and the design of the crystallizers can be
addressed to handle 10,000 Pa-s at 40oC (104oF) (Rein, 2007).
Reduction of viscosity by the addition of water or highly diluted molasses in the massecuite
receiver (before crystallizers) is not recommended because of the dilution of the crystals, which is
7/30/2019 Assessment of Target Purity Difference for a Louisiana Sugar Mill
http://slidepdf.com/reader/full/assessment-of-target-purity-difference-for-a-louisiana-sugar-mill 37/115
7/30/2019 Assessment of Target Purity Difference for a Louisiana Sugar Mill
http://slidepdf.com/reader/full/assessment-of-target-purity-difference-for-a-louisiana-sugar-mill 38/115
31
− The purity rise after the reheater must be zero “0” and sometimes can be negative (Rein,
2007).
2.5. Sugar Boiling Summary
Supersaturation, the driving force of the sucrose crystallization process, depends on the
sucrose solubility, which is affected by parameters such as temperature, pressure and the
composition of the non-sugars in solution. Keeping supersaturation in a specific value inside the
metastable zone (y=1.2) and the right crystal surface area (crystal content and crystal size) are the
keys to achieve an optimum crystal growth rate and to avoiding nucleation or sucrose dilution.
Consistency is recognized as the most important process constraint since it limits the sucrose
diffusion (crystal growth), the heat transfer and the final crystal content (sugar recovery). The
consistency affects flow pattern in continuous vacuum pans and crystallizers, flowability in pipes,
power consumption (pumps and stirrers), and centrifugal work. Consequently, the mechanical
strength of the equipment bounds the consistency of the material. Evaporative and cooling
crystallization (batch or/and continuous) are the techniques applied in the boiling house to produce
raw sugar.
The recommendations for molasses exhaustion addressed equipment design and process
parameters per stage. Equipment design focus on the flow pattern to give the required retention time
(crystal growth) and the material movement (mass and heat transfer). Recommended process
parameters refer to solids concentration, temperature, retention time, crystal content (purity drop)
and crystal size distribution that improves the molasses exhaustion on each stage of the low-grade
station. Cane quality and a good performance of the process stages before the low-grade station, are
fundamental to maximize sugar recovery. This information was the basis to define the required
materials and methods, and to analysis the results of this research.
7/30/2019 Assessment of Target Purity Difference for a Louisiana Sugar Mill
http://slidepdf.com/reader/full/assessment-of-target-purity-difference-for-a-louisiana-sugar-mill 39/115
32
3. MATERIALS AND METHODS
One important aspect of any research is to establish what materials and methods can be used
to approach the proposed objectives. The analytical procedures described are implemented by most
of the Louisiana sugarcane factories or are conducted by Audubon Sugar Institute – Louisiana State
University Agricultural Center. The obtained results can be reproduced by other factories and can be
repeated season-to-season allowing the comparison. Crystal-molasses separation, soluble solids
concentration and sucrose concentration were the basis for this work. Determination of crystal size,
consistency, non-sucrose components, and metal tracer analysis complemented the information used
to evaluate each crystallization stage of the low-grade station.
3.1. Analytical Procedures
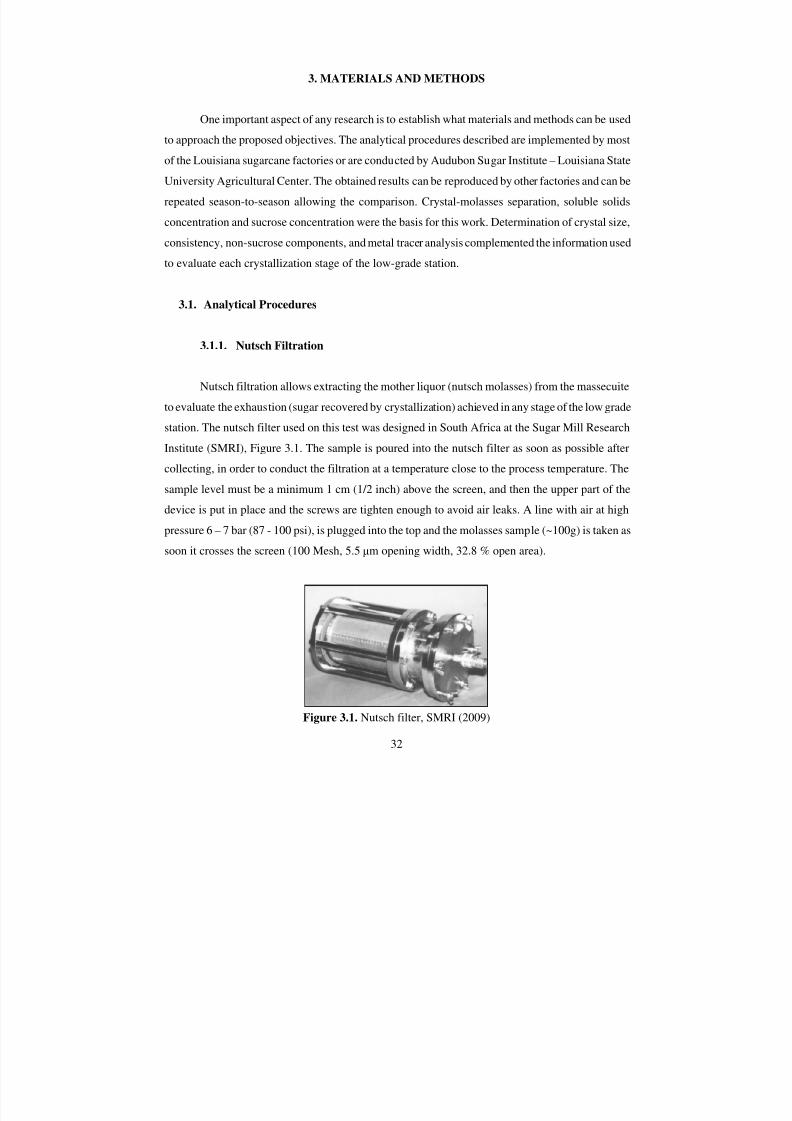
3.1.1. Nutsch Filtration
Nutsch filtration allows extracting the mother liquor (nutsch molasses) from the massecuite
to evaluate the exhaustion (sugar recovered by crystallization) achieved in any stage of the low grade
station. The nutsch filter used on this test was designed in South Africa at the Sugar Mill Research
Institute (SMRI), Figure 3.1. The sample is poured into the nutsch filter as soon as possible after
collecting, in order to conduct the filtration at a temperature close to the process temperature. The
sample level must be a minimum 1 cm (1/2 inch) above the screen, and then the upper part of the
device is put in place and the screws are tighten enough to avoid air leaks. A line with air at high
pressure 6 – 7 bar (87 - 100 psi), is plugged into the top and the molasses sample (~100g) is taken as
soon it crosses the screen (100 Mesh, 5.5 µm opening width, 32.8 % open area).
Figure 3.1. Nutsch filter, SMRI (2009)
7/30/2019 Assessment of Target Purity Difference for a Louisiana Sugar Mill
http://slidepdf.com/reader/full/assessment-of-target-purity-difference-for-a-louisiana-sugar-mill 40/115
7/30/2019 Assessment of Target Purity Difference for a Louisiana Sugar Mill
http://slidepdf.com/reader/full/assessment-of-target-purity-difference-for-a-louisiana-sugar-mill 41/115
7/30/2019 Assessment of Target Purity Difference for a Louisiana Sugar Mill
http://slidepdf.com/reader/full/assessment-of-target-purity-difference-for-a-louisiana-sugar-mill 42/115
35
solution, but for impure sucrose solutions it gives the total mass of sucrose and non-sucrose in
solution.
A refractometer measures the speed of the light in a substance compared with the speed of
the light in the air (refractive index). The refractive index is related to the concentration for a given
material and it depends on the temperature and the wavelength of the light; however, different
materials may have the same refractive index at different concentrations. Brix is the scale used to
convert the refractive index to sucrose concentration % mass, which is also called refractometric dry
substance (RDS). Refractometric dry substance (RDS) for pan boiling products is generally higher
than the dry substance by the oven dry method. The goodness of the prediction of the dry substance
from refractive index depends on the purity of the material, ICUMSA SPS-3 (2000).
The °Brix or refractometric dry substance (%RDS) is read directly from the refractometer
display after covering the refractometer prism with few drops of the diluted sample (1:1 dilution).
Presence of air bubbles and suspended solids also affect the Brix values. The removal of the
suspended solids by centrifugation improves the precision of the measurement.
DF read Brix Brix ⋅= (3.4)
Instruments:
Index Instruments PTR2 Refractometer, accuracy 0.1 °Brix (Enterprise mill)Bellingham and Stanley RFM340 Refractometer, accuracy 0.03 °Brix (Audubon Sugar Institute)
3.1.5. Viscosity: ICUMSA Method SPS-5 (1994)
In general, viscosity is a quantity which describes the resistance of a material to flow. The
viscosity depends on the fluid material (pure and impure), temperature and sometimes on pressure.
When the viscosity can be represented by a number which relates shear stress with velocity gradient
(shear rate), the fluid is known as a Newtonian. But when the viscosity is a function of a mechanical
variable such as shear stress or time, the fluid is known as a non-Newtonian. “C” massecuites and
final molasses are shear-thinning (pseudoplastic) non-Newtonian fluids that follow the power law
model, i.e. the apparent viscosity decreases when shear rate increases.
The viscosity of the nutsch molasses samples was determined at 40 and 60 °C using a
Brookfield Programmable DV-II+ Viscometer, with a small sample adapter (coaxial cylinder, SC4-
7/30/2019 Assessment of Target Purity Difference for a Louisiana Sugar Mill
http://slidepdf.com/reader/full/assessment-of-target-purity-difference-for-a-louisiana-sugar-mill 43/115
36
28 spindle). The speed was chosen to give a torque reading between 20 and 80 %. Three speeds were
used with each sample, and for each speed the apparent viscosity was recorded every minute for five
minutes. Assuming that the molasses follows the power law model, also known as the Ostwald-de
Waele equation ( µapp = K γn-1), the consistency K and flow index n are evaluated by plotting the
natural logarithms of apparent viscosity against shear rate according to the equation:
γ µ ln )1 n( K lnln app ⋅−+= (3.5)
µapp = apparent viscosity of the material, Pa•sec (centipoises • 10-3
)
K = consistency, Pa.sn
= viscosity (or stress) at a shear rate of 1sec-1
γ = Shear Rate, sec-1
n = flow index (dimensionless). Measure the extent of non-Newtonian behavior
3.1.6. Crystal Size and Crystal Size Distribution
Sucrose crystals, like any three-dimensional objects, are better described by length, breadth
and height; therefore a single number cannot give a good definition of the crystal size. Some
techniques used to determine crystal size and crystal size distribution are: sedimentation, wet
sieving, image analysis, coulter counter and laser techniques (laser diffraction and back scattering)
(van der Poel et al., 1998). Most of these sizing techniques approximate the crystal shape to a sphere
where the size is given by the diameter. Although this approximation simplifies the representation of
the crystal size distribution, when the crystal shape is far from the sphere the results have more
variation (Cilas, 2004). The sucrose crystal habit which depends on the growth rate of each crystal
face is affected by the temperature, supersaturation and the presence of non-sucrose components and
for instance, the sucrose crystal can be elongated in some cases (van der Poel et al.1998).
Particle size analysis based on laser diffraction and diffusion phenomena, relies on the fact
that particles passing through a laser beam will scatter light at an angle that is directly related to their
size. In laser diffraction, particle size distributions are calculated by comparing a sample’s scattering
pattern with an appropriate optical model. Traditionally two different models are used: the
Fraunhofer Approximation and Mie Theory (Cilas, 2004).The Fraunhofer approximation assumes
that the particles being measured are opaque and scatter light at narrow angles. As a result, it is only
applicable to large particles and will give an incorrect assessment of the fine particle fraction. Mie
7/30/2019 Assessment of Target Purity Difference for a Louisiana Sugar Mill
http://slidepdf.com/reader/full/assessment-of-target-purity-difference-for-a-louisiana-sugar-mill 44/115
37
Theory provides a more rigorous solution for the calculation of particle size distributions from light
scattering data. It predicts scattering intensities for all particles, small or large, transparent or opaque
(Cilas, 2004).
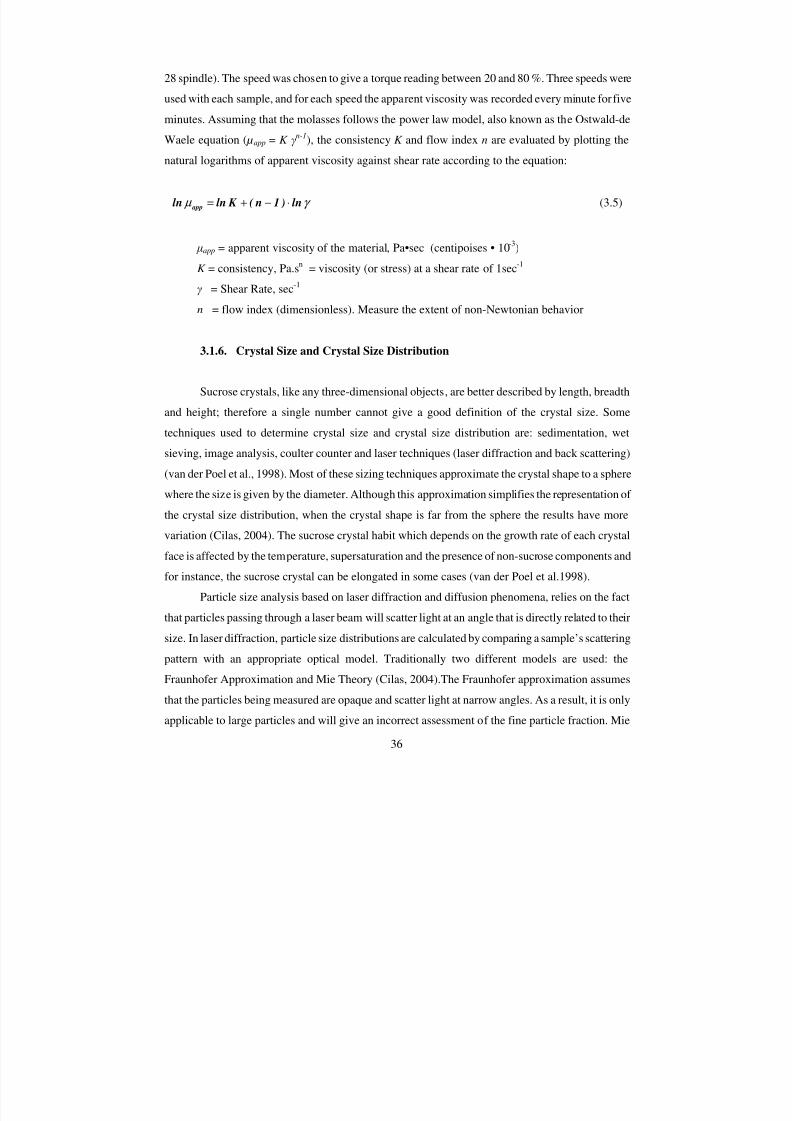
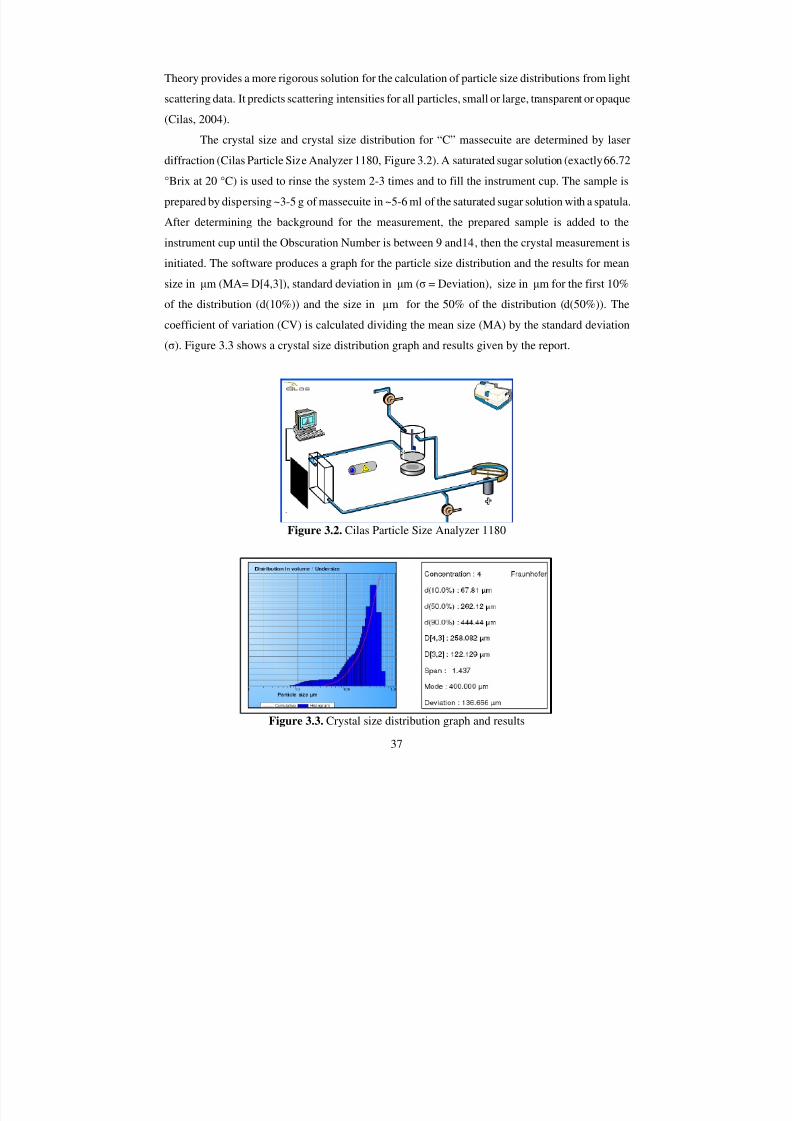
The crystal size and crystal size distribution for “C” massecuite are determined by laser
diffraction (Cilas Particle Size Analyzer 1180, Figure 3.2). A saturated sugar solution (exactly 66.72
°Brix at 20 °C) is used to rinse the system 2-3 times and to fill the instrument cup. The sample is
prepared by dispersing ~3-5 g of massecuite in ~5-6 ml of the saturated sugar solution with a spatula.
After determining the background for the measurement, the prepared sample is added to the
instrument cup until the Obscuration Number is between 9 and14, then the crystal measurement is
initiated. The software produces a graph for the particle size distribution and the results for mean
size in µm (MA= D[4,3]), standard deviation in µm (σ = Deviation), size in µm for the first 10%
of the distribution (d(10%)) and the size in µm for the 50% of the distribution (d(50%)). The
coefficient of variation (CV) is calculated dividing the mean size (MA) by the standard deviation
(σ). Figure 3.3 shows a crystal size distribution graph and results given by the report.
Figure 3.2. Cilas Particle Size Analyzer 1180
Figure 3.3. Crystal size distribution graph and results
7/30/2019 Assessment of Target Purity Difference for a Louisiana Sugar Mill
http://slidepdf.com/reader/full/assessment-of-target-purity-difference-for-a-louisiana-sugar-mill 45/115
38
3.1.7. Sugars by High Performance Liquid Chromatography (HPLC): ICUMSAGS7/4/8-23 (2002)
True Sucrose, Fructose and Glucose in final molasses are determined with high accuracy by
liquid chromatography in Audubon Sugar Institute. An additional dilution is required to analyze the
sample by HPLC, 1.000g of the final molasses 1:1 solution is weighed by duplicate into 100 ml
volumetric flasks then they are taken to volume with DI water.
The diluted samples are filtered through a 0.45 µm filter into a glass sample vial. Three level
of standards, containing sucrose (1000, 2000, and 3000 ppm), glucose (100, 300, and 600 ppm) and
fructose (100, 300, and 600 ppm), are run at the beginning and the end of each six (6) samples set to
verify accuracy.
The instrument and operating conditions are:
HPLC instrument: Agilient 1200 HPLC System
Column: Aminex HPX-87K 300 * 7.8 mm
Column Heater: Agilient 1200 thermostatted column compartment (G1316A) at 80°C
Detector: Agilient 1200 refractive index detector (differential refractometer)
Software: ChemStation
Auto Sampler: Agilient 1200 autosampler with temperature control at 5°C
Injection volume: 20 µl
Pump: Agilient 1200 Isocratic Pump
Flow rate: 0.6 ml/min
Solvent: 0.01 M K2SO4 solution (mobile phase)
3.1.8. Conductivity Ash: ICUMSA GS1/3/4/7/8-13 (1994)
Conductivity ash correlates the specific conductance of a solution to the sulfated ash
concentration. The sample dilution is such that the conductivity measurement does not exceed 500µS/cm so, 0.900 g of the 1:1 final molasses solution is weighed (wS ) into a 200ml volumetric flask
and then it is brought to volume with DI water
The calibration of the conductivity meter is checked and adjusted using a 0.0025 mol/l
potassium chloride (KCl) solution which has a conductivity of 328 µS/cm at 20 °C (362.4 µS/cm at
25 °C). The conductivity of the DI water, used to prepare the solution, is read and registered (water
7/30/2019 Assessment of Target Purity Difference for a Louisiana Sugar Mill
http://slidepdf.com/reader/full/assessment-of-target-purity-difference-for-a-louisiana-sugar-mill 46/115
39
conductivity must be less than 2 µS/cm) and then the same is done to the sample solution rinsing the
probe 3 times with the same solution before reading. The solution level must be above the upper
steel bar of the probe.
The temperature correction for a temperature range of 20 ± 5 °C is:
[ ] ) 20T ( 023 .01
C C T
C 20−⋅+
=° (3.6)
C T = Conductivity in µS/cm at T °C
Corrected conductivity of the solution
21 C C C −= (3.7)
C 1 = measured conductivity in µS/cm at 20 °C
C 2 = specific conductivity of the water in µS/cm at 20 °C
(((( )))) f C 10 D 36 .0 2 .16 (%) Ash tyConductivi4 ⋅⋅⋅⋅⋅⋅⋅⋅⋅⋅⋅⋅⋅⋅⋅⋅++++==== −−−− (3.8)
D = dry substance concentration of the solution in g/100ml
S = mass of sample (g) in 100 ml (S = wS /DF)
f = dilution factor of the solution in comparison with 5 g/100 ml, i.e. f = 5/S
3.1.9. Zinc Analysis by Inductively Coupled Plasma Atomic Emission Spectroscopy
(ICP-AES)
ICP-AES is a type of emission spectroscopy that uses the inductively coupled plasma to
produce excited atoms and ions. As these atoms and ions return from the excited state to the ground
state, they emit electromagnetic radiation at a determined wavelength which is according to the
chemical character of the element. The intensity of the emitted energy is proportional to the element
concentration in the sample. The element concentration can be quantified by comparing to a
reference standard, Wikipedia (2009).
For trace analysis determination it is very important to have a sample pretreatment to: digest
the organic matrix, decrease viscosity, increase homogeneity, release the analytes from various
7/30/2019 Assessment of Target Purity Difference for a Louisiana Sugar Mill
http://slidepdf.com/reader/full/assessment-of-target-purity-difference-for-a-louisiana-sugar-mill 47/115
40
compounds and phases and remove components which may affect the analytical signal. Wikipedia
(2009)
For the sample preparation, microwave assisted acid digestion is used (EPA Method 3052),
0.5g of sample is weighed into teflon cup adding 9 ml of concentrated nitric acid and 1 ml of
concentrated hydrochloric acid. The cup is sealed and placed in microwave where the temperature is
ramped to 200 °C over 10 min., then held at 200 °C for 15 min., then cooled. The sample is
transferred to 100 ml volumetric and brought to volume with DI water. Now it is ready for ICP-AES
(EPA Method 200.7), AgChemistry (2009)
3.2. Evaluation of Purity Drop and Crystal Content for each Stage of the Low-grade
Station (Nutsch Analysis)
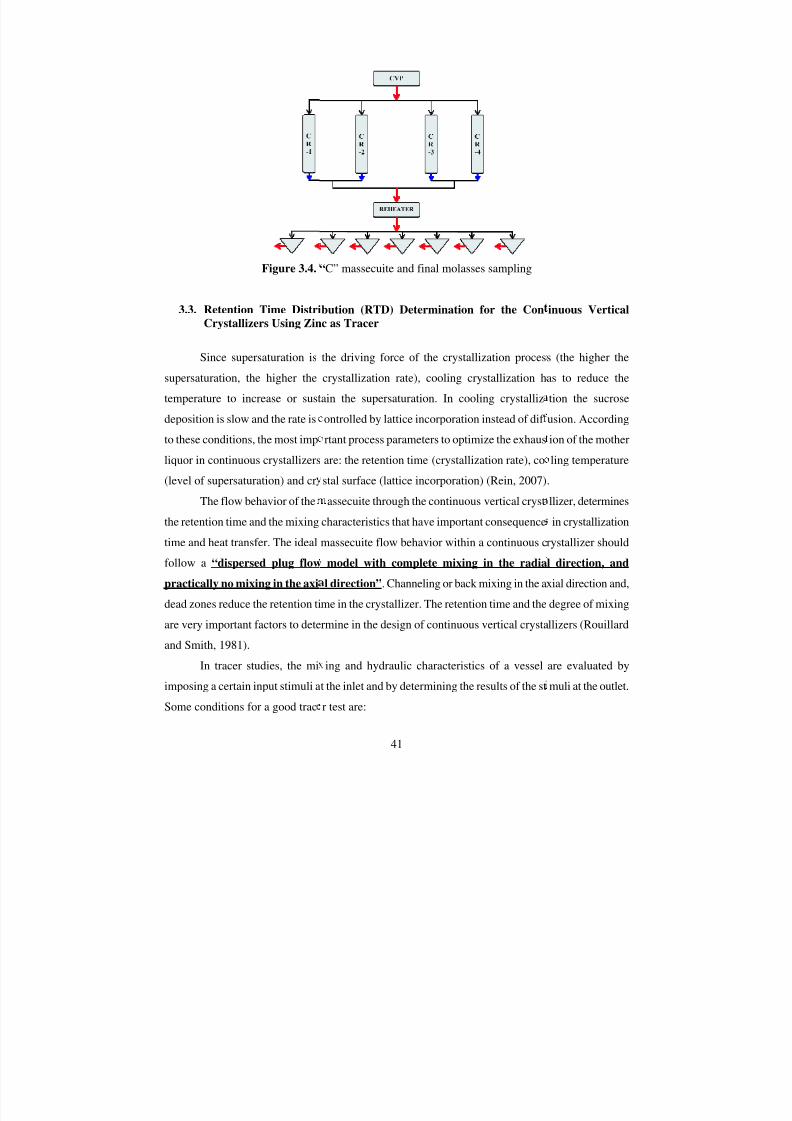
Sampling: Once a week, samples of “C” massecuite and final molasses were taken in the
following order (see Table 3.1 and Figure 3.4):
− “C” massecuite after crystallizers (reheater inlet);
− “C” massecuite after continuous vacuum pan – CVP (pan discharge, before “C”
massecuite receiver);
− “C” massecuite after reheater (centrifuges feed) and;
− Final molasses from each centrifuge (7 machines).
− “C” massecuites from each individual crystallizer for nutsch analysis were taken 3 times
during the season.
− Sampling and analysis were run and reported each Monday during 10 weeks
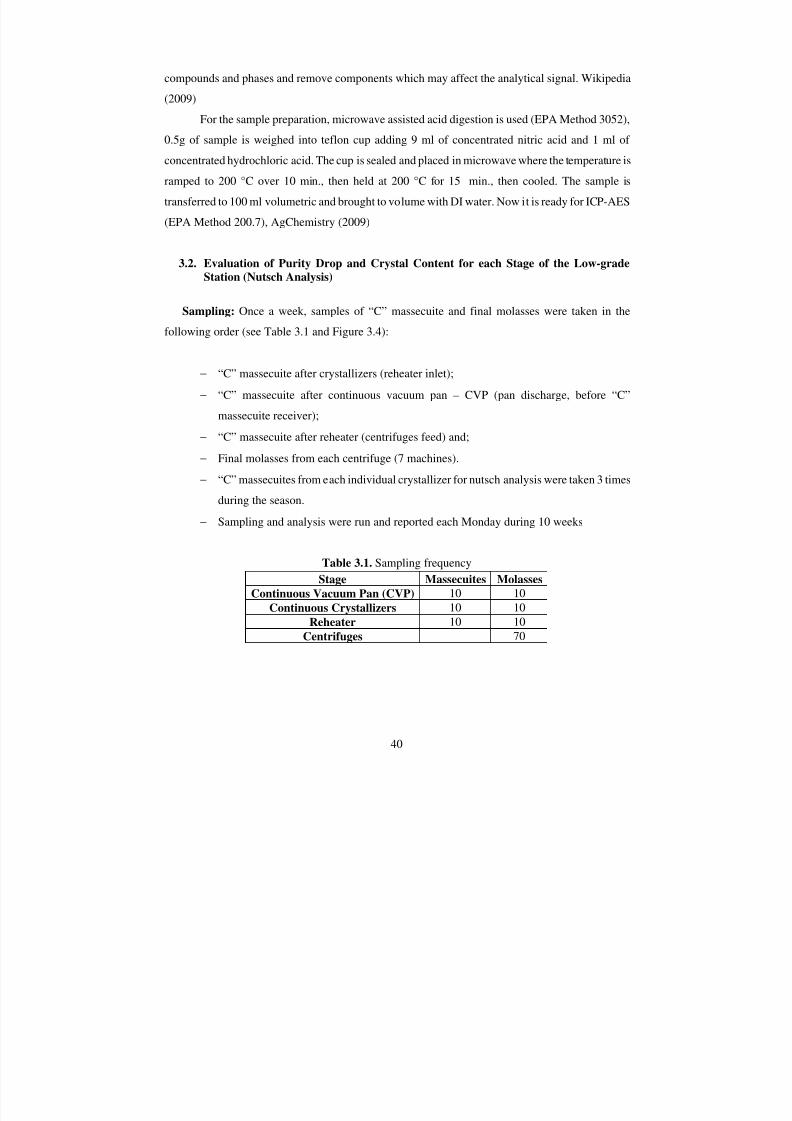
Table 3.1. Sampling frequency
Stage Massecuites Molasses
Continuous Vacuum Pan (CVP) 10 10
Continuous Crystallizers 10 10Reheater 10 10
Centrifuges 70
7/30/2019 Assessment of Target Purity Difference for a Louisiana Sugar Mill
http://slidepdf.com/reader/full/assessment-of-target-purity-difference-for-a-louisiana-sugar-mill 48/115
7/30/2019 Assessment of Target Purity Difference for a Louisiana Sugar Mill
http://slidepdf.com/reader/full/assessment-of-target-purity-difference-for-a-louisiana-sugar-mill 49/115
42
− The tracer can be easily measured
− The tracer or property (e.g. absorbance, fluorescence, pH, and conductivity) is not
modified by the operation conditions
− The tracer is completely mixed with the fluid exhibiting the same flow pattern as the
fluid.
Various tracers have been used for the evaluation of crystallizers in the sugar industry. Some
of them are: lithium chloride, radioactive iodine, zinc sulphate, and magnesium salts. The use of
PVC rings as a tracer has also been mentioned to evaluate crystallizers design (Rouillard and Smith,
1981).
Tracer Test Design:
Cane Grinding rate…….. .…………………………~ 22,000 tc/day
“C” massecuite/ton of cane……...…………………~1 ft3 /tc
Continuous Vertical Crystallizers capacity …...…...~31,000 ft3
Zinc Sulphate Technical grade…………………......~95% ZnSO4*H2O
% Zn in ZnSO4*H2O……………………………….~34.6 %
Application of 95% ZnSO4*H2O …………………..~9.072 kg
ZnSO4*H2O Solubility …………….……………….~0.7 g/mL H2O
Solution of Zinc Sulphate (95%) …..………………~9.072 kg/4glns H2O
Injection Point……………………….……………..Compartment 11 continuous vacuum pan
Injection Rate …………..………………………….~1 gal/min
Zinc sulphate (~9.072 kg) was dissolved in 4 gals of water and then it was injected in the
compartment 11 of the continuous vacuum pan using the same compartment’s vacuum. The “C”
massecuite leaving the pan was sampled every 10 minutes during 2 hours. Five hours after, “C”massecuites hourly samples were taken from the top of each crystallizer during 44 hours. Zinc
analysis was performed by AgChemistry using Inductively Coupled Plasma Atomic Emission
Spectroscopy (ICP-AES).
7/30/2019 Assessment of Target Purity Difference for a Louisiana Sugar Mill
http://slidepdf.com/reader/full/assessment-of-target-purity-difference-for-a-louisiana-sugar-mill 50/115
43
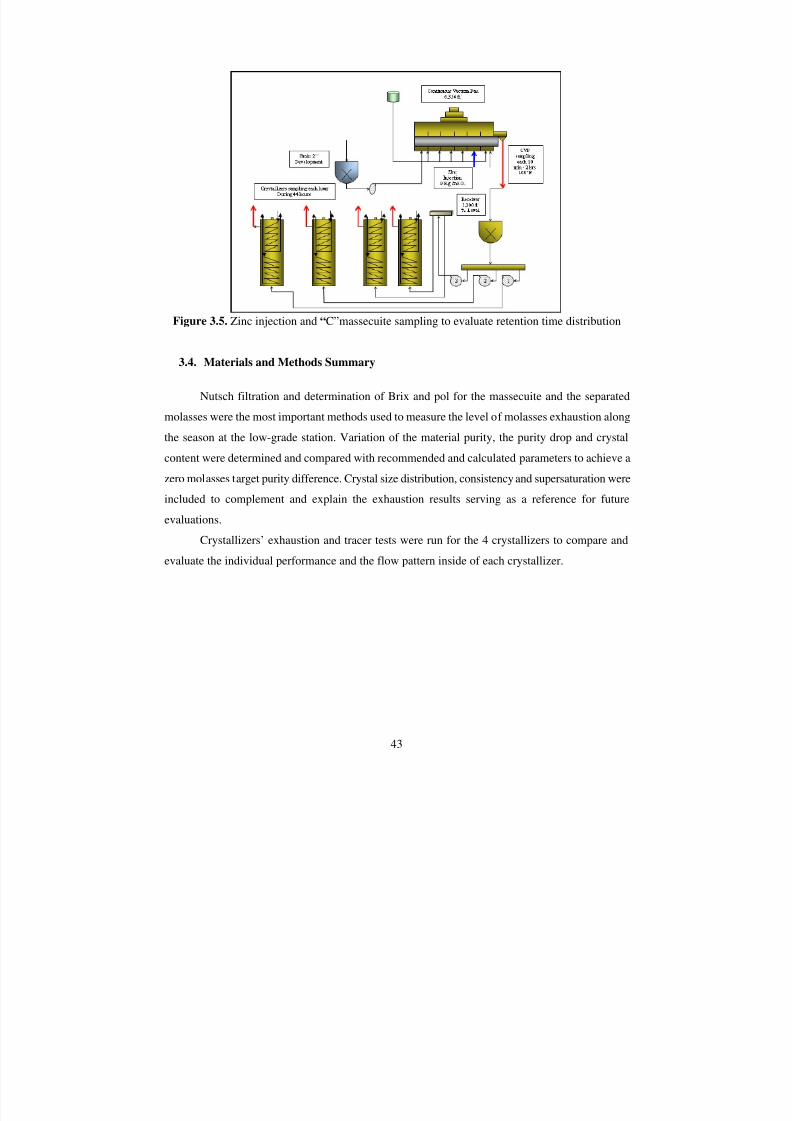
Figure 3.5. Zinc injection and “C”massecuite sampling to evaluate retention time distribution
3.4. Materials and Methods Summary
Nutsch filtration and determination of Brix and pol for the massecuite and the separated
molasses were the most important methods used to measure the level of molasses exhaustion along
the season at the low-grade station. Variation of the material purity, the purity drop and crystal
content were determined and compared with recommended and calculated parameters to achieve a
zero molasses target purity difference. Crystal size distribution, consistency and supersaturation were
included to complement and explain the exhaustion results serving as a reference for future
evaluations.
Crystallizers’ exhaustion and tracer tests were run for the 4 crystallizers to compare and
evaluate the individual performance and the flow pattern inside of each crystallizer.
7/30/2019 Assessment of Target Purity Difference for a Louisiana Sugar Mill
http://slidepdf.com/reader/full/assessment-of-target-purity-difference-for-a-louisiana-sugar-mill 51/115
7/30/2019 Assessment of Target Purity Difference for a Louisiana Sugar Mill
http://slidepdf.com/reader/full/assessment-of-target-purity-difference-for-a-louisiana-sugar-mill 52/115
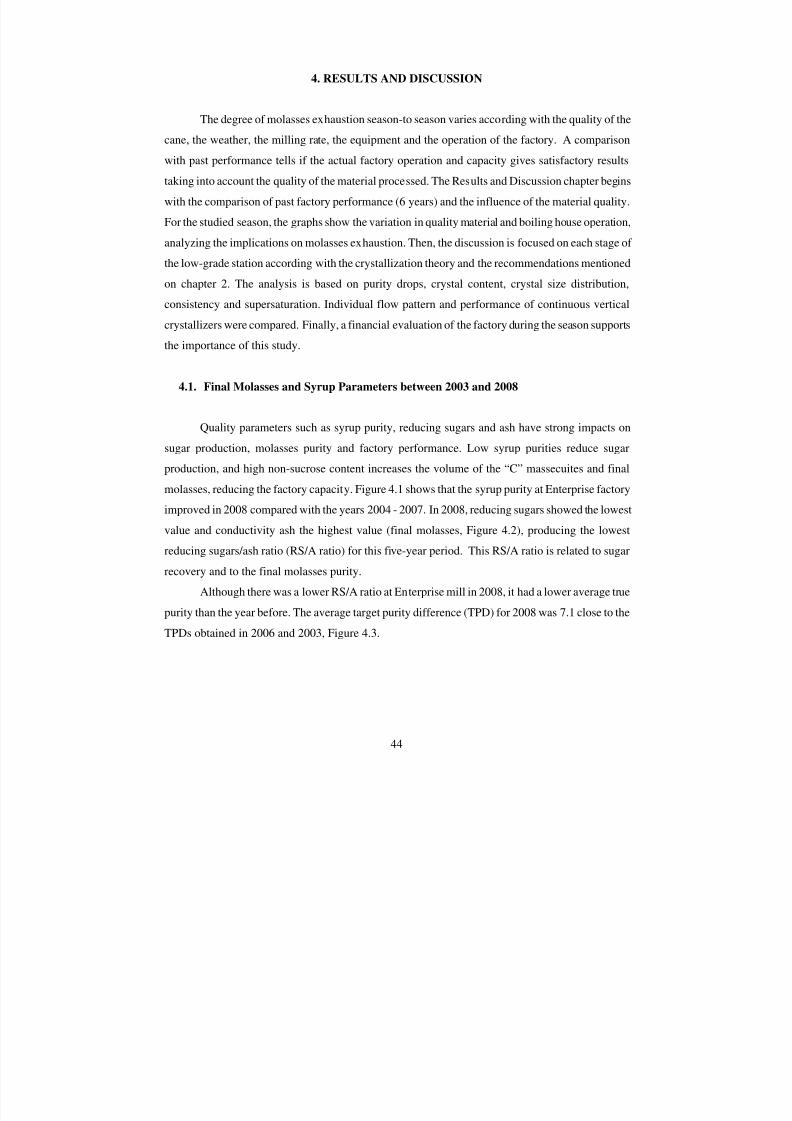
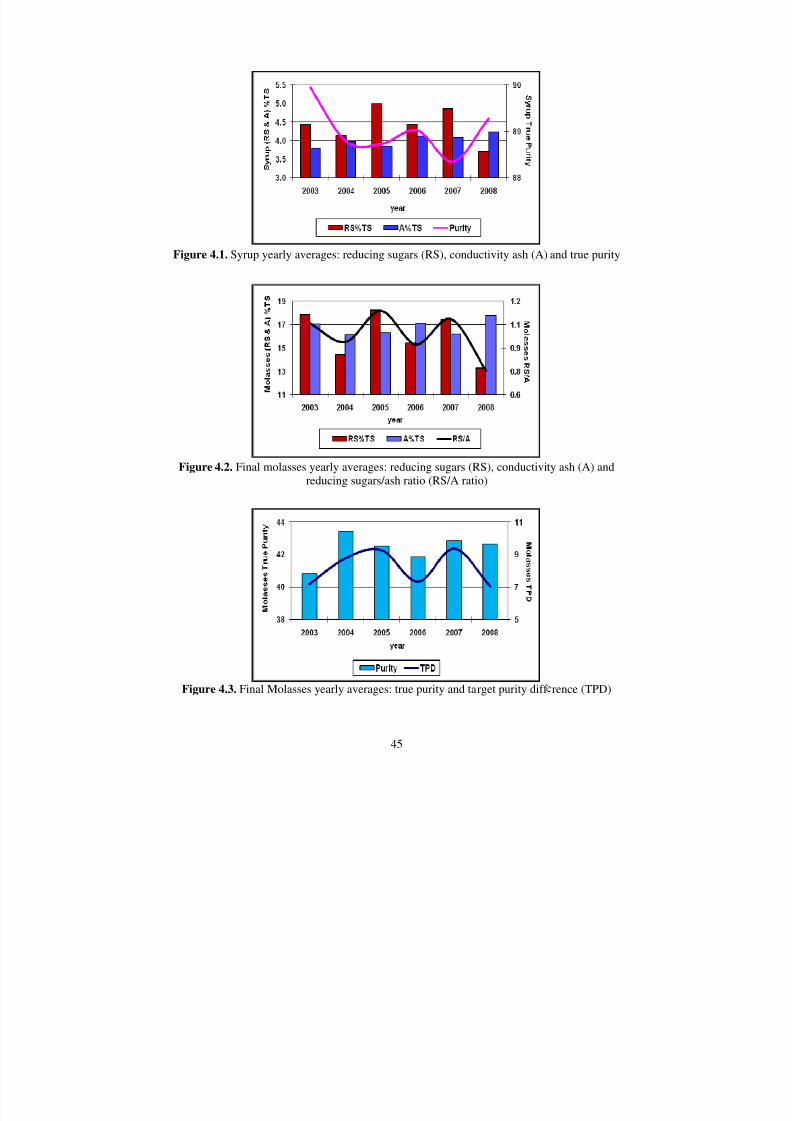
Figure 4.1. Syrup yearly avera
Figure 4.2. Final molasses yered
Figure 4.3. Final Molasses y
45
ges: reducing sugars (RS), conductivity ash (A)
arly averages: reducing sugars (RS), conductiviucing sugars/ash ratio (RS/A ratio)
early averages: true purity and target purity diff
and true purity
ty ash (A) and
rence (TPD)
7/30/2019 Assessment of Target Purity Difference for a Louisiana Sugar Mill
http://slidepdf.com/reader/full/assessment-of-target-purity-difference-for-a-louisiana-sugar-mill 53/115
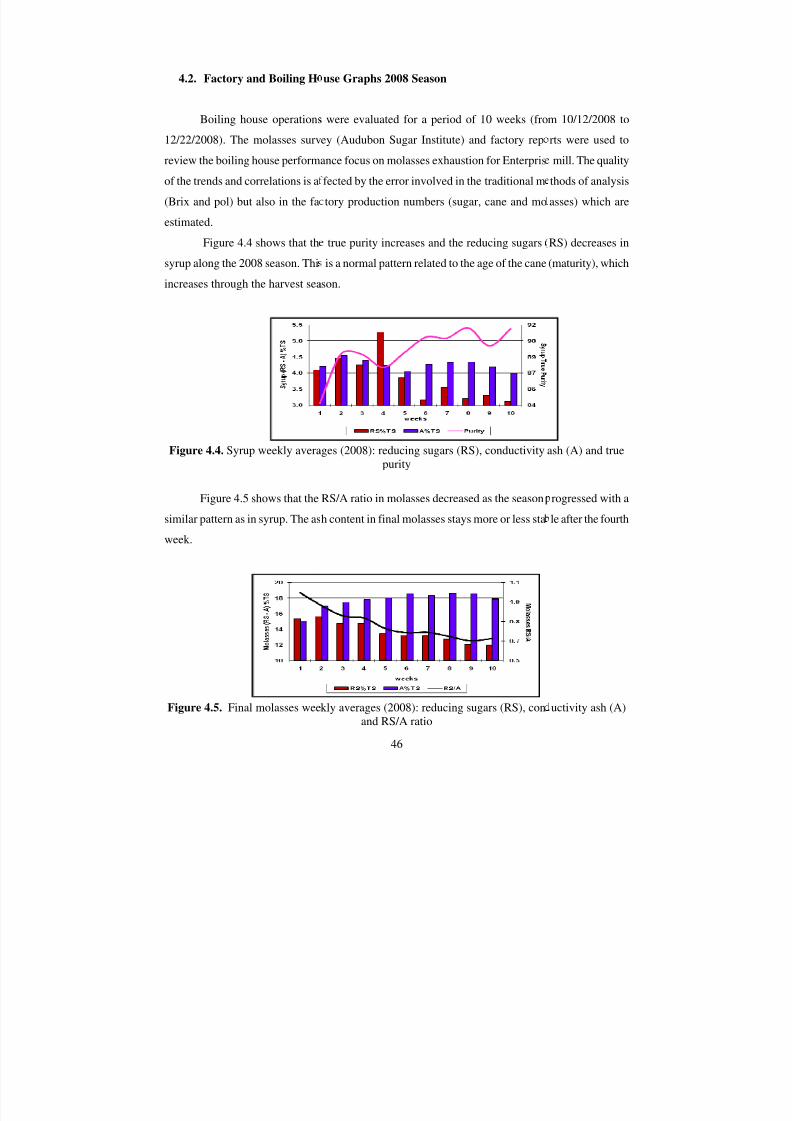
4.2. Factory and Boiling H
Boiling house operations
12/22/2008). The molasses surv
review the boiling house perform
of the trends and correlations is a
(Brix and pol) but also in the fa
estimated.
Figure 4.4 shows that th
syrup along the 2008 season. Thi
increases through the harvest sea
Figure 4.4. Syrup weekly avera
Figure 4.5 shows that the
similar pattern as in syrup. The as
week.
Figure 4.5. Final molasses wee
46
use Graphs 2008 Season
were evaluated for a period of 10 weeks (fro
ey (Audubon Sugar Institute) and factory rep
ance focus on molasses exhaustion for Enterpris
fected by the error involved in the traditional m
tory production numbers (sugar, cane and mo
true purity increases and the reducing sugars
is a normal pattern related to the age of the cane
son.
ges (2008): reducing sugars (RS), conductivitypurity
RS/A ratio in molasses decreased as the season
h content in final molasses stays more or less sta
kly averages (2008): reducing sugars (RS), conand RS/A ratio
m 10/12/2008 to
rts were used to
mill. The quality
thods of analysis
asses) which are
RS) decreases in
(maturity), which
ash (A) and true
rogressed with a
le after the fourth
uctivity ash (A)
7/30/2019 Assessment of Target Purity Difference for a Louisiana Sugar Mill
http://slidepdf.com/reader/full/assessment-of-target-purity-difference-for-a-louisiana-sugar-mill 54/115
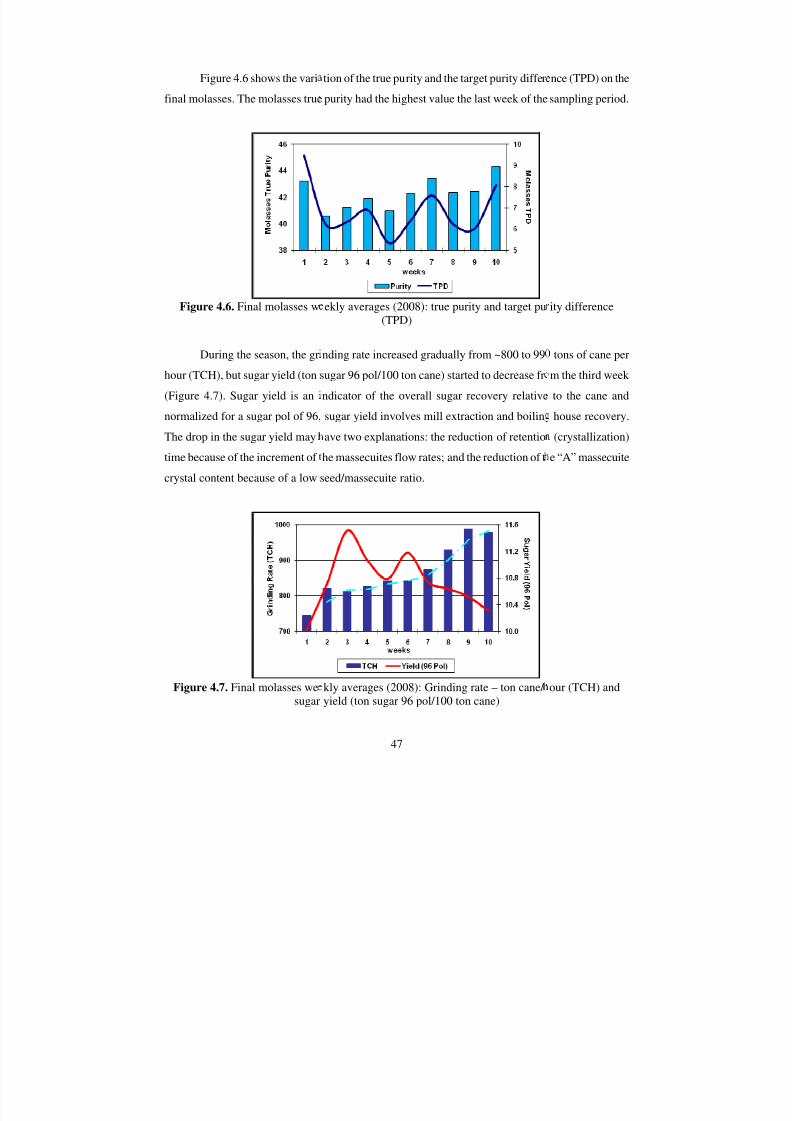
Figure 4.6 shows the vari
final molasses. The molasses true
Figure 4.6. Final molasses w
During the season, the gr
hour (TCH), but sugar yield (ton
(Figure 4.7). Sugar yield is an
normalized for a sugar pol of 96,
The drop in the sugar yield may
time because of the increment of
crystal content because of a low
Figure 4.7. Final molasses wesugar
47
tion of the true purity and the target purity differ
purity had the highest value the last week of the
ekly averages (2008): true purity and target pu(TPD)
nding rate increased gradually from ~800 to 99
sugar 96 pol/100 ton cane) started to decrease fr
ndicator of the overall sugar recovery relative
sugar yield involves mill extraction and boilin
ave two explanations: the reduction of retentio
he massecuites flow rates; and the reduction of t
seed/massecuite ratio.
kly averages (2008): Grinding rate – ton cane/ yield (ton sugar 96 pol/100 ton cane)
nce (TPD) on the
sampling period.
ity difference
tons of cane per
m the third week
to the cane and
house recovery.
(crystallization)
e “A” massecuite
our (TCH) and
7/30/2019 Assessment of Target Purity Difference for a Louisiana Sugar Mill
http://slidepdf.com/reader/full/assessment-of-target-purity-difference-for-a-louisiana-sugar-mill 55/115
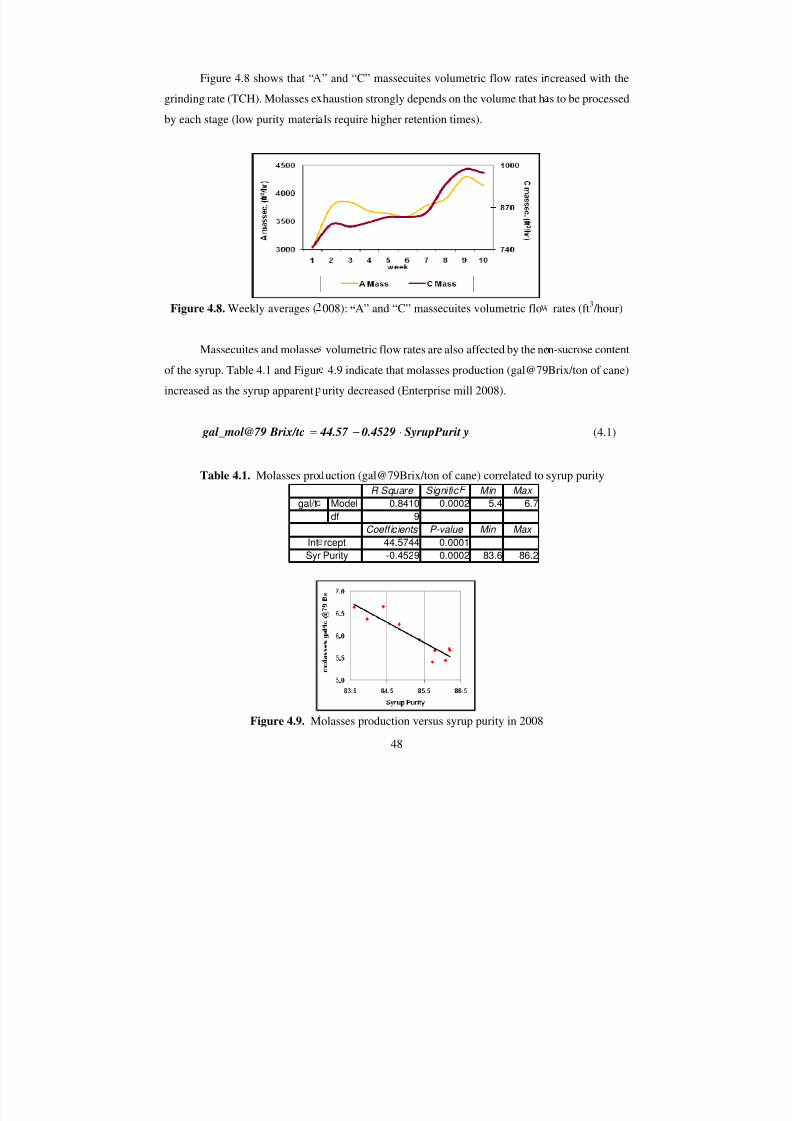
Figure 4.8 shows that “
grinding rate (TCH). Molasses e
by each stage (low purity materi
Figure 4.8. Weekly averages (
Massecuites and molasse
of the syrup. Table 4.1 and Figur
increased as the syrup apparent
Brix/tc gal_mol@79 =
Table 4.1. Molasses pro
Figure 4.9. M
gal/t
Int
Syr
48
” and “C” massecuites volumetric flow rates i
haustion strongly depends on the volume that h
ls require higher retention times).
008): “A” and “C” massecuites volumetric flo
volumetric flow rates are also affected by the no
4.9 indicate that molasses production (gal@79
urity decreased (Enterprise mill 2008).
ySyrupPurit0.4529 44.57 ⋅−
uction (gal@79Brix/ton of cane) correlated to
olasses production versus syrup purity in 2008
R Square Signific Min Max
Model 0.8410 0.0002 5.4 6.7
df 9
Coefficients P-value Min Max
44.5744 0.0001
-0.4529 0.0002 83.6 86.2
rcept
Purity
creased with the
s to be processed
rates (ft3 /hour)
n-sucrose content
Brix/ton of cane)
(4.1)
syrup purity
7/30/2019 Assessment of Target Purity Difference for a Louisiana Sugar Mill
http://slidepdf.com/reader/full/assessment-of-target-purity-difference-for-a-louisiana-sugar-mill 56/115
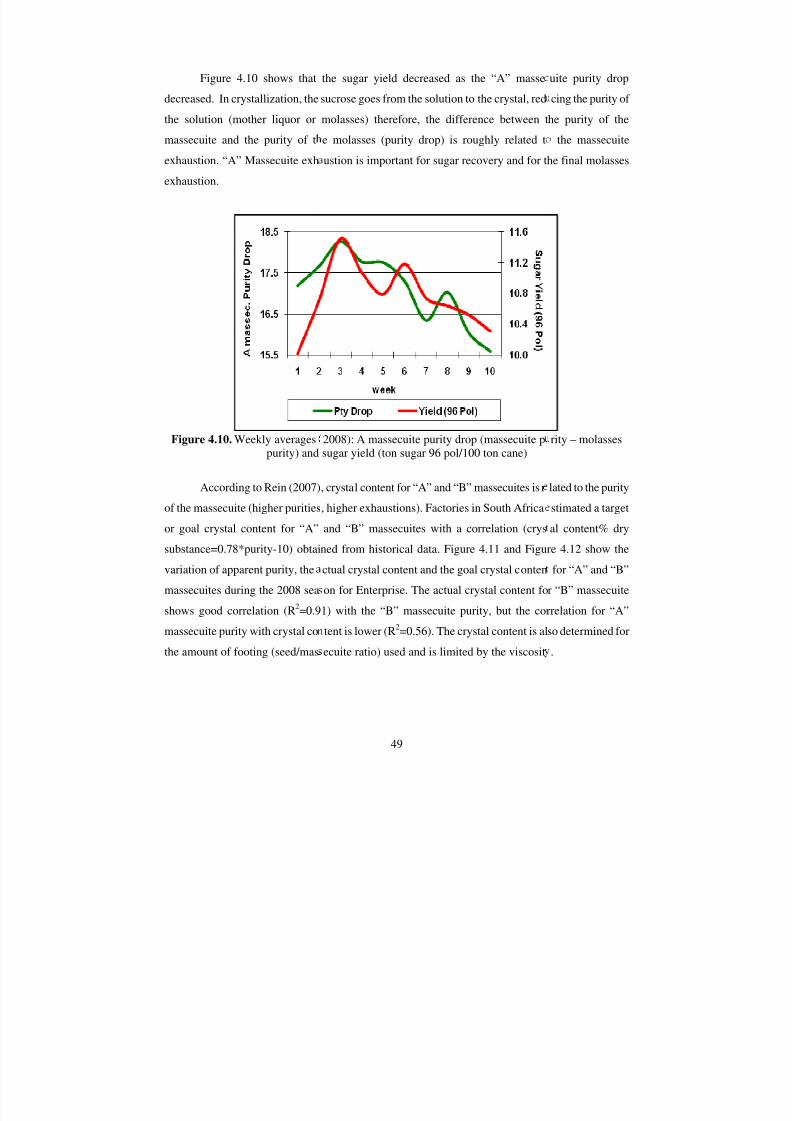
Figure 4.10 shows that
decreased. In crystallization, the
the solution (mother liquor or
massecuite and the purity of t
exhaustion. “A” Massecuite exh
exhaustion.
Figure 4.10. Weekly averages
purity) and
According to Rein (2007)
of the massecuite (higher purities
or goal crystal content for “A”
substance=0.78*purity-10) obtai
variation of apparent purity, the
massecuites during the 2008 sea
shows good correlation (R2=0.9
massecuite purity with crystal co
the amount of footing (seed/mas
49
the sugar yield decreased as the “A” masse
sucrose goes from the solution to the crystal, red
molasses) therefore, the difference between t
e molasses (purity drop) is roughly related t
ustion is important for sugar recovery and for t
2008): A massecuite purity drop (massecuite p
sugar yield (ton sugar 96 pol/100 ton cane)
, crystal content for “A” and “B” massecuites is r
, higher exhaustions). Factories in South Africa
and “B” massecuites with a correlation (crys
ned from historical data. Figure 4.11 and Figu
ctual crystal content and the goal crystal conten
on for Enterprise. The actual crystal content fo
1) with the “B” massecuite purity, but the co
tent is lower (R2=0.56). The crystal content is al
ecuite ratio) used and is limited by the viscosit
uite purity drop
cing the purity of
he purity of the
the massecuite
he final molasses
rity – molasses
lated to the purity
stimated a target
al content% dry
re 4.12 show the
for “A” and “B”
r “B” massecuite
rrelation for “A”
so determined for
.
7/30/2019 Assessment of Target Purity Difference for a Louisiana Sugar Mill
http://slidepdf.com/reader/full/assessment-of-target-purity-difference-for-a-louisiana-sugar-mill 57/115
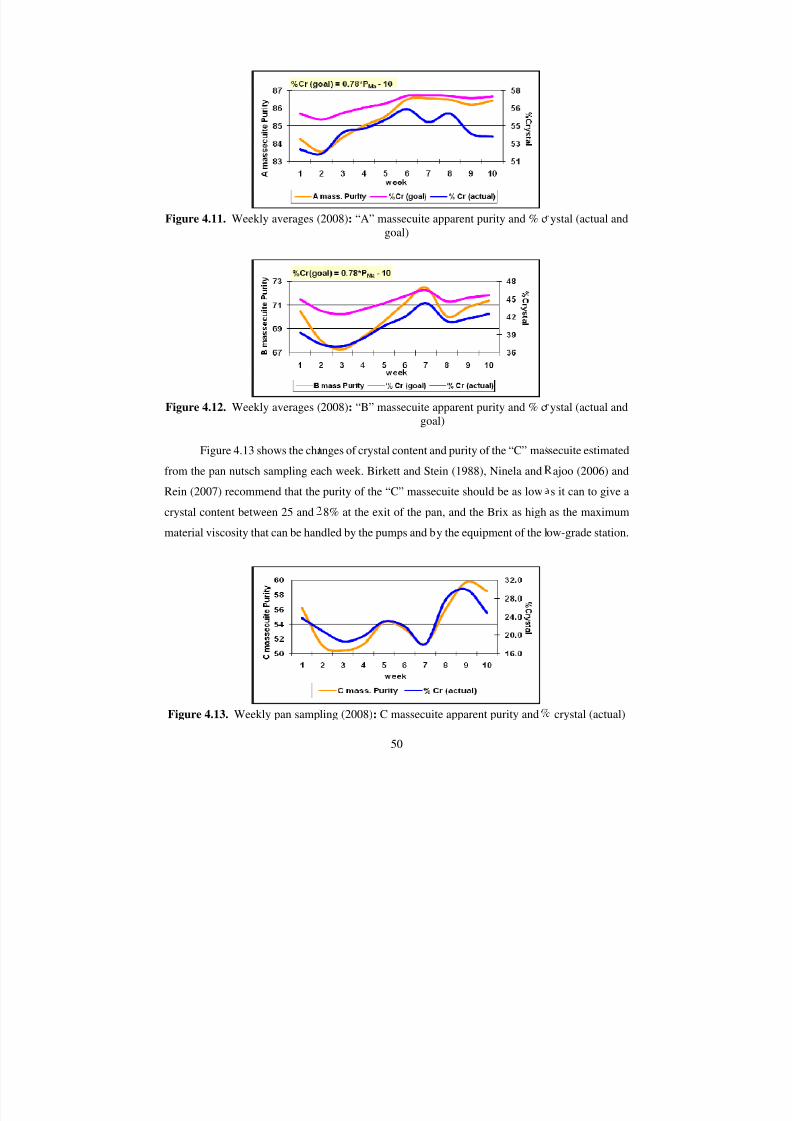
Figure 4.11. Weekly averages (
Figure 4.12. Weekly averages (
Figure 4.13 shows the chafrom the pan nutsch sampling ea
Rein (2007) recommend that the
crystal content between 25 and
material viscosity that can be han
Figure 4.13. Weekly pan samp
50
2008): “A” massecuite apparent purity and % cgoal)
2008): “B” massecuite apparent purity and % cgoal)
nges of crystal content and purity of the “C” masch week. Birkett and Stein (1988), Ninela and
purity of the “C” massecuite should be as low
8% at the exit of the pan, and the Brix as high
dled by the pumps and by the equipment of the l
ling (2008): C massecuite apparent purity and
ystal (actual and
ystal (actual and
secuite estimatedajoo (2006) and
s it can to give a
as the maximum
ow-grade station.
crystal (actual)
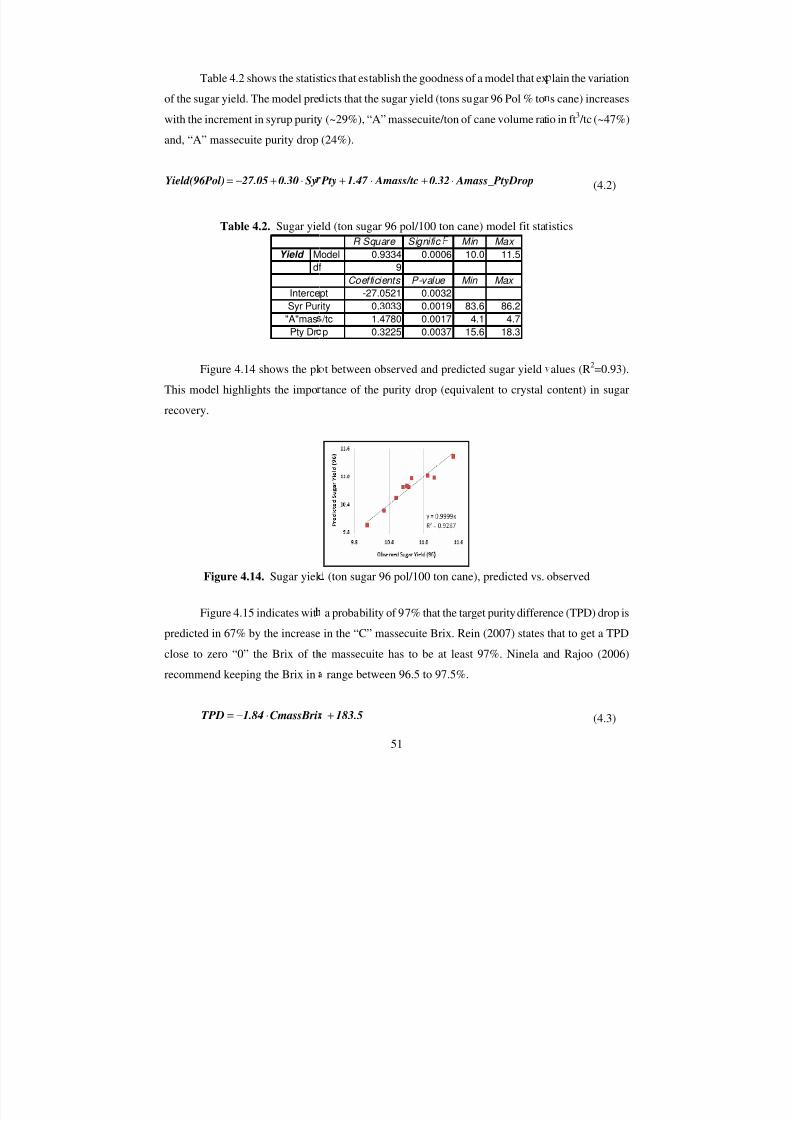
7/30/2019 Assessment of Target Purity Difference for a Louisiana Sugar Mill
http://slidepdf.com/reader/full/assessment-of-target-purity-difference-for-a-louisiana-sugar-mill 58/115
Table 4.2 shows the statis
of the sugar yield. The model pre
with the increment in syrup purit
and, “A” massecuite purity drop
Sy0.30 27.05l)Yield(96Po ⋅+−=
Table 4.2. Sugar yie
Figure 4.14 shows the pl
This model highlights the impo
recovery.
Figure 4.14. Sugar yiel
Figure 4.15 indicates wit
predicted in 67% by the increase
close to zero “0” the Brix of th
recommend keeping the Brix in
CmassBri1.84TPD ⋅−=
Yield M
df
Interce
Syr Pur"A"mas
Pty Dr
51
tics that establish the goodness of a model that ex
icts that the sugar yield (tons sugar 96 Pol % to
(~29%), “A” massecuite/ton of cane volume rat
(24%).
rop Amass_PtyD0.32 Amass/tc1.47 Pty ⋅+⋅+
ld (ton sugar 96 pol/100 ton cane) model fit sta
t between observed and predicted sugar yield
tance of the purity drop (equivalent to crystal
(ton sugar 96 pol/100 ton cane), predicted vs.
a probability of 97% that the target purity differe
in the “C” massecuite Brix. Rein (2007) states
e massecuite has to be at least 97%. Ninela a
range between 96.5 to 97.5%.
183.5+
R Square Signific Min Max
odel 0.9334 0.0006 10.0 11.5
9
Coefficients P-value Min Max
-27.0521 0.0032
0.3033 0.0019 83.6 86.21.4780 0.0017 4.1 4.7
0.3225 0.0037 15.6 18.3
pt
ity /tc
p
lain the variation
s cane) increases
io in ft3 /tc (~47%)
(4.2)
istics
alues (R2=0.93).
content) in sugar
observed
nce (TPD) drop is
that to get a TPD
nd Rajoo (2006)
(4.3)
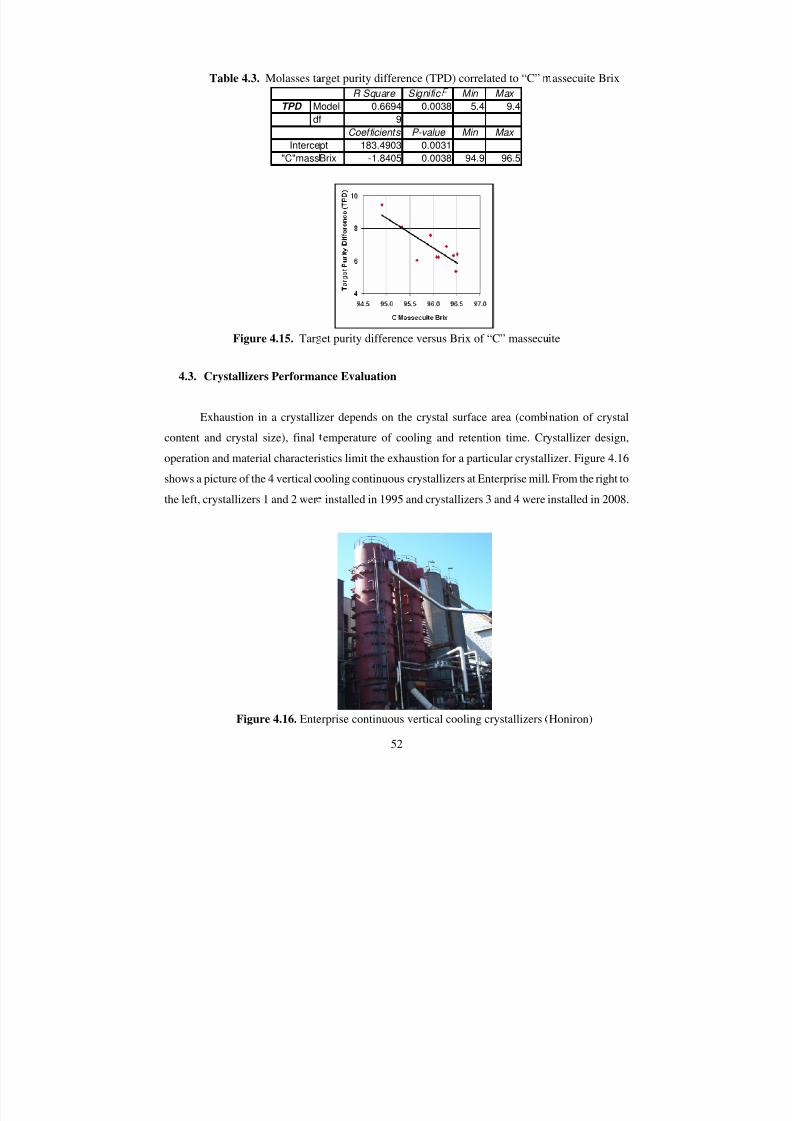
7/30/2019 Assessment of Target Purity Difference for a Louisiana Sugar Mill
http://slidepdf.com/reader/full/assessment-of-target-purity-difference-for-a-louisiana-sugar-mill 59/115
Table 4.3. Molasses ta
Figure 4.15. Tar
4.3. Crystallizers Performa
Exhaustion in a crystalli
content and crystal size), final
operation and material characteri
shows a picture of the 4 vertical c
the left, crystallizers 1 and 2 wer
Figure 4.16. Ente
TPD M
df
Interce
"C"mass
52
rget purity difference (TPD) correlated to “C”
et purity difference versus Brix of “C” massecu
nce Evaluation
zer depends on the crystal surface area (comb
emperature of cooling and retention time. Cr
stics limit the exhaustion for a particular crystal
ooling continuous crystallizers at Enterprise mill
installed in 1995 and crystallizers 3 and 4 were
rprise continuous vertical cooling crystallizers
R Square Signific Min Max
odel 0.6694 0.0038 5.4 9.4
9
Coefficients P-value Min Max
183.4903 0.0031
-1.8405 0.0038 94.9 96.5
pt
Brix
assecuite Brix
ite
nation of crystal
ystallizer design,
lizer. Figure 4.16
. From the right to
installed in 2008.
Honiron)
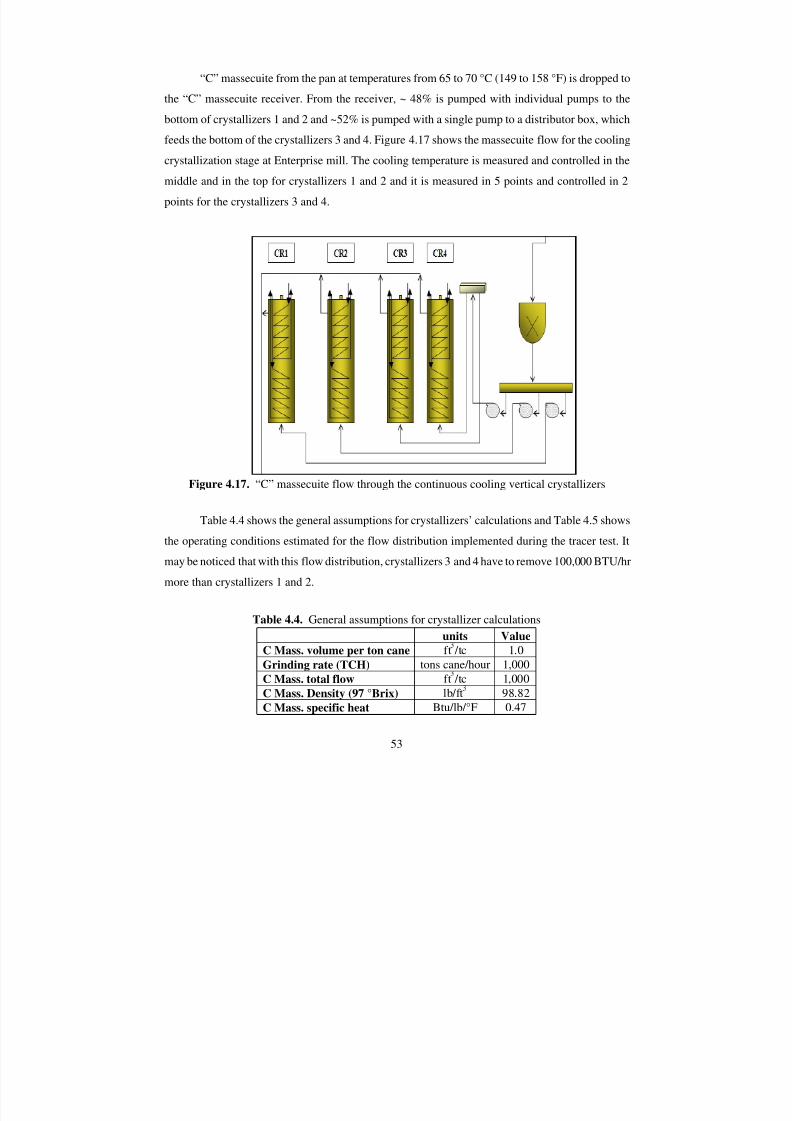
7/30/2019 Assessment of Target Purity Difference for a Louisiana Sugar Mill
http://slidepdf.com/reader/full/assessment-of-target-purity-difference-for-a-louisiana-sugar-mill 60/115
53
“C” massecuite from the pan at temperatures from 65 to 70 °C (149 to 158 °F) is dropped to
the “C” massecuite receiver. From the receiver, ~ 48% is pumped with individual pumps to the
bottom of crystallizers 1 and 2 and ~52% is pumped with a single pump to a distributor box, which
feeds the bottom of the crystallizers 3 and 4. Figure 4.17 shows the massecuite flow for the cooling
crystallization stage at Enterprise mill. The cooling temperature is measured and controlled in the
middle and in the top for crystallizers 1 and 2 and it is measured in 5 points and controlled in 2
points for the crystallizers 3 and 4.
Figure 4.17. “C” massecuite flow through the continuous cooling vertical crystallizers
Table 4.4 shows the general assumptions for crystallizers’ calculations and Table 4.5 shows
the operating conditions estimated for the flow distribution implemented during the tracer test. It
may be noticed that with this flow distribution, crystallizers 3 and 4 have to remove 100,000 BTU/hr
more than crystallizers 1 and 2.
Table 4.4. General assumptions for crystallizer calculations
units Value
C Mass. volume per ton cane ft /tc 1.0
Grinding rate (TCH) tons cane/hour 1,000
C Mass. total flow ft /tc 1,000
C Mass. Density (97 °Brix) lb/ft 98.82
C Mass. specific heat Btu/lb/°F 0.47
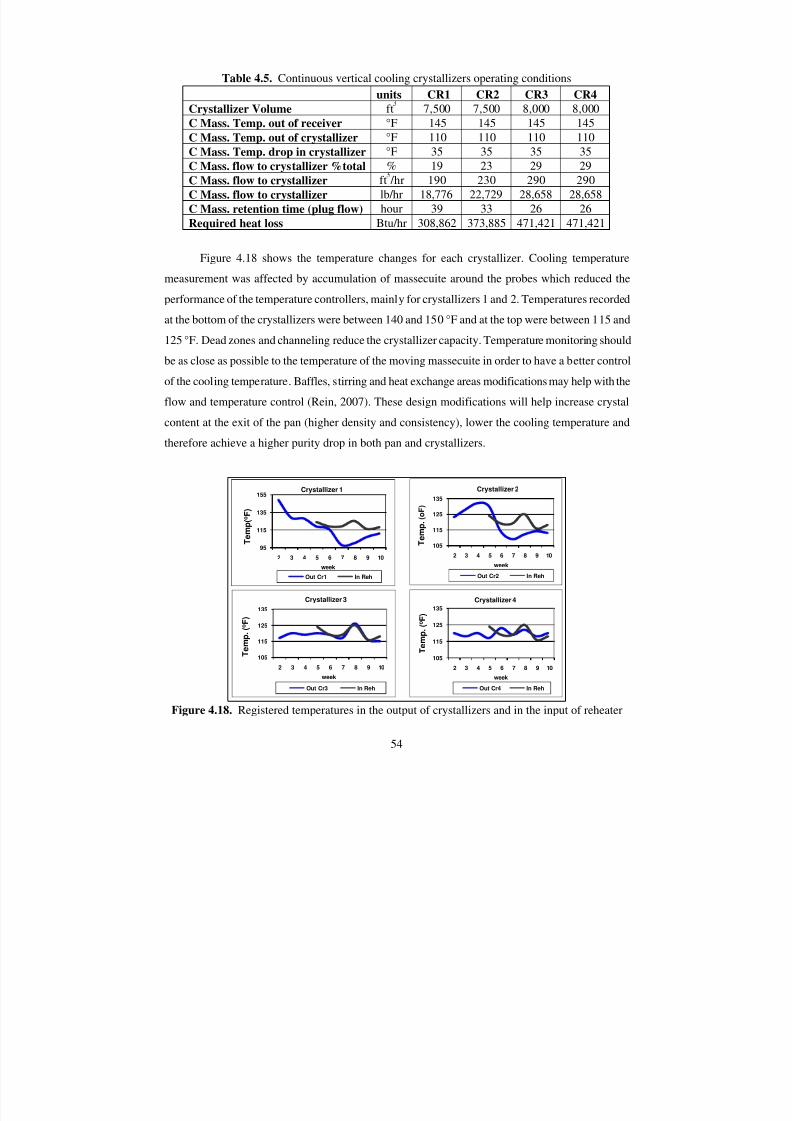
7/30/2019 Assessment of Target Purity Difference for a Louisiana Sugar Mill
http://slidepdf.com/reader/full/assessment-of-target-purity-difference-for-a-louisiana-sugar-mill 61/115
54
Table 4.5. Continuous vertical cooling crystallizers operating conditions
units CR1 CR2 CR3 CR4
Crystallizer Volume ft 7,500 7,500 8,000 8,000
C Mass. Temp. out of receiver °F 145 145 145 145
C Mass. Temp. out of crystallizer °F 110 110 110 110
C Mass. Temp. drop in crystallizer °F 35 35 35 35C Mass. flow to crystallizer %total % 19 23 29 29
C Mass. flow to crystallizer ft /hr 190 230 290 290
C Mass. flow to crystallizer lb/hr 18,776 22,729 28,658 28,658
C Mass. retention time (plug flow) hour 39 33 26 26
Required heat loss Btu/hr 308,862 373,885 471,421 471,421
Figure 4.18 shows the temperature changes for each crystallizer. Cooling temperature
measurement was affected by accumulation of massecuite around the probes which reduced the
performance of the temperature controllers, mainly for crystallizers 1 and 2. Temperatures recordedat the bottom of the crystallizers were between 140 and 150 °F and at the top were between 115 and
125 °F. Dead zones and channeling reduce the crystallizer capacity. Temperature monitoring should
be as close as possible to the temperature of the moving massecuite in order to have a better control
of the cooling temperature. Baffles, stirring and heat exchange areas modifications may help with the
flow and temperature control (Rein, 2007). These design modifications will help increase crystal
content at the exit of the pan (higher density and consistency), lower the cooling temperature and
therefore achieve a higher purity drop in both pan and crystallizers.
Figure 4.18. Registered temperatures in the output of crystallizers and in the input of reheater
105
115
125
135
2 3 4 5 6 7 8 9 10
T e m p .
( o F )
week
Crystallizer 2
Out Cr2 In Reh
105
115
125
135
2 3 4 5 6 7 8 9 10
T e m p .
( o F )
week
Crystallizer 3
Out Cr3 In Reh
105
115
125
135
2 3 4 5 6 7 8 9 10
T e m p .
( o F )
week
Crystallizer 4
Out Cr4 In Reh
95
115
135
155
2 3 4 5 6 7 8 9 10
T e m p ( o F )
week
Crystallizer 1
Out Cr1 In Reh
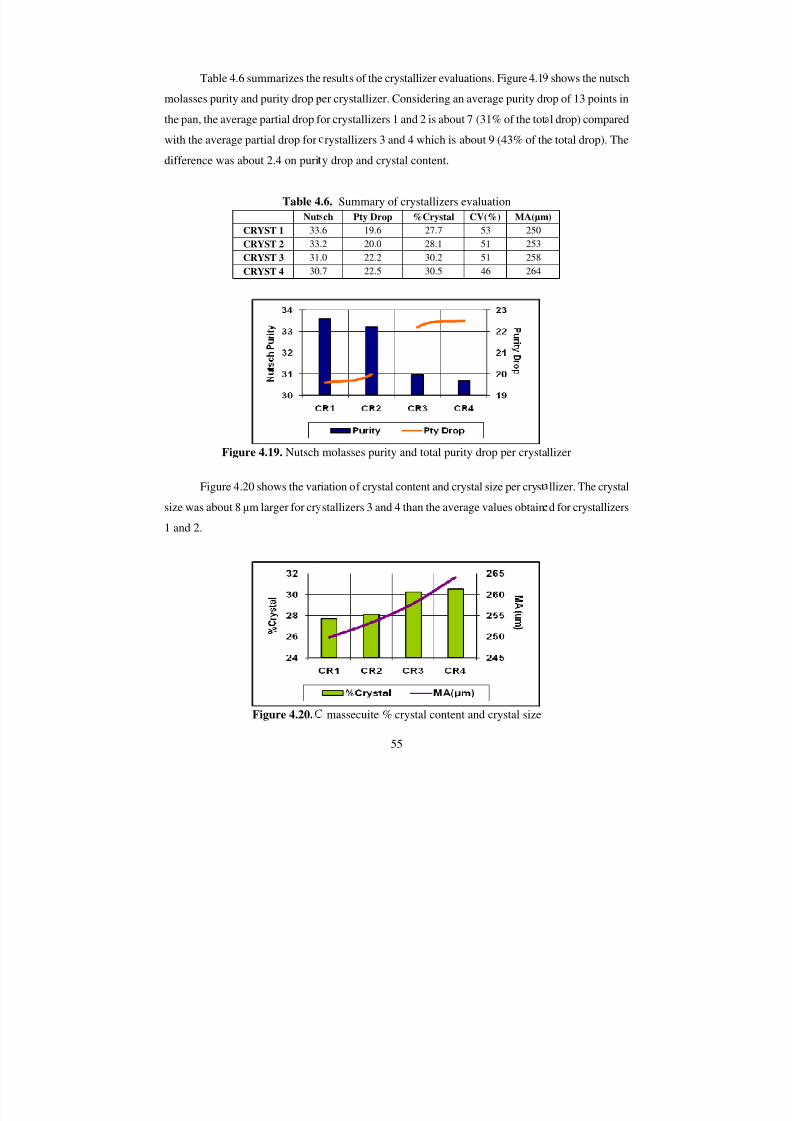
7/30/2019 Assessment of Target Purity Difference for a Louisiana Sugar Mill
http://slidepdf.com/reader/full/assessment-of-target-purity-difference-for-a-louisiana-sugar-mill 62/115
Table 4.6 summarizes the
molasses purity and purity drop p
the pan, the average partial drop f
with the average partial drop for
difference was about 2.4 on puri
Table 4
Nut
CRYST 1 33
CRYST 2 33
CRYST 3 31
CRYST 4 30
Figure 4.19. Nutsch
Figure 4.20 shows the var
size was about 8 µm larger for cr
1 and 2.
Figure 4.20.
55
results of the crystallizer evaluations. Figure 4.1
er crystallizer. Considering an average purity dr
or crystallizers 1 and 2 is about 7 (31% of the tot
rystallizers 3 and 4 which is about 9 (43% of th
y drop and crystal content.
.6. Summary of crystallizers evaluation
ch Pty Drop %Crystal CV(%) MA(µm
.6 19.6 27.7 53 250
.2 20.0 28.1 51 253
.0 22.2 30.2 51 258
.7 22.5 30.5 46 264
molasses purity and total purity drop per crysta
iation of crystal content and crystal size per cryst
stallizers 3 and 4 than the average values obtain
massecuite % crystal content and crystal size
shows the nutsch
op of 13 points in
l drop) compared
e total drop). The
)
llizer
llizer. The crystal
d for crystallizers
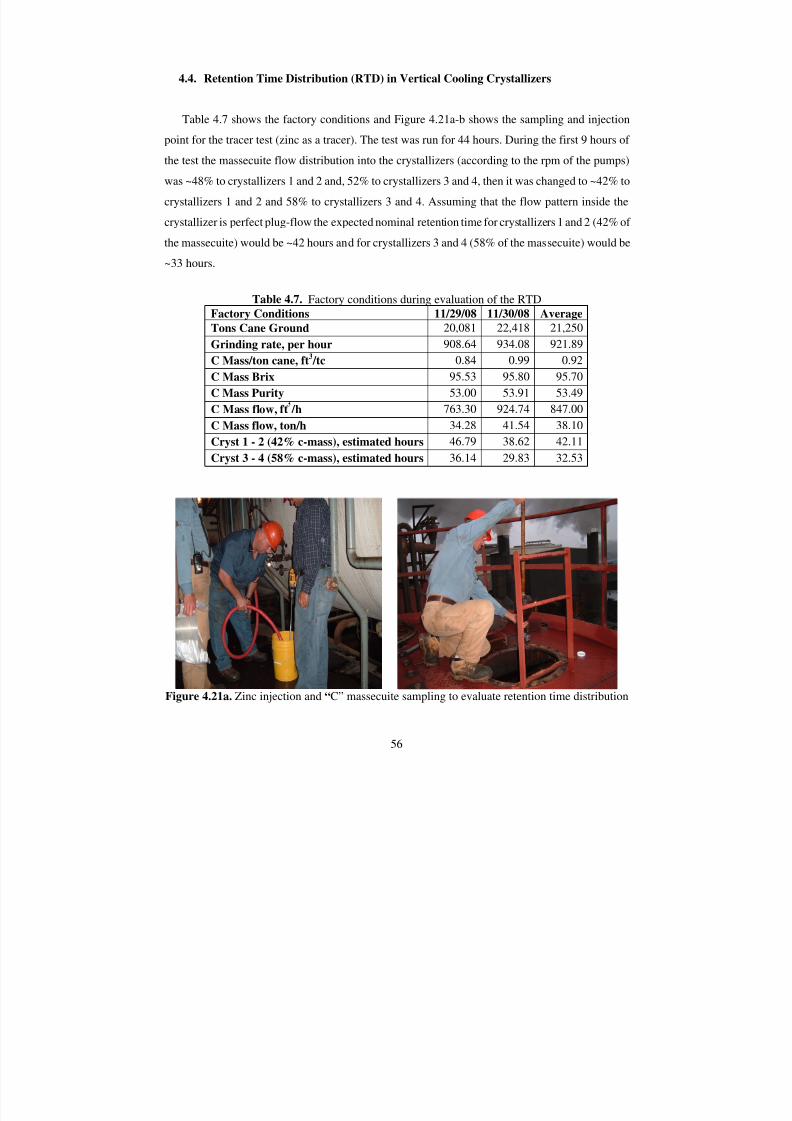
7/30/2019 Assessment of Target Purity Difference for a Louisiana Sugar Mill
http://slidepdf.com/reader/full/assessment-of-target-purity-difference-for-a-louisiana-sugar-mill 63/115
56
4.4. Retention Time Distribution (RTD) in Vertical Cooling Crystallizers
Table 4.7 shows the factory conditions and Figure 4.21a-b shows the sampling and injection
point for the tracer test (zinc as a tracer). The test was run for 44 hours. During the first 9 hours of
the test the massecuite flow distribution into the crystallizers (according to the rpm of the pumps)
was ~48% to crystallizers 1 and 2 and, 52% to crystallizers 3 and 4, then it was changed to ~42% to
crystallizers 1 and 2 and 58% to crystallizers 3 and 4. Assuming that the flow pattern inside the
crystallizer is perfect plug-flow the expected nominal retention time for crystallizers 1 and 2 (42% of
the massecuite) would be ~42 hours and for crystallizers 3 and 4 (58% of the massecuite) would be
~33 hours.
Table 4.7. Factory conditions during evaluation of the RTDFactory Conditions 11/29/08 11/30/08 Average
Tons Cane Ground 20,081 22,418 21,250
Grinding rate, per hour 908.64 934.08 921.89
C Mass/ton cane, ft3 /tc 0.84 0.99 0.92
C Mass Brix 95.53 95.80 95.70
C Mass Purity 53.00 53.91 53.49
C Mass flow, ft /h 763.30 924.74 847.00
C Mass flow, ton/h 34.28 41.54 38.10
Cryst 1 - 2 (42% c-mass), estimated hours 46.79 38.62 42.11
Cryst 3 - 4 (58% c-mass), estimated hours 36.14 29.83 32.53
Figure 4.21a. Zinc injection and “C” massecuite sampling to evaluate retention time distribution
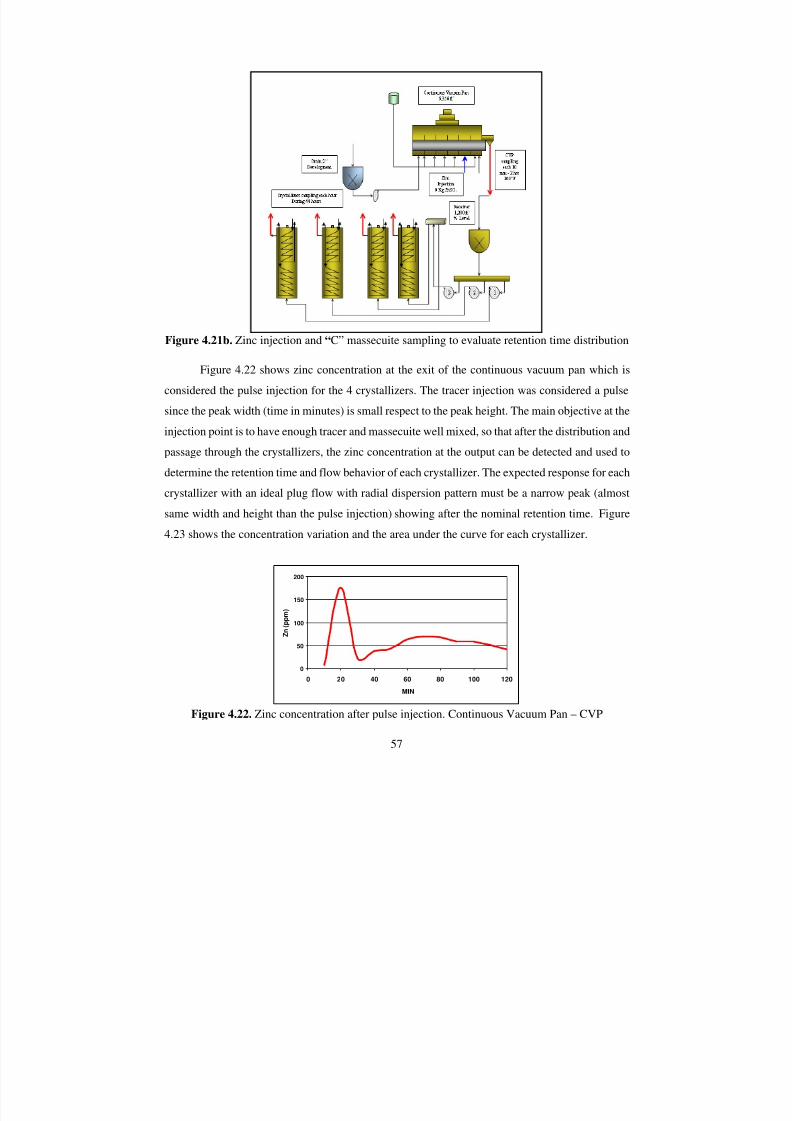
7/30/2019 Assessment of Target Purity Difference for a Louisiana Sugar Mill
http://slidepdf.com/reader/full/assessment-of-target-purity-difference-for-a-louisiana-sugar-mill 64/115
57
Figure 4.21b. Zinc injection and “C” massecuite sampling to evaluate retention time distribution
Figure 4.22 shows zinc concentration at the exit of the continuous vacuum pan which is
considered the pulse injection for the 4 crystallizers. The tracer injection was considered a pulse
since the peak width (time in minutes) is small respect to the peak height. The main objective at the
injection point is to have enough tracer and massecuite well mixed, so that after the distribution and
passage through the crystallizers, the zinc concentration at the output can be detected and used todetermine the retention time and flow behavior of each crystallizer. The expected response for each
crystallizer with an ideal plug flow with radial dispersion pattern must be a narrow peak (almost
same width and height than the pulse injection) showing after the nominal retention time. Figure
4.23 shows the concentration variation and the area under the curve for each crystallizer.
Figure 4.22. Zinc concentration after pulse injection. Continuous Vacuum Pan – CVP
0
50
100
150
200
0 20 40 60 80 100 120
MIN
Z n ( p p m )
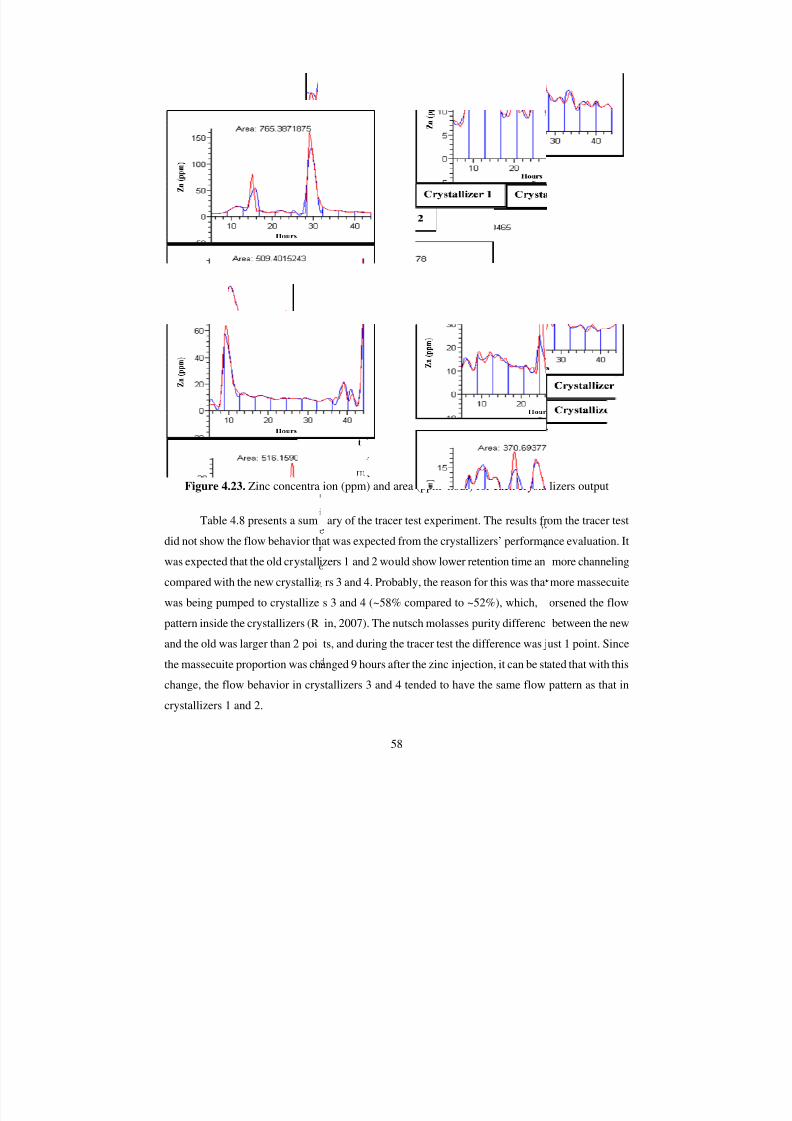
7/30/2019 Assessment of Target Purity Difference for a Louisiana Sugar Mill
http://slidepdf.com/reader/full/assessment-of-target-purity-difference-for-a-louisiana-sugar-mill 65/115
Figure 4.23. Zinc concentra
Table 4.8 presents a sum
did not show the flow behavior th
was expected that the old crystall
compared with the new crystalliz
was being pumped to crystallizepattern inside the crystallizers (R
and the old was larger than 2 poi
the massecuite proportion was ch
change, the flow behavior in cry
crystallizers 1 and 2.
58
ion (ppm) and area (ppm*hour) for each crysta
ary of the tracer test experiment. The results fr
at was expected from the crystallizers’ performa
izers 1 and 2 would show lower retention time an
rs 3 and 4. Probably, the reason for this was that
s 3 and 4 (~58% compared to ~52%), which,in, 2007). The nutsch molasses purity differenc
ts, and during the tracer test the difference was j
anged 9 hours after the zinc injection, it can be st
stallizers 3 and 4 tended to have the same flow
lizers output
om the tracer test
nce evaluation. It
more channeling
more massecuite
orsened the flowbetween the new
ust 1 point. Since
ated that with this
pattern as that in
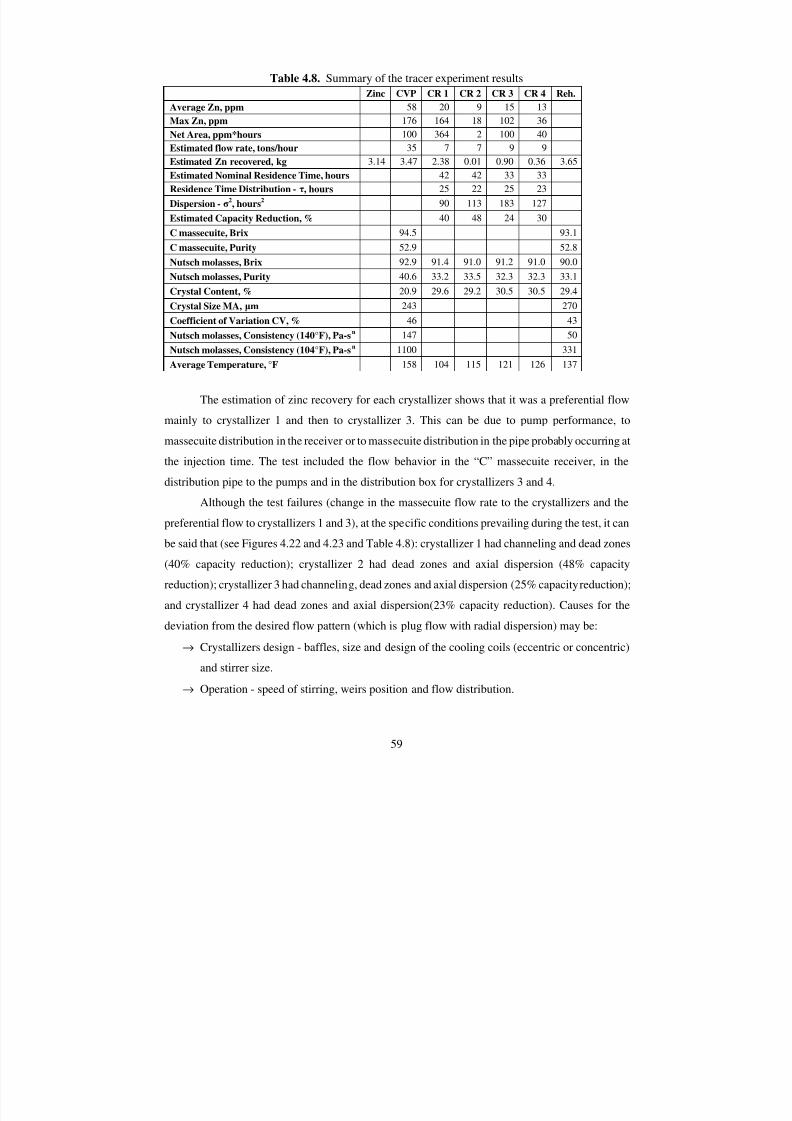
7/30/2019 Assessment of Target Purity Difference for a Louisiana Sugar Mill
http://slidepdf.com/reader/full/assessment-of-target-purity-difference-for-a-louisiana-sugar-mill 66/115
59
Table 4.8. Summary of the tracer experiment results
Zinc CVP CR 1 CR 2 CR 3 CR 4 Reh.
Average Zn, ppm 58 20 9 15 13
Max Zn, ppm 176 164 18 102 36
Net Area, ppm*hours 100 364 2 100 40
Estimated flow rate, tons/hour 35 7 7 9 9Estimated Zn recovered, kg 3.14 3.47 2.38 0.01 0.90 0.36 3.65
Estimated Nominal Residence Time, hours 42 42 33 33
Residence Time Distribution - τ, hours 25 22 25 23
Dispersion - σ2, hours
2 90 113 183 127
Estimated Capacity Reduction, % 40 48 24 30
C massecuite, Brix 94.5 93.1
C massecuite, Purity 52.9 52.8
Nutsch molasses, Brix 92.9 91.4 91.0 91.2 91.0 90.0
Nutsch molasses, Purity 40.6 33.2 33.5 32.3 32.3 33.1
Crystal Content, % 20.9 29.6 29.2 30.5 30.5 29.4
Crystal Size MA, µm 243 270
Coefficient of Variation CV, % 46 43
Nutsch molasses, Consistency (140°F), Pa-sn 147 50
Nutsch molasses, Consistency (104°F), Pa-sn 1100 331
Average Temperature, °F 158 104 115 121 126 137
The estimation of zinc recovery for each crystallizer shows that it was a preferential flow
mainly to crystallizer 1 and then to crystallizer 3. This can be due to pump performance, to
massecuite distribution in the receiver or to massecuite distribution in the pipe probably occurring at
the injection time. The test included the flow behavior in the “C” massecuite receiver, in the
distribution pipe to the pumps and in the distribution box for crystallizers 3 and 4.
Although the test failures (change in the massecuite flow rate to the crystallizers and the
preferential flow to crystallizers 1 and 3), at the specific conditions prevailing during the test, it can
be said that (see Figures 4.22 and 4.23 and Table 4.8): crystallizer 1 had channeling and dead zones
(40% capacity reduction); crystallizer 2 had dead zones and axial dispersion (48% capacity
reduction); crystallizer 3 had channeling, dead zones and axial dispersion (25% capacity reduction);
and crystallizer 4 had dead zones and axial dispersion(23% capacity reduction). Causes for the
deviation from the desired flow pattern (which is plug flow with radial dispersion) may be:
→ Crystallizers design - baffles, size and design of the cooling coils (eccentric or concentric)
and stirrer size.
→ Operation - speed of stirring, weirs position and flow distribution.
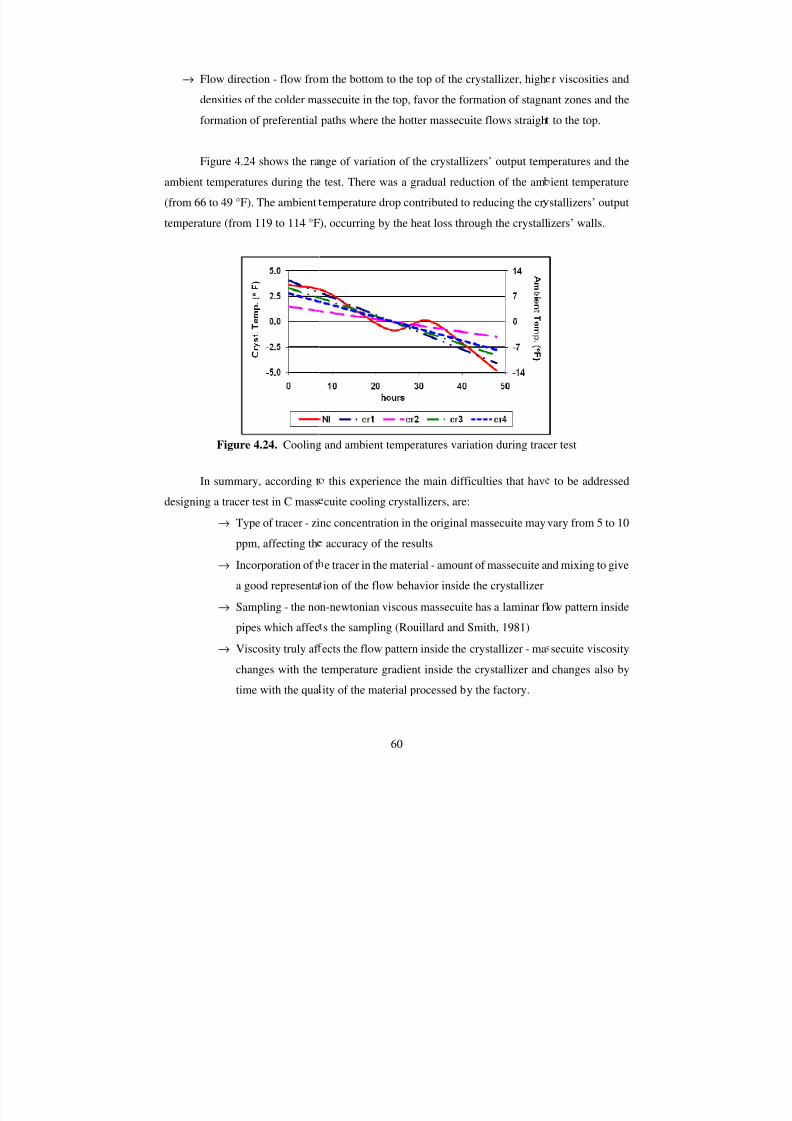
7/30/2019 Assessment of Target Purity Difference for a Louisiana Sugar Mill
http://slidepdf.com/reader/full/assessment-of-target-purity-difference-for-a-louisiana-sugar-mill 67/115
→ Flow direction - flow fro
densities of the colder m
formation of preferential
Figure 4.24 shows the ra
ambient temperatures during the
(from 66 to 49 °F). The ambient
temperature (from 119 to 114 °F
Figure 4.24. Cooling
In summary, according t
designing a tracer test in C mass
→ Type of tracer - zi
ppm, affecting th
→ Incorporation of t
a good representa
→ Sampling - the no
pipes which affec
→ Viscosity truly af
changes with the
time with the qua
60
m the bottom to the top of the crystallizer, high
ssecuite in the top, favor the formation of stagn
paths where the hotter massecuite flows straigh
nge of variation of the crystallizers’ output tem
test. There was a gradual reduction of the am
emperature drop contributed to reducing the cr
), occurring by the heat loss through the crystall
and ambient temperatures variation during trac
this experience the main difficulties that hav
cuite cooling crystallizers, are:
nc concentration in the original massecuite may
accuracy of the results
e tracer in the material - amount of massecuite a
ion of the flow behavior inside the crystallizer
n-newtonian viscous massecuite has a laminar fl
s the sampling (Rouillard and Smith, 1981)
ects the flow pattern inside the crystallizer - ma
temperature gradient inside the crystallizer and
ity of the material processed by the factory.
r viscosities and
ant zones and the
to the top.
peratures and the
ient temperature
stallizers’ output
izers’ walls.
er test
to be addressed
vary from 5 to 10
nd mixing to give
ow pattern inside
secuite viscosity
changes also by
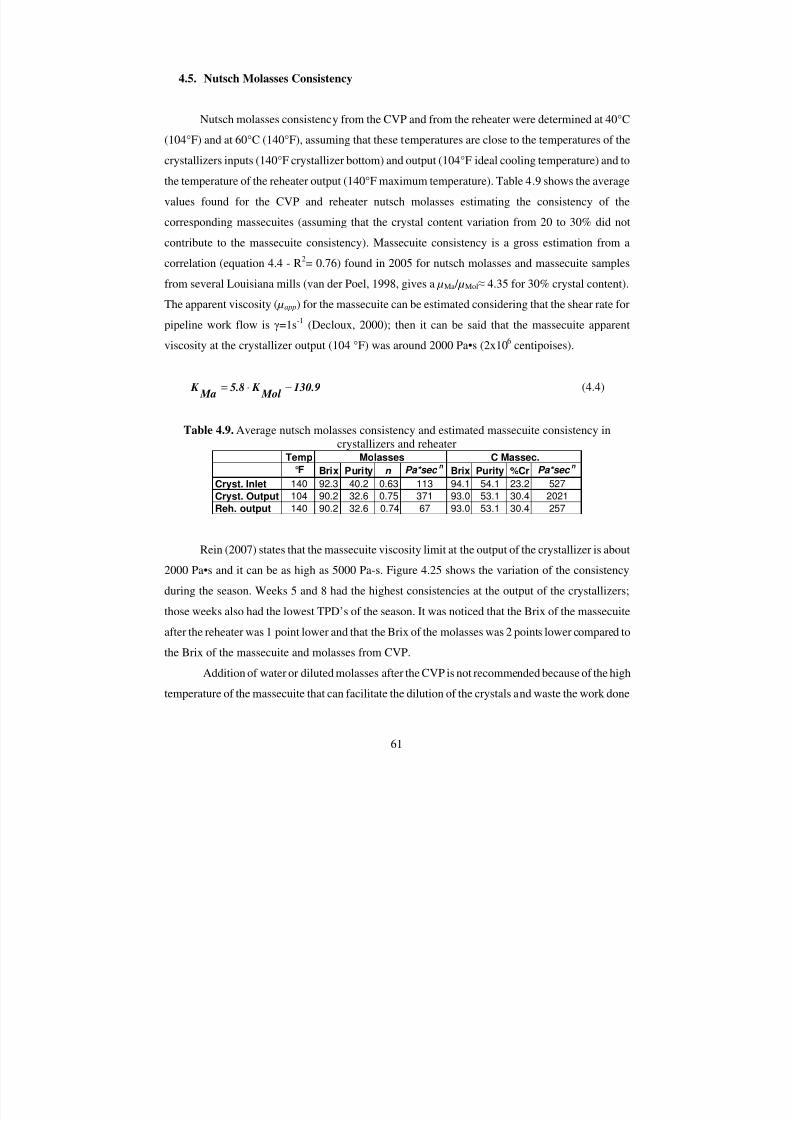
7/30/2019 Assessment of Target Purity Difference for a Louisiana Sugar Mill
http://slidepdf.com/reader/full/assessment-of-target-purity-difference-for-a-louisiana-sugar-mill 68/115
61
4.5. Nutsch Molasses Consistency
Nutsch molasses consistency from the CVP and from the reheater were determined at 40°C
(104°F) and at 60°C (140°F), assuming that these temperatures are close to the temperatures of the
crystallizers inputs (140°F crystallizer bottom) and output (104°F ideal cooling temperature) and to
the temperature of the reheater output (140°F maximum temperature). Table 4.9 shows the average
values found for the CVP and reheater nutsch molasses estimating the consistency of the
corresponding massecuites (assuming that the crystal content variation from 20 to 30% did not
contribute to the massecuite consistency). Massecuite consistency is a gross estimation from a
correlation (equation 4.4 - R2= 0.76) found in 2005 for nutsch molasses and massecuite samples
from several Louisiana mills (van der Poel, 1998, gives a µMa / µMol≈ 4.35 for 30% crystal content).
The apparent viscosity ( µapp) for the massecuite can be estimated considering that the shear rate for
pipeline work flow is γ=1s-1
(Decloux, 2000); then it can be said that the massecuite apparent
viscosity at the crystallizer output (104 °F) was around 2000 Pa•s (2x10⁶
centipoises).
130.9 Mol
K 5.8 Ma
K −⋅= (4.4)
Table 4.9. Average nutsch molasses consistency and estimated massecuite consistency incrystallizers and reheater
Rein (2007) states that the massecuite viscosity limit at the output of the crystallizer is about
2000 Pa•s and it can be as high as 5000 Pa-s. Figure 4.25 shows the variation of the consistency
during the season. Weeks 5 and 8 had the highest consistencies at the output of the crystallizers;
those weeks also had the lowest TPD’s of the season. It was noticed that the Brix of the massecuite
after the reheater was 1 point lower and that the Brix of the molasses was 2 points lower compared to
the Brix of the massecuite and molasses from CVP.
Addition of water or diluted molasses after the CVP is not recommended because of the high
temperature of the massecuite that can facilitate the dilution of the crystals and waste the work done
Temp°F Brix Purity n Pa*sec
n Brix Purity %Cr Pa*sec
n
Cryst. Inlet 140 92.3 40.2 0.63 113 94.1 54.1 23.2 527
Cryst. Output 104 90.2 32.6 0.75 371 93.0 53.1 30.4 2021
Reh. output 140 90.2 32.6 0.74 67 93.0 53.1 30.4 257
Molasses C Massec.
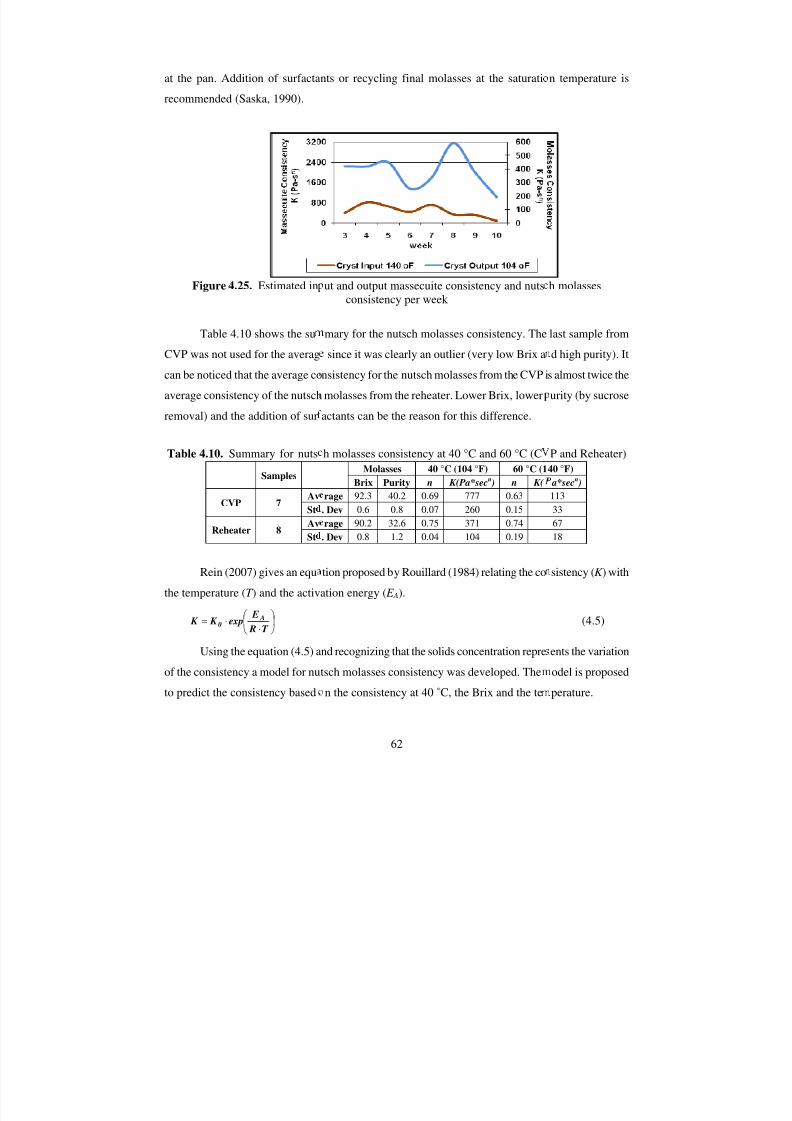
7/30/2019 Assessment of Target Purity Difference for a Louisiana Sugar Mill
http://slidepdf.com/reader/full/assessment-of-target-purity-difference-for-a-louisiana-sugar-mill 69/115
at the pan. Addition of surfacta
recommended (Saska, 1990).
Figure 4.25. Estimated in
Table 4.10 shows the su
CVP was not used for the averag
can be noticed that the average co
average consistency of the nutsch
removal) and the addition of sur
Table 4.10. Summary for nuts
Samples
CVP 7Av
St
Reheater 8Av
St
Rein (2007) gives an equ
the temperature (T ) and the activ
⋅⋅=
T R
Eexp K K A
0
Using the equation (4.5) a
of the consistency a model for nu
to predict the consistency based
62
nts or recycling final molasses at the saturati
ut and output massecuite consistency and nuts
consistency per week
mary for the nutsch molasses consistency. The
since it was clearly an outlier (very low Brix a
nsistency for the nutsch molasses from the CVP i
molasses from the reheater. Lower Brix, lower
actants can be the reason for this difference.
h molasses consistency at 40 °C and 60 °C (CMolasses 40 °C (104 °F) 60 °C (1
Brix Purity n K(Pa*sec n ) n K(
rage 92.3 40.2 0.69 777 0.63
. Dev 0.6 0.8 0.07 260 0.15
rage 90.2 32.6 0.75 371 0.74
. Dev 0.8 1.2 0.04 104 0.19
tion proposed by Rouillard (1984) relating the co
ation energy ( E A).
nd recognizing that the solids concentration repre
tsch molasses consistency was developed. The
n the consistency at 40 ˚C, the Brix and the te
n temperature is
h molasses
last sample from
d high purity). It
s almost twice the
urity (by sucrose
P and Reheater)40 °F)
a*sec n )
113
33
67
18
sistency (K ) with
(4.5)
ents the variation
odel is proposed
perature.
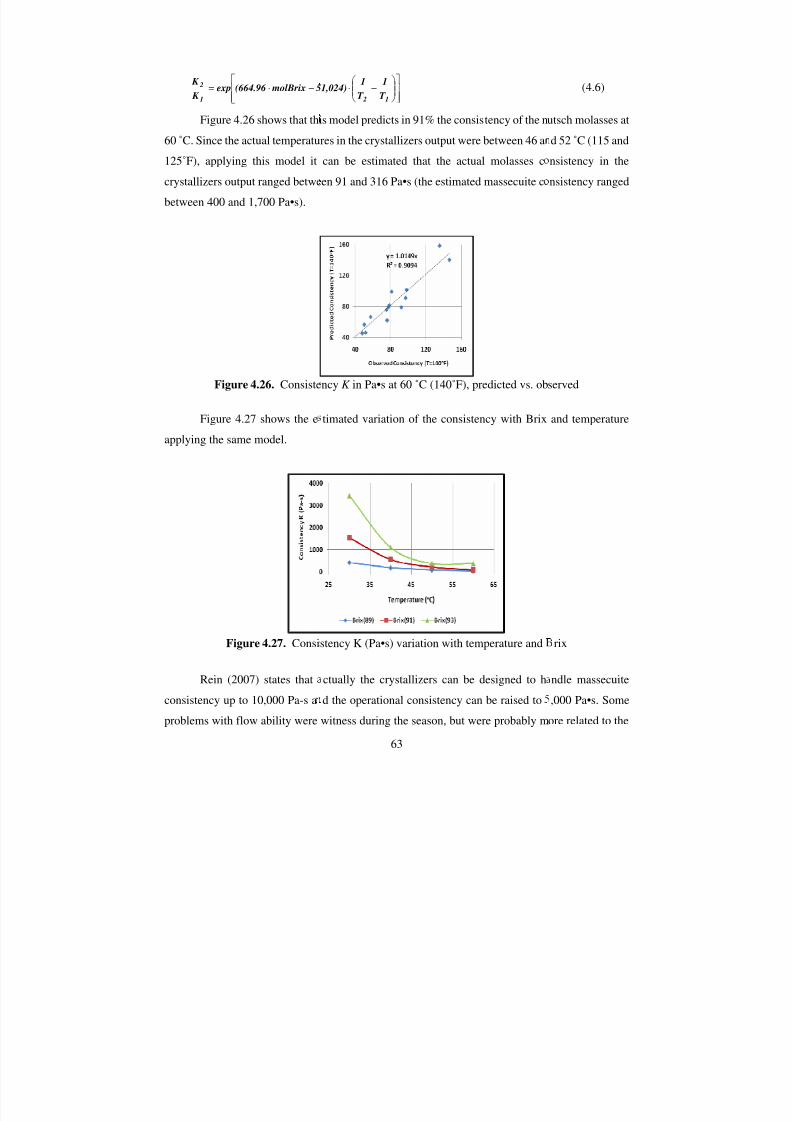
7/30/2019 Assessment of Target Purity Difference for a Louisiana Sugar Mill
http://slidepdf.com/reader/full/assessment-of-target-purity-difference-for-a-louisiana-sugar-mill 70/115
−⋅=
1
2 5 molBrix(664.96 exp K
K
Figure 4.26 shows that thi
60 ̊ C. Since the actual temperatu
125˚F), applying this model it
crystallizers output ranged betwe
between 400 and 1,700 Pa•s).
Figure 4.26. Consiste
Figure 4.27 shows the e
applying the same model.
Figure 4.27. Consi
Rein (2007) states that
consistency up to 10,000 Pa-s a
problems with flow ability were
63
−⋅
1 2 T
1
T
11,024)
s model predicts in 91% the consistency of the n
res in the crystallizers output were between 46 a
can be estimated that the actual molasses c
en 91 and 316 Pa•s (the estimated massecuite c
ncy K in Pa•s at 60 ˚C (140˚F), predicted vs. ob
timated variation of the consistency with Brix
stency K (Pa•s) variation with temperature and
ctually the crystallizers can be designed to h
d the operational consistency can be raised to
witness during the season, but were probably m
(4.6)
utsch molasses at
d 52 ̊ C (115 and
nsistency in the
nsistency ranged
served
and temperature
rix
ndle massecuite
,000 Pa•s. Some
ore related to the
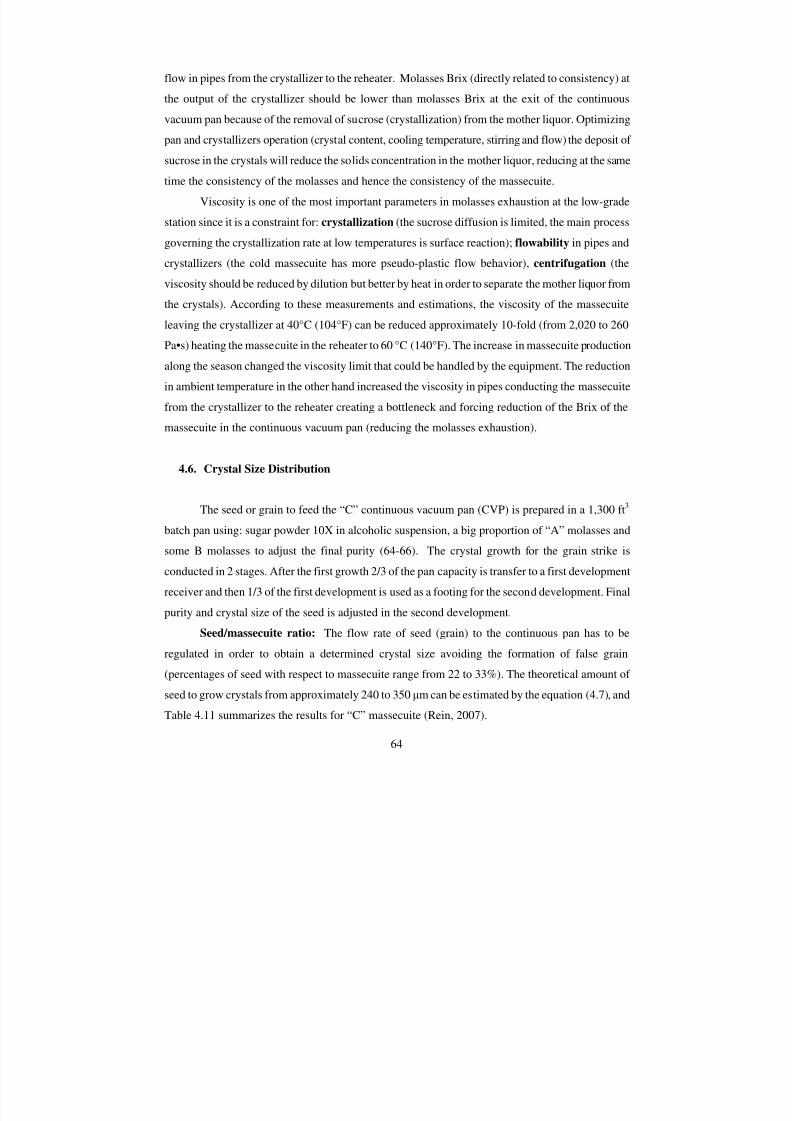
7/30/2019 Assessment of Target Purity Difference for a Louisiana Sugar Mill
http://slidepdf.com/reader/full/assessment-of-target-purity-difference-for-a-louisiana-sugar-mill 71/115
64
flow in pipes from the crystallizer to the reheater. Molasses Brix (directly related to consistency) at
the output of the crystallizer should be lower than molasses Brix at the exit of the continuous
vacuum pan because of the removal of sucrose (crystallization) from the mother liquor. Optimizing
pan and crystallizers operation (crystal content, cooling temperature, stirring and flow) the deposit of
sucrose in the crystals will reduce the solids concentration in the mother liquor, reducing at the same
time the consistency of the molasses and hence the consistency of the massecuite.
Viscosity is one of the most important parameters in molasses exhaustion at the low-grade
station since it is a constraint for: crystallization (the sucrose diffusion is limited, the main process
governing the crystallization rate at low temperatures is surface reaction); flowability in pipes and
crystallizers (the cold massecuite has more pseudo-plastic flow behavior), centrifugation (the
viscosity should be reduced by dilution but better by heat in order to separate the mother liquor from
the crystals). According to these measurements and estimations, the viscosity of the massecuite
leaving the crystallizer at 40°C (104°F) can be reduced approximately 10-fold (from 2,020 to 260
Pa•s) heating the massecuite in the reheater to 60 °C (140°F). The increase in massecuite production
along the season changed the viscosity limit that could be handled by the equipment. The reduction
in ambient temperature in the other hand increased the viscosity in pipes conducting the massecuite
from the crystallizer to the reheater creating a bottleneck and forcing reduction of the Brix of the
massecuite in the continuous vacuum pan (reducing the molasses exhaustion).
4.6. Crystal Size Distribution
The seed or grain to feed the “C” continuous vacuum pan (CVP) is prepared in a 1,300 ft 3
batch pan using: sugar powder 10X in alcoholic suspension, a big proportion of “A” molasses and
some B molasses to adjust the final purity (64-66). The crystal growth for the grain strike is
conducted in 2 stages. After the first growth 2/3 of the pan capacity is transfer to a first development
receiver and then 1/3 of the first development is used as a footing for the second development. Final
purity and crystal size of the seed is adjusted in the second development.
Seed/massecuite ratio: The flow rate of seed (grain) to the continuous pan has to be
regulated in order to obtain a determined crystal size avoiding the formation of false grain
(percentages of seed with respect to massecuite range from 22 to 33%). The theoretical amount of
seed to grow crystals from approximately 240 to 350 µm can be estimated by the equation (4.7), and
Table 4.11 summarizes the results for “C” massecuite (Rein, 2007).
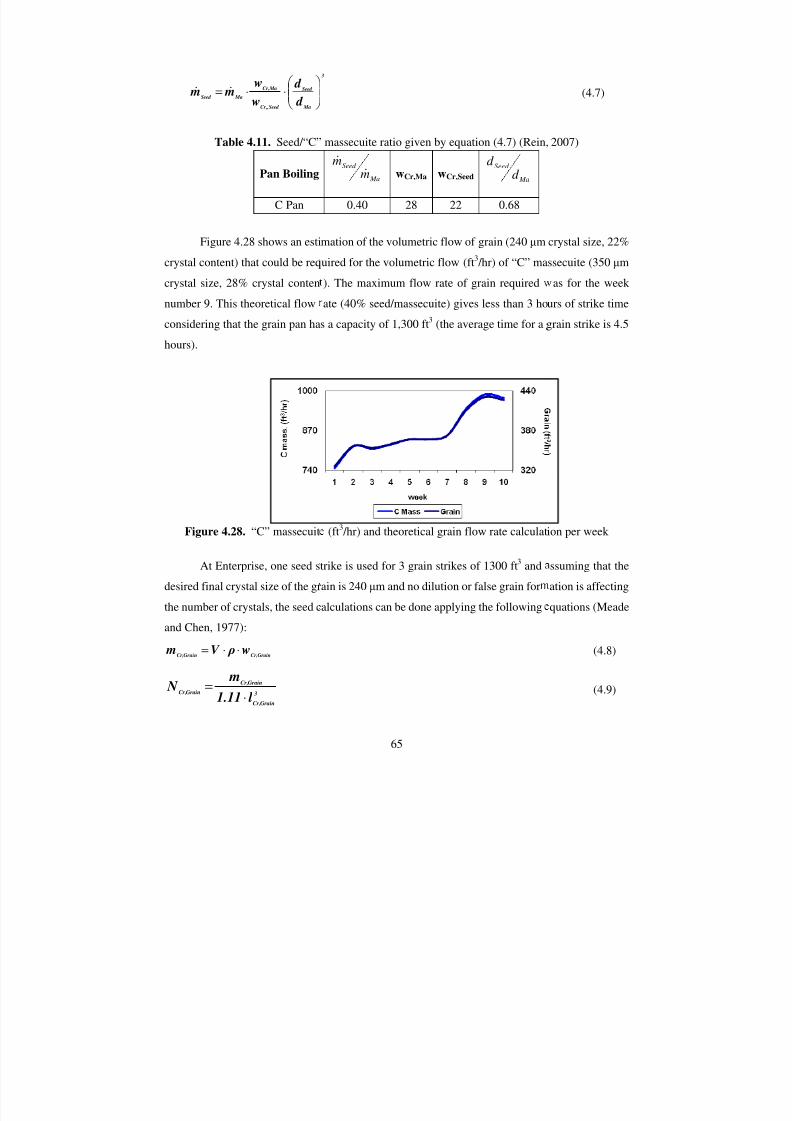
7/30/2019 Assessment of Target Purity Difference for a Louisiana Sugar Mill
http://slidepdf.com/reader/full/assessment-of-target-purity-difference-for-a-louisiana-sugar-mill 72/115
Ma
Seed
Seed ,Cr,
MaCr,
MaSeed
d
d
w
w m m
⋅⋅= &&
Table 4.11. Seed/“C”
Pan Boiling
C Pan
Figure 4.28 shows an esti
crystal content) that could be req
crystal size, 28% crystal conten
number 9. This theoretical flow
considering that the grain pan ha
hours).
Figure 4.28. “C” massecuit
At Enterprise, one seed s
desired final crystal size of the gr
the number of crystals, the seed c
and Chen, 1977):
GrainCr,GrainCr,w ρV m ⋅⋅=
3
GrainCr,
GrainCr,
GrainCr,
l 1.11
m N
⋅=
65
3
massecuite ratio given by equation (4.7) (Rein,
Ma
Seed
mm
&
&
wCr,Ma wCr,Seed Ma
Seed
d d
0.40 28 22 0.68
mation of the volumetric flow of grain (240 µm
uired for the volumetric flow (ft3 /hr) of “C” ma
). The maximum flow rate of grain required
ate (40% seed/massecuite) gives less than 3 ho
s a capacity of 1,300 ft3
(the average time for a
(ft3 /hr) and theoretical grain flow rate calculat
trike is used for 3 grain strikes of 1300 ft3
and
ain is 240 µm and no dilution or false grain for
alculations can be done applying the following
(4.7)
2007)
crystal size, 22%
ssecuite (350 µm
as for the week
urs of strike time
grain strike is 4.5
ion per week
ssuming that the
ation is affecting
quations (Meade
(4.8)
(4.9)
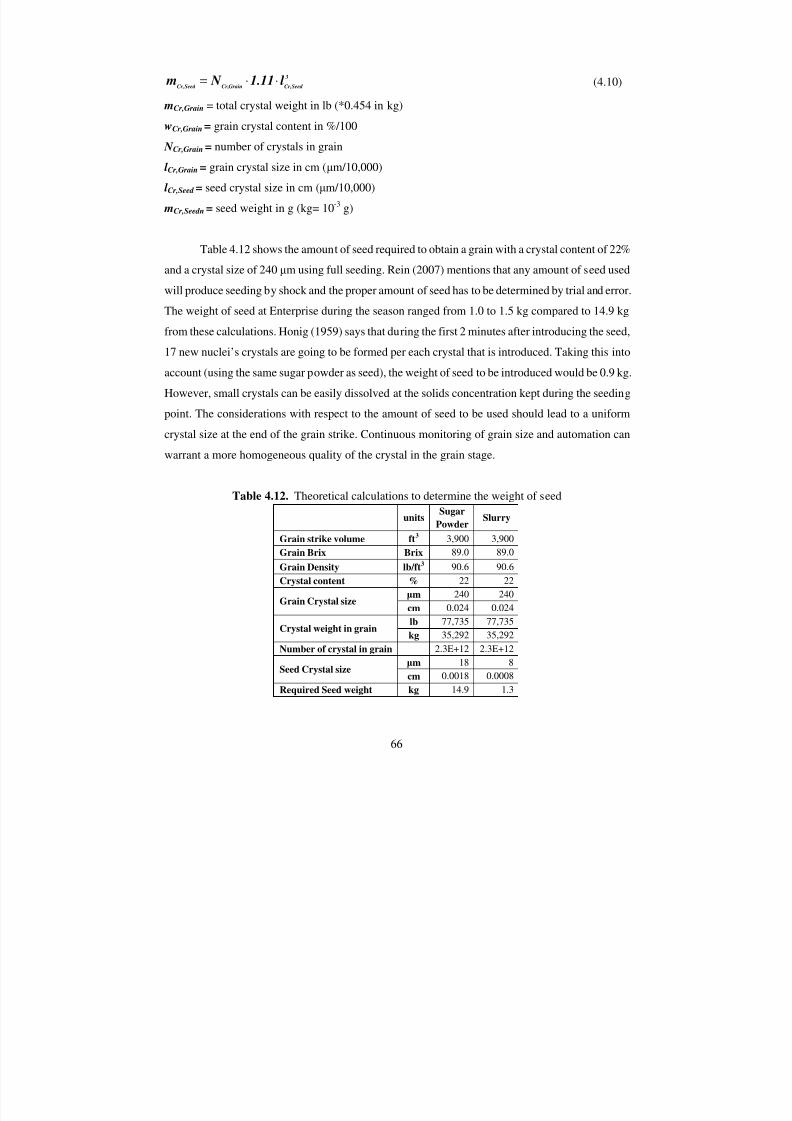
7/30/2019 Assessment of Target Purity Difference for a Louisiana Sugar Mill
http://slidepdf.com/reader/full/assessment-of-target-purity-difference-for-a-louisiana-sugar-mill 73/115
66
3
Seed Cr,GrainCr,Seed Cr,l 1.11 N m ⋅⋅= (4.10)
mCr,Grain = total crystal weight in lb (*0.454 in kg)
wCr,Grain = grain crystal content in %/100
N Cr,Grain = number of crystals in grainl Cr,Grain = grain crystal size in cm (µm/10,000)
l Cr,Seed = seed crystal size in cm (µm/10,000)
mCr,Seedn = seed weight in g (kg= 10-3 g)
Table 4.12 shows the amount of seed required to obtain a grain with a crystal content of 22%
and a crystal size of 240 µm using full seeding. Rein (2007) mentions that any amount of seed used
will produce seeding by shock and the proper amount of seed has to be determined by trial and error.
The weight of seed at Enterprise during the season ranged from 1.0 to 1.5 kg compared to 14.9 kg
from these calculations. Honig (1959) says that during the first 2 minutes after introducing the seed,
17 new nuclei’s crystals are going to be formed per each crystal that is introduced. Taking this into
account (using the same sugar powder as seed), the weight of seed to be introduced would be 0.9 kg.
However, small crystals can be easily dissolved at the solids concentration kept during the seeding
point. The considerations with respect to the amount of seed to be used should lead to a uniform
crystal size at the end of the grain strike. Continuous monitoring of grain size and automation can
warrant a more homogeneous quality of the crystal in the grain stage.
Table 4.12. Theoretical calculations to determine the weight of seed
unitsSugar
PowderSlurry
Grain strike volume ft3 3,900 3,900
Grain Brix Brix 89.0 89.0
Grain Density lb/ft3 90.6 90.6
Crystal content % 22 22
Grain Crystal sizeµm 240 240
cm 0.024 0.024
Crystal weight in grainlb 77,735 77,735
kg 35,292 35,292
Number of crystal in grain 2.3E+12 2.3E+12
Seed Crystal sizeµm 18 8
cm 0.0018 0.0008
Required Seed weight kg 14.9 1.3
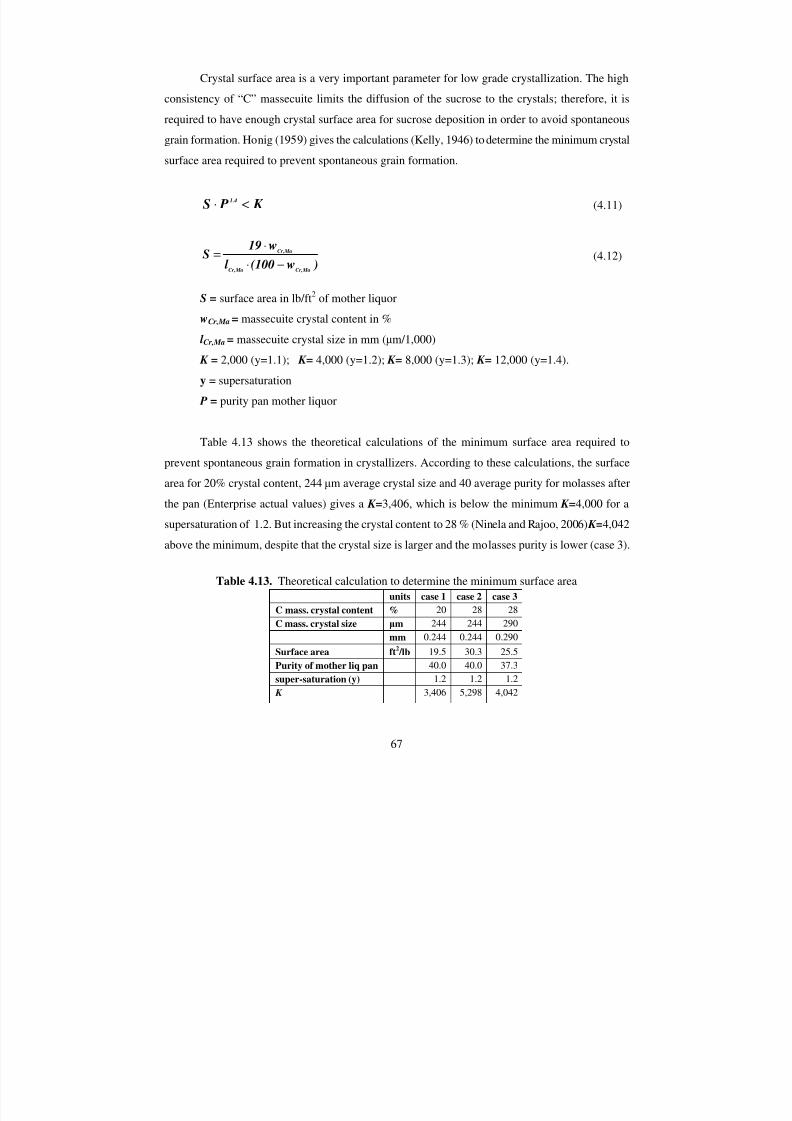
7/30/2019 Assessment of Target Purity Difference for a Louisiana Sugar Mill
http://slidepdf.com/reader/full/assessment-of-target-purity-difference-for-a-louisiana-sugar-mill 74/115
67
Crystal surface area is a very important parameter for low grade crystallization. The high
consistency of “C” massecuite limits the diffusion of the sucrose to the crystals; therefore, it is
required to have enough crystal surface area for sucrose deposition in order to avoid spontaneous
grain formation. Honig (1959) gives the calculations (Kelly, 1946) to determine the minimum crystal
surface area required to prevent spontaneous grain formation.
K PS1.4 <⋅ (4.11)
)w(100l
w19S
MaCr, MaCr,
MaCr,
−⋅
⋅= (4.12)
S = surface area in lb/ft
2
of mother liquorwCr,Ma = massecuite crystal content in %
l Cr,Ma = massecuite crystal size in mm (µm/1,000)
K = 2,000 (y=1.1); K= 4,000 (y=1.2); K= 8,000 (y=1.3); K= 12,000 (y=1.4).
y = supersaturation
P = purity pan mother liquor
Table 4.13 shows the theoretical calculations of the minimum surface area required to
prevent spontaneous grain formation in crystallizers. According to these calculations, the surface
area for 20% crystal content, 244 µm average crystal size and 40 average purity for molasses after
the pan (Enterprise actual values) gives a K=3,406, which is below the minimum K=4,000 for a
supersaturation of 1.2. But increasing the crystal content to 28 % (Ninela and Rajoo, 2006) K=4,042
above the minimum, despite that the crystal size is larger and the molasses purity is lower (case 3).
Table 4.13. Theoretical calculation to determine the minimum surface area
units case 1 case 2 case 3
C mass. crystal content % 20 28 28
C mass. crystal size µm 244 244 290
mm 0.244 0.244 0.290
Surface area ft2 /lb 19.5 30.3 25.5
Purity of mother liq pan 40.0 40.0 37.3
super-saturation (y) 1.2 1.2 1.2
K 3,406 5,298 4,042
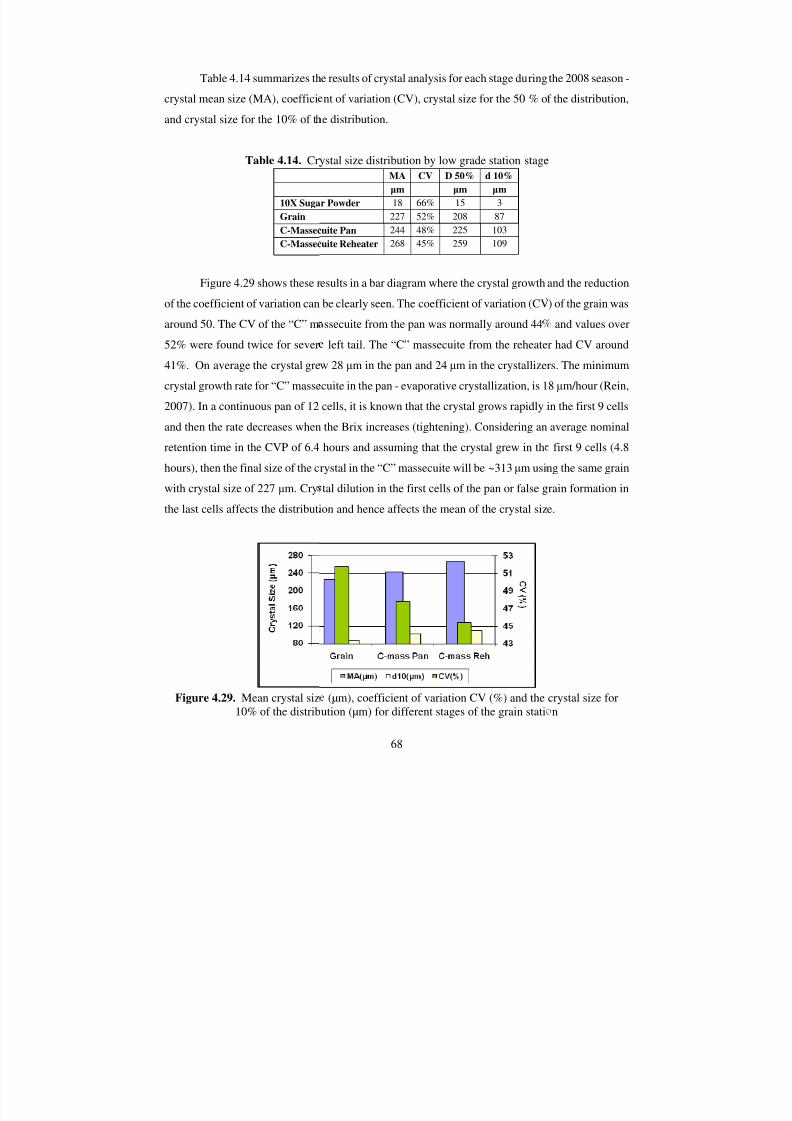
7/30/2019 Assessment of Target Purity Difference for a Louisiana Sugar Mill
http://slidepdf.com/reader/full/assessment-of-target-purity-difference-for-a-louisiana-sugar-mill 75/115
Table 4.14 summarizes th
crystal mean size (MA), coeffici
and crystal size for the 10% of t
Table 4.14. Cr
10X Suga
Grain
C-Massec
C-Massec
Figure 4.29 shows these r
of the coefficient of variation can
around 50. The CV of the “C” m
52% were found twice for sever
41%. On average the crystal gre
crystal growth rate for “C” masse
2007). In a continuous pan of 12
and then the rate decreases when
retention time in the CVP of 6.4
hours), then the final size of the c
with crystal size of 227 µm. Cry
the last cells affects the distributi
Figure 4.29. Mean crystal siz10% of the distrib
68
e results of crystal analysis for each stage during
nt of variation (CV), crystal size for the 50 % o
e distribution.
ystal size distribution by low grade station stage
MA CV D 50% d 10%
µm µm µm
r Powder 18 66% 15 3
227 52% 208 87
uite Pan 244 48% 225 103
uite Reheater 268 45% 259 109
esults in a bar diagram where the crystal growth
be clearly seen. The coefficient of variation (CV
ssecuite from the pan was normally around 44
left tail. The “C” massecuite from the reheate
w 28 µm in the pan and 24 µm in the crystallize
cuite in the pan - evaporative crystallization, is 1
cells, it is known that the crystal grows rapidly
the Brix increases (tightening). Considering an
hours and assuming that the crystal grew in th
rystal in the “C” massecuite will be ~313 µm usi
tal dilution in the first cells of the pan or false g
on and hence affects the mean of the crystal siz
(µm), coefficient of variation CV (%) and the
ution (µm) for different stages of the grain stati
the 2008 season -
f the distribution,
and the reduction
) of the grain was
and values over
r had CV around
rs. The minimum
8 µm/hour (Rein,
in the first 9 cells
average nominal
first 9 cells (4.8
ng the same grain
rain formation in
e.
crystal size forn
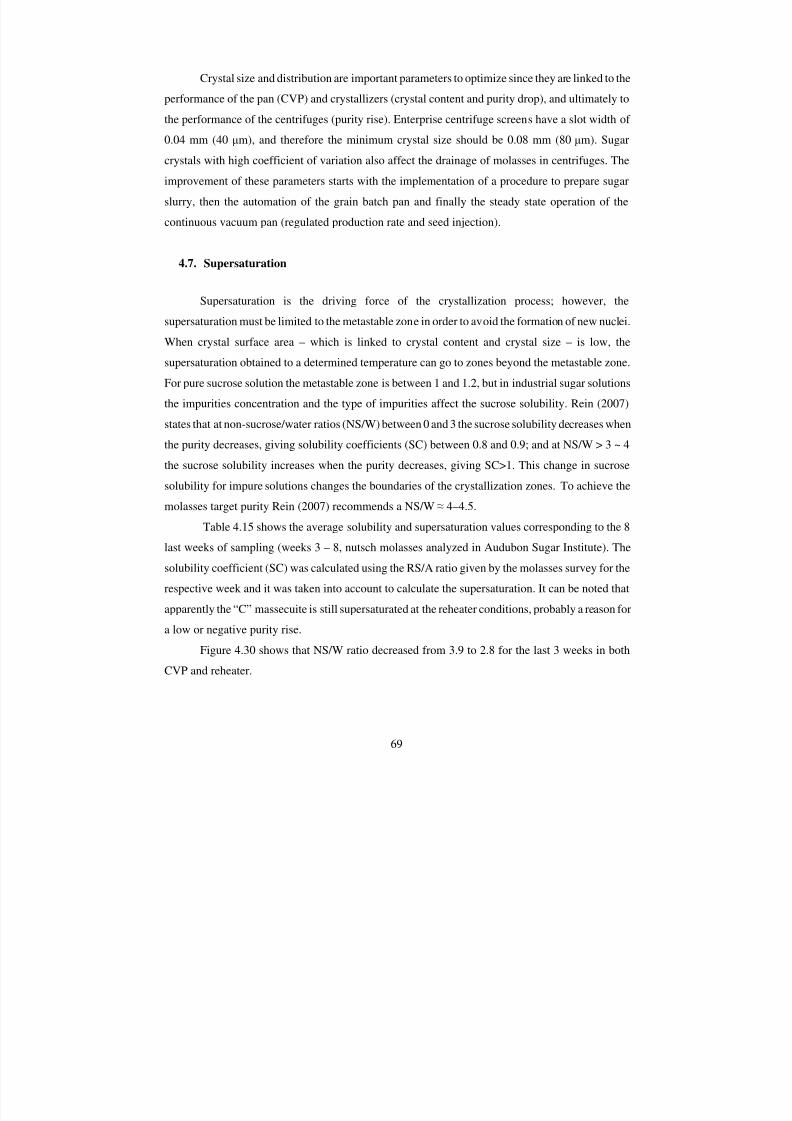
7/30/2019 Assessment of Target Purity Difference for a Louisiana Sugar Mill
http://slidepdf.com/reader/full/assessment-of-target-purity-difference-for-a-louisiana-sugar-mill 76/115
69
Crystal size and distribution are important parameters to optimize since they are linked to the
performance of the pan (CVP) and crystallizers (crystal content and purity drop), and ultimately to
the performance of the centrifuges (purity rise). Enterprise centrifuge screens have a slot width of
0.04 mm (40 µm), and therefore the minimum crystal size should be 0.08 mm (80 µm). Sugar
crystals with high coefficient of variation also affect the drainage of molasses in centrifuges. The
improvement of these parameters starts with the implementation of a procedure to prepare sugar
slurry, then the automation of the grain batch pan and finally the steady state operation of the
continuous vacuum pan (regulated production rate and seed injection).
4.7. Supersaturation
Supersaturation is the driving force of the crystallization process; however, thesupersaturation must be limited to the metastable zone in order to avoid the formation of new nuclei.
When crystal surface area – which is linked to crystal content and crystal size – is low, the
supersaturation obtained to a determined temperature can go to zones beyond the metastable zone.
For pure sucrose solution the metastable zone is between 1 and 1.2, but in industrial sugar solutions
the impurities concentration and the type of impurities affect the sucrose solubility. Rein (2007)
states that at non-sucrose/water ratios (NS/W) between 0 and 3 the sucrose solubility decreases when
the purity decreases, giving solubility coefficients (SC) between 0.8 and 0.9; and at NS/W > 3 ~ 4
the sucrose solubility increases when the purity decreases, giving SC>1. This change in sucrose
solubility for impure solutions changes the boundaries of the crystallization zones. To achieve the
molasses target purity Rein (2007) recommends a NS/W ≈ 4–4.5.
Table 4.15 shows the average solubility and supersaturation values corresponding to the 8
last weeks of sampling (weeks 3 – 8, nutsch molasses analyzed in Audubon Sugar Institute). The
solubility coefficient (SC) was calculated using the RS/A ratio given by the molasses survey for the
respective week and it was taken into account to calculate the supersaturation. It can be noted that
apparently the “C” massecuite is still supersaturated at the reheater conditions, probably a reason for
a low or negative purity rise.
Figure 4.30 shows that NS/W ratio decreased from 3.9 to 2.8 for the last 3 weeks in both
CVP and reheater.
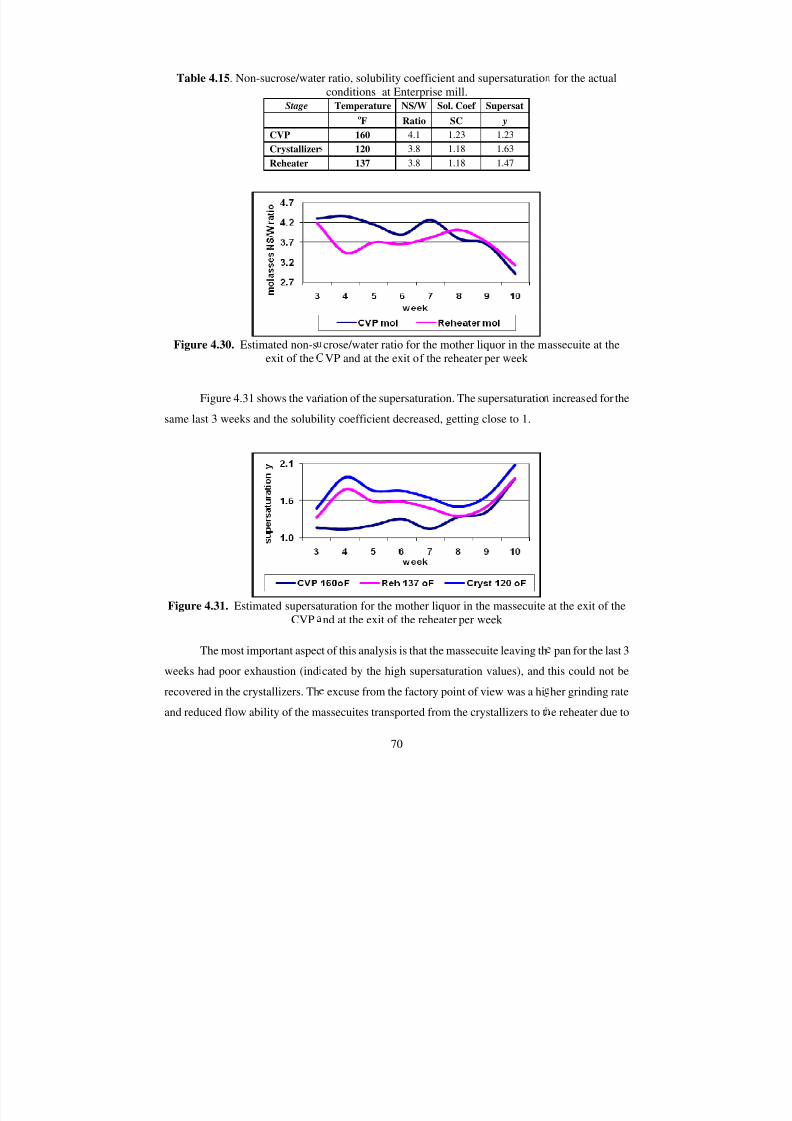
7/30/2019 Assessment of Target Purity Difference for a Louisiana Sugar Mill
http://slidepdf.com/reader/full/assessment-of-target-purity-difference-for-a-louisiana-sugar-mill 77/115
Table 4.15. Non-sucrose/wate
Stage
CVP
CrystallizerReheater
Figure 4.30. Estimated non-sexit of the
Figure 4.31 shows the var
same last 3 weeks and the solubi
Figure 4.31. Estimated supersaCVP
The most important aspec
weeks had poor exhaustion (ind
recovered in the crystallizers. Th
and reduced flow ability of the m
70
r ratio, solubility coefficient and supersaturatioconditions at Enterprise mill.
Temperature NS/W Sol. Coef SupersatoF Ratio SC y
160 4.1 1.23 1.23
120 3.8 1.18 1.63137 3.8 1.18 1.47
crose/water ratio for the mother liquor in the mVP and at the exit of the reheater per week
iation of the supersaturation. The supersaturatio
lity coefficient decreased, getting close to 1.
turation for the mother liquor in the massecuitend at the exit of the reheater per week
t of this analysis is that the massecuite leaving th
cated by the high supersaturation values), and
excuse from the factory point of view was a hi
assecuites transported from the crystallizers to t
for the actual
assecuite at the
increased for the
at the exit of the
pan for the last 3
this could not be
her grinding rate
e reheater due to
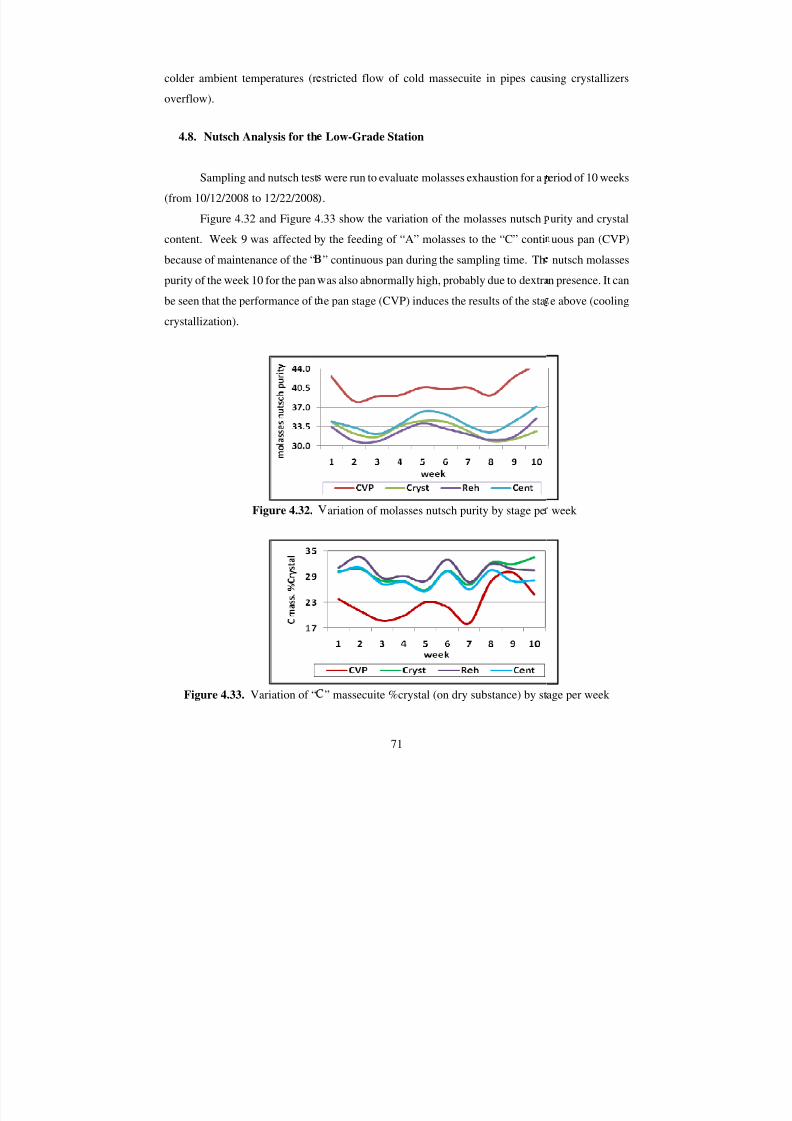
7/30/2019 Assessment of Target Purity Difference for a Louisiana Sugar Mill
http://slidepdf.com/reader/full/assessment-of-target-purity-difference-for-a-louisiana-sugar-mill 78/115
colder ambient temperatures (r
overflow).
4.8. Nutsch Analysis for th
Sampling and nutsch test
(from 10/12/2008 to 12/22/2008
Figure 4.32 and Figure 4
content. Week 9 was affected b
because of maintenance of the “
purity of the week 10 for the pan
be seen that the performance of tcrystallization).
Figure 4.32.
Figure 4.33. Variation of “
71
stricted flow of cold massecuite in pipes cau
Low-Grade Station
were run to evaluate molasses exhaustion for a p
.
.33 show the variation of the molasses nutsch
y the feeding of “A” molasses to the “C” conti
” continuous pan during the sampling time. Th
as also abnormally high, probably due to dextra
e pan stage (CVP) induces the results of the sta
ariation of molasses nutsch purity by stage pe
” massecuite %crystal (on dry substance) by st
sing crystallizers
eriod of 10 weeks
urity and crystal
uous pan (CVP)
nutsch molasses
n presence. It can
e above (cooling
week
age per week
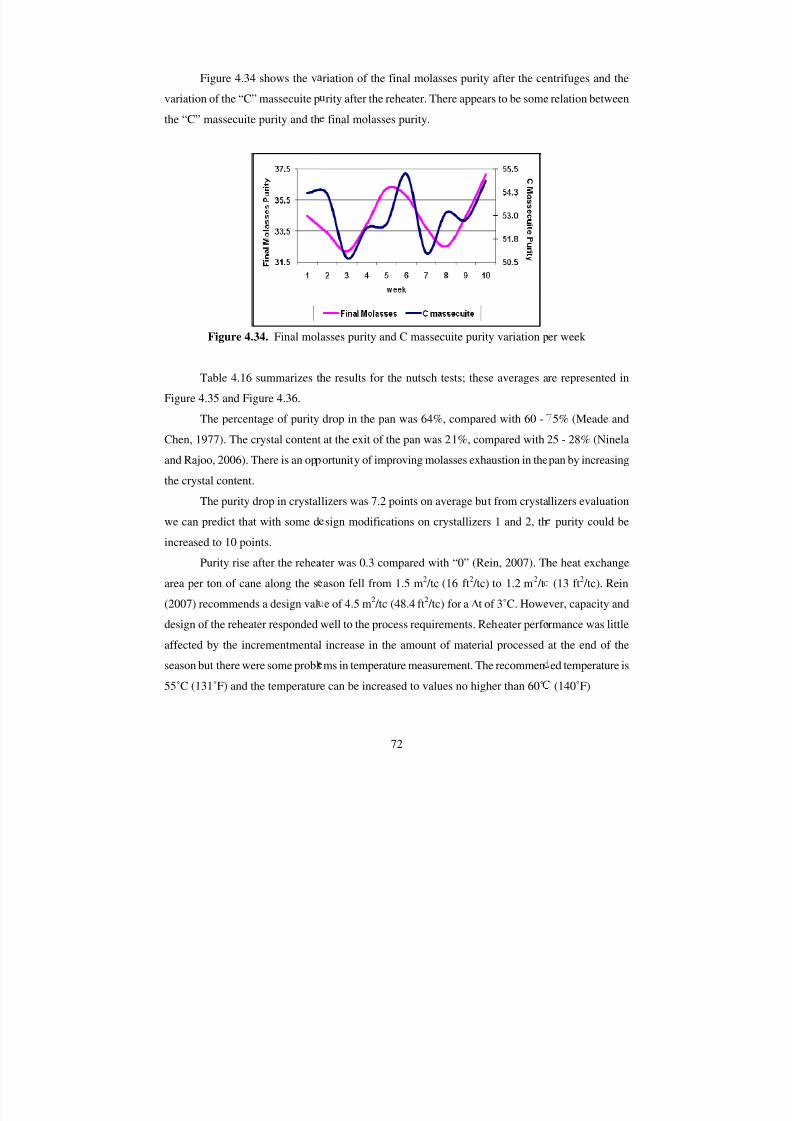
7/30/2019 Assessment of Target Purity Difference for a Louisiana Sugar Mill
http://slidepdf.com/reader/full/assessment-of-target-purity-difference-for-a-louisiana-sugar-mill 79/115
Figure 4.34 shows the v
variation of the “C” massecuite p
the “C” massecuite purity and th
Figure 4.34. Final mol
Table 4.16 summarizes t
Figure 4.35 and Figure 4.36.
The percentage of purity
Chen, 1977). The crystal content
and Rajoo, 2006). There is an op
the crystal content.
The purity drop in crystal
we can predict that with some d
increased to 10 points.
Purity rise after the rehea
area per ton of cane along the s
(2007) recommends a design valdesign of the reheater responded
affected by the incrementmental
season but there were some probl
55˚C (131˚F) and the temperatur
72
riation of the final molasses purity after the ce
rity after the reheater. There appears to be some
final molasses purity.
asses purity and C massecuite purity variation p
he results for the nutsch tests; these averages a
drop in the pan was 64%, compared with 60 -
at the exit of the pan was 21%, compared with
ortunity of improving molasses exhaustion in the
lizers was 7.2 points on average but from crysta
sign modifications on crystallizers 1 and 2, th
ter was 0.3 compared with “0” (Rein, 2007). T
ason fell from 1.5 m2 /tc (16 ft
2 /tc) to 1.2 m
2 /t
e of 4.5 m2
/tc (48.4 ft2
/tc) for a t of 3˚C. Howewell to the process requirements. Reheater perfo
increase in the amount of material processed
ms in temperature measurement. The recommen
e can be increased to values no higher than 60˚
ntrifuges and the
relation between
er week
re represented in
5% (Meade and
25 - 28% (Ninela
pan by increasing
llizers evaluation
purity could be
he heat exchange
(13 ft2 /tc). Rein
ver, capacity andrmance was little
at the end of the
ed temperature is
(140˚F)
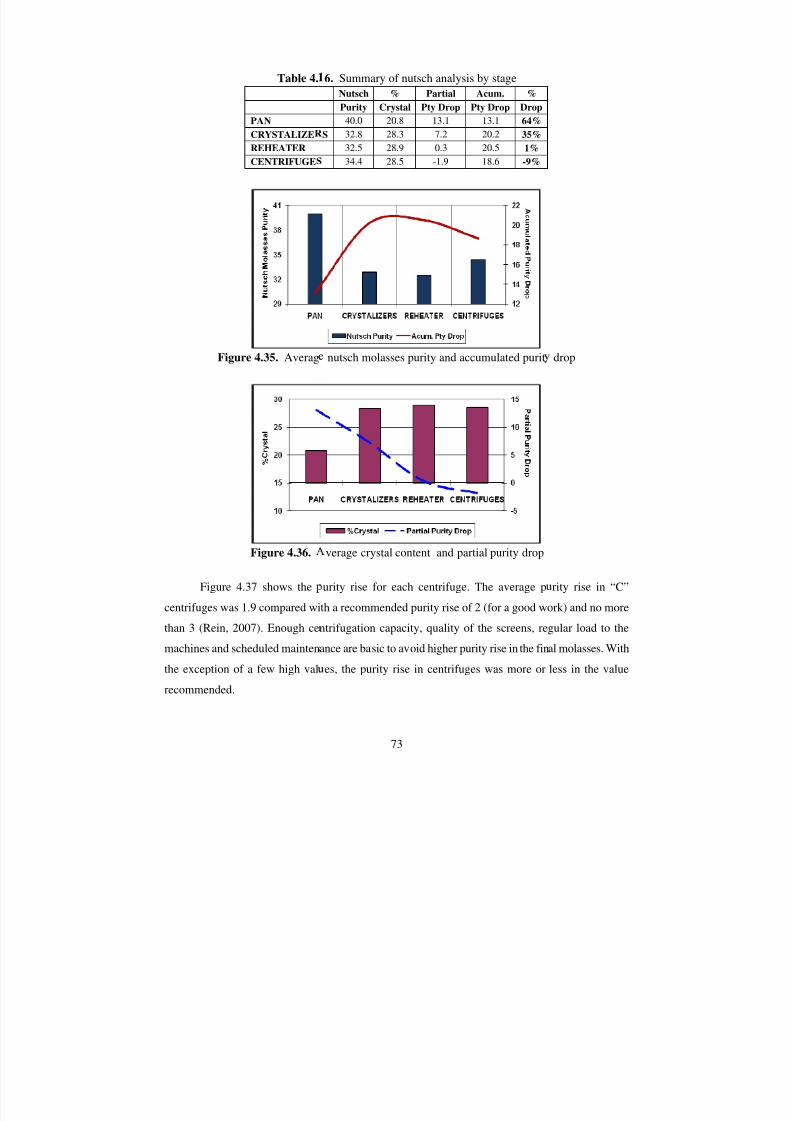
7/30/2019 Assessment of Target Purity Difference for a Louisiana Sugar Mill
http://slidepdf.com/reader/full/assessment-of-target-purity-difference-for-a-louisiana-sugar-mill 80/115
Table 4.
PAN
CRYSTALIZE
REHEATERCENTRIFUGE
Figure 4.35. Averag
Figure 4.36.
Figure 4.37 shows the
centrifuges was 1.9 compared wi
than 3 (Rein, 2007). Enough ce
machines and scheduled mainten
the exception of a few high val
recommended.
73
6. Summary of nutsch analysis by stage
Nutsch % Partial Acum. %
Purity Crystal Pty Drop Pty Drop Drop
40.0 20.8 13.1 13.1 64%
S 32.8 28.3 7.2 20.2 35%
32.5 28.9 0.3 20.5 1%34.4 28.5 -1.9 18.6 -9%
nutsch molasses purity and accumulated purit
verage crystal content and partial purity drop
urity rise for each centrifuge. The average p
th a recommended purity rise of 2 (for a good w
ntrifugation capacity, quality of the screens, re
ance are basic to avoid higher purity rise in the fin
es, the purity rise in centrifuges was more or
drop
rity rise in “C”
ork) and no more
gular load to the
al molasses. With
less in the value
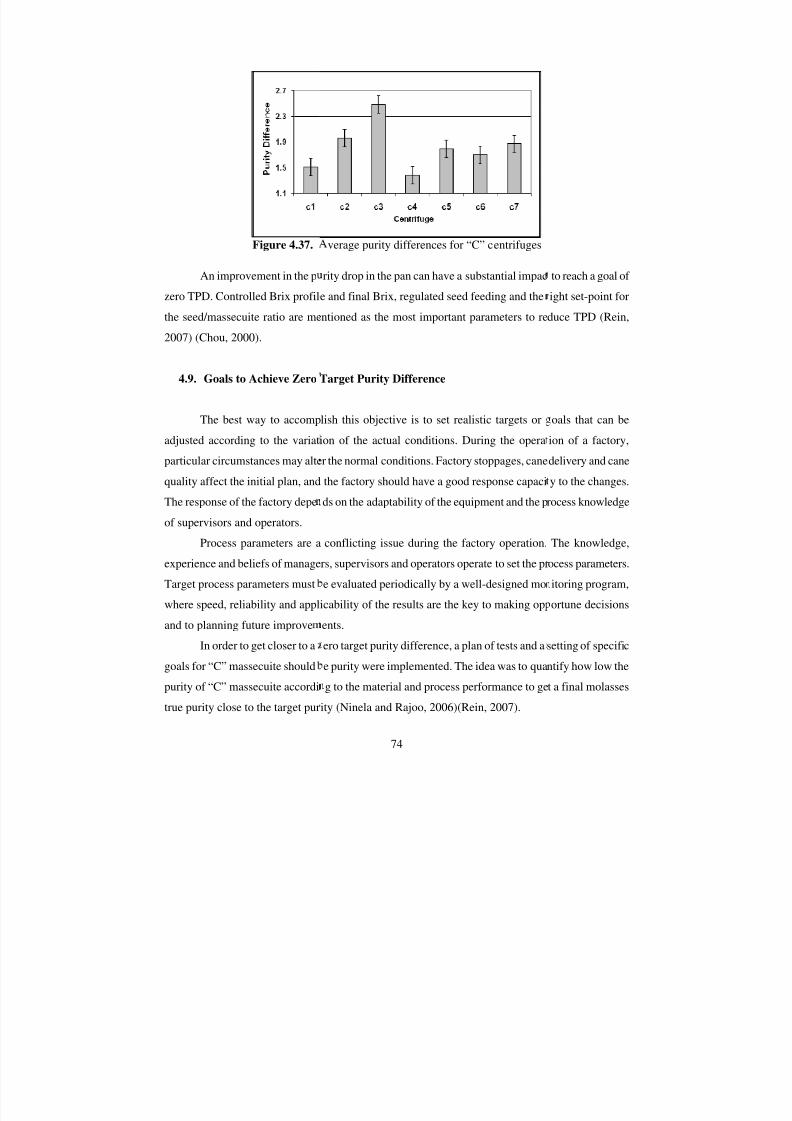
7/30/2019 Assessment of Target Purity Difference for a Louisiana Sugar Mill
http://slidepdf.com/reader/full/assessment-of-target-purity-difference-for-a-louisiana-sugar-mill 81/115
Figure 4.37.
An improvement in the p
zero TPD. Controlled Brix profil
the seed/massecuite ratio are me
2007) (Chou, 2000).
4.9. Goals to Achieve Zero
The best way to accomp
adjusted according to the variat
particular circumstances may alte
quality affect the initial plan, and
The response of the factory depe
of supervisors and operators.
Process parameters are a
experience and beliefs of manage
Target process parameters must
where speed, reliability and appland to planning future improve
In order to get closer to a
goals for “C” massecuite should
purity of “C” massecuite accordi
true purity close to the target pur
74
verage purity differences for “C” centrifuges
rity drop in the pan can have a substantial impac
e and final Brix, regulated seed feeding and the
ntioned as the most important parameters to re
Target Purity Difference
lish this objective is to set realistic targets or
ion of the actual conditions. During the opera
r the normal conditions. Factory stoppages, cane
the factory should have a good response capaci
ds on the adaptability of the equipment and the p
conflicting issue during the factory operation.
rs, supervisors and operators operate to set the pr
e evaluated periodically by a well-designed mo
icability of the results are the key to making opents.
ero target purity difference, a plan of tests and a
e purity were implemented. The idea was to qua
g to the material and process performance to ge
ity (Ninela and Rajoo, 2006)(Rein, 2007).
to reach a goal of
ight set-point for
duce TPD (Rein,
oals that can be
ion of a factory,
delivery and cane
y to the changes.
rocess knowledge
The knowledge,
ocess parameters.
itoring program,
ortune decisions
setting of specific
ntify how low the
t a final molasses
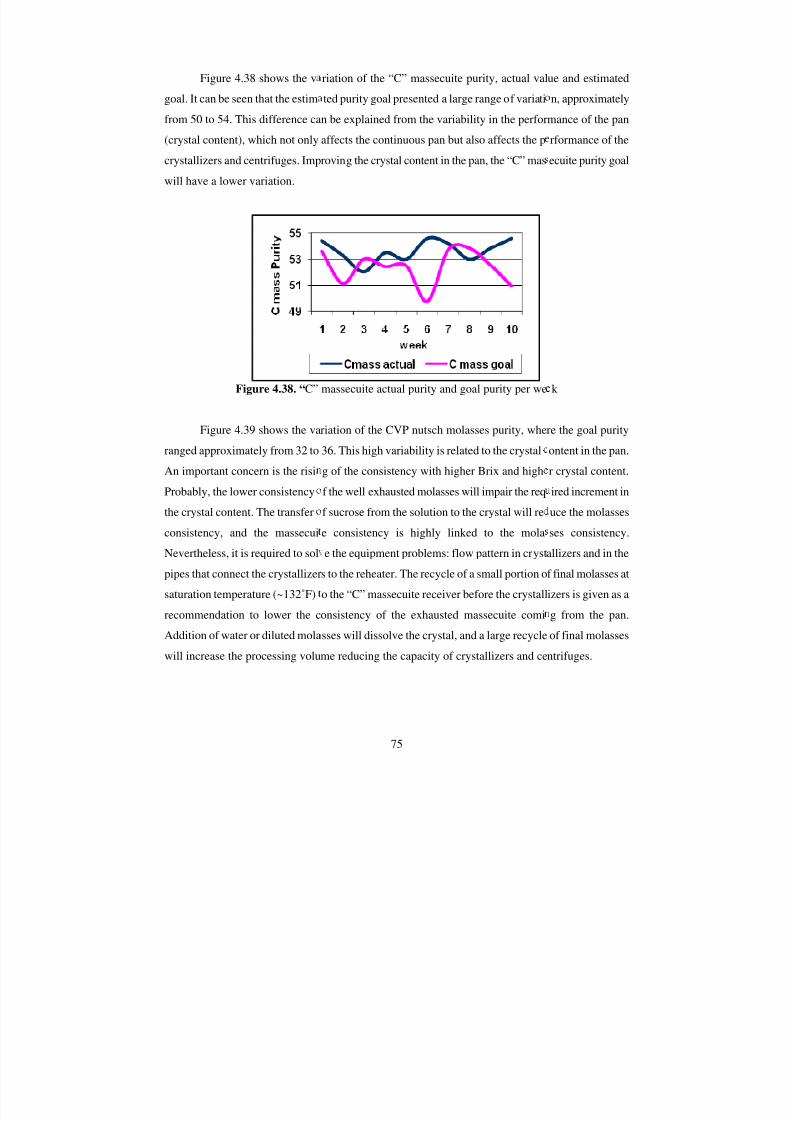
7/30/2019 Assessment of Target Purity Difference for a Louisiana Sugar Mill
http://slidepdf.com/reader/full/assessment-of-target-purity-difference-for-a-louisiana-sugar-mill 82/115
Figure 4.38 shows the v
goal. It can be seen that the estim
from 50 to 54. This difference ca
(crystal content), which not only
crystallizers and centrifuges. Imp
will have a lower variation.
Figure 4.38. “C”
Figure 4.39 shows the va
ranged approximately from 32 toAn important concern is the risi
Probably, the lower consistency
the crystal content. The transfer
consistency, and the massecui
Nevertheless, it is required to sol
pipes that connect the crystallizer
saturation temperature (~132˚F)
recommendation to lower the c
Addition of water or diluted mola
will increase the processing volu
75
riation of the “C” massecuite purity, actual val
ted purity goal presented a large range of variati
n be explained from the variability in the perfor
affects the continuous pan but also affects the p
roving the crystal content in the pan, the “C” mas
massecuite actual purity and goal purity per we
riation of the CVP nutsch molasses purity, whe
36. This high variability is related to the crystalg of the consistency with higher Brix and high
f the well exhausted molasses will impair the req
f sucrose from the solution to the crystal will re
e consistency is highly linked to the mola
e the equipment problems: flow pattern in cryst
s to the reheater. The recycle of a small portion o
o the “C” massecuite receiver before the crystall
onsistency of the exhausted massecuite comi
sses will dissolve the crystal, and a large recycle
me reducing the capacity of crystallizers and ce
ue and estimated
n, approximately
mance of the pan
rformance of the
ecuite purity goal
k
re the goal purity
ontent in the pan.r crystal content.
ired increment in
uce the molasses
ses consistency.
allizers and in the
f final molasses at
izers is given as a
g from the pan.
of final molasses
ntrifuges.
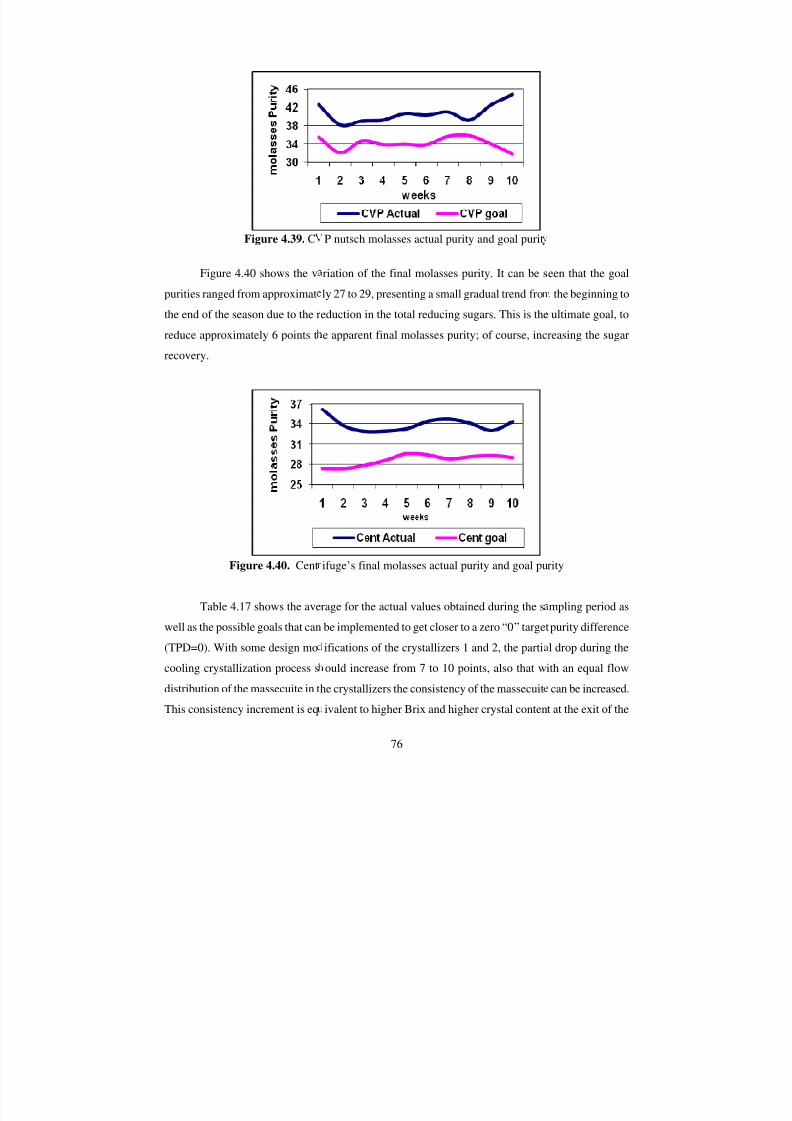
7/30/2019 Assessment of Target Purity Difference for a Louisiana Sugar Mill
http://slidepdf.com/reader/full/assessment-of-target-purity-difference-for-a-louisiana-sugar-mill 83/115
Figure 4.39. C
Figure 4.40 shows the v
purities ranged from approximat
the end of the season due to the r
reduce approximately 6 points t
recovery.
Figure 4.40. Cent
Table 4.17 shows the ave
well as the possible goals that can
(TPD=0). With some design mo
cooling crystallization process s
distribution of the massecuite in t
This consistency increment is eq
76
P nutsch molasses actual purity and goal purit
riation of the final molasses purity. It can be s
ly 27 to 29, presenting a small gradual trend fro
eduction in the total reducing sugars. This is the
e apparent final molasses purity; of course, inc
ifuge’s final molasses actual purity and goal pu
rage for the actual values obtained during the s
be implemented to get closer to a zero “0” target
ifications of the crystallizers 1 and 2, the parti
ould increase from 7 to 10 points, also that w
he crystallizers the consistency of the massecuit
ivalent to higher Brix and higher crystal conten
een that the goal
the beginning to
ultimate goal, to
reasing the sugar
rity
mpling period as
purity difference
l drop during the
ith an equal flow
can be increased.
t at the exit of the
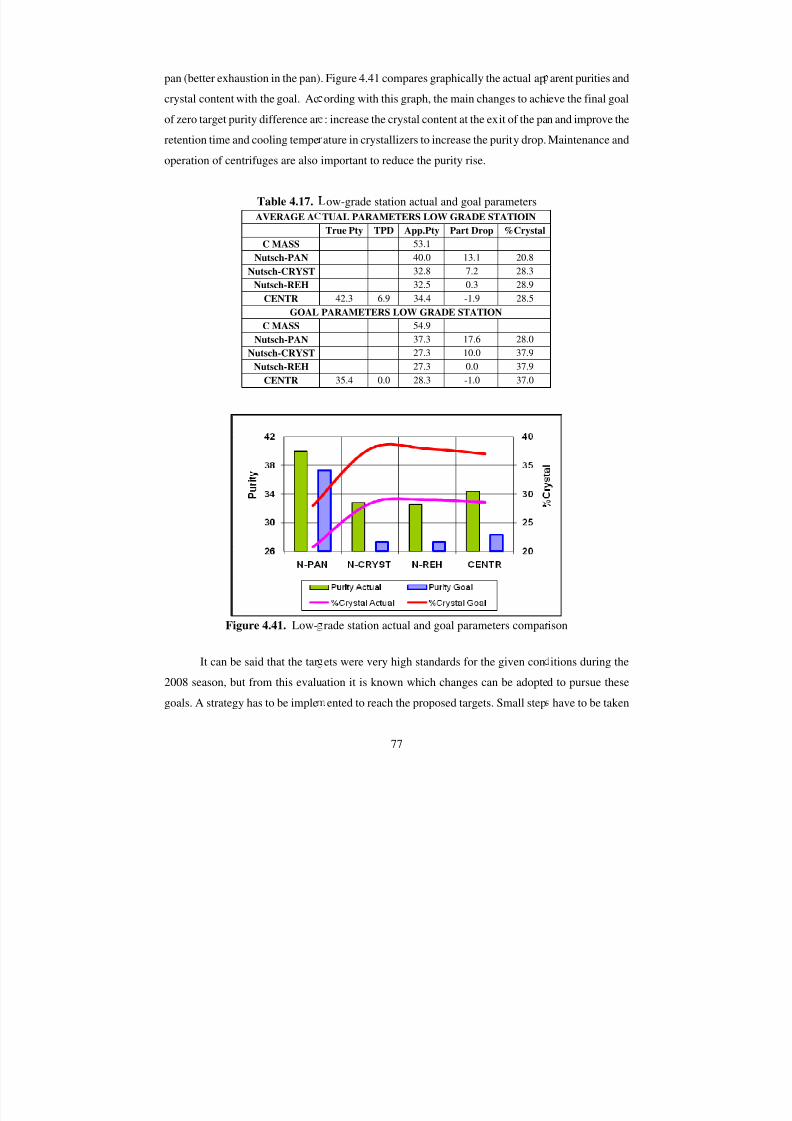
7/30/2019 Assessment of Target Purity Difference for a Louisiana Sugar Mill
http://slidepdf.com/reader/full/assessment-of-target-purity-difference-for-a-louisiana-sugar-mill 84/115
pan (better exhaustion in the pan)
crystal content with the goal. Ac
of zero target purity difference ar
retention time and cooling tempe
operation of centrifuges are also
Table 4.17.
AVERAGE A
C MASS
Nutsch-PAN
Nutsch-CRYST
Nutsch-REH
CENTRGOAL
C MASS
Nutsch-PAN
Nutsch-CRYST
Nutsch-REH
CENTR
Figure 4.41. Low-
It can be said that the tar
2008 season, but from this evalu
goals. A strategy has to be imple
77
. Figure 4.41 compares graphically the actual ap
ording with this graph, the main changes to achi
: increase the crystal content at the exit of the pa
ature in crystallizers to increase the purity drop.
important to reduce the purity rise.
ow-grade station actual and goal parameters
TUAL PARAMETERS LOW GRADE STATIOIN
True Pty TPD App.Pty Part Drop %Crystal
53.1
40.0 13.1 20.8
32.8 7.2 28.3
32.5 0.3 28.9
42.3 6.9 34.4 -1.9 28.5PARAMETERS LOW GRADE STATION
54.9
37.3 17.6 28.0
27.3 10.0 37.9
27.3 0.0 37.9
35.4 0.0 28.3 -1.0 37.0
rade station actual and goal parameters compar
ets were very high standards for the given con
ation it is known which changes can be adopte
ented to reach the proposed targets. Small step
arent purities and
eve the final goal
n and improve the
Maintenance and
ison
itions during the
d to pursue these
have to be taken
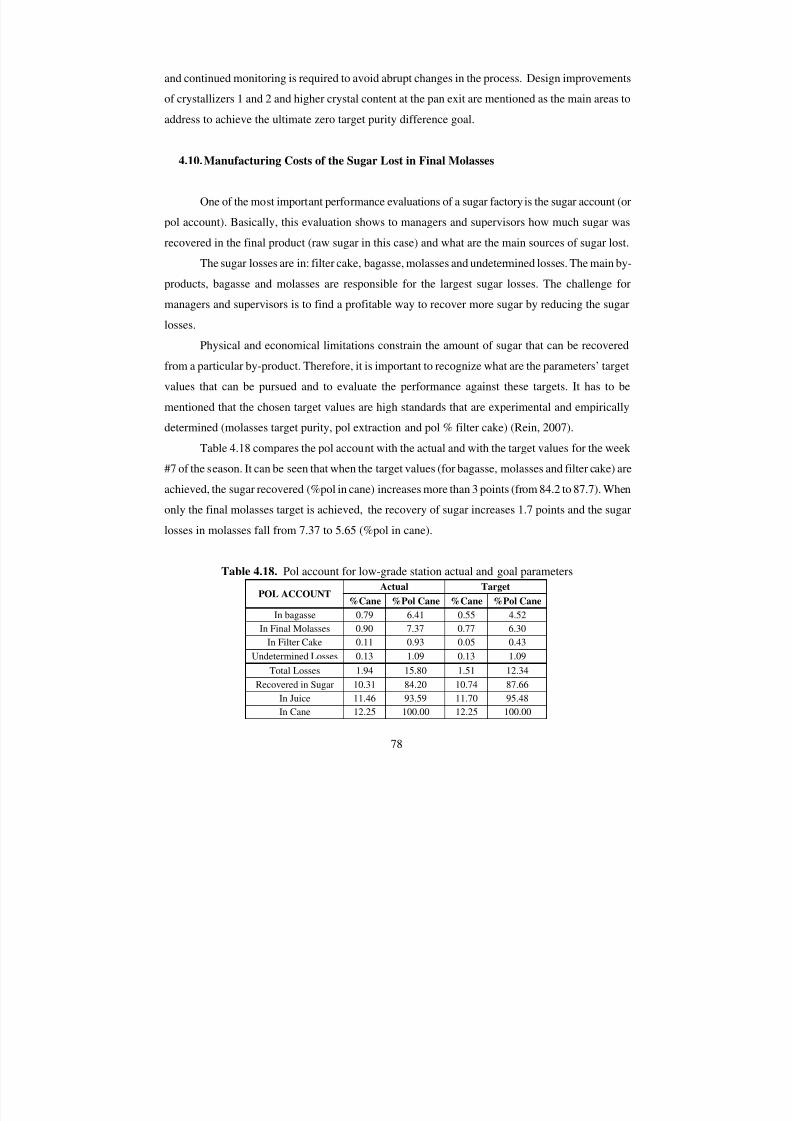
7/30/2019 Assessment of Target Purity Difference for a Louisiana Sugar Mill
http://slidepdf.com/reader/full/assessment-of-target-purity-difference-for-a-louisiana-sugar-mill 85/115
78
and continued monitoring is required to avoid abrupt changes in the process. Design improvements
of crystallizers 1 and 2 and higher crystal content at the pan exit are mentioned as the main areas to
address to achieve the ultimate zero target purity difference goal.
4.10. Manufacturing Costs of the Sugar Lost in Final Molasses
One of the most important performance evaluations of a sugar factory is the sugar account (or
pol account). Basically, this evaluation shows to managers and supervisors how much sugar was
recovered in the final product (raw sugar in this case) and what are the main sources of sugar lost.
The sugar losses are in: filter cake, bagasse, molasses and undetermined losses. The main by-
products, bagasse and molasses are responsible for the largest sugar losses. The challenge for
managers and supervisors is to find a profitable way to recover more sugar by reducing the sugar
losses.
Physical and economical limitations constrain the amount of sugar that can be recovered
from a particular by-product. Therefore, it is important to recognize what are the parameters’ target
values that can be pursued and to evaluate the performance against these targets. It has to be
mentioned that the chosen target values are high standards that are experimental and empirically
determined (molasses target purity, pol extraction and pol % filter cake) (Rein, 2007).
Table 4.18 compares the pol account with the actual and with the target values for the week
#7 of the season. It can be seen that when the target values (for bagasse, molasses and filter cake) are
achieved, the sugar recovered (%pol in cane) increases more than 3 points (from 84.2 to 87.7). When
only the final molasses target is achieved, the recovery of sugar increases 1.7 points and the sugar
losses in molasses fall from 7.37 to 5.65 (%pol in cane).
Table 4.18. Pol account for low-grade station actual and goal parameters
POL ACCOUNTActual Target
%Cane %Pol Cane %Cane %Pol Cane
In bagasse 0.79 6.41 0.55 4.52
In Final Molasses 0.90 7.37 0.77 6.30
In Filter Cake 0.11 0.93 0.05 0.43
Undetermined Losses 0.13 1.09 0.13 1.09
Total Losses 1.94 15.80 1.51 12.34
Recovered in Sugar 10.31 84.20 10.74 87.66
In Juice 11.46 93.59 11.70 95.48
In Cane 12.25 100.00 12.25 100.00
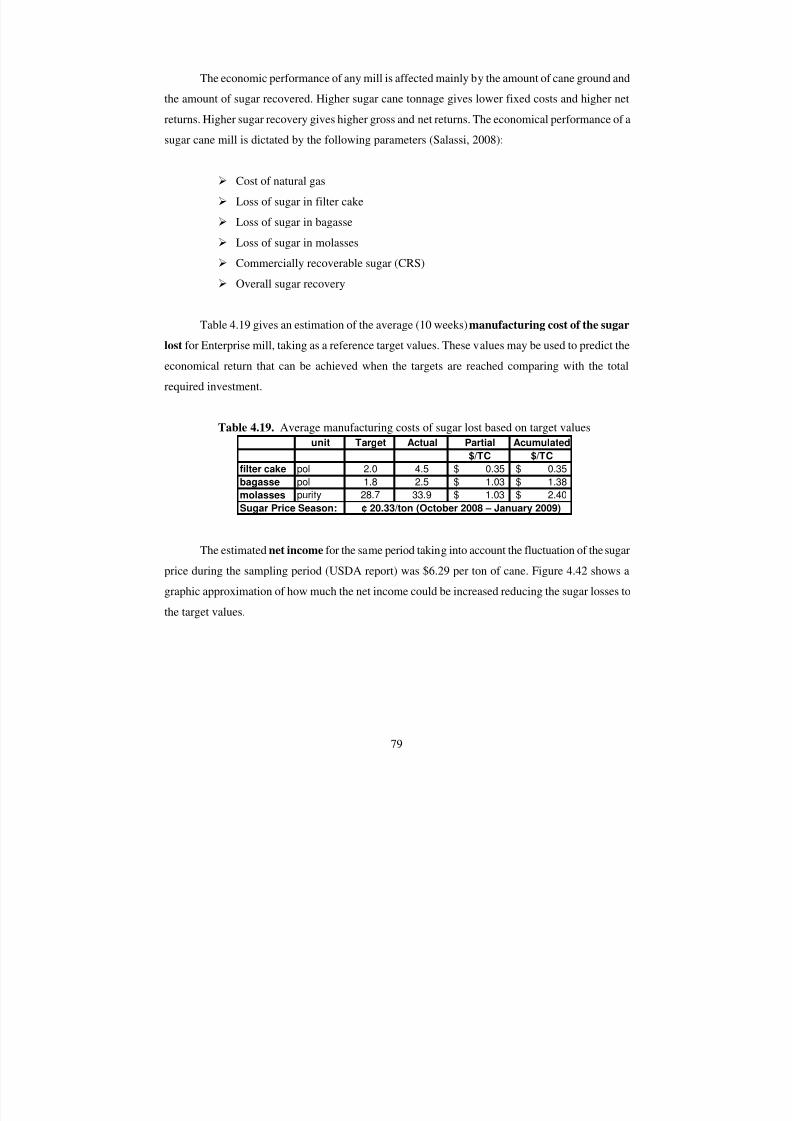
7/30/2019 Assessment of Target Purity Difference for a Louisiana Sugar Mill
http://slidepdf.com/reader/full/assessment-of-target-purity-difference-for-a-louisiana-sugar-mill 86/115
79
The economic performance of any mill is affected mainly by the amount of cane ground and
the amount of sugar recovered. Higher sugar cane tonnage gives lower fixed costs and higher net
returns. Higher sugar recovery gives higher gross and net returns. The economical performance of a
sugar cane mill is dictated by the following parameters (Salassi, 2008):
Cost of natural gas
Loss of sugar in filter cake
Loss of sugar in bagasse
Loss of sugar in molasses
Commercially recoverable sugar (CRS)
Overall sugar recovery
Table 4.19 gives an estimation of the average (10 weeks) manufacturing cost of the sugar
lost for Enterprise mill, taking as a reference target values. These values may be used to predict the
economical return that can be achieved when the targets are reached comparing with the total
required investment.
Table 4.19. Average manufacturing costs of sugar lost based on target values
The estimated net income for the same period taking into account the fluctuation of the sugar
price during the sampling period (USDA report) was $6.29 per ton of cane. Figure 4.42 shows a
graphic approximation of how much the net income could be increased reducing the sugar losses to
the target values.
unit Target Actual Partial Acumulated
$/TC $/TCfilter cake pol 2.0 4.5 0.35$ 0.35$
bagasse pol 1.8 2.5 1.03$ 1.38$
molasses purity 28.7 33.9 1.03$ 2.40$
Sugar Price Season: ¢ 20.33/ton (October 2008 – January 2009)
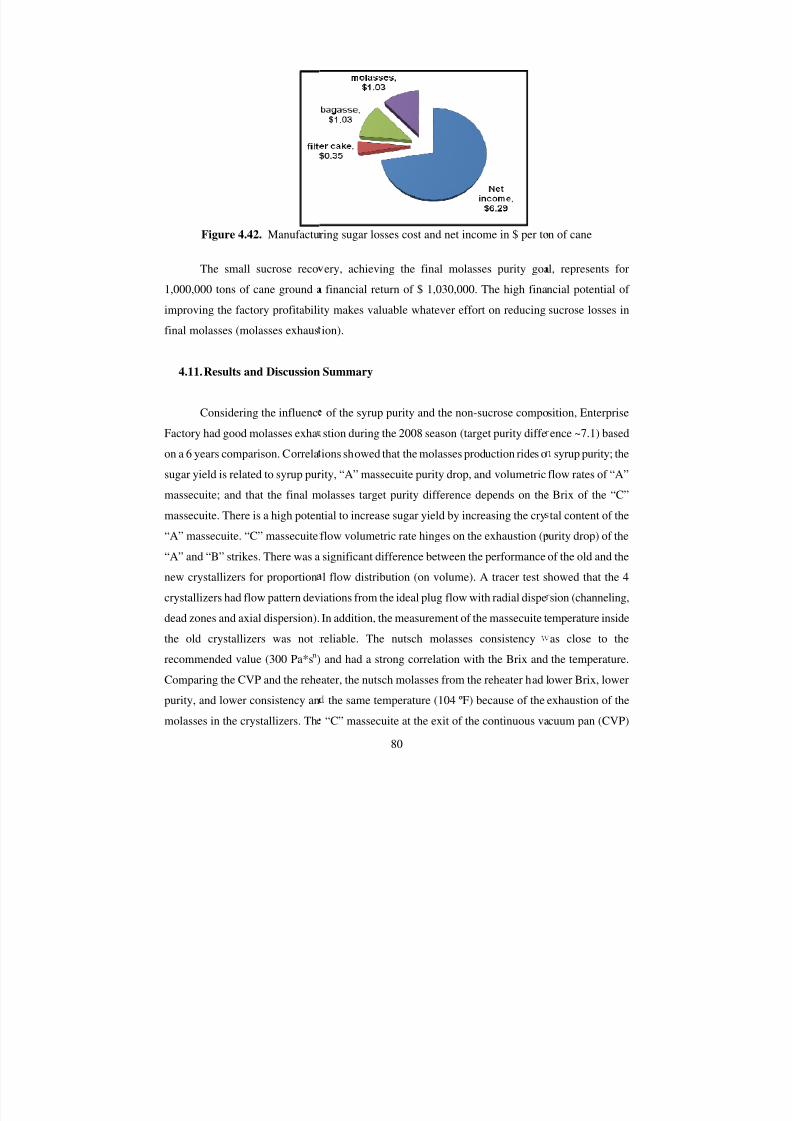
7/30/2019 Assessment of Target Purity Difference for a Louisiana Sugar Mill
http://slidepdf.com/reader/full/assessment-of-target-purity-difference-for-a-louisiana-sugar-mill 87/115
Figure 4.42. Manufactu
The small sucrose reco
1,000,000 tons of cane ground a
improving the factory profitabili
final molasses (molasses exhaus
4.11. Results and Discussion
Considering the influenc
Factory had good molasses exha
on a 6 years comparison. Correla
sugar yield is related to syrup pur
massecuite; and that the final m
massecuite. There is a high poten
“A” massecuite. “C” massecuite
“A” and “B” strikes. There was a
new crystallizers for proportion
crystallizers had flow pattern dev
dead zones and axial dispersion).
the old crystallizers was not
recommended value (300 Pa*sn)
Comparing the CVP and the rehe
purity, and lower consistency an
molasses in the crystallizers. Th
80
ring sugar losses cost and net income in $ per to
ery, achieving the final molasses purity goa
financial return of $ 1,030,000. The high fina
ty makes valuable whatever effort on reducing
ion).
Summary
of the syrup purity and the non-sucrose compo
stion during the 2008 season (target purity diffe
ions showed that the molasses production rides o
ity, “A” massecuite purity drop, and volumetric
olasses target purity difference depends on the
tial to increase sugar yield by increasing the cry
flow volumetric rate hinges on the exhaustion (p
significant difference between the performance
l flow distribution (on volume). A tracer test s
iations from the ideal plug flow with radial dispe
In addition, the measurement of the massecuite t
reliable. The nutsch molasses consistency
and had a strong correlation with the Brix and
ater, the nutsch molasses from the reheater had l
the same temperature (104 ºF) because of the
“C” massecuite at the exit of the continuous va
n of cane
l, represents for
ncial potential of
sucrose losses in
sition, Enterprise
ence ~7.1) based
syrup purity; the
flow rates of “A”
Brix of the “C”
tal content of the
urity drop) of the
of the old and the
howed that the 4
sion (channeling,
emperature inside
as close to the
the temperature.
ower Brix, lower
exhaustion of the
cuum pan (CVP)
7/30/2019 Assessment of Target Purity Difference for a Louisiana Sugar Mill
http://slidepdf.com/reader/full/assessment-of-target-purity-difference-for-a-louisiana-sugar-mill 88/115
81
had crystal content below the recommended values (25 – 28%); and comparing the input (grain) and
the output (“C” massecuite) at the CVP, it was found that sometimes the mean size of the crystal did
not show crystal growth. The supersaturation at the close of the season was above of the safety zone
at the exit of the CVP, showing not enough molasses exhaustion; the non-sucrose/water ratio was
also below the recommended value (NS/w~4). Purity drops and purity goals analysis showed that the
molasses exhaustion can be further improved by increasing the crystal content in the pan (25 – 28%)
and modifying the flow pattern of the old crystallizers (retention time > 30 hours). Reheater and
centrifuges had an average performance. Massecuite quality (Brix, purity and crystal size
distribution) volumetric flow rate, temperature control and scheduled centrifuges maintenance will
keep and overpass the actual performance of these stages. Finally, a financial evaluation showed that
Enterprise factory may increase its net income in approximately 16% reducing the purity of the final
molasses to its target value (zero target purity difference). Enterprise Factory has a high potential of
increasing its sugar recovery by means of few changes on capacity and operation for each stage of
the boiling house.
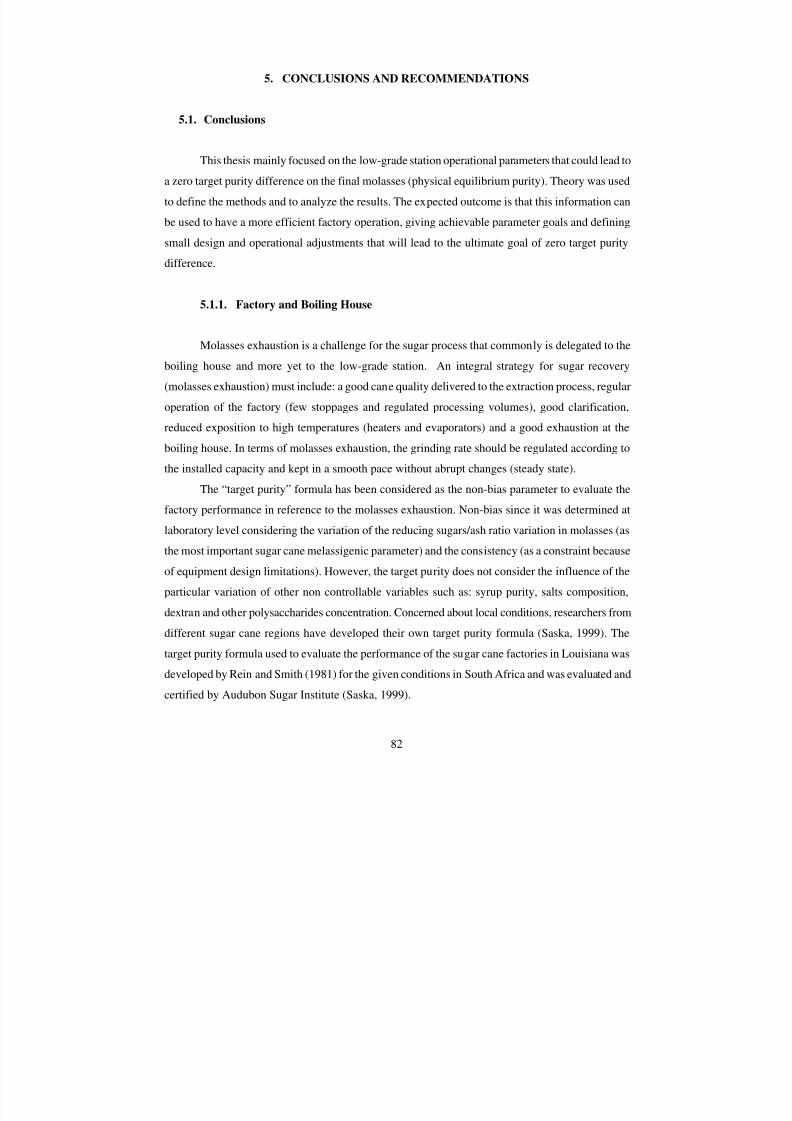
7/30/2019 Assessment of Target Purity Difference for a Louisiana Sugar Mill
http://slidepdf.com/reader/full/assessment-of-target-purity-difference-for-a-louisiana-sugar-mill 89/115
82
5. CONCLUSIONS AND RECOMMENDATIONS
5.1. Conclusions
This thesis mainly focused on the low-grade station operational parameters that could lead to
a zero target purity difference on the final molasses (physical equilibrium purity). Theory was used
to define the methods and to analyze the results. The expected outcome is that this information can
be used to have a more efficient factory operation, giving achievable parameter goals and defining
small design and operational adjustments that will lead to the ultimate goal of zero target purity
difference.
5.1.1. Factory and Boiling House
Molasses exhaustion is a challenge for the sugar process that commonly is delegated to the
boiling house and more yet to the low-grade station. An integral strategy for sugar recovery
(molasses exhaustion) must include: a good cane quality delivered to the extraction process, regular
operation of the factory (few stoppages and regulated processing volumes), good clarification,
reduced exposition to high temperatures (heaters and evaporators) and a good exhaustion at the
boiling house. In terms of molasses exhaustion, the grinding rate should be regulated according to
the installed capacity and kept in a smooth pace without abrupt changes (steady state).
The “target purity” formula has been considered as the non-bias parameter to evaluate the
factory performance in reference to the molasses exhaustion. Non-bias since it was determined at
laboratory level considering the variation of the reducing sugars/ash ratio variation in molasses (as
the most important sugar cane melassigenic parameter) and the consistency (as a constraint because
of equipment design limitations). However, the target purity does not consider the influence of the
particular variation of other non controllable variables such as: syrup purity, salts composition,
dextran and other polysaccharides concentration. Concerned about local conditions, researchers from
different sugar cane regions have developed their own target purity formula (Saska, 1999). The
target purity formula used to evaluate the performance of the sugar cane factories in Louisiana was
developed by Rein and Smith (1981) for the given conditions in South Africa and was evaluated and
certified by Audubon Sugar Institute (Saska, 1999).
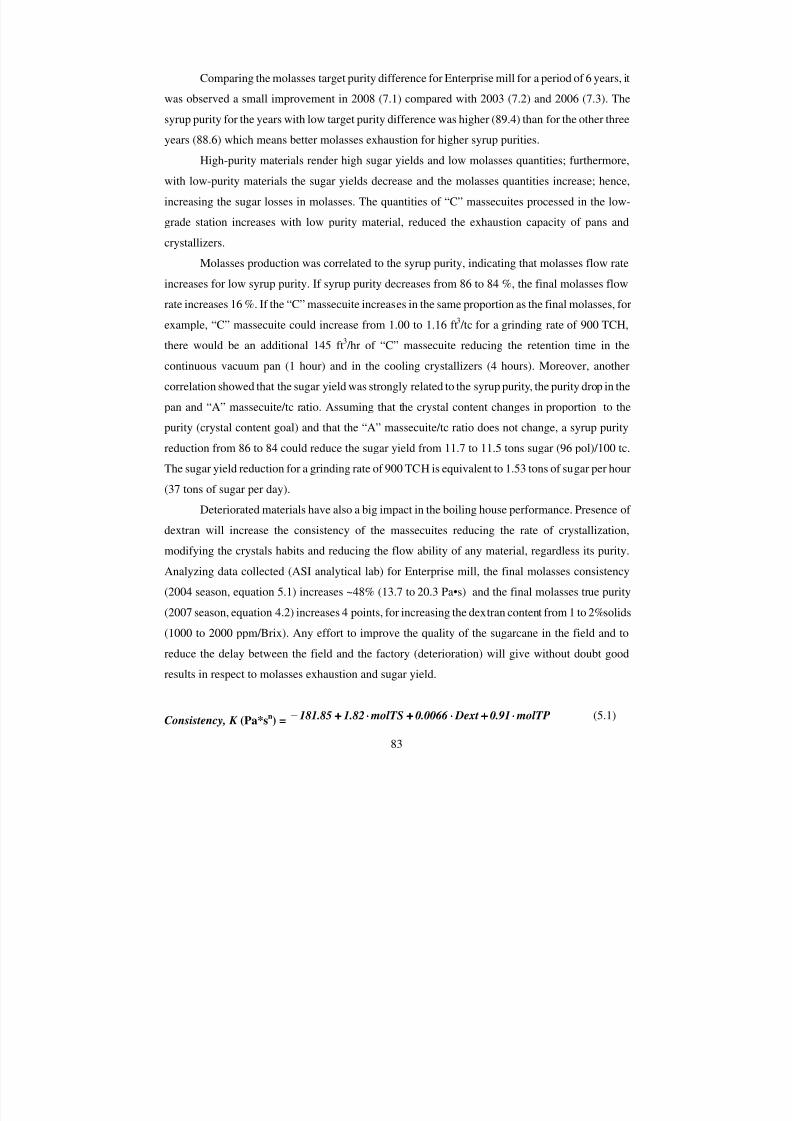
7/30/2019 Assessment of Target Purity Difference for a Louisiana Sugar Mill
http://slidepdf.com/reader/full/assessment-of-target-purity-difference-for-a-louisiana-sugar-mill 90/115
83
Comparing the molasses target purity difference for Enterprise mill for a period of 6 years, it
was observed a small improvement in 2008 (7.1) compared with 2003 (7.2) and 2006 (7.3). The
syrup purity for the years with low target purity difference was higher (89.4) than for the other three
years (88.6) which means better molasses exhaustion for higher syrup purities.
High-purity materials render high sugar yields and low molasses quantities; furthermore,
with low-purity materials the sugar yields decrease and the molasses quantities increase; hence,
increasing the sugar losses in molasses. The quantities of “C” massecuites processed in the low-
grade station increases with low purity material, reduced the exhaustion capacity of pans and
crystallizers.
Molasses production was correlated to the syrup purity, indicating that molasses flow rate
increases for low syrup purity. If syrup purity decreases from 86 to 84 %, the final molasses flow
rate increases 16 %. If the “C” massecuite increases in the same proportion as the final molasses, for
example, “C” massecuite could increase from 1.00 to 1.16 ft3 /tc for a grinding rate of 900 TCH,
there would be an additional 145 ft3 /hr of “C” massecuite reducing the retention time in the
continuous vacuum pan (1 hour) and in the cooling crystallizers (4 hours). Moreover, another
correlation showed that the sugar yield was strongly related to the syrup purity, the purity drop in the
pan and “A” massecuite/tc ratio. Assuming that the crystal content changes in proportion to the
purity (crystal content goal) and that the “A” massecuite/tc ratio does not change, a syrup purity
reduction from 86 to 84 could reduce the sugar yield from 11.7 to 11.5 tons sugar (96 pol)/100 tc.
The sugar yield reduction for a grinding rate of 900 TCH is equivalent to 1.53 tons of sugar per hour
(37 tons of sugar per day).
Deteriorated materials have also a big impact in the boiling house performance. Presence of
dextran will increase the consistency of the massecuites reducing the rate of crystallization,
modifying the crystals habits and reducing the flow ability of any material, regardless its purity.
Analyzing data collected (ASI analytical lab) for Enterprise mill, the final molasses consistency
(2004 season, equation 5.1) increases ~48% (13.7 to 20.3 Pa•s) and the final molasses true purity
(2007 season, equation 4.2) increases 4 points, for increasing the dextran content from 1 to 2%solids
(1000 to 2000 ppm/Brix). Any effort to improve the quality of the sugarcane in the field and to
reduce the delay between the field and the factory (deterioration) will give without doubt good
results in respect to molasses exhaustion and sugar yield.
Consistency, K (Pa*sn) = molTP0.91 Dext0.0066 molTS1.82181.85 ⋅⋅⋅⋅++++⋅⋅⋅⋅++++⋅⋅⋅⋅++++−−−− (5.1)
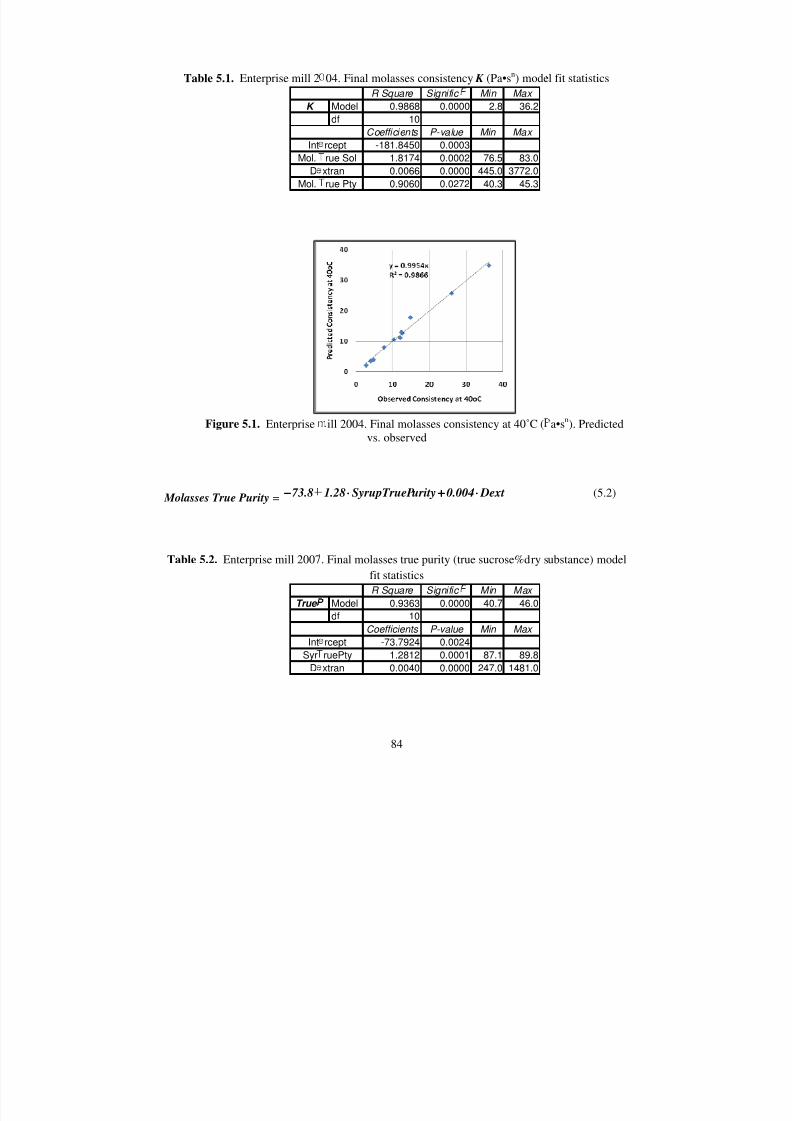
7/30/2019 Assessment of Target Purity Difference for a Louisiana Sugar Mill
http://slidepdf.com/reader/full/assessment-of-target-purity-difference-for-a-louisiana-sugar-mill 91/115
Table 5.1. Enterprise mill 2
Figure 5.1. Enterprise
Molasses True Purity = 73.8−−−−
Table 5.2. Enterprise mill 2007
K
Int
Mol.
D
Mol.
True
Int
Syr
D
84
04. Final molasses consistency K (Pa•sn) mode
ill 2004. Final molasses consistency at 40˚C (vs. observed
Dext0.004uritySyrupTrueP1.28 ⋅⋅⋅⋅++++⋅⋅⋅⋅
. Final molasses true purity (true sucrose%dry s
fit statistics
R Square Signific Min Max
Model 0.9868 0.0000 2.8 36.2
df 10
Coefficients P-value Min Max
-181.8450 0.0003
1.8174 0.0002 76.5 83.0
0.0066 0.0000 445.0 3772.0
0.9060 0.0272 40.3 45.3
rcept
rue Sol
xtran
rue Pty
R Square Signific Min Max
Model 0.9363 0.0000 40.7 46.0df 10
Coefficients P-value Min Max
-73.7924 0.0024
1.2812 0.0001 87.1 89.8
0.0040 0.0000 247.0 1481.0
rcept
ruePty
xtran
l fit statistics
a•sn). Predicted
(5.2)
ubstance) model
7/30/2019 Assessment of Target Purity Difference for a Louisiana Sugar Mill
http://slidepdf.com/reader/full/assessment-of-target-purity-difference-for-a-louisiana-sugar-mill 92/115
Figure 5.2. Enterps
The boiling house can b
recover the sugar, and the revers
downstream and vice versa. A
massecuites will increase the pu
reducing their capacity to recove
and low quantity of “C” sugar,
(double–Einwurf scheme), whic
affecting its exhaustion and conti
a way that each stage can do its b
problem upstream but down-stre
the low-grade station: seed prepa
and centrifugal separation.
Through the 2008 season
the end. The materials processed
capacity of the boiling house bec
of the “A” massecuite (sugar yie
stages (reducing retention time).
which can directly benefit the
massecuite. Amount and quality
content of the “A” massecuite (g
85
ise mill 2007. Final molasses true purity (true sbstance), predicted vs. observed
considered a cyclic process. One direction of
direction is to grow the crystal. What happens
low exhaustion (low purity drop and low su
ity and the amount of material to be processed
r sugar. A low exhaustion of “C” massecuite re
hich is going to reduce the crystal content of th
h in turn will reduce the crystal content of the
nuing the cycle. The boiling house has to be well
st. Good quality syrup (high purity, no dextran)
m the other part of the problem has to be solve
ation, evaporative crystallization, cooling crystal
at Enterprise mill, the grinding rate increased fro
in the boiling house increased at the same pace, a
me limited at the same time. This affected prima
ld) and promoted a higher volumetric flow rate
he factory must look for a good exhaustion of t
ugar yield and will reduce the quantity and
of the “B” magma are very important to keep t
ood exhaustion).
crose%dry
the process is to
upstream affects
ar yield) in “A”
y the next steps,
ders low quality
e “B” massecuite
“A” massecuite,
managed in such
solves part of the
on each stage of
ization, reheating
the beginning to
nd the exhaustion
ry the exhaustion
for the posterior
e “A” massecuite
urity of the “C”
he proper crystal
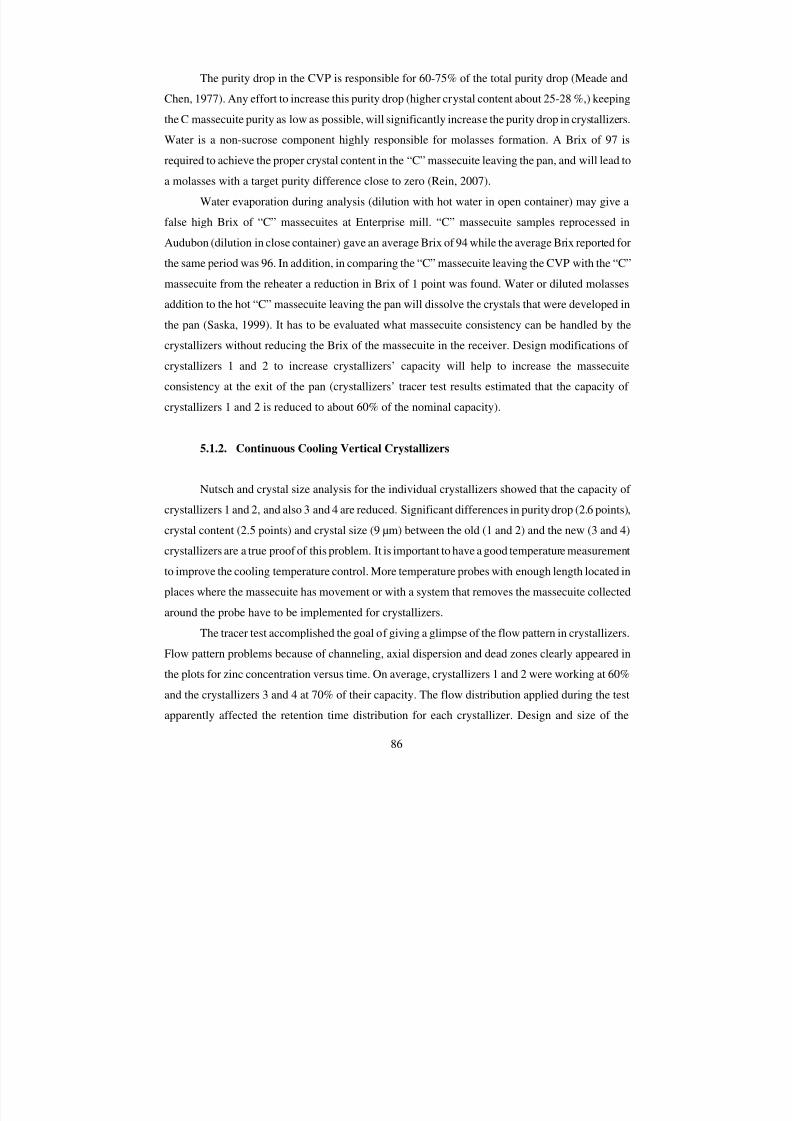
7/30/2019 Assessment of Target Purity Difference for a Louisiana Sugar Mill
http://slidepdf.com/reader/full/assessment-of-target-purity-difference-for-a-louisiana-sugar-mill 93/115
86
The purity drop in the CVP is responsible for 60-75% of the total purity drop (Meade and
Chen, 1977). Any effort to increase this purity drop (higher crystal content about 25-28 %,) keeping
the C massecuite purity as low as possible, will significantly increase the purity drop in crystallizers.
Water is a non-sucrose component highly responsible for molasses formation. A Brix of 97 is
required to achieve the proper crystal content in the “C” massecuite leaving the pan, and will lead to
a molasses with a target purity difference close to zero (Rein, 2007).
Water evaporation during analysis (dilution with hot water in open container) may give a
false high Brix of “C” massecuites at Enterprise mill. “C” massecuite samples reprocessed in
Audubon (dilution in close container) gave an average Brix of 94 while the average Brix reported for
the same period was 96. In addition, in comparing the “C” massecuite leaving the CVP with the “C”
massecuite from the reheater a reduction in Brix of 1 point was found. Water or diluted molasses
addition to the hot “C” massecuite leaving the pan will dissolve the crystals that were developed in
the pan (Saska, 1999). It has to be evaluated what massecuite consistency can be handled by the
crystallizers without reducing the Brix of the massecuite in the receiver. Design modifications of
crystallizers 1 and 2 to increase crystallizers’ capacity will help to increase the massecuite
consistency at the exit of the pan (crystallizers’ tracer test results estimated that the capacity of
crystallizers 1 and 2 is reduced to about 60% of the nominal capacity).
5.1.2. Continuous Cooling Vertical Crystallizers
Nutsch and crystal size analysis for the individual crystallizers showed that the capacity of
crystallizers 1 and 2, and also 3 and 4 are reduced. Significant differences in purity drop (2.6 points),
crystal content (2.5 points) and crystal size (9 µm) between the old (1 and 2) and the new (3 and 4)
crystallizers are a true proof of this problem. It is important to have a good temperature measurement
to improve the cooling temperature control. More temperature probes with enough length located in
places where the massecuite has movement or with a system that removes the massecuite collected
around the probe have to be implemented for crystallizers.
The tracer test accomplished the goal of giving a glimpse of the flow pattern in crystallizers.
Flow pattern problems because of channeling, axial dispersion and dead zones clearly appeared in
the plots for zinc concentration versus time. On average, crystallizers 1 and 2 were working at 60%
and the crystallizers 3 and 4 at 70% of their capacity. The flow distribution applied during the test
apparently affected the retention time distribution for each crystallizer. Design and size of the
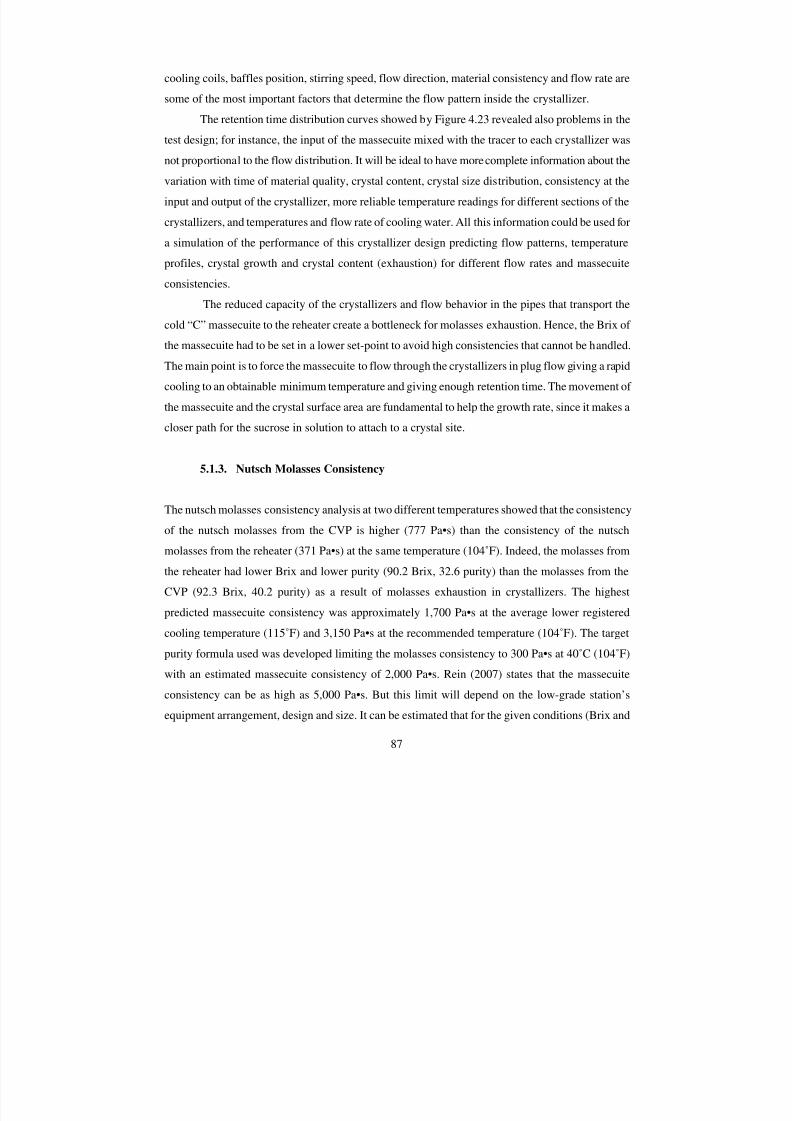
7/30/2019 Assessment of Target Purity Difference for a Louisiana Sugar Mill
http://slidepdf.com/reader/full/assessment-of-target-purity-difference-for-a-louisiana-sugar-mill 94/115
87
cooling coils, baffles position, stirring speed, flow direction, material consistency and flow rate are
some of the most important factors that determine the flow pattern inside the crystallizer.
The retention time distribution curves showed by Figure 4.23 revealed also problems in the
test design; for instance, the input of the massecuite mixed with the tracer to each crystallizer was
not proportional to the flow distribution. It will be ideal to have more complete information about the
variation with time of material quality, crystal content, crystal size distribution, consistency at the
input and output of the crystallizer, more reliable temperature readings for different sections of the
crystallizers, and temperatures and flow rate of cooling water. All this information could be used for
a simulation of the performance of this crystallizer design predicting flow patterns, temperature
profiles, crystal growth and crystal content (exhaustion) for different flow rates and massecuite
consistencies.
The reduced capacity of the crystallizers and flow behavior in the pipes that transport the
cold “C” massecuite to the reheater create a bottleneck for molasses exhaustion. Hence, the Brix of
the massecuite had to be set in a lower set-point to avoid high consistencies that cannot be handled.
The main point is to force the massecuite to flow through the crystallizers in plug flow giving a rapid
cooling to an obtainable minimum temperature and giving enough retention time. The movement of
the massecuite and the crystal surface area are fundamental to help the growth rate, since it makes a
closer path for the sucrose in solution to attach to a crystal site.
5.1.3. Nutsch Molasses Consistency
The nutsch molasses consistency analysis at two different temperatures showed that the consistency
of the nutsch molasses from the CVP is higher (777 Pa•s) than the consistency of the nutsch
molasses from the reheater (371 Pa•s) at the same temperature (104˚F). Indeed, the molasses from
the reheater had lower Brix and lower purity (90.2 Brix, 32.6 purity) than the molasses from the
CVP (92.3 Brix, 40.2 purity) as a result of molasses exhaustion in crystallizers. The highest
predicted massecuite consistency was approximately 1,700 Pa•s at the average lower registered
cooling temperature (115˚F) and 3,150 Pa•s at the recommended temperature (104˚F). The target
purity formula used was developed limiting the molasses consistency to 300 Pa•s at 40˚C (104˚F)
with an estimated massecuite consistency of 2,000 Pa•s. Rein (2007) states that the massecuite
consistency can be as high as 5,000 Pa•s. But this limit will depend on the low-grade station’s
equipment arrangement, design and size. It can be estimated that for the given conditions (Brix and
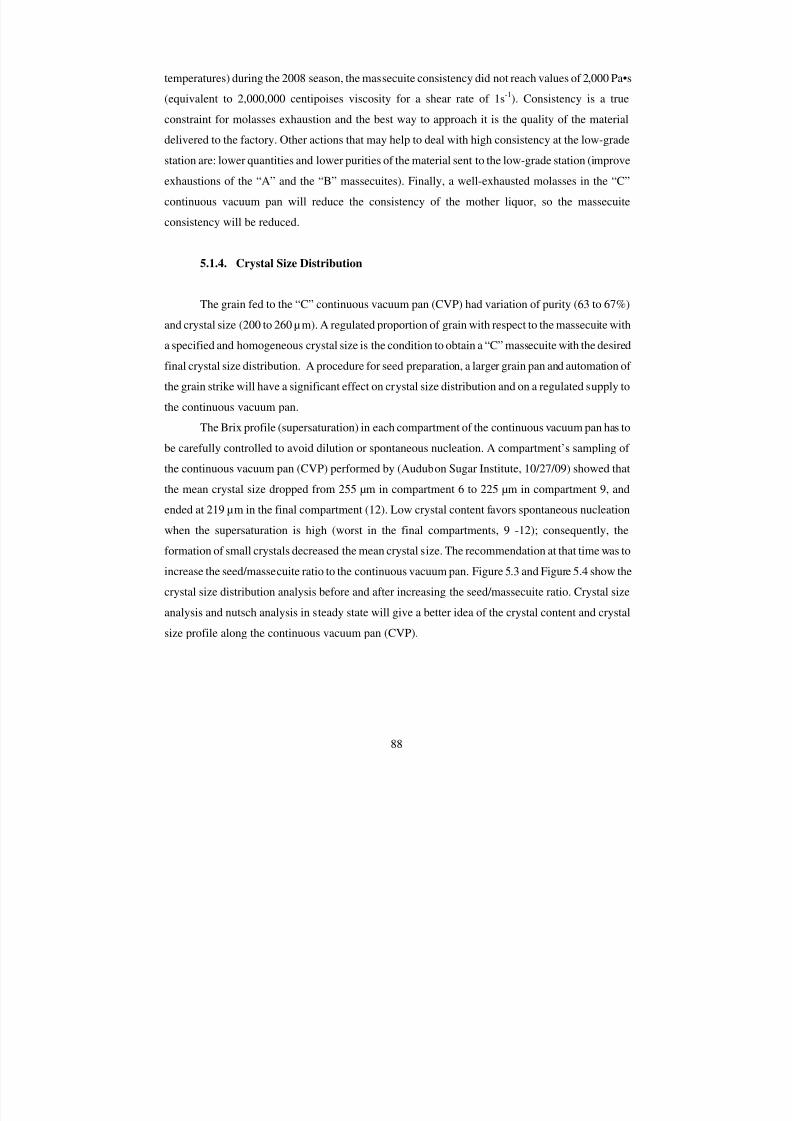
7/30/2019 Assessment of Target Purity Difference for a Louisiana Sugar Mill
http://slidepdf.com/reader/full/assessment-of-target-purity-difference-for-a-louisiana-sugar-mill 95/115
88
temperatures) during the 2008 season, the massecuite consistency did not reach values of 2,000 Pa•s
(equivalent to 2,000,000 centipoises viscosity for a shear rate of 1s -1). Consistency is a true
constraint for molasses exhaustion and the best way to approach it is the quality of the material
delivered to the factory. Other actions that may help to deal with high consistency at the low-grade
station are: lower quantities and lower purities of the material sent to the low-grade station (improve
exhaustions of the “A” and the “B” massecuites). Finally, a well-exhausted molasses in the “C”
continuous vacuum pan will reduce the consistency of the mother liquor, so the massecuite
consistency will be reduced.
5.1.4. Crystal Size Distribution
The grain fed to the “C” continuous vacuum pan (CVP) had variation of purity (63 to 67%)
and crystal size (200 to 260 µ m). A regulated proportion of grain with respect to the massecuite with
a specified and homogeneous crystal size is the condition to obtain a “C” massecuite with the desired
final crystal size distribution. A procedure for seed preparation, a larger grain pan and automation of
the grain strike will have a significant effect on crystal size distribution and on a regulated supply to
the continuous vacuum pan.
The Brix profile (supersaturation) in each compartment of the continuous vacuum pan has to
be carefully controlled to avoid dilution or spontaneous nucleation. A compartment’s sampling of
the continuous vacuum pan (CVP) performed by (Audubon Sugar Institute, 10/27/09) showed that
the mean crystal size dropped from 255 µm in compartment 6 to 225 µm in compartment 9, and
ended at 219 µm in the final compartment (12). Low crystal content favors spontaneous nucleation
when the supersaturation is high (worst in the final compartments, 9 -12); consequently, the
formation of small crystals decreased the mean crystal size. The recommendation at that time was to
increase the seed/massecuite ratio to the continuous vacuum pan. Figure 5.3 and Figure 5.4 show the
crystal size distribution analysis before and after increasing the seed/massecuite ratio. Crystal size
analysis and nutsch analysis in steady state will give a better idea of the crystal content and crystal
size profile along the continuous vacuum pan (CVP).
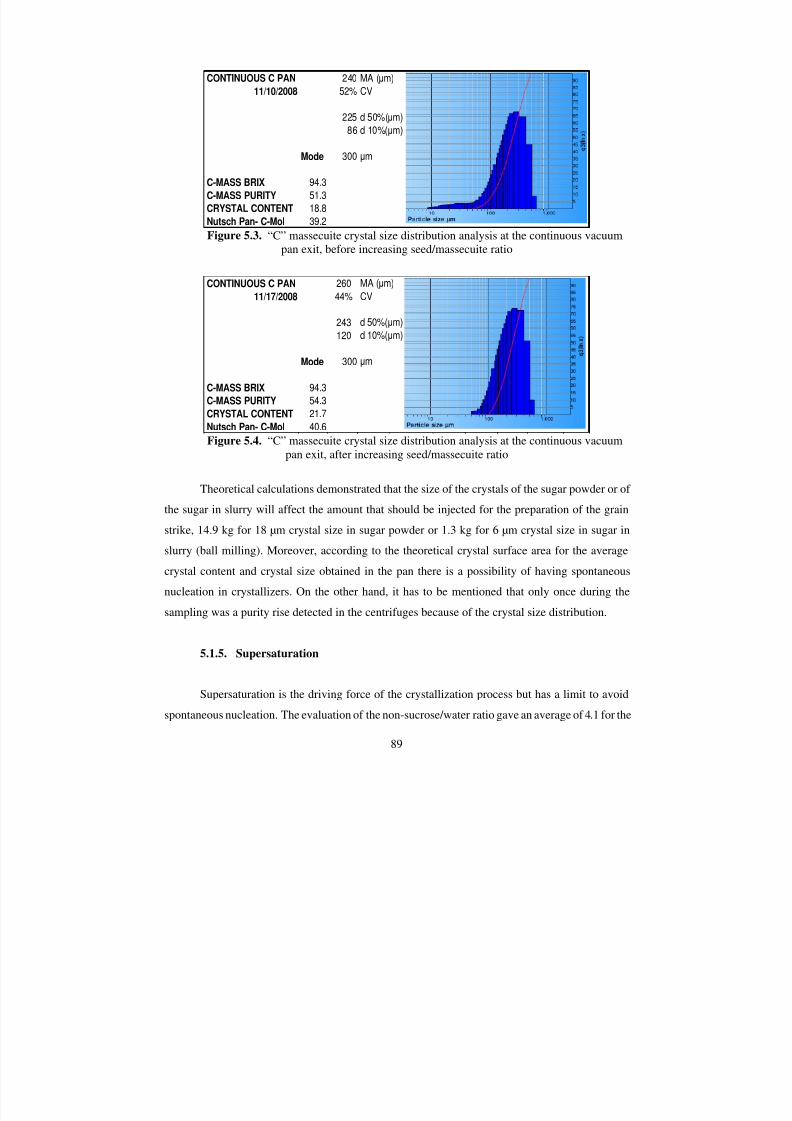
7/30/2019 Assessment of Target Purity Difference for a Louisiana Sugar Mill
http://slidepdf.com/reader/full/assessment-of-target-purity-difference-for-a-louisiana-sugar-mill 96/115
89
Figure 5.3. “C” massecuite crystal size distribution analysis at the continuous vacuumpan exit, before increasing seed/massecuite ratio
Figure 5.4. “C” massecuite crystal size distribution analysis at the continuous vacuum
pan exit, after increasing seed/massecuite ratio
Theoretical calculations demonstrated that the size of the crystals of the sugar powder or of
the sugar in slurry will affect the amount that should be injected for the preparation of the grain
strike, 14.9 kg for 18 µm crystal size in sugar powder or 1.3 kg for 6 µm crystal size in sugar in
slurry (ball milling). Moreover, according to the theoretical crystal surface area for the average
crystal content and crystal size obtained in the pan there is a possibility of having spontaneous
nucleation in crystallizers. On the other hand, it has to be mentioned that only once during the
sampling was a purity rise detected in the centrifuges because of the crystal size distribution.
5.1.5. Supersaturation
Supersaturation is the driving force of the crystallization process but has a limit to avoid
spontaneous nucleation. The evaluation of the non-sucrose/water ratio gave an average of 4.1 for the
CONTINUOUS C PAN 240 MA (µm)
11/10/2008 52% CV
225 d 50%(µm)
86 d 10%(µm)
Mode 300 µm
C-MASS BRIX 94.3
C-MASS PURITY 51.3
CRYSTAL CONTENT 18.8
Nutsch Pan- C-Mol 39.2
CONTINUOUS C PAN 260 MA (µm)
11/17/2008 44% CV
243 d 50%(µm)
120 d 10%(µm)
Mode 300 µm
C-MASS BRIX 94.3
C-MASS PURITY 54.3
CRYSTAL CONTENT 21.7
Nutsch Pan- C-Mol 40.6
7/30/2019 Assessment of Target Purity Difference for a Louisiana Sugar Mill
http://slidepdf.com/reader/full/assessment-of-target-purity-difference-for-a-louisiana-sugar-mill 97/115
90
massecuite from the continuous vacuum pan, but it was below 4 for the last 3 weeks of the sampling.
The recommended value for this parameter is approximately 4 to 4.5. The supersaturation coefficient
for the CVP nutsch molasses for the same last 3 weeks surpassed the safe boundary of 1.2. This high
supersaturation also indicated that the molasses exhaustion at the pan was not enough (low crystal
content) and the crystallization was outside the safe metastable zone. Nutsch molasses for the
crystallizers and reheater massecuites show the same trend (gradual rise of the supersaturation) at the
corresponding temperatures.
5.1.6. Nutsch Analysis and Goals for the Low-Grade Station
The biggest contribution from the nutsch analysis was recognizing the performance of each
stage in terms of the purity drop and crystal content. The nutsch analysis, combined with the
establishment of goals, helps to focus on the most representative problems that need to be solved for
instance, molasses exhaustion at the pan and at the crystallizers. The most important goals are:
increase crystal content in the pan up to 25 and 28% and increase the purity drop in crystallizers to
10 points.
The reheater operation was very stable. During the first 7 weeks of the season the “purity
drop” was negative compared with the nutsch purity for crystallizers. For the last 3 weeks there was
a rise ~0.5 certainly related to a higher grinding rate and higher “C” massecuite/tc ratio. In general,
the performance of the reheater was good, but as with the crystallizers the temperature control is also
an issue. The goal for the reheater is to keep the purity rise below or as high as zero.
Centrifuges performance was in general between the parameters. Purity rise was most of the
time between 3 and 2. Higher purity rises were detected once for screen damage and once for low
load. High purity rise was found once due to massecuite characteristics, crystal size distribution with
left tail. In general, it can be said that the centrifugal capacity satisfied the volumetric load of
massecuite during the 2008 season. The goal is to keep the purity rise around 1%.
Final molasses purity in centrifuges was slightly related to the “C” massecuite purity at the
reheater, highlighting the importance on keeping the “C” massecuite purity in the lower workable
level with crystal content around 25-28% (Ninela and Rajoo, 2006).
In summary, a good molasses exhaustion and hence a target purity difference close to zero
can be achieved with the knowledge of the process obtained through periodic evaluation of several
target parameters at the boiling house. As a reference, parameters obtained in other countries have
7/30/2019 Assessment of Target Purity Difference for a Louisiana Sugar Mill
http://slidepdf.com/reader/full/assessment-of-target-purity-difference-for-a-louisiana-sugar-mill 98/115
91
been used, but continued analysis can give the practical parameters that should be used for a
particular location. The continuous evaluation also can show what practical changes have to be
implemented to increase the sugar recovery in a profitable way.
5.2. Recommendations
According to the results, the practical recommendations to be implemented at Enterprise Mill
or any other mill interested in molasses exhaustion are:
Implement a periodic (one week frequency) sampling for nutsch test and crystal size
distribution, comparing the results with achievable goals given by trusted sources or by
history from successful past tests.
Optimize molasses exhaustion in the continuous vacuum pan (CVP) by improving:
seed/massecuite ratio and Brix profile - crystal content.
Supply the proper amount and quality of grain to the CVP. Establish procedures for seed
preparation and automation of the grain batch pan.
Improve the internal design of crystallizers as well as the input to the crystallizers, to
achieve the goal flow pattern – plug flow with radial dispersion.
Increase the pipe size or reduce the turns on the pipe that conducts the cold massecuite
from the crystallizer to the reheater.
Locate more than three (3) places to install the temperature probes in crystallizers,
considering the length and the wide of the probe and avoiding possible stagnant zones.
Perform a tracer test to verify flow pattern and an estimated retention time for each
crystallizer.
Optimize the exhaustion of the “B” massecuite but most important of the “A” massecuite.
It is required to increase crystal content
Reduce the delay time between cane harvesting and juice extraction.
7/30/2019 Assessment of Target Purity Difference for a Louisiana Sugar Mill
http://slidepdf.com/reader/full/assessment-of-target-purity-difference-for-a-louisiana-sugar-mill 99/115
92
REFERENCES
1. Birkett H. S. (1978). A comparison of raw sugar boiling schemes. J. Amer. Soc. Sugar CaneTechnol. 8, 139-147.
2. Birkett H.S. & Stein J. (1988). 1987 ASI final molasses exhaustion test at jeanerette BatonRouge: Audubon Sugar Institute.
3. Broadfoot R. (2001). Sucrose losses resulting from poor pan stage exhaustion and poor highgrade fugalling performance. Proc. ISSCT, 24, 364-365.
4. Broadfoot R. and Steindl R. J. (1980). Solubility-crystallization characteristics of Queensland molasses. Proc. ISSCT, 17, 2557 – 2580.
5. Chen J. C. P. and Chou C. C. (1993). Cane Sugar Handbook: A Manual for Cane SugarManufacturers and Their Chemists (12th ed.). New York. Wiley.
6. Chou C.C. (2000). Handbook of Sugar Refining: A Manual for the Design and Operation of Sugar Refining Facilities. New York. Wiley.
7. Cilas (2004). Laser diffraction in 5 minutes. Theory: From the diffraction pattern to thedistribution size. From www.particle-size-analyzer.com. March, 2009
8. Davis S. B. and Schoonees B. M. (2006). The effect of some impurities on the target purityformula. Proc. S. Afr. Sugar Technol. Ass. 80, 433-447.
9. Decloux M.(2000). Literature Survey on molasses exhaustion. Proc. SPRI. Porto, Portugal:322-376.
10. Fletcher Smith (2001). FS continuous vacuum pan. From http://www.fletchersmith.com.March, 2009.
11. Fogler H.S. and Gürment M.N. (2005). Elements of Chemical Reaction Engineering (4th ed.).University of Michigan. RTD to Diagnose Faulty Operation, Chapter 13. From Learningresources April, 2008.
12. Honig P. (1959). Principles of Sugar Technology, Crystallization (Vol.2). Amsterdam.Elsevier Publishing Co.
13. Hugot E. (1960). Handbook of Cane Sugar Engineering. Elsevier Science Pub Co.
14. Iberia Sugar Cooperative (2001). The operation of the vertical crystallizer during the 2000crop, January, 2001. From www.iberiasugar.com, December, 2008
15. ICUMSA (2007). ICUMSA methods book. Bartens.
16. Isa (2000). Sugar factory automation strategy – September 15, 2000. ISA - theInstrumentation, Systems, and Automation Society. From www.plantautomation.com.March, 2009.
7/30/2019 Assessment of Target Purity Difference for a Louisiana Sugar Mill
http://slidepdf.com/reader/full/assessment-of-target-purity-difference-for-a-louisiana-sugar-mill 100/115
93
17. Jullienne M.S.A. (1985). South African C-massecuites: Crystal size distribution and its effecton centrifugal losses. Proc. S. Afr. Sugar Technol. Ass. 59, 79-82.
18. Lionet R.E. and Rein P.W. (1980).Pilot plant studies on the exhaustion of the low grademassecuites. Proc. ISSCT. 17, 2328-2350.
19. Love D.J. (2002). Dynamic modeling and optimal control of sugar crystallization in a multi-compartment continuous vacuum pan. PhD Thesis. Univ. Natal.
20. M. A. Patout & Son, Ltd. (2009). “Enterprise Factory”. From http://www.mapatout.com,May, 2009.
21. Meade G.P. and Chen J.C. (1977). Cane Sugar Handbook: A Manual for Cane SugarMaufacturers and Their Chemists (10th ed.). New York. Wiley.
22. Miller K.F. (2001). Sucrose losses in low grade massecuite processing. Proc. ISSCT, 24,366-367.
23. Miller K.F., Ingram G.D. and Murry J.D. (1998). Exhaustion characteristics of australianmolasses. Proc. Aust. Soc. Sugar Cane Technol., 20, 506-513
24. Mullin J. W. and Butterworth-Heinemann (Eds.). (2001). Crystallization (4th ed.). ElsevierScience.
25. Naidoo G., Schoonees B. M., and Schom P. M. (2005). SASTA Laboratory Manualincluding the Official Methods, South African Sugar Technologist Association.
26. Ninela M. & Rajoo N. (2006). Practical steps taken at Tongaat-Hulett sugar factories toachieve low target purity differences. Proc. S. Afr. Sugar Technol. Ass. 80, 448-461.
27. Powers H.E.C. (1959). Sucrose crystal growth. Proc. ISSCT. 10, 242-248.
28. Ravnö A. B. (1985). SASTA Laboratory Manual including the Official Methods, SouthAfrican Sugar Technologist Association.
29. Rein P. W. (1980). A study of continuous low grade crystallizer performance. Proc. ISSCT.17, 2309-2327.
30. Rein P. W. (2007). Cane Sugar Engineering, Berlin. Verlag Dr. A Bartens.
31. Rein P. W. White B. E, Saska M., and Wood D. M. (2002). Assessment of molassesexhaustion in Louisiana mills. Proc. SPRI, 203-218.
32. Rein P.W. and Smith I.A. (1981). Molasses exhaustibility studies based on sugars analysisby gas-liquid chromatography. Proc. S. Afr. Sugar Technol. Ass. 73, 85-91.
33. Rouillard E.E.A. and Smith I.A. (1981). A look at tracer testing in the sugar industry. Proc.S. Afr. Sugar Technol. Ass. 73, 75-78.
7/30/2019 Assessment of Target Purity Difference for a Louisiana Sugar Mill
http://slidepdf.com/reader/full/assessment-of-target-purity-difference-for-a-louisiana-sugar-mill 101/115
94
34. Sahadeo P. (1998). The effect of some impurities on molasses exhaustion. Proc. S. Afr.Sugar Technol. Ass. 72, 285-289.
35. Sahadeo P. and Lionnet RE (1999). An analytical survey of final molasses from fifteen caneproducing countries. Proc. ISSCT, 23, 92-103.
36. Salassi M. E. (2008). Sugarcane production & processing economics. BE4342 Sugar ProcessEngineering. 2008 Spring Intersession. LSU Agricultural Center, Baton Rouge, LA.
37. Saska M. (1990). Optimization of low-grade crystallizer performance. International SugarJournal, 92, 23-28.
38. Saska M. (2007). Boiling point elevation of technical sugarcane solutions and its use inautomatic pan boiling. International Sugar Journal 104 (1247):500-507, 2007.
39. Saska M. Goudeau S., and Andrews L. (1999). Molasses exhaustion and target purityformulas. Sugar Journal 62, 7, 20-24.
40. Sheftal N.N. and Gavrilova I.V. (1959). Relationship between the conditions of crystallization. Structure and shape of crystals. Proc. ISSCT. 10, 282-286.
41. Siemens AG (2004). NAHMAT Pan Control. Decentralized automation for the sugarcrystallization process. From http://www.automation.siemens.com. March, 2009.
42. SMRI (2009). Nutsch Filter. David Bailey at Sugarequip (Pty) Ltd.. Fromhttp://www.smri.org. March, 2009.
43. Smythe B.M. (1959). Measurements of crystallization rates of sucrose from pure and impuresolutions. Proc. ISSCT. 10, 323-336.
44. Smythe B.M. (1967) Sucrose crystal growth. Rate of crystal growth in the presence of impurities. Aust.J.Chem.., 20, 1097-1114.
45. Stephen H. and Mir A. (2007). Sugar Backgrounder. July 2007. A report from theeconomic research service. USDA. From www.ers.usda.gov. May, 2009.
46. Thelwall J.C. (2002). A comparison of boiling techniques for batch and continuous pans.Paper # 817. Proc. ISSCT, 22, 61, 65-78.
47. Vaccari G., Tamburini E., Tosi S., Sgualdino G. and Bernardi T. (2003). In-line control and
automatic management of industrial crystallizations using NIR technique. Chem. EngTechnol., 26, 273-276.
48. van der Poel P. W., Schiweck H., and Schwartz T. (1998). Sugar Technology. Beet and CaneSugar Manufacture. Berlin. Verlag Dr. A Bartens.
49. Vercellotti J.R., Clarke M.A., and Edye L.A. (1996). Components of molasses: I. Sugarcanemolasses: Factory and seasonal variables. SPRI. 321-349.

7/30/2019 Assessment of Target Purity Difference for a Louisiana Sugar Mill
http://slidepdf.com/reader/full/assessment-of-target-purity-difference-for-a-louisiana-sugar-mill 102/115
95
50. Wikipedia.The Free Encyclopedia (2009). Crystallization. From http://en.wikipedia.org.March, 2009
51. Wright P.G. (1996). The modeling of crystallization schemes in a raw sugar factory. Proc.Aust. Soc. Sugar Cane Technol. 18, 324-333.
52. Wright P.G. and White E.T. (1974). A mathematical model of vacuum pan crystallization.Proc. ISSCT, 36, 299-309.
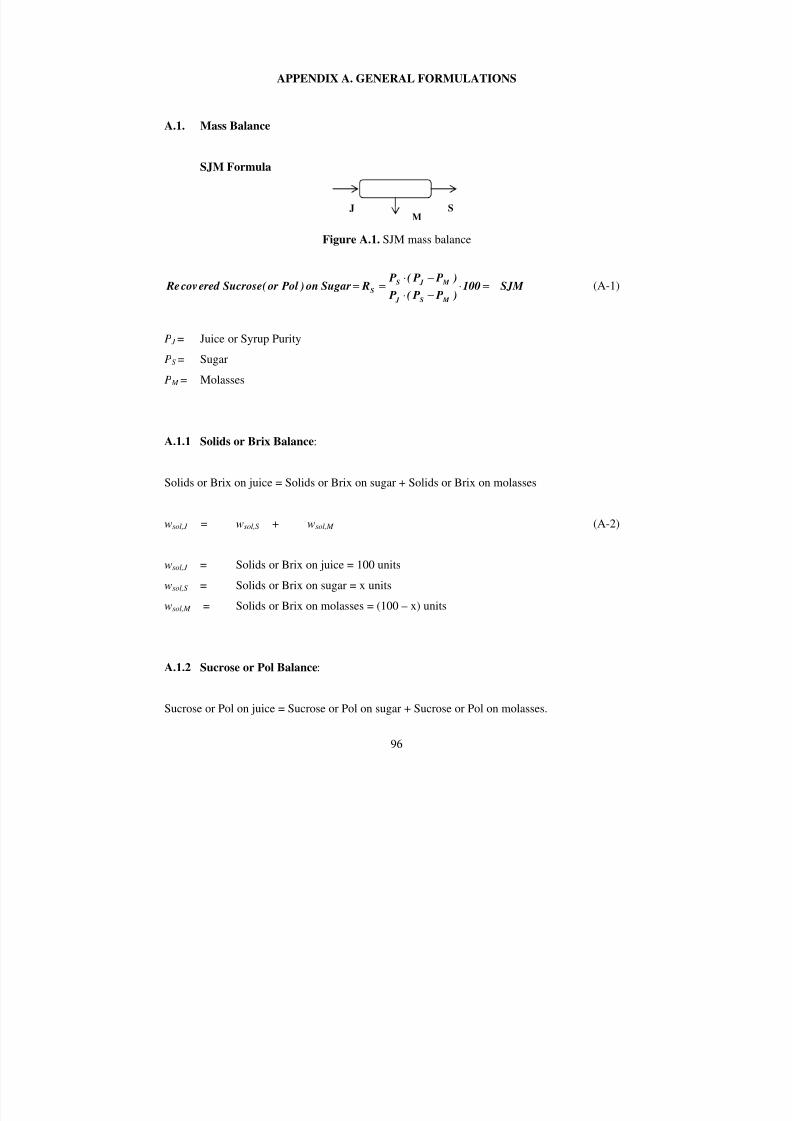
7/30/2019 Assessment of Target Purity Difference for a Louisiana Sugar Mill
http://slidepdf.com/reader/full/assessment-of-target-purity-difference-for-a-louisiana-sugar-mill 103/115
96
APPENDIX A. GENERAL FORMULATIONS
A.1. Mass Balance
SJM Formula
Figure A.1. SJM mass balance
SJM 100 ) P P( P
) P P( P RSugar on ) Pol or( Sucroseered cov Re
M S J
M J S
S =⋅−⋅
−⋅== (A-1)
P J = Juice or Syrup Purity
PS = Sugar
P M = Molasses
A.1.1 Solids or Brix Balance:
Solids or Brix on juice = Solids or Brix on sugar + Solids or Brix on molasses
wsol,J = wsol,S + wsol,M (A-2)
wsol,J = Solids or Brix on juice = 100 units
wsol,S = Solids or Brix on sugar = x units
wsol,M = Solids or Brix on molasses = (100 – x) units
A.1.2 Sucrose or Pol Balance:
Sucrose or Pol on juice = Sucrose or Pol on sugar + Sucrose or Pol on molasses.
JM
S
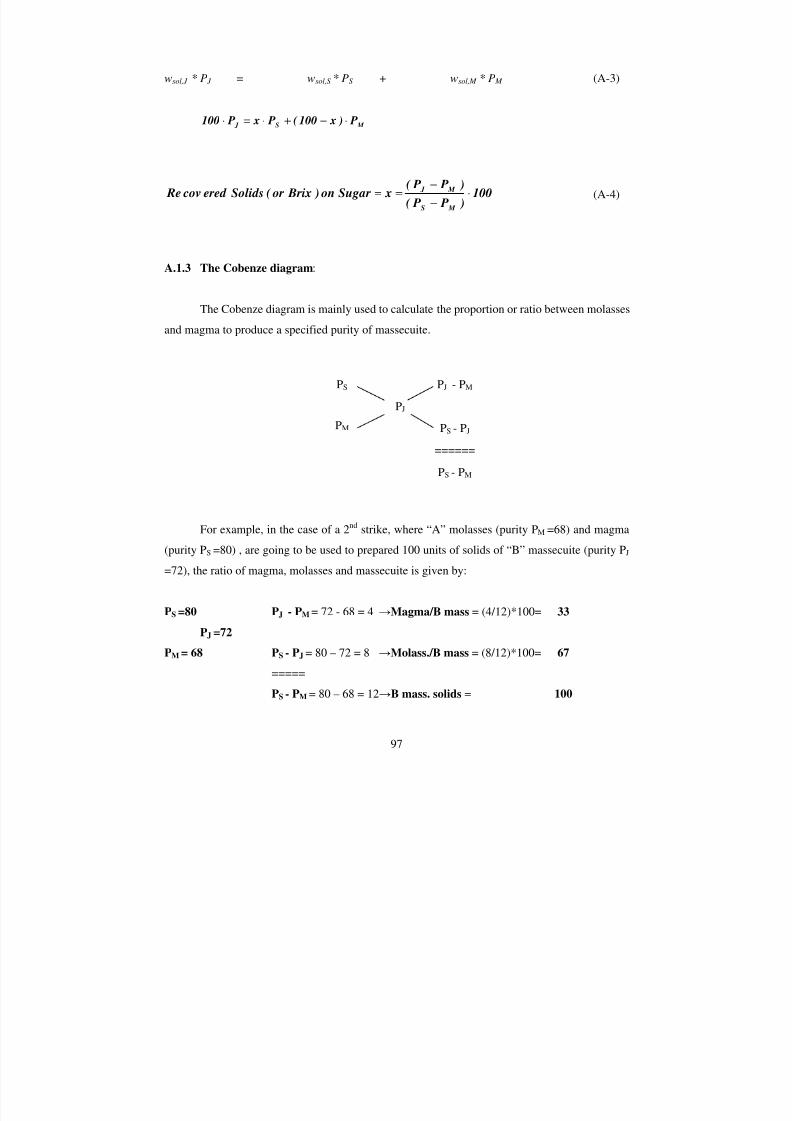
7/30/2019 Assessment of Target Purity Difference for a Louisiana Sugar Mill
http://slidepdf.com/reader/full/assessment-of-target-purity-difference-for-a-louisiana-sugar-mill 104/115
97
wsol,J * P J = wsol,S * PS + wsol,M * P M (A-3)
M S J P ) x100( P x P100 ⋅−+⋅=⋅
100 ) P P(
) P P( xSugar on ) Brix or( Solidsered cov Re
M S
M J ⋅−
−== (A-4)
A.1.3 The Cobenze diagram:
The Cobenze diagram is mainly used to calculate the proportion or ratio between molasses
and magma to produce a specified purity of massecuite.
PS PJ - PM
PJ
PM PS - PJ
======PS - PM
For example, in the case of a 2nd strike, where “A” molasses (purity PM =68) and magma
(purity PS =80) , are going to be used to prepared 100 units of solids of “B” massecuite (purity P J
=72), the ratio of magma, molasses and massecuite is given by:
PS =80 PJ - PM = 72 - 68 = 4 →Magma/B mass = (4/12)*100= 33
PJ =72
PM = 68 PS - PJ = 80 – 72 = 8 →Molass./B mass = (8/12)*100= 67
=====
PS - PM = 80 – 68 = 12→B mass. solids = 100
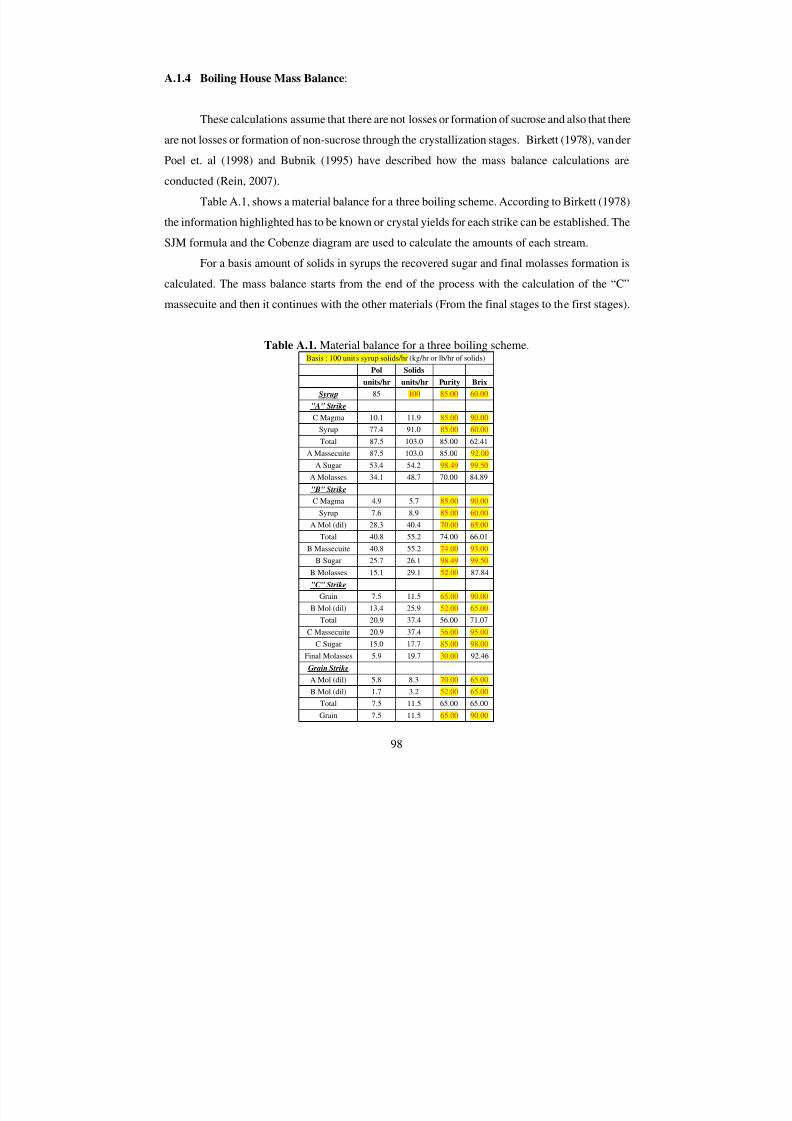
7/30/2019 Assessment of Target Purity Difference for a Louisiana Sugar Mill
http://slidepdf.com/reader/full/assessment-of-target-purity-difference-for-a-louisiana-sugar-mill 105/115
98
A.1.4 Boiling House Mass Balance:
These calculations assume that there are not losses or formation of sucrose and also that there
are not losses or formation of non-sucrose through the crystallization stages. Birkett (1978), van der
Poel et. al (1998) and Bubnik (1995) have described how the mass balance calculations are
conducted (Rein, 2007).
Table A.1, shows a material balance for a three boiling scheme. According to Birkett (1978)
the information highlighted has to be known or crystal yields for each strike can be established. The
SJM formula and the Cobenze diagram are used to calculate the amounts of each stream.
For a basis amount of solids in syrups the recovered sugar and final molasses formation is
calculated. The mass balance starts from the end of the process with the calculation of the “C”
massecuite and then it continues with the other materials (From the final stages to the first stages).
Table A.1. Material balance for a three boiling scheme. Basis : 100 units syrup solids/hr (kg/hr or lb/hr of solids)
Pol Solids
units/hr units/hr Purity Brix
Syrup 85 100 85.00 60.00
"A" Strike
C Magma 10.1 11.9 85.00 90.00
Syrup 77.4 91.0 85.00 60.00
Total 87.5 103.0 85.00 62.41
A Massecuite 87.5 103.0 85.00 92.00A Sugar 53.4 54.2 98.49 99.50
A Molasses 34.1 48.7 70.00 84.89
"B" Strike
C Magma 4.9 5.7 85.00 90.00
Syrup 7.6 8.9 85.00 60.00
A Mol (dil) 28.3 40.4 70.00 65.00
Total 40.8 55.2 74.00 66.01
B Massecuite 40.8 55.2 74.00 93.00
B Sugar 25.7 26.1 98.49 99.50
B Molasses 15.1 29.1 52.00 87.84
"C" Strike
Grain 7.5 11.5 65.00 90.00
B Mol (dil) 13.4 25.9 52.00 65.00
Total 20.9 37.4 56.00 71.07
C Massecuite 20.9 37.4 56.00 95.00
C Sugar 15.0 17.7 85.00 98.00
Final Molasses 5.9 19.7 30.00 92.46
Grain Strike
A Mol (dil) 5.8 8.3 70.00 65.00
B Mol (dil) 1.7 3.2 52.00 65.00
Total 7.5 11.5 65.00 65.00
Grain 7.5 11.5 65.00 90.00
7/30/2019 Assessment of Target Purity Difference for a Louisiana Sugar Mill
http://slidepdf.com/reader/full/assessment-of-target-purity-difference-for-a-louisiana-sugar-mill 106/115
99
A.2. Boiling House Performance
Crystal Content: It is a limiting factor since a massecuite with very high crystal content become
at solid; therefore, the crystallization is conducted to the point where the crystal content gives the
maximum allowable viscosity to guarantee flow ability (Rein, 2007).
Crystal content % massecuite = 100 ) P100(
) P P( ww
Mol
Mol Ma Ma , DS
Ma ,Cr ⋅−
−⋅= (A-5)
Crystal content % solids (or Brix) = 100 ) P100(
) P P( w
Mol
Mol Ma DS ,Cr ⋅
−
−= (A-6)
In South Africa, the goal crystal content % solids for A and B strikes is estimated with
the following equation (Rein, 2007).
Crystal content % solids (A & B strikes) = 10 P78 .0w Ma DS ,Cr −⋅= (A-7)
Exhaustion: It expresses how much of the sucrose in the massecuite become crystal with 100%
purity (Rein, 2007).
Exhaustion = 100 ) P100( P
) P P(
Mol Ma
Mol Ma ⋅−⋅
−(A-8)
High exhaustion (high crystal content) in the “A” strikes is one of the most important
goals to achieve in the boiling house since it reduces massecuite quantities (increases pan and
crystallizers capacity) and reduces recirculation avoiding also sucrose losses due to degradation.
Again in South Africa the goal exhaustion for “A” massecuite is estimated by the following
equation (Rein, 2007).
Exhaustion (A massecuite goal) = Ma P775 .0 ⋅ (A-9)
7/30/2019 Assessment of Target Purity Difference for a Louisiana Sugar Mill
http://slidepdf.com/reader/full/assessment-of-target-purity-difference-for-a-louisiana-sugar-mill 107/115
100
Purity Drop: The purity drop for massecuites has been used as a rapid and easy way to evaluate
how well exhausted is the massecuite.
Purity Drop = Mol Ma P P PD −= (A-10)
A.3. Goals for the Low Grade Station
Goal – Final Molasses Apparent Purity ( P App,fm,Goal ): Determined from Target Purity and
Pol/Sucrose ratio.
Purityet argT Sucrose
Pol P Goal , fm , App ⋅
= (A-11)
Goal – Nutsch Pan Apparent Purity ( P App,NP,Goal ): Calculated from the P App,fm,Goal and the nutsch
molasses purity drop from pan to centrifuges
) P P( P P fm , App NPGoal . fm . AppGoal , NP , App −+= (A-12)
Goal – C Massecuite Apparent Purity ( P App,CM,Goal ): Calculated from the P App,NP,Goal and a target
crystal content of 28 % for C-massecuite leaving the pan.
Goal , NP , AppGoal ,CM , App P72 .0 28 P ⋅+= (A-13)
A.4. Molasses Survey Equations:
True solids (TS): The Total of solids concentration (dry substance) in final molasses is determined
applying a statistical model developed at Audubon Sugar Institute.
7/30/2019 Assessment of Target Purity Difference for a Louisiana Sugar Mill
http://slidepdf.com/reader/full/assessment-of-target-purity-difference-for-a-louisiana-sugar-mill 108/115
101
True Solids = )Gluc Fruct( 0347 .0 Ash .Cond 1461 .0 Brix 9519 .0 5345 .0w DS +⋅+⋅+⋅+= (A-14)
Pol/Sucrose ratio: The pol/sucrose ratio expresses how closed the pol reading is to the actual
sucrose concentration (True Sucrose).
True Purity and Apparent Purity: Expresses how much sucrose (Pol) is contained in the total
dissolved solids (Brix or RDS).
100SolidsTrue
SucroseTrue P PurityTrue True ⋅== (A-15)
100 Brix
Pol P Purity Apparent App ⋅== (A-16)
Target Purity: It is the minimum final molasses purity (equilibrium purity -saturation) that can be
obtained a laboratory level, taking into account a workable maximum molasses consistency of 300
Pa-s at 40 °C (Rein, 2007).
+
⋅−== Ash
FG
log 4 .13 9 . 33 P Purityet argT et argT (A-17)
G + F = RS = Glucose plus Fructose concentration by HPLC
Ash= A = Conductivity Ash
Target Purity Difference (TPD): Difference between True Purity and Target purity.
Purityet argT PurityTrueTPD −−−−==== (A-18)
A.5. Solubility and Supersaturation Equations:
Charles (1960) equation to represent the solubility of sucrose for a range of temperatures
from 0 to 90 °C in pure sucrose solution is: (Rein, 2007)
7/30/2019 Assessment of Target Purity Difference for a Louisiana Sugar Mill
http://slidepdf.com/reader/full/assessment-of-target-purity-difference-for-a-louisiana-sugar-mill 109/115
102
C e temperatur: t
t at saturation at solution g100 / sucrose g:w
t*10*035 . 9 t*002057 .0 t*07251 .0 397 .64w
o
Sat ,S
36 2Sat ,S
−−++=
(A-19)
solution pureinSaturation atwater g / sucrose gq
w100
w
w
wq tCoefficienSaturation
p ,Sat
Sat ,S
Sat ,S
p ,SatW
S p ,Sat
=
−=
==
(A-20)
The Solubility Coefficient (SC) to express the ratio of sucrose concentration at saturation
between the impure and the pure sucrose solutions is calculated by:
solutionimpureinSaturation atwater g / sucrose gq
q
qSC tCoefficienilitylubSo
i ,Sat
p ,Sat
i ,Sat
=
==(A-21)
Lionnet and Rein (1980) give the following correlation (r2=0.85):
ratio Ash / Sugars ducing Re A
RS
ratiowater / sucrose nonW
NS A
RS 346 .0
W
NS182 .0742 .0
q
qSC
p ,Sat
i ,Sat
=
−=
⋅−⋅+==
(A-22)
Supersaturation Coefficient (y) is the degree of supersaturation obtained at determined
conditions of temperature and purity and is determined by the ratio of the sucrose/water ratio at
supersaturation and the sucrose/water ratio at saturation.
Sat
Supersat
q
q y tCoefficien ationSupersatur == (A-23)
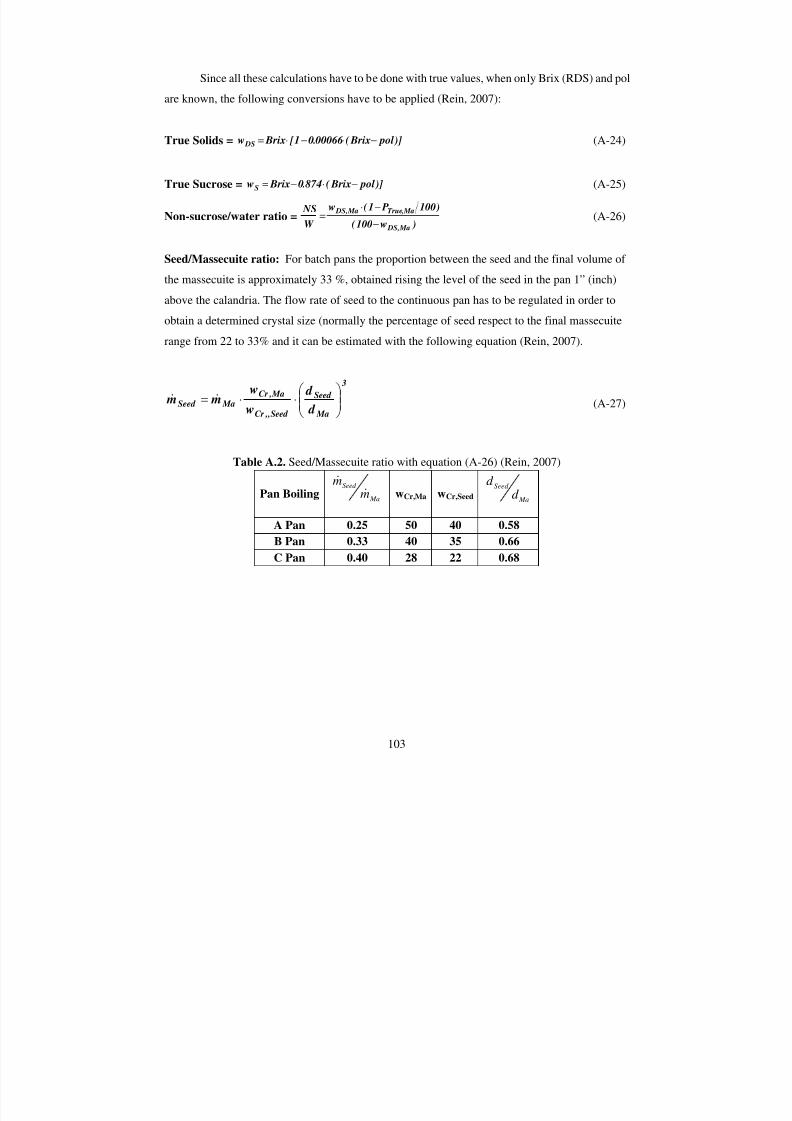
7/30/2019 Assessment of Target Purity Difference for a Louisiana Sugar Mill
http://slidepdf.com/reader/full/assessment-of-target-purity-difference-for-a-louisiana-sugar-mill 110/115
103
Since all these calculations have to be done with true values, when only Brix (RDS) and pol
are known, the following conversions have to be applied (Rein, 2007):
True Solids = )] pol Brix( 00066 .01 [ Brixw DS −⋅−⋅= (A-24)
True Sucrose = )] pol Brix( 874 .0 BrixwS −⋅−= (A-25)
Non-sucrose/water ratio = )w100(
)100 P1( w
W
NS
Ma , DS
Ma ,True Ma , DS
−
−⋅= (A-26)
Seed/Massecuite ratio: For batch pans the proportion between the seed and the final volume of
the massecuite is approximately 33 %, obtained rising the level of the seed in the pan 1” (inch)
above the calandria. The flow rate of seed to the continuous pan has to be regulated in order toobtain a determined crystal size (normally the percentage of seed respect to the final massecuite
range from 22 to 33% and it can be estimated with the following equation (Rein, 2007).
3
Ma
Seed
Seed , ,Cr
Ma ,Cr MaSeed
d
d
w
w m m
⋅⋅= && (A-27)
Table A.2. Seed/Massecuite ratio with equation (A-26) (Rein, 2007)
Pan Boiling Ma
Seed
mm
&
&
wCr,Ma wCr,Seed Ma
Seed
d d
A Pan 0.25 50 40 0.58
B Pan 0.33 40 35 0.66
C Pan 0.40 28 22 0.68
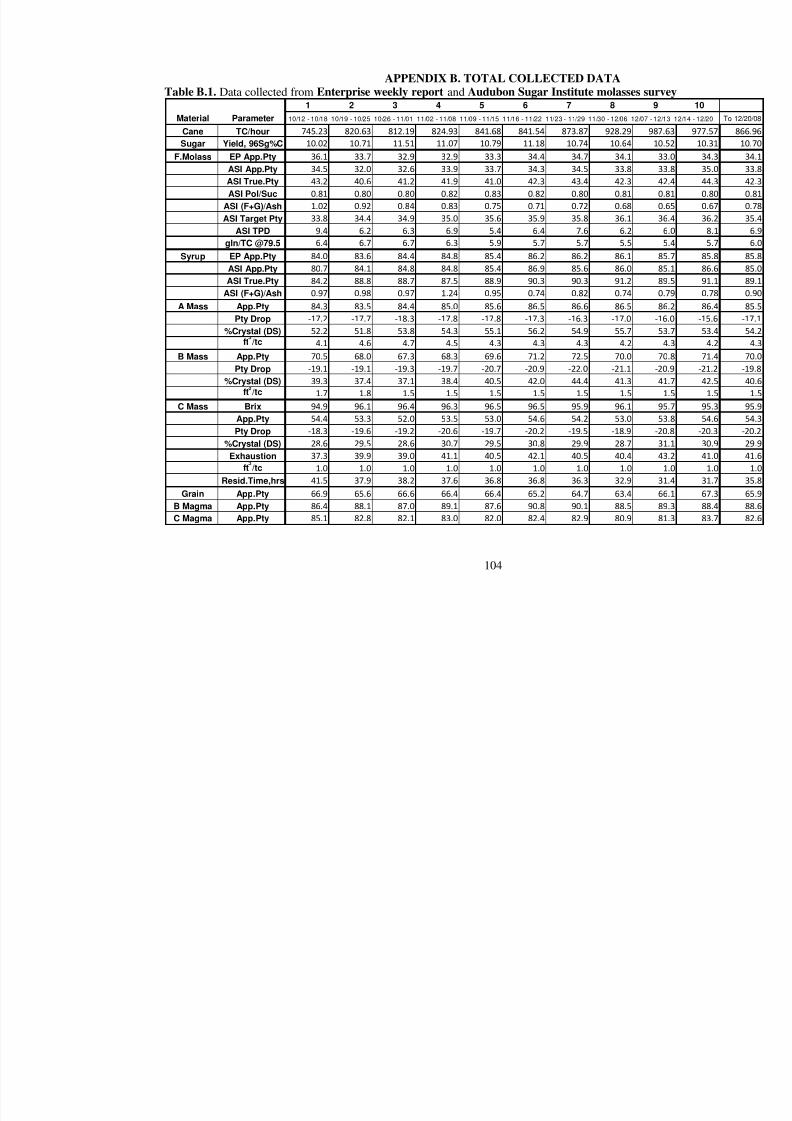
7/30/2019 Assessment of Target Purity Difference for a Louisiana Sugar Mill
http://slidepdf.com/reader/full/assessment-of-target-purity-difference-for-a-louisiana-sugar-mill 111/115
104
APPENDIX B. TOTAL COLLECTED DATA Table B.1. Data collected from Enterprise weekly report and Audubon Sugar Institute molasses surv
1 2 3 4 5 6 7 8 9
Material Parameter 10/12 - 10/18 10/19 - 10/25 10/26 - 11/01 11/02 - 11/08 11/09 - 11/15 11/16 - 11/22 11/23 - 11/29 11/30 - 12/06 12/07 - 1
Cane TC/hour 745.23 820.63 812.19 824.93 841.68 841.54 873.87 928.29 987
Sugar Yield, 96Sg%C 10.02 10.71 11.51 11.07 10.79 11.18 10.74 10.64 10
F.Molass EP App.Pty 36.1 33.7 32.9 32.9 33.3 34.4 34.7 34.1 3
ASI App.Pty 34.5 32.0 32.6 33.9 33.7 34.3 34.5 33.8 3
ASI True.Pty 43.2 40.6 41.2 41.9 41.0 42.3 43.4 42.3 4
ASI Pol/Suc 0.81 0.80 0.80 0.82 0.83 0.82 0.80 0.81 0
ASI (F+G)/Ash 1.02 0.92 0.84 0.83 0.75 0.71 0.72 0.68 0
ASI Target Pty 33.8 34.4 34.9 35.0 35.6 35.9 35.8 36.1 3
ASI TPD 9.4 6.2 6.3 6.9 5.4 6.4 7.6 6.2
gln/TC @79.5 6.4 6.7 6.7 6.3 5.9 5.7 5.7 5.5
Syrup EP App.Pty 84.0 83.6 84.4 84.8 85.4 86.2 86.2 86.1 8
ASI App.Pty 80.7 84.1 84.8 84.8 85.4 86.9 85.6 86.0 8
ASI True.Pty 84.2 88.8 88.7 87.5 88.9 90.3 90.3 91.2 8
ASI (F+G)/Ash 0.97 0.98 0.97 1.24 0.95 0.74 0.82 0.74 0
A Mass App.Pty 84.3 83.5 84.4 85.0 85.6 86.5 86.6 86.5 8
Pty Drop -17.2 -17.7 -18.3 -17.8 -17.8 -17.3 -16.3 -17.0 -1
%Crystal (DS) 52.2 51.8 53.8 54.3 55.1 56.2 54.9 55.7 5
ft /tc 4.1 4.6 4.7 4.5 4.3 4.3 4.3 4.2
B Mass App.Pty 70.5 68.0 67.3 68.3 69.6 71.2 72.5 70.0 7
Pty Drop -19.1 -19.1 -19.3 -19.7 -20.7 -20.9 -22.0 -21.1 -2
%Crystal (DS) 39.3 37.4 37.1 38.4 40.5 42.0 44.4 41.3 4
ft /tc 1.7 1.8 1.5 1.5 1.5 1.5 1.5 1.5
C Mass Brix 94.9 96.1 96.4 96.3 96.5 96.5 95.9 96.1 9
App.Pty 54.4 53.3 52.0 53.5 53.0 54.6 54.2 53.0 5
Pty Drop -18.3 -19.6 -19.2 -20.6 -19.7 -20.2 -19.5 -18.9 -2
%Crystal (DS) 28.6 29.5 28.6 30.7 29.5 30.8 29.9 28.7 3
Exhaustion 37.3 39.9 39.0 41.1 40.5 42.1 40.5 40.4 4
ft /tc 1.0 1.0 1.0 1.0 1.0 1.0 1.0 1.0
Resid.Time,hrs 41.5 37.9 38.2 37.6 36.8 36.8 36.3 32.9 3
Grain App.Pty 66.9 65.6 66.6 66.4 66.4 65.2 64.7 63.4 6
B Magma App.Pty 86.4 88.1 87.0 89.1 87.6 90.8 90.1 88.5 8
C Magma App.Pty 85.1 82.8 82.1 83.0 82.0 82.4 82.9 80.9 8
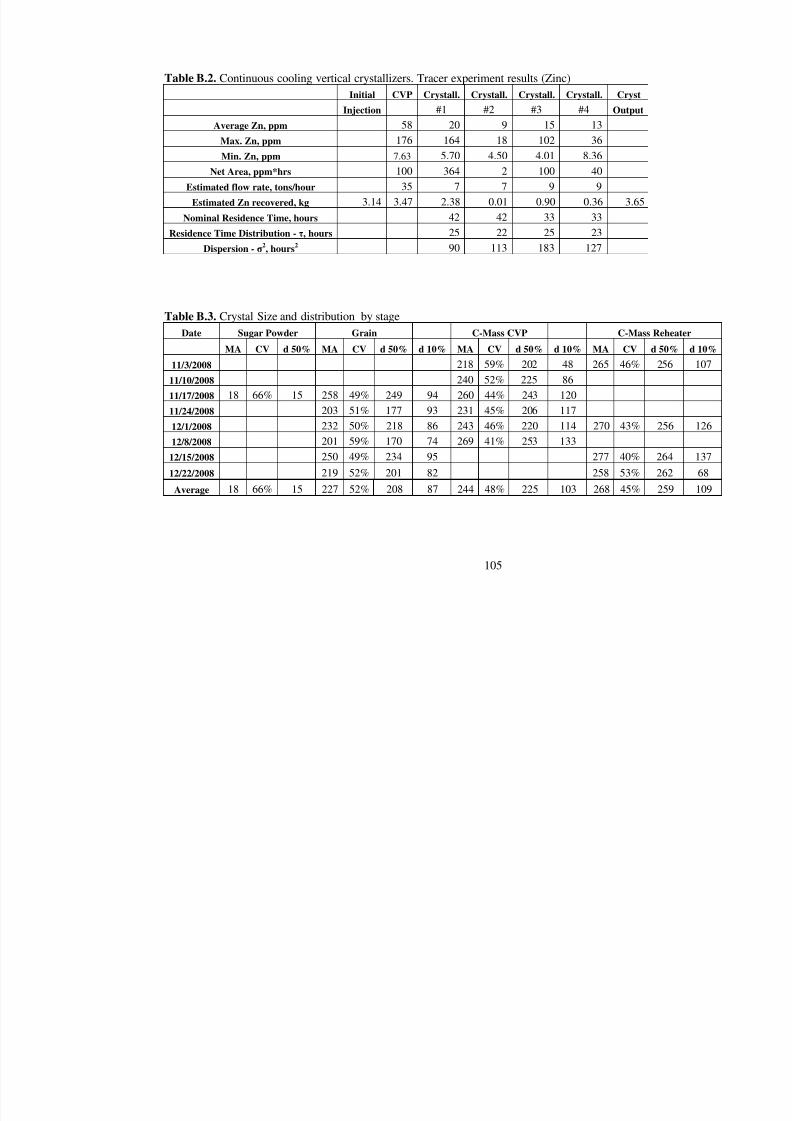
7/30/2019 Assessment of Target Purity Difference for a Louisiana Sugar Mill
http://slidepdf.com/reader/full/assessment-of-target-purity-difference-for-a-louisiana-sugar-mill 112/115
105
Table B.2. Continuous cooling vertical crystallizers. Tracer experiment results (Zinc)
Initial CVP Crystall. Crystall. Crystall. Crystall. Cryst
Injection #1 #2 #3 #4 Output
Average Zn, ppm 58 20 9 15 13
Max. Zn, ppm 176 164 18 102 36
Min. Zn, ppm 7.63 5.70 4.50 4.01 8.36
Net Area, ppm*hrs 100 364 2 100 40
Estimated flow rate, tons/hour 35 7 7 9 9
Estimated Zn recovered, kg 3.14 3.47 2.38 0.01 0.90 0.36 3.65
Nominal Residence Time, hours 42 42 33 33
Residence Time Distribution - τ, hours 25 22 25 23
Dispersion - σ2, hours
2 90 113 183 127
Table B.3. Crystal Size and distribution by stage
Date Sugar Powder Grain C-Mass CVP C-Mass Re
MA CV d 50% MA CV d 50% d 10% MA CV d 50% d 10% MA CV d 5
11/3/2008 218 59% 202 48 265 46% 2
11/10/2008 240 52% 225 86
11/17/2008 18 66% 15 258 49% 249 94 260 44% 243 120
11/24/2008 203 51% 177 93 231 45% 206 117
12/1/2008 232 50% 218 86 243 46% 220 114 270 43% 2
12/8/2008 201 59% 170 74 269 41% 253 133
12/15/2008 250 49% 234 95 277 40% 2
12/22/2008 219 52% 201 82 258 53% 2
Average 18 66% 15 227 52% 208 87 244 48% 225 103 268 45% 2
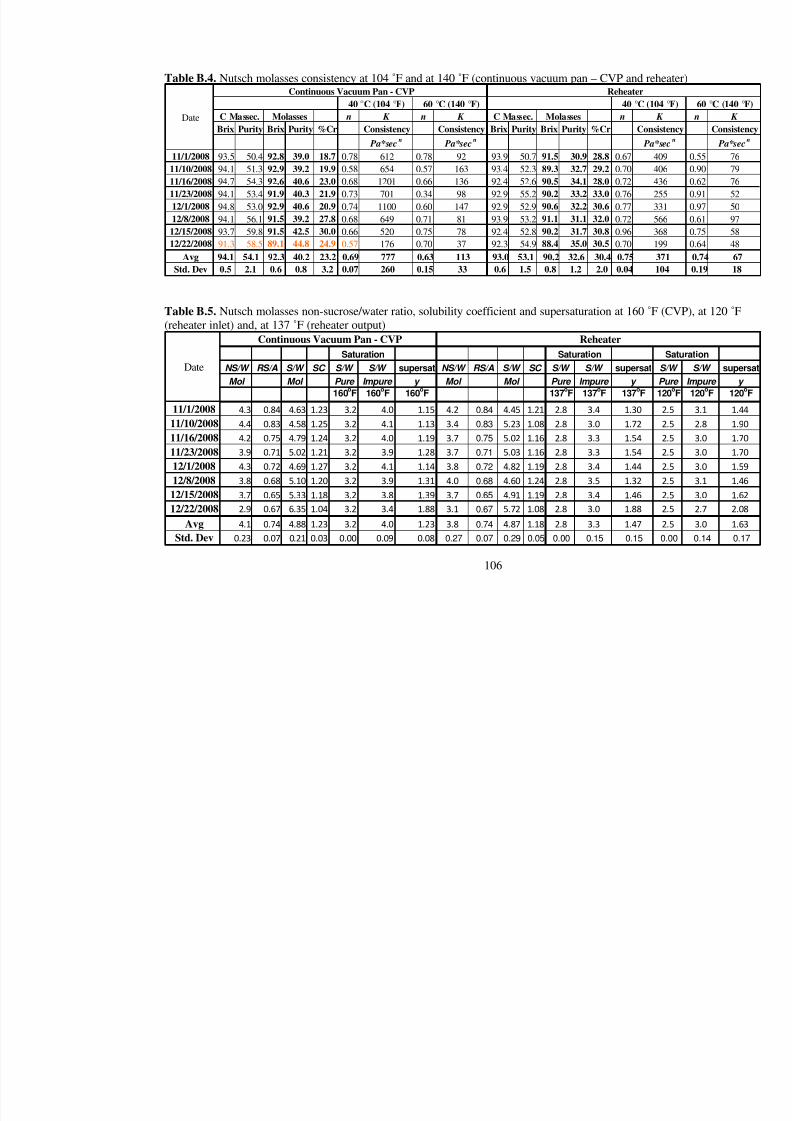
7/30/2019 Assessment of Target Purity Difference for a Louisiana Sugar Mill
http://slidepdf.com/reader/full/assessment-of-target-purity-difference-for-a-louisiana-sugar-mill 113/115
106
Table B.4. Nutsch molasses consistency at 104 ˚F and at 140 ˚F (continuous vacuum pan – CVP and reh
Table B.5. Nutsch molasses non-sucrose/water ratio, solubility coefficient and supersaturation at 160 ˚F (reheater inlet) and, at 137 ˚F (reheater output)
n K n K n K
Brix Purity Brix Purity %Cr Consistency Consistency Brix Purity Brix Purity %Cr Consis
Pa*sec n
Pa*sec n
Pa*s
11/1/2008 93.5 50.4 92.8 39.0 18.7 0.78 612 0.78 92 93.9 50.7 91.5 30.9 28.8 0.67 40
11/10/2008 94.1 51.3 92.9 39.2 19.9 0.58 654 0.57 163 93.4 52.3 89.3 32.7 29.2 0.70 40
11/16/2008 94.7 54.3 92.6 40.6 23.0 0.68 1201 0.66 136 92.4 52.6 90.5 34.1 28.0 0.72 43
11/23/2008 94.1 53.4 91.9 40.3 21.9 0.73 701 0.34 98 92.9 55.2 90.2 33.2 33.0 0.76 25
12/1/2008 94.8 53.0 92.9 40.6 20.9 0.74 1100 0.60 147 92.9 52.9 90.6 32.2 30.6 0.77 33
12/8/2008 94.1 56.1 91.5 39.2 27.8 0.68 649 0.71 81 93.9 53.2 91.1 31.1 32.0 0.72 56
12/15/2008 93.7 59.8 91.5 42.5 30.0 0.66 520 0.75 78 92.4 52.8 90.2 31.7 30.8 0.96 36
12/22/2008 91.3 58.5 89.1 44.8 24.9 0.57 176 0.70 37 92.3 54.9 88.4 35.0 30.5 0.70 19
Avg 94.1 54.1 92.3 40.2 23.2 0.69 777 0.63 113 93.0 53.1 90.2 32.6 30.4 0.75 37
Std. Dev 0.5 2.1 0.6 0.8 3.2 0.07 260 0.15 33 0.6 1.5 0.8 1.2 2.0 0.04 10
Reheater
40 °C (104
C Massec. Molasses
Continuous Vacuum Pan - CVP
Date C Massec. Molasses
40 °C (104 °F) 60 °C (140 °F)
NS/W RS/A S/W SC S/W S/W supersat NS/W RS/A S/W SC S/W S/W supersat S
Mol Mol Pure Impure y Mol Mol Pure Impure y P
160oF 160
oF 160
oF 137
oF 137
oF 137
oF 1
11/1/2008 4.3 0.84 4.63 1.23 3.2 4.0 1.15 4.2 0.84 4.45 1.21 2.8 3.4 1.30
11/10/2008 4.4 0.83 4.58 1.25 3.2 4.1 1.13 3.4 0.83 5.23 1.08 2.8 3.0 1.72
11/16/2008 4.2 0.75 4.79 1.24 3.2 4.0 1.19 3.7 0.75 5.02 1.16 2.8 3.3 1.54
11/23/2008 3.9 0.71 5.02 1.21 3.2 3.9 1.28 3.7 0.71 5.03 1.16 2.8 3.3 1.54 12/1/2008 4.3 0.72 4.69 1.27 3.2 4.1 1.14 3.8 0.72 4.82 1.19 2.8 3.4 1.44
12/8/2008 3.8 0.68 5.10 1.20 3.2 3.9 1.31 4.0 0.68 4.60 1.24 2.8 3.5 1.32
12/15/2008 3.7 0.65 5.33 1.18 3.2 3.8 1.39 3.7 0.65 4.91 1.19 2.8 3.4 1.46
12/22/2008 2.9 0.67 6.35 1.04 3.2 3.4 1.88 3.1 0.67 5.72 1.08 2.8 3.0 1.88
Avg 4.1 0.74 4.88 1.23 3.2 4.0 1.23 3.8 0.74 4.87 1.18 2.8 3.3 1.47
Std. Dev 0.23 0.07 0.21 0.03 0.00 0.09 0.08 0.27 0.07 0.29 0.05 0.00 0.15 0.15 0
Saturation
Continuous Vacuum Pan - CVP
Saturation
Reheater
Date
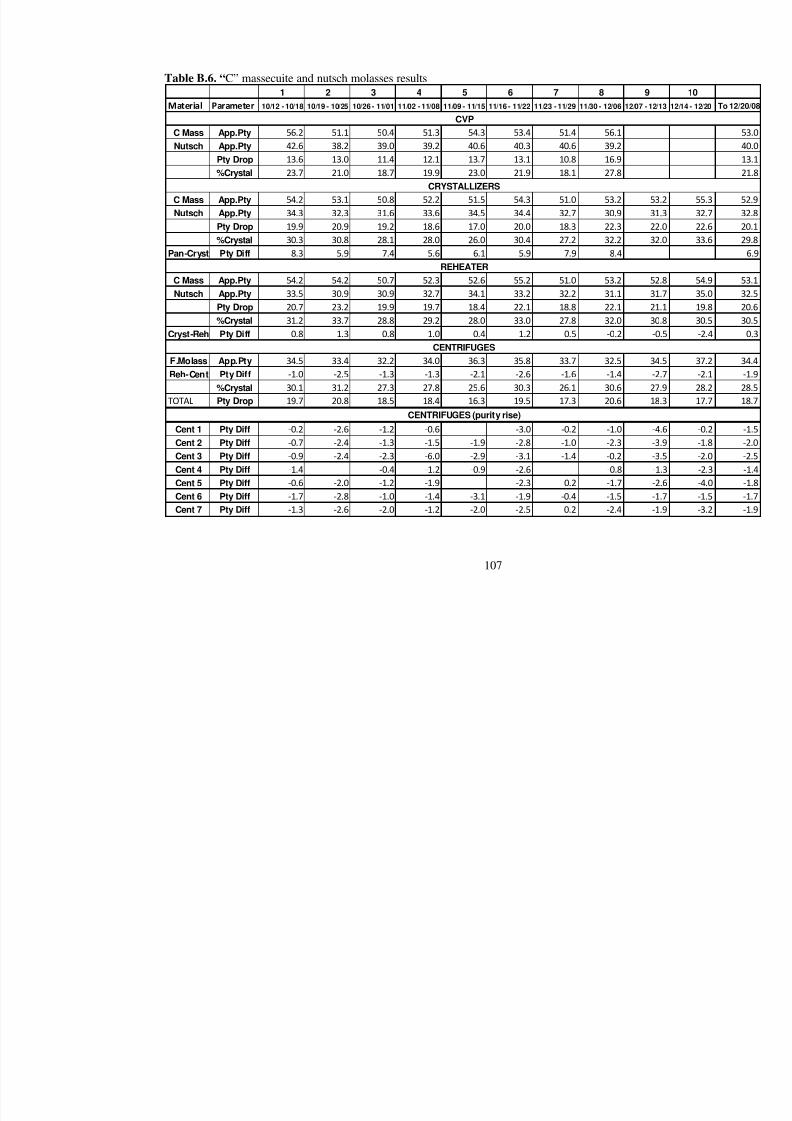
7/30/2019 Assessment of Target Purity Difference for a Louisiana Sugar Mill
http://slidepdf.com/reader/full/assessment-of-target-purity-difference-for-a-louisiana-sugar-mill 114/115
107
Table B.6. “C” massecuite and nutsch molasses results
1 2 3 4 5 6 7 8 9
Material Parameter 10/12 - 10/18 10/19 - 10/25 10/26 - 11/01 11/02 - 11/08 11/09 - 11/15 11/16 - 11/22 11/23 - 11/29 11/30 - 12/06 12/07 - 12/1
C Mass App.Pty 56.2 51.1 50.4 51.3 54.3 53.4 51.4 56.1
Nutsch App.Pty42.6 38.2 39.0 39.2 40.6 40.3 40.6 39.2
Pty Drop 13.6 13.0 11.4 12.1 13.7 13.1 10.8 16.9
%Crystal 23.7 21.0 18.7 19.9 23.0 21.9 18.1 27.8
C Mass App.Pty 54.2 53.1 50.8 52.2 51.5 54.3 51.0 53.2 53
Nutsch App.Pty 34.3 32.3 31.6 33.6 34.5 34.4 32.7 30.9 31
Pty Drop 19.9 20.9 19.2 18.6 17.0 20.0 18.3 22.3 22
%Crystal 30.3 30.8 28.1 28.0 26.0 30.4 27.2 32.2 32
Pan-Cryst Pty Diff 8.3 5.9 7.4 5.6 6.1 5.9 7.9 8.4
C Mass App.Pty 54.2 54.2 50.7 52.3 52.6 55.2 51.0 53.2 52
Nutsch App.Pty 33.5 30.9 30.9 32.7 34.1 33.2 32.2 31.1 31
Pty Drop 20.7 23.2 19.9 19.7 18.4 22.1 18.8 22.1 21
%Crystal 31.2 33.7 28.8 29.2 28.0 33.0 27.8 32.0 30
Cryst-Reh Pty Diff 0.8 1.3 0.8 1.0 0.4 1.2 0.5 -0.2 -0
F.Molass App.Pty 34.5 33.4 32.2 34.0 36.3 35.8 33.7 32.5 34
Reh-Cent Pty Diff -1.0 -2.5 -1.3 -1.3 -2.1 -2.6 -1.6 -1.4 -2
%Crystal 30.1 31.2 27.3 27.8 25.6 30.3 26.1 30.6 27
TOTAL Pty Drop 19.7 20.8 18.5 18.4 16.3 19.5 17.3 20.6 18
Cent 1 Pty Diff -0.2 -2.6 -1.2 -0.6 -3.0 -0.2 -1.0 -4
Cent 2 Pty Diff -0.7 -2.4 -1.3 -1.5 -1.9 -2.8 -1.0 -2.3 -3
Cent 3 Pty Diff -0.9 -2.4 -2.3 -6.0 -2.9 -3.1 -1.4 -0.2 -3
Cent 4 Pty Diff -1.4 -0.4 -1.2 -0.9 -2.6 -0.8 -1
Cent 5 Pty Diff -0.6 -2.0 -1.2 -1.9 -2.3 0.2 -1.7 -2
Cent 6 Pty Diff -1.7 -2.8 -1.0 -1.4 -3.1 -1.9 -0.4 -1.5 -1
Cent 7 Pty Diff -1.3 -2.6 -2.0 -1.2 -2.0 -2.5 0.2 -2.4 -1
CENTRIFUGES (purity rise)
CVP
CRYSTALLIZERS
REHEATER
CENTRIFUGES

7/30/2019 Assessment of Target Purity Difference for a Louisiana Sugar Mill
http://slidepdf.com/reader/full/assessment-of-target-purity-difference-for-a-louisiana-sugar-mill 115/115
VITA
Luz Stella Polanco is from Cali, Colombia. Luz Stella has been working at Audubon Sugar
Institute – LSUAgCenter as a Research Associate since 2003, and previously she worked eight years
for a Colombian sugarcane factory as a chief chemist. She has a bachelor’s degree in chemical
engineering from “Universidad del Valle” (Cali-Colombia). Luz Stella began her studies at
Louisiana State University as a part-time student in August 2005. Her technical interest is to
continue researching on sugar manufacturing or on the manufacturing of sugar related products.