Embed Size (px)
Citation preview
1
Assessment of the Adequacy of
Natural Gas Pipeline Capacity in the
Northeast United States
U.S. Department of Energy
Office of Electricity Delivery and Energy Reliability
Energy Infrastructure Modeling and Analysis Division
November 2013

Northeast U.S. Natural Gas Pipeline Adequacy Assessment, 2013 2
Preface
In 2005-06, the U.S. DOE Office of Electricity Delivery and Energy Reliability (OE) conducted a
study on the adequacy of interstate natural gas pipeline capacity serving the northeastern
United States to meet natural gas demand in the event of a pipeline disruption. The study
modeled gas demand for select market areas in the Northeast under a range of different
weather conditions. The study then determined how interstate pipeline flow patterns could
change in the event of a pipeline disruption to one or more of the pipelines serving the region in
order to meet the gas demand.1 The results of the study demonstrated how much interstate
pipeline capacity that could be taken out of service while still being able to supply natural gas for
“essential human needs.”2
Since 2006, there have been significant changes to the Northeast gas market. Chief among
these has been the rapid growth of gas production from the Marcellus Shale in Pennsylvania
and new pipeline and processing infrastructure expansions associated with that growth. In light
of these changes, OE in 2013 has conducted a new assessment to determine how these
changes may have affected the ability of the interstate pipeline system to meet natural gas
demand for “essential human needs” in the event of a disruption in pipeline capacity. The new
study uses the same analytic tools and methodology as the original 2005-06 study, but takes
into account the changes in gas production, demand, and infrastructure that have occurred over
the past seven years, as well as several pipeline capacity additions due to be in-service before
the end of 2013. This report is a summary of the methods, assumptions, results, and
implications of the updated study.
This report may be beneficial to Federal and State policy makers and emergency response
officials in assessing the impacts of potential pipeline disruptions in the Northeast region, based
on the size of the disruption, the market area affected, and the weather conditions at the time of
the disruption.
1 Because it included proprietary commercial data, the report on the 2005-06 analysis was designated as
for Official Use Only (OFO). For more information regarding OFO, see DOE directive O 471.3. 2 As defined in section 401 of the Natural Gas Policy Act of 1978, “high priority” or “essential human
needs” gas demands include the following: residences; commercial establishments that use less than 50 thousand cubic feet on a peak day; schools, hospitals, and similar institutions; and “any other use the curtailment of which the Secretary of Energy determines would endanger life, health, or maintenance of physical property.”
Northeast U.S. Natural Gas Pipeline Adequacy Assessment, 2013 3
For Further Information
This report was prepared under the auspices of the Energy Infrastructure Modeling and Analysis
(EIMA) division of the Office of Electricity Delivery and Energy Reliability (OE). The vision of the
Office of Electricity Delivery and Energy Reliability (OE) is a U.S. energy delivery system that is
reliable in the face of all hazards, resilient to disruptions, and supports U.S. economic
competitiveness, while minimizing impacts on the environment. EIMA’s mission is to build
analytical tools and products to assist in emergency response to disruptions and long-term
planning of interacting energy infrastructures, and to support essential research and
development (R&D) to help achieve OE’s vision.
Frank Brock and Kevin Petak of ICF International conducted the study under the direction of
Alice Lippert, Senior Technical Advisor to EIMA. Specific questions about this report may be
directed to Alice Lippert, Senior Technical Advisor, EIMA Division ([email protected]).
For more information regarding the EIMA division, please contact [email protected].
Northeast U.S. Natural Gas Pipeline Adequacy Assessment, 2013 4
Introduction
In 2005-06, the U.S. DOE Office of Electricity Delivery and Energy Reliability (OE) conducted a
study of the adequacy of interstate natural gas pipeline capacity serving the Northeast3 to meet
natural gas demand, and in particular “essential human needs” demand, in the event of a
pipeline disruption. (“Essential human needs” include residential, commercial, and plant
preservation gas use.) The 2005-06 study found that markets in the Northeast could withstand
pipeline outages equivalent to between 11 percent and 69 percent of capacity under normal
winter weather conditions and still meet “essential human needs” gas demands. New England
was found to be most vulnerable to winter disruptions of pipeline capacity, because of its heavy
heating requirements among “essential human needs” customers. For the New York City
metropolitan area, the analysis indicated that any disruption of pipeline capacity could have a
negative impact on “essential human needs” gas customers, largely because pipeline capacity
into the City was highly constrained.
Since the 2005-06 study, significant changes in the geography of natural gas production in the
United States, particularly the emergence of the Marcellus shale in Pennsylvania as a major
source of new gas supply, have altered the capabilities of the interstate pipeline network serving
the Northeast. To understand the implications of these changes, OE has updated the study.
Total annual gas consumption4 in the Northeast is approximately 4,400 billion cubic feet (Bcf)
per year, or an average of about 12 Bcf per day. Since nearly half of Northeast gas
consumption is for residential and commercial space heating, total consumption is correlated
with the weather, with much higher consumption in winter than in summer. For example, on an
average January day total gas consumption would be 19 Bcf, versus only 10 Bcf on an average
July day.
For purposes of analysis, the Northeast is further subdivided into ten gas market areas, as
shown in Figure 1. These subdivisions are based on a number of common gas market
characteristics within their respective geographic areas. These include interstate pipeline
receipt and delivery points, gas trading points (“hubs”), local distribution company (LDC) service
territories, and clusters of natural gas-fired electricity generation and industrial gas loads.
These are the market areas of the ICF Gas Market Model (GMM)5 which was used for this
analysis.
3 The Northeast includes all of New England, New York, Pennsylvania, New Jersey, Delaware, Maryland,
the District of Columbia, and Northern Virginia. 4 Total gas consumption includes residential, commercial, industrial, and electric generation gas
consumption, as well as pipeline fuel gas use, production field (“lease”) gas use, and processing plant gas use. 5 GMM is a proprietary model of the North American gas market operated by ICF International and is
used to forecast supply, demand, pipeline flows, and prices. See the Appendix for a description of the model.

Northeast U.S. Natural Gas Pipeline Adequacy Assessment, 2013 5
Figure 1: Map of Northeast Market Areas
Source: Ventyx Data, ICF International
Thirteen interstate natural gas pipeline systems supply the ten market areas defined for the
Northeast, as shown in Figure 2.
Figure 2: Northeast Pipeline System
Source: FERC Form 549B Data; ICF International
Northeast U.S. Natural Gas Pipeline Adequacy Assessment, 2013 6
This analysis of the adequacy of the pipeline system to meet “essential human needs” has
focused on the near-term ability of the Northeast market to withstand outages of interstate
pipeline capacity for up to one month during peak winter and summer demand periods. The
study used publicly available information from the interstate pipeline owners and operators to
estimate pipeline capacity, and which is included in the GMM. The study forecasted monthly
and daily gas demand in the Northeast by end-use sector (residential, commercial, industrial,
and electric power) to estimate total demand. For establishing what is “essential human needs”
the study incorporated data from an American Gas Association (AGA) survey, which asked gas
utilities to estimate the percentage of their system loads considered “essential”.6 “Essential
human needs” gas demands include space and water heating for households, hospitals, nursing
homes, and buildings used to enhance public safety (e.g., fire and police stations).
Interstate pipelines and LDCs have two broad categories of customers: firm service and
interruptible service. Firm customers have a contractual claim on pipeline capacity; interruptible
customers can have their service interrupted when the pipeline operator needs the capacity to
supply firm customers, such as LDCs. For example, in exchange for somewhat lower prices, a
manufacturing facility may have interruptible service. Interruptible customers often see service
interrupted in peak winter season cold snaps. Curtailments of service are distinguished from
interruptions in that both firm and interruptible customers are at risk of losing supply under
pipeline and LDC curtailment procedures. Such procedures typically are part of a pipeline or
LDC tariff and describe how services will be curtailed to reduce gas consumption by non-
essential users in order to maintain service to “essential human needs” and to protect human
health and safety. 7 Most states have established procedures that require LDCs to follow a
similar sequence, depending on the severity of the disruption by:
1) calling for voluntary usage reductions by all customers,
2) interrupting interruptible gas services,
3) issuing operational flow orders (restricting off-takes from the main pipeline), and
4) assessing penalties for violations of a failure to curtail use.
Depending on the magnitude of the disruption, LDCs and pipelines may not invoke curtailment
procedures. The LDCs typically maintain firm contracts for interstate pipeline capacity, and
therefore, have the highest priority in the allocation of available gas supplies from the pipelines.
In the event of a relatively small pipeline disruption, the market allows for an economic
reallocation of whatever gas supplies remain after the LDC’s firm demands have been met.
Under such conditions, the gas market redistributes gas supplies based on how much users are
willing to pay; those unwilling to pay wholesale spot prices either shut down or switch to other
fuels. Sometimes when supplies are disrupted on one pipeline system, gas can be re-routed
and flows on other systems may increase, depending on the physical capabilities on the other
systems, pipeline interconnections, and on the availability of gas supplies upstream. 6 Consultation with the American Gas Association. AGA surveyed 31 of its member gas utilities, asking
what percentage of their loads were considered essential human needs gas demand, which the survey defined as “gas load serving residential, commercial, and plant preservation service only, assuming that an emergency has been declared.” The survey results are not publicly available. 7 “Inventory on Gas Curtailment Planning”, National Association of Regulatory Utility Commissioners, April
2005. FERC also has curtailment priorities for interstate pipelines. See 10 CFR Part 580.03
Northeast U.S. Natural Gas Pipeline Adequacy Assessment, 2013 7
Two factors determine the severity of a gas supply disruption’s effects on the ability to meet
“essential human needs.” First, is the size and duration of the pipeline disruption relative to the
total in-bound capacity serving the affected region. Second is the level of “essential human
needs” gas demand in the region.
Methodology and Assumptions
This study used natural gas demand and pipeline network models to forecast natural gas
demand under a variety of weather conditions, and then to simulate disruptions of in-bound
pipeline capacity into each of the ten market areas.8 This approach identified how large of a
disruption to inbound pipeline capacity each market area could withstand and still supply natural
gas for “essential human needs.”
The analysis focused on near-term market conditions in the Northeast. Near-term market
conditions are referred to a specific set of gas loads, pipeline flows and other supplies, and gas
prices that satisfy an equilibrium solution for each market area.
Because winter temperatures play such a large role in determining gas demand and potential
supply constraints, five weather scenarios were modeled. These scenarios were based on
observed temperatures in January and July over the past 85 years. The four scenarios are:
Much colder than normal: average daily temperatures colder than 90 percent of
observed January temperatures.
Colder than normal: average daily temperatures colder than 75 percent of observed
January temperatures,
Median: average daily temperatures colder than 50 percent of observed January
temperatures, and
Normal: average daily temperatures colder than 45 percent of observed January
temperatures over the past 20 years.
Because space heating gas demand is negligible in summer, most of the July “essential human
needs” gas demand is for water heating, which is estimated at less than 2,200 MMcf per day.
Since this demand is little affected by temperature variations, the July demand forecast was
based on a single weather case, namely, median summer temperatures.
The steps of the analysis are:
1. Use the GMM to forecast gas demand for each of the four January temperature
scenarios and one July temperature scenario.
2. Reduce pipeline capacity into each target market area until only demand from customers
with firm transportation contracts can be met, then allow the GMM to allocate remaining
gas supplies in the region based on prices. This is an iterative process because the
GMM may increase flows on interstate pipelines that have spare capacity because of
increased prices throughout the network. The amount of capacity removed in this step is
referred to as the Outage Withstood by Economic Reallocation.
8 The study employed the Gas Market Model, which ICF uses to estimate natural gas market conditions
and responses (see Appendix).
Northeast U.S. Natural Gas Pipeline Adequacy Assessment, 2013 8
3. Calculate the amount of the remaining gas load that could be curtailed without adversely
impacting “essential human needs.”9 These gas supplies are called the Outage with
Curtailments.
Data and Demand Projections
The interstate pipeline capacities in the natural gas pipeline network model (see Appendix) were
based on information published by the pipeline companies, additional information purchased
from data vendors, and through discussions with the pipeline companies.
Since 2005-06, the growth of Marcellus Shale gas production has converted Pennsylvania from
a net importer to a net exporter of natural gas.10 In addition to gas production, western
Pennsylvania and western New York also have multiple underground storage fields that
supplement the Northeast with additional supplies during peak winter demand periods. Thus,
four of the ten market areas (Western New York/Northwest Pennsylvania, Southwest
Pennsylvania, West Central Pennsylvania, and Northeast Pennsylvania) have local gas supply
from gas production and/or underground gas storage capacity (See Figure 1.) Because the gas
supply in these areas is greater than demand, a disruption of in-bound interstate pipeline
capacity would have little to no impact on the ability to meet “essential human needs” demand
within these four market areas.
The remaining six market areas rely almost exclusively on external gas supplies, and therefore
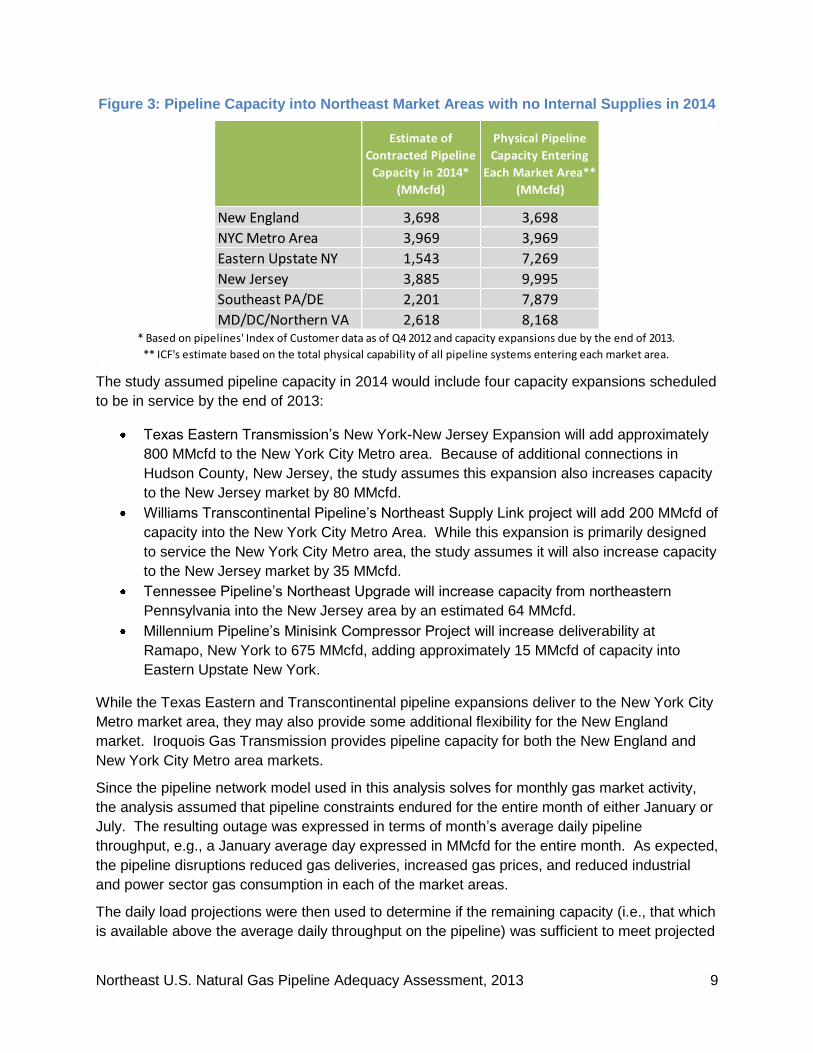
could be affected by a disruption of in-bound pipeline capacity. Figure 3 shows the amount of
physical pipeline capacity entering each of these six markets areas, as well as the amount of
capacity contracted by customers within each market area. These six markets can be divided
into two groups: four upstream markets (Eastern Upstate New York, New Jersey, Southeast
Pennsylvania/Delaware, and Maryland/District of Columbia/Northern Virginia) and two
downstream markets (New England and New York City Metro). In the case of the four
upstream markets, the amount of physical pipeline capacity serving each area is greater than
the demand within the area, since a portion of the in-bound capacity is contracted for by
consumers farther downstream. This is not so for the two downstream markets, where the
physical capacity is equal to the current firmly contracted deliveries in the area.
9 The demand for “essential human needs” is defined by the AGA survey.
10 U.S. Energy Information Administration, Natural Gas Annual 2011, Table S40 (Pennsylvania natural
gas production and consumption).
Northeast U.S. Natural Gas Pipeline Adequacy Assessment, 2013 9
Figure 3: Pipeline Capacity into Northeast Market Areas with no Internal Supplies in 2014
The study assumed pipeline capacity in 2014 would include four capacity expansions scheduled
to be in service by the end of 2013:
Texas Eastern Transmission’s New York-New Jersey Expansion will add approximately
800 MMcfd to the New York City Metro area. Because of additional connections in
Hudson County, New Jersey, the study assumes this expansion also increases capacity
to the New Jersey market by 80 MMcfd.
Williams Transcontinental Pipeline’s Northeast Supply Link project will add 200 MMcfd of
capacity into the New York City Metro Area. While this expansion is primarily designed
to service the New York City Metro area, the study assumes it will also increase capacity
to the New Jersey market by 35 MMcfd.
Tennessee Pipeline’s Northeast Upgrade will increase capacity from northeastern
Pennsylvania into the New Jersey area by an estimated 64 MMcfd.
Millennium Pipeline’s Minisink Compressor Project will increase deliverability at
Ramapo, New York to 675 MMcfd, adding approximately 15 MMcfd of capacity into
Eastern Upstate New York.
While the Texas Eastern and Transcontinental pipeline expansions deliver to the New York City
Metro market area, they may also provide some additional flexibility for the New England
market. Iroquois Gas Transmission provides pipeline capacity for both the New England and
New York City Metro area markets.
Since the pipeline network model used in this analysis solves for monthly gas market activity,
the analysis assumed that pipeline constraints endured for the entire month of either January or
July. The resulting outage was expressed in terms of month’s average daily pipeline
throughput, e.g., a January average day expressed in MMcfd for the entire month. As expected,
the pipeline disruptions reduced gas deliveries, increased gas prices, and reduced industrial
and power sector gas consumption in each of the market areas.
The daily load projections were then used to determine if the remaining capacity (i.e., that which
is available above the average daily throughput on the pipeline) was sufficient to meet projected
Estimate of
Contracted Pipeline
Capacity in 2014*
(MMcfd)
Physical Pipeline
Capacity Entering
Each Market Area**
(MMcfd)
New England 3,698 3,698
NYC Metro Area 3,969 3,969
Eastern Upstate NY 1,543 7,269
New Jersey 3,885 9,995
Southeast PA/DE 2,201 7,879
MD/DC/Northern VA 2,618 8,168* Based on pipelines' Index of Customer data as of Q4 2012 and capacity expansions due by the end of 2013.
** ICF's estimate based on the total physical capability of all pipeline systems entering each market area.
Northeast U.S. Natural Gas Pipeline Adequacy Assessment, 2013 10
peak-day demand. The peak day demand is on the coldest day of the month when pipelines
experience their highest throughput. If the projected peak day demand was higher than the
available capacity, then amount of capacity disrupted was reduced by the difference between
the modeled remaining capacity and the peak day requirement.
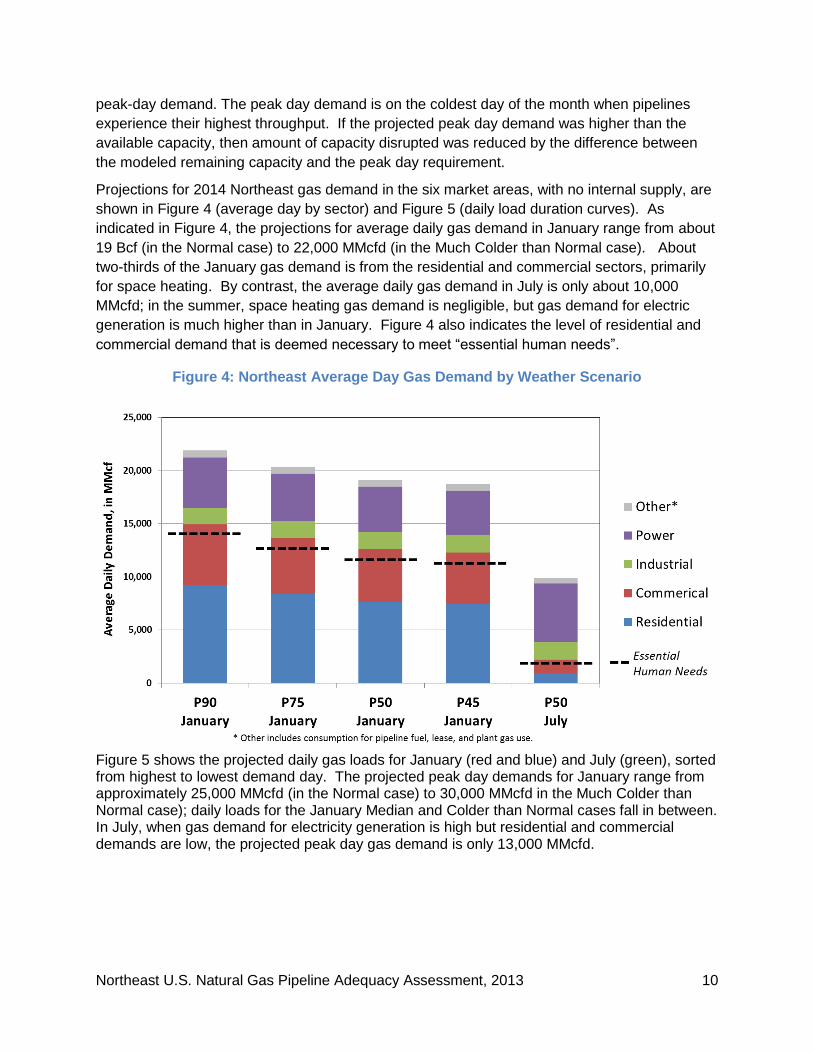
Projections for 2014 Northeast gas demand in the six market areas, with no internal supply, are
shown in Figure 4 (average day by sector) and Figure 5 (daily load duration curves). As
indicated in Figure 4, the projections for average daily gas demand in January range from about
19 Bcf (in the Normal case) to 22,000 MMcfd (in the Much Colder than Normal case). About
two-thirds of the January gas demand is from the residential and commercial sectors, primarily
for space heating. By contrast, the average daily gas demand in July is only about 10,000
MMcfd; in the summer, space heating gas demand is negligible, but gas demand for electric
generation is much higher than in January. Figure 4 also indicates the level of residential and
commercial demand that is deemed necessary to meet “essential human needs”.
Figure 4: Northeast Average Day Gas Demand by Weather Scenario
Figure 5 shows the projected daily gas loads for January (red and blue) and July (green), sorted from highest to lowest demand day. The projected peak day demands for January range from approximately 25,000 MMcfd (in the Normal case) to 30,000 MMcfd in the Much Colder than Normal case); daily loads for the January Median and Colder than Normal cases fall in between. In July, when gas demand for electricity generation is high but residential and commercial demands are low, the projected peak day gas demand is only 13,000 MMcfd.

Northeast U.S. Natural Gas Pipeline Adequacy Assessment, 2013 11
Figure 5: Northeast Daily Gas Demand by Weather Scenario (MMcfd)
Key Results
Results for the July scenario are shown in Figure 6. This figure begins on the left with the physical gas pipeline capacity entering each market area and then shows how much this capacity could be reduced by a disruption and still meet “essential human need” demand under two cases. In the first case, the Outage Withstood by Economic Reallocation shows how much capacity could be lost without resorting to curtailment. In the case of New England, 48 percent or 1,774 MMcfd of pipeline capacity could be lost and “essential human needs” would be served. In the second case, Outage with Curtailment, an additional 234 MMcfd could be curtailed and still the system would be able to meet “essential human needs” demand.
Figure 6: Results for July Disruptions
Because “essential human needs” gas demand in July is much less than the physical capacity available, the results of the modeling showed that all six of these markets could withstand substantial disruptions of pipeline capacity in July and still meet demand for “essential human needs”. For example, in Eastern Upstate New York in the summer it would be possible to lose
Additional
Non-essential
Load Curtailed
MMcfd
as % of
Physical
Capacity
MMcfd MMcfd
as % of
Physical
Capacity
New England 3,698 -1,774 -48% -234 -2,008 -54%
NYC Metro Area 3,969 -2,198 -55% -74 -2,272 -57%
Eastern Upstate NY 7,269 -6,589 -91% -56 -6,645 -91%
New Jersey 9,995 -7,770 -78% -305 -8,075 -81%
Southeast PA/DE 7,879 -6,385 -81% -177 -6,562 -83%
MD/DC/Northern VA 8,168 -5,547 -68% -112 -5,659 -69%
Physical Pipeline
Capacity Entering
Each Market Area,
MMcfd
Outage Withstood by
Economic ReallocationOutage With Curtailment
Northeast U.S. Natural Gas Pipeline Adequacy Assessment, 2013 12
up to 91 percent of the inbound pipeline capacity (Outage with Curtailments) and still meet the essential human needs within that market area.
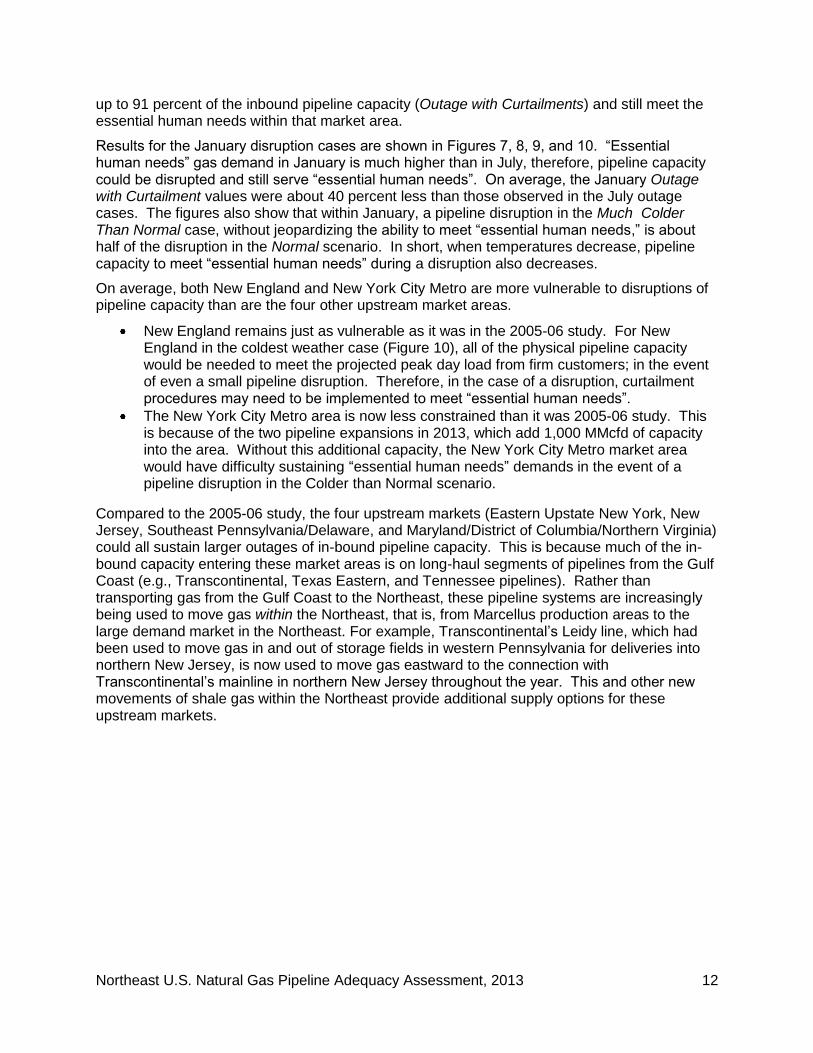
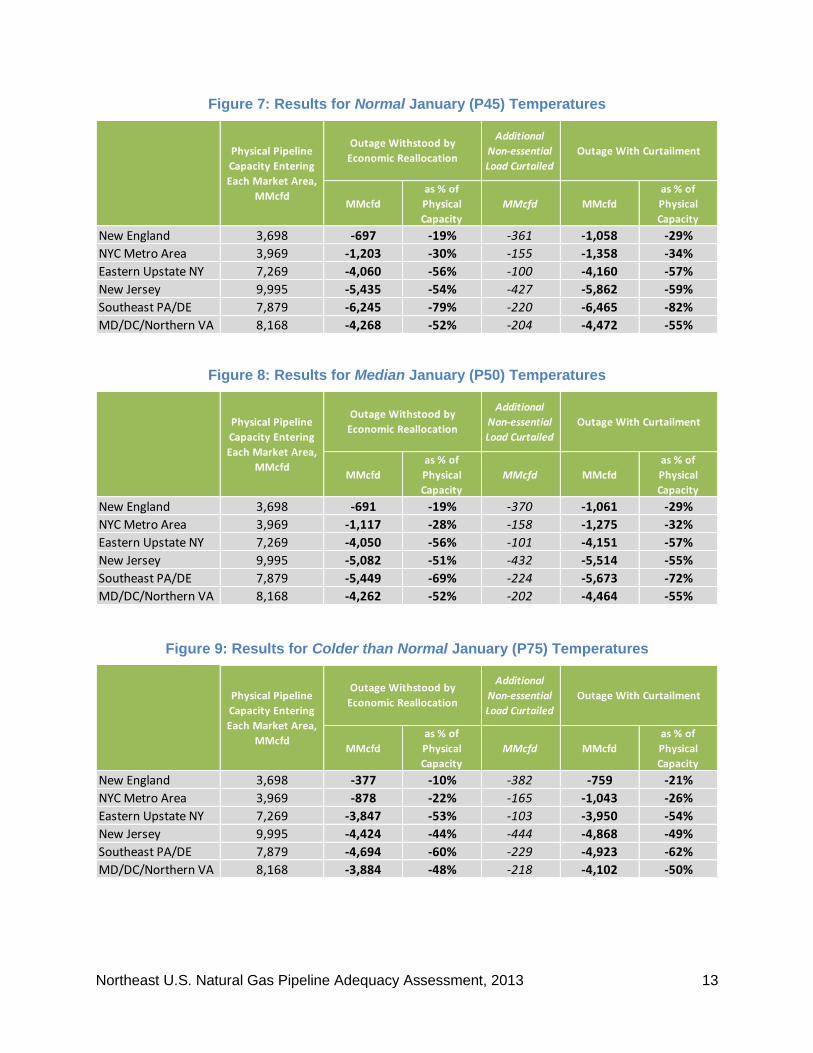
Results for the January disruption cases are shown in Figures 7, 8, 9, and 10. “Essential human needs” gas demand in January is much higher than in July, therefore, pipeline capacity could be disrupted and still serve “essential human needs”. On average, the January Outage with Curtailment values were about 40 percent less than those observed in the July outage cases. The figures also show that within January, a pipeline disruption in the Much Colder Than Normal case, without jeopardizing the ability to meet “essential human needs,” is about half of the disruption in the Normal scenario. In short, when temperatures decrease, pipeline capacity to meet “essential human needs” during a disruption also decreases.
On average, both New England and New York City Metro are more vulnerable to disruptions of pipeline capacity than are the four other upstream market areas.
New England remains just as vulnerable as it was in the 2005-06 study. For New England in the coldest weather case (Figure 10), all of the physical pipeline capacity would be needed to meet the projected peak day load from firm customers; in the event of even a small pipeline disruption. Therefore, in the case of a disruption, curtailment procedures may need to be implemented to meet “essential human needs”.
The New York City Metro area is now less constrained than it was 2005-06 study. This is because of the two pipeline expansions in 2013, which add 1,000 MMcfd of capacity into the area. Without this additional capacity, the New York City Metro market area would have difficulty sustaining “essential human needs” demands in the event of a pipeline disruption in the Colder than Normal scenario.
Compared to the 2005-06 study, the four upstream markets (Eastern Upstate New York, New Jersey, Southeast Pennsylvania/Delaware, and Maryland/District of Columbia/Northern Virginia) could all sustain larger outages of in-bound pipeline capacity. This is because much of the in-bound capacity entering these market areas is on long-haul segments of pipelines from the Gulf Coast (e.g., Transcontinental, Texas Eastern, and Tennessee pipelines). Rather than transporting gas from the Gulf Coast to the Northeast, these pipeline systems are increasingly being used to move gas within the Northeast, that is, from Marcellus production areas to the large demand market in the Northeast. For example, Transcontinental’s Leidy line, which had been used to move gas in and out of storage fields in western Pennsylvania for deliveries into northern New Jersey, is now used to move gas eastward to the connection with Transcontinental’s mainline in northern New Jersey throughout the year. This and other new movements of shale gas within the Northeast provide additional supply options for these upstream markets.
Northeast U.S. Natural Gas Pipeline Adequacy Assessment, 2013 13
Figure 7: Results for Normal January (P45) Temperatures
Figure 8: Results for Median January (P50) Temperatures
Figure 9: Results for Colder than Normal January (P75) Temperatures
Additional
Non-essential
Load Curtailed
MMcfd
as % of
Physical
Capacity
MMcfd MMcfd
as % of
Physical
Capacity
New England 3,698 -697 -19% -361 -1,058 -29%
NYC Metro Area 3,969 -1,203 -30% -155 -1,358 -34%
Eastern Upstate NY 7,269 -4,060 -56% -100 -4,160 -57%
New Jersey 9,995 -5,435 -54% -427 -5,862 -59%
Southeast PA/DE 7,879 -6,245 -79% -220 -6,465 -82%
MD/DC/Northern VA 8,168 -4,268 -52% -204 -4,472 -55%
Outage Withstood by
Economic ReallocationOutage With CurtailmentPhysical Pipeline
Capacity Entering
Each Market Area,
MMcfd
Additional
Non-essential
Load Curtailed
MMcfd
as % of
Physical
Capacity
MMcfd MMcfd
as % of
Physical
Capacity
New England 3,698 -691 -19% -370 -1,061 -29%
NYC Metro Area 3,969 -1,117 -28% -158 -1,275 -32%
Eastern Upstate NY 7,269 -4,050 -56% -101 -4,151 -57%
New Jersey 9,995 -5,082 -51% -432 -5,514 -55%
Southeast PA/DE 7,879 -5,449 -69% -224 -5,673 -72%
MD/DC/Northern VA 8,168 -4,262 -52% -202 -4,464 -55%
Physical Pipeline
Capacity Entering
Each Market Area,
MMcfd
Outage Withstood by
Economic ReallocationOutage With Curtailment
Additional
Non-essential
Load Curtailed
MMcfd
as % of
Physical
Capacity
MMcfd MMcfd
as % of
Physical
Capacity
New England 3,698 -377 -10% -382 -759 -21%
NYC Metro Area 3,969 -878 -22% -165 -1,043 -26%
Eastern Upstate NY 7,269 -3,847 -53% -103 -3,950 -54%
New Jersey 9,995 -4,424 -44% -444 -4,868 -49%
Southeast PA/DE 7,879 -4,694 -60% -229 -4,923 -62%
MD/DC/Northern VA 8,168 -3,884 -48% -218 -4,102 -50%
Physical Pipeline
Capacity Entering
Each Market Area,
MMcfd
Outage Withstood by
Economic ReallocationOutage With Curtailment
Northeast U.S. Natural Gas Pipeline Adequacy Assessment, 2013 14
Figure 10: Results for Much Colder than Normal January (P90) Temperatures
Conclusions and Implications
The ability of the gas pipeline network in the Northeast to meet “essential human needs”
demand during disruptions of pipeline supply has changed in significant ways in the past eight
years. In the span of just a few years, the growth of Marcellus Shale gas production has
increased regional gas supply and altered the movements of natural gas into and within the
Northeast. The growth of production from the Marcellus Shale has added much more flexibility
to Northeast gas markets and pipelines such that a disruption on an upstream segment of one
of the long-haul pipelines would have less of an impact on the region than it would have in the
past.
This is particularly so for those market areas south and west of the New York City Metro area.
The market areas in western, central, and northeastern Pennsylvania now have access to more
gas from local production than their markets require, such that a disruption of upstream gas
pipeline capacity would not affect their ability to meet “essential human needs”. Nevertheless,
outages on individual pipelines could still cause localized gas delivery problems due to
limitations on intra-market movements of natural gas.
New gas supplies from the Marcellus also benefit those markets in Maryland, the District of
Columbia, and Northern Virginia, Delaware, southeastern Pennsylvania, New Jersey and
upstate New York. Marcellus supply allows the “backhaul” of gas on pipelines that traditionally
moved gas from points farther south and west into the Northeast market, thereby enhancing the
supply options for these markets. The ability of Marcellus gas to feed the markets farther
downstream in Pennsylvania effectively frees up gas that would have flowed into those regions
and increases these markets’ ability to meet “essential human needs” should a disruption occur.
What remains problematic, however, are those markets “at the end of the pipe,” namely New
England and New York City Metro. They remain downstream of their gas supplies and are
vulnerable to pipeline disruptions. There are no opportunities for “backhauls” and the amount of
pipeline capacity entering these market areas limits the supplies they can receive from any
domestic source, including Marcellus. The New York City Metro area appears to be less
vulnerable than reported in the 2005-06 study, in part because of the planned expansions on
Additional
Non-essential
Load Curtailed
MMcfd
as % of
Physical
Capacity
MMcfd MMcfd
as % of
Physical
Capacity
New England 3,698 0 0% -393 -393 -11%
NYC Metro Area 3,969 -557 -14% -174 -731 -18%
Eastern Upstate NY 7,269 -3,386 -47% -106 -3,492 -48%
New Jersey 9,995 -3,154 -32% -463 -3,617 -36%
Southeast PA/DE 7,879 -3,382 -43% -235 -3,617 -46%
MD/DC/Northern VA 8,168 -3,712 -45% -223 -3,935 -48%
Physical Pipeline
Capacity Entering
Each Market Area,
MMcfd
Outage Withstood by
Economic ReallocationOutage With Curtailment
Northeast U.S. Natural Gas Pipeline Adequacy Assessment, 2013 15
Texas Eastern and Transcontinental pipeline systems into the area (due online in late 2013).
These expansions could provide some additional flexibility for the New England by freeing up
capacity on the Iroquois pipeline system formerly serving the New York City Metro area.
The ability of a market area to withstand a pipeline disruption also depends on weather
conditions. All six of the Northeast market areas examined could withstand disruptions of 50
percent or more of their in-bound pipeline during the summer months, when “essential human
needs” gas demand is minimal. However, even under normal winter weather conditions (daily
temperatures equal to the median of the past 20 years); the sustainable winter outage is only
about 30 percent. If winter weather were very cold, even a small outage of pipeline capacity
serving the New England market area would likely result in the need to invoke curtailment
procedures to make certain that “essential human needs” are met.
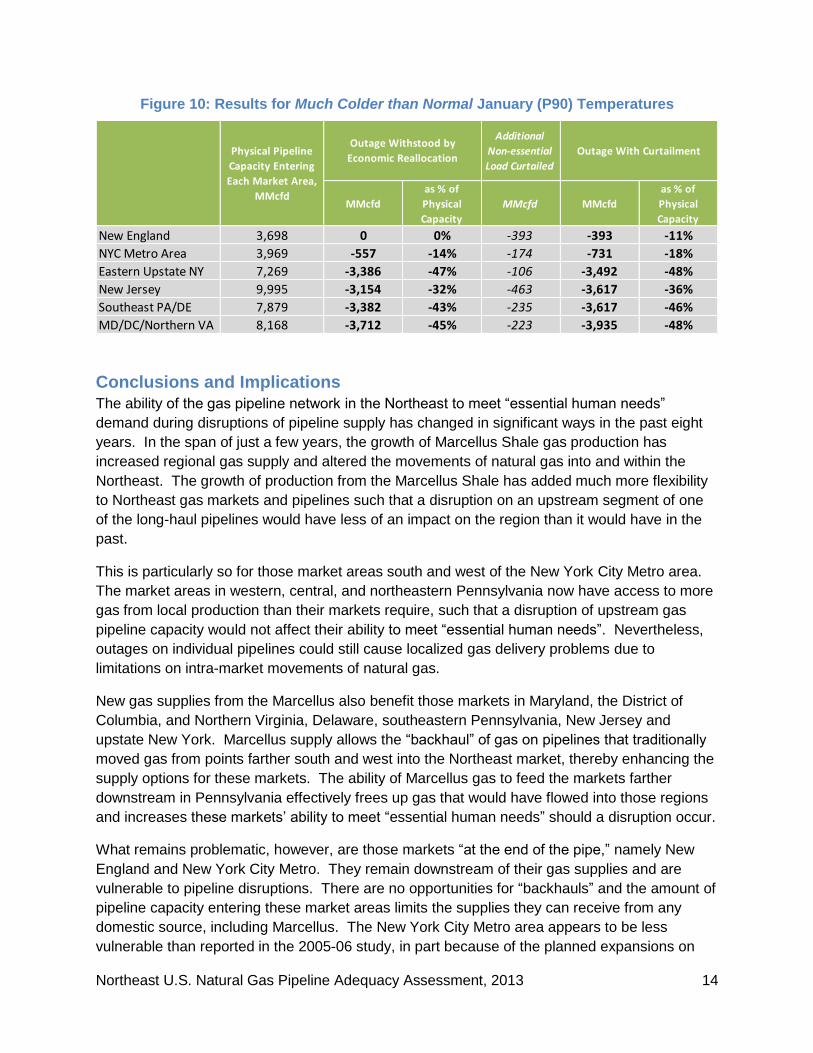
As illustrated in Figure 11 under summer conditions, all of the regions can manage disruptions
with only New England being moderately constrained. In winter, however, central and western
Pennsylvania and western New York face minimal constraints while New England is severely
constrained. These results may help Federal and State policy makers and emergency response
officials to assess the impacts of potential pipeline disruptions to areas in the Northeast region
by indicating how disruptions affect regions as a function of prevailing weather conditions.
Figure 11: Relative Ability to Withstand Loss of Pipeline Capacity
Northeast U.S. Natural Gas Pipeline Adequacy Assessment, 2013 16
Appendix
Model Description The study team used two of ICF International’s proprietary natural gas models, the Gas Market
Model (GMM) and the Daily Gas Load Model (DGLM), to forecast gas demands, pipeline flows,
and to model market response to disruptions of pipeline capacity. These same models were
also used for the 2005-06 study.11
The GMM is a “node and link” model of the United States and Canadian natural gas market,
with endogenous econometric relationships representing market activity (production,
consumption, and storage injections/withdrawals) at each of 119 market areas, or “nodes”;
which are connected by over 350 “links” representing the pipeline network. Each link is
characterized by a capacity in MMcfd and a cost of transporting gas between nodes that
includes fixed and variable costs.
Since the GMM solves for monthly gas market activity, ICF developed the DGLM to forecast
variations in daily gas consumption in the forecast months. This is important because pipelines
and LDCs design their systems to meet peak day demand. Estimating that demand for forecast
months is necessary for assessing the adequacy of pipeline capacity on days of maximum
expected throughput. For any given forecast month weather scenario, e.g., the coldest or the
median, DGLM uses the historical daily temperatures for that month to rank the days from
coldest to warmest and hence the daily gas consumption that could be expected based on the
customer mix and scenario. A coldest January (P90 case) will have a different daily temperature
rank order than an average January. (See Figure 5 for DGLM results.)
Both the GMM and DGLM employ econometric models to estimate gas demand in each end-
use sector (residential, commercial, industrial, and power) as a function of multiple factors.
These factors include seasonal temperatures, economic activity, electricity demand, and gas
prices. In the short term, residential and commercial gas demands are primarily a function of
temperature, and are essentially non-responsive to changes in price. Industrial and power
sector gas demands respond to seasonal temperatures as well, but they are sensitive to gas
prices. Higher gas prices will cause industrial and power sector demands to decrease as these
users change output or shift to alternative fuels. To calibrate the models to observed supply
and demand, ICF does extensive “back-casting” of recent gas market activity to ensure that the
models’ gas demand estimates are consistent with observed demands, temperatures, and gas
prices.
The GMM simultaneously solves for monthly gas consumption, production, and storage activity
at each node and the flow of gas on each link throughout the network. When the available
pipeline capacity is reduced to simulate a pipeline disruption, the estimated price of gas in the
affected market will increase; gas consumption by price-sensitive consumers (industrial and
11
The 2005-06 Northeast pipeline analysis was performed by Energy and Environmental Analysis, Inc. (EEA); EEA was acquired by ICF on January 1, 2007.

Northeast U.S. Natural Gas Pipeline Adequacy Assessment, 2013 17
electricity-generating gas loads) will decrease; and flows on other pipeline systems will
increase to make up for the shortfall, if possible. A simplifying assumption of the GMM is that
gas supplies are considered perfectly fungible once they enter a market, and there are no
internal constraints on the flow of gas within each of the ten market areas. This assumption
may overlook localized constraints within market areas.
Caveats
This analysis has a number of limitations. Principally, it did not address the impact of interstate
gas pipeline disruptions on electric power systems since this was not considered in the 2005-06
study. While gas use for electricity generation traditionally has not been categorized as an
“essential human needs” demand, constraints on gas supplies to power plants and generators
can have significant impacts on electric system operations.12
Since this study focused on monthly and daily pipeline flows among large market areas, there
are other limitations to the analysis.
First, gas supplies that originate within or enter each of the ten market areas are considered
perfectly fungible; thus, internal constraints on the flow of gas within each market were not
considered. In reality, the pipeline systems within each market area may or may not be
sufficiently interconnected to be able to work around a local disruption.
Second, the analysis did not account for all contractual obligations of market participants in the
economic reallocation in each of the simulated disruptions. The analysis implicitly assumes an
efficient market reallocates gas supply where marginal prices are greatest.
Third, the analysis was limited to daily gas balances; there was no consideration of intra-day
conditions. It was assumed that each day during the outage, the gas utilities and market
participants manage the pipeline and peak shaving resources to meet as much of the projected
day’s demand as possible.
It also should be noted that this is a vulnerability analysis and not a risk analysis. As such, there
is no attempt in this analysis to assess the likelihood of a disruption to interstate pipeline
capacity.
Finally, since the study focused on pipeline disruptions, it was assumed that upstream supplies
for the pipelines serving the Northeast would be sufficient to fill the available pipeline capacity
into each market. Gas supplies from the region’s two operating liquefied natural gas (LNG)
terminals, Cove Point in Maryland and Distrigas in Massachusetts, were based on recent
historical peak sendout, rather than their peak sendout capacity, since both facilities are
operating below their capacities. Likewise, the supplies into the Maritimes and Northeast
Pipeline (which is supplied by eastern Canadian offshore production and LNG imports at
Canaport) were also based on recent observed historical peak values, rather than the available
pipeline capacity.
12
Shahidehpour, M., et al, “Impact of Natural Gas Infrastructure on Electric Power Systems”, Proceedings of the IEEE, Vol. 93, No. 5, May 2005.