Embed Size (px)
Citation preview

Submitted on: 31/07/2014
1
Assessment of the benefits of Taipei Public Library Intelligent Libraries
and “FastBook” Automatic Book Lending Stations
Horng, Shih-chang
Taipei Public Library, Taipei City, Taiwan
E-mail address: [email protected]
Copyright © 2014 by Horng, Shih-chang. This work is made available under the terms of the Creative
Commons Attribution 3.0 Unported License: http://creativecommons.org/licenses/by/3.0/
Abstract:
Intelligent Libraries and ‘FastBook’ Automatic Book Lending Stations are innovative service
models that do not require the constant presence of library personnel to provide services.
They are mainly installed in MRT stations, railway stations and other places where large
numbers of people congregate. This study analyzed usage statistics for Taipei Public
Library’s (TPL) six intelligent libraries and three ‘FastBook’ stations and investigated
readers’ usage and satisfaction with the services. The result of this study showed that average
visitations for borrowing from TPL’s Intelligent Libraries and ‘FastBook’ stations were
between 1,000 to 2,000 per month and the average number of visits per person per month was
between 1 to 3 times. The peak borrowing period at each location was found to vary
according to the characteristics of the location and the reader profile. Females borrowed
more books than males, with the highest demographic group being females 41-50 years of age.
The most popular topic category was ‘language and literature’ and readers mainly expected
bestselling books to be provided. While access at each location varied, the convenience to
customers was the main reason for using the services. The services used were primarily
borrowing and returning materials and users preferred to browse the shelves to find the
books they needed. The study also found that less than 40% of users reported encountering
difficulties when using these services. Satisfaction ratings were highest with the spatial
environment for Intelligent Libraries and the location of ‘FastBook’ stations. More than half
of those surveyed reported that the use of Intelligent Libraries and ‘FastBook’ stations had
increased their reading frequency, changed the way they preferred to obtain books and met
their requirements for convenient access to library services.
Keywords: Intelligent Library, FastBook Automatic Book Lending Station, Taipei Public Library

2
Introduction
With the advance of information technology, the services of public libraries on the one hand
face growing demands from the public, while on the other, face the challenge of reduced
funding and staff resources. In response to these circumstances, TPL considered how to
provide innovative and modern services and subsequently developed Intelligent Libraries and
Automatic Book Lending Stations. However, these services do not replace existing library
services, but rather the two are complementary. Therefore, together these services enable a
broader and deeper reach, so that people have more convenient access to books and are less
limited by time and space pressures. At the same time the library is able to effectively
promote reading and provide practical assistance to the public in lifelong learning.
Intelligent Library and Automatic Book Lending Stations are alternative methods to address
insufficient funding and staffing, and the unavailability of land for a library. They are a
measure to extend library services, reading space and reading opportunities and facilitate
modern services. Readers find them convenient for borrowing and returning books. Taipei
Public Library has set up six Intelligent Libraries in succession since 2005, and five
‘FastBook’ Automatic Book Lending Stations since 2011. In order to understand usage,
reader satisfaction and opinion with these new services, TPL analysed usage statistics and
investigated readers’ usage, satisfaction and expectations for Intelligent Libraries and
‘FastBook’ Automatic Book Lending Stations.
Literature Review
1. Services provided at an Intelligent Library and Automatic Book Lending Station
An Intelligent Library is where books are placed on shelves in an area where access control
and inspection equipment are installed to manage readers’ entry and exit. Through the use of
valid documentation, readers’ enter the library and use self-check machines to select and
borrow and return books before leaving (Monley, 2011). Automatic Book Lending Stations
are based on the concept and appearance of an automated shelf which provides readers with
24-hour book borrowing and returning. It is similar to the concept of a slot machine and a
bank ATM, combined with RFID and automation technology so that users can complete their
book borrowing and returning activity throughout the network. This means that the library’s
shelves, user authentication and shelf-check service are integrated into one station (Monley,
2011;Yeh, Shao-Ching, 2012;Huang Ching, n.d.). These two service types have a range of
names. In some libraries the Intelligent Library is also called ‘Openbook Intelligent Library’.
The Automatic Book Lending Station is also called ‘Library ATM’, ‘Self-Service Library’,
‘Intelligent Miniature Library’, ‘Mini Size Self-Service Library’ and other names. TPL, in
reference to the national and international definitions provided above, uses the names
‘Intelligent Library’ and ‘Automatic Book Lending Station’. In addition, TPL added
‘FastBook’ to the term ‘Automatic Book Lending Station’ to highlight that it is a quick and
convenient service for book borrowing and returning.
‘Intelligent Library’ and ‘Automatic Book Lending Stations’ have emerged in response to
modern developments. It is a basic consideration that a door-to-door service is provided to
extend to every corner of the city (He, Lan-Man, 2011). The Intelligent Library and

3
Automatic Book Lending services break through the passive service offered by the traditional
library to satisfy users’ demands for reading while also addressing insufficient library
buildings. The smaller floor space, lower construction cost, shorter construction cycle and
longer service time (depending on set location) associated with these services can provide
readers with self-service book borrowing and returning functions and increased privacy while
also saving on staff resources (Chen, Hsiu-Chun, 2010; Hsu Chiu, 2011).
2. The current state of the service for domestic and overseas public libraries’ Intelligent
Library services
Domestic and overseas libraries which have set up Intelligent Libraries include: SengKang
Community Library and library@chinatown in Singapore, 24-hour Self-Service Library of
Heping District, Shenyang City, Foshan City United Library and 24-hour Self-Service Library,
Nanling City in China, Mid-Continent Public Library in Missouri, Library Express @
Redmond Ridge of King County Library System, and Yacolt Library Express of Fort
Vancouver Regional Library District, Washington, D.C. in USA, as well as New Taipei City
Library’s Pangchiao Railway Station Low-Carbon Intelligent Library, Taipei Public Library’s
Neihu Intelligent Library, Ximen Intelligent Library, Songshan Airport Intelligent Library,
Solar Library and Energy-Optimized House, Bailing Intelligent Library and East Metro Mall
Intelligent Library in Taiwan.
These libraries have located Intelligent Libraries in a range of locations including: shopping
centers, hypermarkets, transportation hubs (MRT station, railway station), community centers,
business or industrial zones, the main library and branch buildings, parks and schools. In
addition to the library’s own set location, some locations are delivered in cooperation with
enterprises or communities, for example, the enterprise may provide the site or sponsor funds
for setup and operation. Another example is the library@chinatown in Singapore, which is
sponsored and operated by the community. With regard to the floor area, the most common
size is approximately 100m2, smaller units are approximately 33m2, 132-198m2, or more
than 330m2. The area includes, space for self-service stations which are often equipped with
desks and chairs, and some stations for self-help library card application and fee payment, an
internet bar, computer classroom and activities space, etc. SengKang Community Library, the
world first Intelligent Library, provides the most comprehensive services and also has the
biggest floor area (1800m2). Furthermore, it provides readers with an online reference
function, via a telephone and computer, so that readers can ask questions of a librarian who is
at another location. A few Intelligent Libraries are used as service stations for readers to
borrow reserved materials and return library materials. They also provide library collections
for readers’ to self-borrow on site. The library collections at Intelligent Libraries consist
mainly of books and journals, with some having newspapers, video materials and e-
newspaper reading. Readers can not only return their loans borrowed from Intelligent
Libraries, but also in some cases, return loans borrowed from Automatic Book Lending
Stations. The opening hours at Intelligent Libraries are usually more than 10 hours per day
with some open 24 hours. However, some Intelligent Libraries are opened only after the main
library is closed, such as Dongguan Library.
3. The current state of the service for domestic and overseas public libraries’ Automatic
Book Lending Stations
Automatic book lending stations set up by domestic and overseas public libraries include
Contra Costa County Library, ‘Free2Read & Ride’ of Peninsula Library System and ‘FPL
Station’ of Fullerton Public Library in California, ‘Express @ Olney’ of Montgomery County

4
Public Libraries in Maryland and Ottawa Public Library and Edmonton Public Library in
Canada, Dongguan Library ATM and Self-Help Urban Community Library System of
Shenzhen Library in China, as well as Kaohsiung City Library, National Public Information
Library and Taipei Public Library in Taiwan.
The above set locations of Automatic Book Lending Stations include transportation hubs
(MRT station, railway station), shopping centers, community centers, hospitals, the main
library, municipal buildings, urban community and parking lots. Some university libraries
cooperate with universities to set up and provide predominantly book collections with some
audio-visual materials, video games and audio books. They may also have Automatic Lending
Stations specifically for audio-visual materials.
Opening hours vary, some stations are 24-hour services and some are more than 10 hours per
day, or match set locations. The size of the library collection available at Automatic Book
Lending Stations ranges from 200 to 700 items. The service is mainly to support readers to
self-serve book borrowing and returning, however, some overseas stations are for borrowing
only. In addition, some libraries enable readers to return items lent from Automatic Book
Lending Stations and also from other branches.
Apart from book borrowing and returning services provided by domestic and overseas public
libraries’ Automatic Book Lending Stations, some stations have additional functionality
including: library card application, renewal, login to library website inquiry system for library
information and personal borrowing record, deposit of advance payment and deduction and
reservation of items borrowed on the reader’s designated equipment. The ‘Self-Help Urban
Community Library System’ of Shenzhen Library provides the most services. Shenzhen
Library’s equipment has the functionality to reserve materials to borrow from other libraries,
available in the reservation materials cabinet.
To facilitate browsing, stations in Taiwan and China have a glass window to enable readers to
see books or the spines of books in the library collection. In America and Canada, readers can
only see library collections on the first layer of each shelf or the book categories and titles
available through a touch screen. Where the equipment only allows readers to see collections
on the first layer of each shelf, readers are expected to borrow from the collection that is
visible.
Research methods
Methods, objectives and implementation of this study:
1. Methods and objectives of study:
This study analysed usage statistics for six Intelligent Libraries in TPL integrated library
system and three ‘FastBook’ Automatic Book Lending Stations located in the main library,
Taipei Railway Station and Taipei City Hall. The study adopted purposive sampling of users
of Intelligent Libraries and ‘FastBook’ Automatic Book Lending Stations as the study
population for questionnaires conducted with on-site users. Basic details for the Intelligent
Libraries and ‘FastBook’ Automatic Book Lending Stations included in the study are in Table
1:

5
Table 1 Basic detail for Intelligent Libraries and ‘FastBook’ Automatic Book
Lending Stations
Name Setup time Space, m2
Library
collection
quantity
Location Service time
Intelligent
Library
Neihu 07/2005 106 10,200 Shopping
Center 06:00-23:00
Ximen 05/2006 198 15,000 MRT Station 06:00-24:00
Songshan
Airport 06/2011 90 9,700 MRT Station 06:00-24:00
Solar Library
and Energy-
Optimized
House
10/2011 330 21,500 Park 08:30-21:00
Bailing 12/2012 125 10,100 Elementary
School
Mon.-Fri.
16:30-21:00
weekends &
summer
09:00-21:00
East Metro
Mall 01/2013 100 9,100 Metro Mall 06:00-24:00
FastBook
Automatic
Book
Lending
Station
The Main
Library 04/2011 NA 1,570
The Main
Library 24 hrs
Taipei City
Hall 01/2013 NA 2,080
Taipei City
Hall 07:00-22:00
Taipei
Railway
Station
01/2012 NA 1,800 Railway
Station 24 hrs
2. Implementation of study
The study conducted a pre-test questionnaire on July 25, 2013 of 10 users in TPL’s intelligent
libraries and ‘FastBook’ stations. No questionnaire revisions were required following the pre-
test results. Subsequently, the formal questionnaire was conducted for on-site users in six
intelligent libraries and three ‘FastBook’ stations in the Main Library, Taipei Railway Station
and Taipei City Hall. For Intelligent Libraries, 1,006 questionnaires were issued, with 857
valid responses received (response rate of 98%); For ‘FastBook’ stations, 988 questionnaires
were issued, with 812 valid responses received (response rate of 95%).
Analysis and discussion of the study results
This study analysed usage statistics of the integrated library system and the questionnaire
results. Results of usage statistics and questionnaire analysis for Intelligent Libraries and
‘FastBook’ stations are described below:
1. Usage statistics for Intelligent Libraries and ‘FastBook’ stations
(1)Usage statistics for Intelligent Libraries
The six Intelligent Libraries analysed in this study are: Neihu Intelligent Library (located in
large-sized shopping center), Ximen Intelligent Library (located in MRT Station), Songshan

6
Airport Intelligent Library (located in Airport MRT Station), Solar Library and Energy-
Optimized House (located in the park), Bailing Intelligent Library (located in elementary
school campus) and East Metro Mall Intelligent Library (located in Metro Mall). This study
used the code IL-1, IL-2, IL-3, IL-4, IL-5 and IL-6 in order, to identify the services above.
A. Visitations:
Visitations to the six intelligent libraries were 531,784 in total for January-September, 2013 -
an average of 59,087 visits per month. The highest number of visits was to IL-4 (average
28,927 per month), second highest was IL-6 (average 11,026 per month), followed by, in
sequence, IL-2, IL-5, IL-3, and IL-1. The month with the highest visits was during summer
vacation (80,274 in July and 77, 910 in August), with February having the lowest visits
(44,904).
Table 2 Visitations to Intelligent Libraries
IL/
Month Jan. Feb. Mar. Apr. May Jun. Jul. Aug. Sep. Total Avg.
IL-4 25,501 20,830 24,437 21,104 22,618 34,168 43,215 41,295 27,172 260,340 28,927
IL-6 2,800 10,026 13,884 13,736 9,353 11,368 13,715 12,177 12,177 99,236 11,026
IL-2 8,254 6,359 6,012 6,103 6,169 7,435 8,822 7,753 7,753 64,660 7,184
IL-5 6,881 2,372 5,966 3,220 3,932 4,452 5,410 7,203 5,705 45,141 5,016
IL-3 4,271 3,815 4,277 3,792 5,185 5,165 6,196 6,029 4,494 43,224 4,803
IL-1 1,751 1,502 1,979 1,913 1,922 1,998 2,916 3,453 1,749 19,183 2,131
Total 49,458 44,904 56,555 49,868 49,179 64,586 80,274 77,910 59,050 531,784 59,087
B. Visitations for book borrowing:
The total number of visitations for book borrowing from the six Intelligent Libraries was
99,353 for January-September, 2013 - average 11,039 per month. The location with the
highest number of visitations for book borrowing was at IL-5 (average 2,687 per month),
second highest was at IL-4 (average 2,480 per month) and the lowest was at IL-1 (average
493 per month). The highest month of visitations for book borrowing was in July (12,651),
second highest was January (12,387) and the lowest month was September (8,370).
Table 3 Visitations for book borrowing per month from Intelligent Libraries
IL./
Month Jan. Feb. Mar. Apr. May Jun. Jul. Aug. Sep. Total Avg.
IL-5 3,968 2,129 3,211 2,641 2,977 3,562 2,918 1,554 1,222 24,182 2,687
IL-4 2,810 2,352 2,464 2,294 2,221 2,505 2,980 2,613 2,084 22,323 2,480
IL-6 1,588 2,200 2,338 2,156 2,288 2,206 2,413 2,298 1,914 19,401 2,156
IL-2 2,471 1,916 2,215 2,094 2,038 2,137 2,385 2,371 1,749 19,376 2,153

7
IL./
Month Jan. Feb. Mar. Apr. May Jun. Jul. Aug. Sep. Total Avg.
IL-3 1,044 929 1,133 988 1,114 1,074 1,287 1,090 974 9,633 1,070
IL-1 506 398 439 434 472 502 668 592 427 4,438 493
Total 12,387 9,924 11,800 10,607 11,110 11,986 12,651 10,518 8,370 99,353 11,039
Generally the peak time for visitations for book borrowing from the six Intelligent Libraries
for January-September, 2013 was 16:00-17:59. The peak time varied for the libraries and was
as follows: IL-1 14:00-17:59; IL-3, IL-6 and IL-5 15:00-17:59; IL-4 16:00-17:59 and 20:00-
20:59; and IL-2 17:00-18:59.
C. Quantity and category of book borrowing
Total book borrowing/returning quantity for the six Intelligent Libraries was 537,802 books
for January-September, 2013. Libraries in order of highest to lowest loans/returns: IL-4, IL-5,
IL-2, IL-6, IL-3 and IL-1.
The total number of books borrowed from the six Intelligent Libraries was a total of 319,955
for January-September, 2013. Libraries in order of highest to lowest loans: IL-5, IL-4, IL-2,
IL-6, IL-3 and IL-1. In the same period, the total number of books returned to the six
Intelligent Libraries was a total of 217,847 (average 24,205 books per month). Libraries in
order of highest to lowest returns: IL-4, IL-2, IL-6, IL-5, IL-3 and IL-1. With regard to
monthly statistics: the highest book loans/returns were in July, with January as the second
highest month and September as the lowest month. The highest month for book loans was
January, with the second highest month in June and the lowest month in September. The
month with the highest book returns was July, the second highest month was August and the
lowest month was September.
Table 4 Quantity of book borrowing/returning per month for Intelligent Libraries
IL / Month Jan. Feb. Mar. Apr. May Jun. Jul. Aug. Sep. Total Avg.
IL-4 Borrow 10,116 7,742 8,114 7,613 7,280 8,272 9,721 8,462 6,456 73,776 8,197
Return 8,094 7,798 7,564 6,964 6,603 6,797 8,321 8,233 6,287 66,661 7,407
Borrow+Return 18,210 15,540 15,678 14,577 13,883 15,069 18,042 16,695 12,743 140,437 15,604
IL-5 Borrow 15,104 9,389 12,773 11,520 12,411 14,702 9,766 4,252 3,085 93,002 10,334
Return 4,787 3,200 3,786 3,290 3,532 3,470 4,370 4,271 2,999 33,705 3,745
Borrow+Return 19,891 12,589 16,559 14,810 15,943 18,172 14,136 8,523 6,084 126,707 14,079
IL-2 Borrow 7,515 5,797 6,439 6,097 5,844 6,351 7,213 7,125 5,123 57,504 6,389
Return 5,614 5,045 5,104 4,727 4,828 4,801 5,362 5,659 4,286 45,426 5,047
Borrow+Return 13,129 10,842 11,543 10,824 10,672 11,152 12,575 12,784 9,409 102,930 11,436
IL-6 Borrow 4,527 5,636 5,885 5,357 5,705 5,349 5,842 5,446 4,625 48,372 5,375
Return 996 3,936 4,991 4,658 4,646 4,440 4,874 4,602 3,849 36,992 4,110
Borrow+Return 5,523 9,572 10,876 10,015 10,351 9,789 10,716 10,048 8,474 85,364 9,485
IL-3 Borrow 3,403 2,910 3,397 3,039 3,498 3,377 3,933 3,363 2,909 29,829 3,314
Return 2,173 2,224 2,551 2,252 2,594 2,323 2,746 2,535 2,361 21,759 2,418

8
IL / Month Jan. Feb. Mar. Apr. May Jun. Jul. Aug. Sep. Total Avg.
Borrow+Return 5,576 5,134 5,948 5,291 6,092 5,700 6,679 5,898 5,270 51,588 5,732
IL-1 Borrow 2,151 1,553 1,801 1,715 1,790 1,886 2,641 2,248 1,687 17,472 1,941
Return 1,430 1,323 1,623 1,296 1,303 1,452 1,691 1,713 1,473 13,304 1,478
Borrow+Return 3,581 2,876 3,424 3,011 3,093 3,338 4,332 3,961 3,160 30,776 3,419
Total
Borrow 42,816 33,027 38,409 35,341 36,528 39,937 39,116 30,896 23,885 319,955 35,551
Return 23,094 23,526 25,619 23,187 23,506 23,283 27,364 27,013 21,255 217,847 24,205
Borrow+Ret
urn 65,910 56,553 64,028 58,528 60,034 63,220 66,480 57,909 45,140 537,802 59,756
The demographic profile for book borrowing from the six Intelligent Libraries showed that
females (58%) borrowed more than males (42%). At IL-1 males (54%) borrowed more than
females (46%), however the percentage of females was higher than males for the other five
Intelligent Libraries. With regard to age, generally, the highest quantity of loans were by
people aged 41-50 (27%), the second highest group was people aged 31-40 (24%). However,
at IL-5 the highest borrowing quantity was by persons aged 7-12 (23,718 books or 26%).
With regard to peak book borrowing times, overall the highest period was 16:00-17:59 for the
six Intelligent Libraries. The peak period varied for individual libraries as follows: IL-1 at
14:00-17:59 and 19:00-20:59; IL-3 at 14:00-20:59; IL-5 at 11:00-11:59 a.m. and 15:00-17:59
before/after class; IL-6 at 15:00-20:59; IL-4 at 20:00-20:59 before closed and 16:00-17:59;
IL-2 at 17:00-18:59 after class and off duty.
Table 5 Quantity of book borrowing per time period from Intelligent Libraries
Time/IL IL-1 IL-2 IL-3 IL-4 IL-5 IL-6 Total
0:00-0:59
closed
488 1
closed
12 501
1:00-1:59
closed
closed 2:00-2:59
3:00-3:59
4:00-4:59
5:00-5:59 29 29
6:00-6:59 112 161 142 415
7:00-7:59 867 814 1 2 591 2,275
8:00-8:59 10 2,216 1,087 1,008 234 1,271 5,826
9:00-9:59 317 1,384 1,124 3,517 3,491 1,013 10,846
10:00-10:59 1,134 1,726 1,547 4,946 7,306 1,684 18,343
11:00-11:59 1,158 2,233 1,682 6,017 10,869 2,355 24,314
12:00-12:59 1,367 3,474 1,705 4,424 8,074 3,073 22,117
13:00-13:59 1,262 3,812 1,939 4,063 6,881 3,395 21,352
14:00-14:59 1,622 3,462 2,137 5,680 7,898 3,669 24,468
15:00-15:59 2,050 4,519 2,552 6,261 10,240 4,118 29,740
16:00-16:59 1,519 4,528 2,314 7,686 15,700 4,736 36,483
9
Time/IL IL-1 IL-2 IL-3 IL-4 IL-5 IL-6 Total
17:00-17:59 1,426 5,762 2,652 8,110 10,909 4,424 33,283
18:00-18:59 1,187 6,268 2,373 6,355 3,472 4,165 23,820
19:00-19:59 1,503 4,553 2,169 5,862 2,974 4,139 21,200
20:00-20:59 1,639 4,208 2,349 9,737 4,926 4,095 26,954
21:00-21:59 1,168 4,226 1,969 109 26 3,217 10,715
22:00-22:59 110 2,466 907 0 0 1,763 5,246
23:00-23:59 0 1,200 347 0 0 481 2,028
Total 17,472 57,504 29,829 73,776 93,002 48,372 319,955
With regard to book category or topics, the ‘Language and literature’ category (48%)
accounted for the highest quantity of loans from the six Intelligent Libraries. The only
exception was for IL-2 where the ‘Arts’ (including cartoons) category (21,426 books, 37.3%)
accounted for the highest quantity of loans.
Table 6 Category of book borrowing from Intelligent Libraries
Category/IL IL-1(%
)
IL-2(%
)
IL-3(%
)
IL-4(%
)
IL-5(%
)
IL-6(%
) Total
Language &
literature
7,939
(45%)
21,053(
37%)
21,156(
71%)
33,754(
46%)
49,026(
53%)
20,964(
43%)
153,892
(48%)
Applied
science
2,755
(16%)
4,787(
8%)
1,405(
5%)
11,605(
16%)
6,955(
7%)
8,962(
19%)
36,469(
11%)
Arts 1,167
(7%)
21,426(
37%)
730
(2%)
4,849(
7%)
5,337(
6%)
2,407(
5%)
35,916(
11%)
World history
& geography
1,521
(9%)
2,840(
5%)
4,593(
15%)
6,180(
8%)
5,742(
6%)
5,331(
11%)
26,207 (
8%)
Social
sciences
1,096
(6%)
2,436(
4%)
644
(2%)
5,509(
7%)
6,004(
6%)
4,299(
9%)
19,988(
6%)
Sciences 1,122
(6%)
1,507(
3%)
465
(2%)
3,737(
5%)
7,354(
8%)
2,222(
5%)
16,407(
5%)
Philosophy 633
(4%)
1,804(
3%)
166
(1%)
4,115(
6%)
1,660(
2%)
1,955(
4%)
10,333(
3%)
Pre-school
books
467
(3%)
141
(0%)
68
(0%)
928
(1%)
7,316(
8%)
547
(1%)
9,467(
3%)
Chinese history
& geography
305
(2%)
332
(1%)
403
(1%)
1,084(
1%)
1,658(
2%)
602
(1%)
4,384(
1%)
Religion 252
(1%)
549
(1%)
172
(1%)
1,035(
1%)
888
(1%)
664
(1%)
3,560(
1%)
Generalities 215
(1%)
629
(1%)
27
(0%)
980
(1%)
1,062(
1%)
419
(1%)
3,332(
1%)
Total 17,472 57,504 29,829 73,776 93,002 48,372 319,955
D. Borrowing rate of library collection
Total quantity of book borrowing from the six intelligent libraries was 319,955 books.
Calculated on the basis of 75,600 total collection items in the six libraries, average borrowing

10
rate per book was 4.2 times. Analysis of individual Intelligent Libraries showed that the
highest turnover rate of the collection was at IL-5 (9.2 times), second highest was IL-6 (5.3
times) and the lowest rate was at IL-1 (1.7 times).
Table 7 Borrowing rate of library collection from intelligent libraries
IL-5 IL-6 IL-2 IL-4 IL-3 IL-1 Total
Quantity of
Library
collections 10,100 9,100 15,000 21,500 9,700 10,200 75,600
Quantity of loans
/collection
borrowing 93,002 48,372 57,504 73,776 29,829 17,472 319,955
Rate of
collection
borrowing
(times)
9.2 5.3 3.8 3.4 3.1 1.7 4.2
(2)Usage statistics for ‘FastBook’ Automatic Book Lending Stations
The three ‘FastBook’ Automatic Book Lending Stations analysed in this study are located in
the main library (at the entrance), Taipei Railway Station (at the platform, B1) and Taipei
City Hall (inside of Taipei City Hall). In the study they are identified as FB-1, FB-2 and FB-3,
respectively.
A. Visitations for book borrowing
Total visitations for book borrowing from the three ‘FastBook’ stations was 42,935 in
January-September, 2013 - average 4,771 visitations per month. The highest visitations for
book borrowing across the three stations was at FB-1 (average 2,268 per month), second
highest was FB-3 (average 1,305 per month), followed by FB-2 (average 1,197 per month).
With regard to the highest month for visitations for book borrowing across the three stations,
January was highest (6,037 visitations), second highest was July (5,396 visitations) and the
lowest was September (3,822 person-times).
Table 8 Visitations for book borrowing from ‘FastBook’ stations
Jan. Feb. Mar. Apr. May Jun. Jul. Aug. Sep. Total Avg.
FB-1 2,624 2,257 2,453 2,102 2,126 2,110 2,745 2,163 1,836 20,416 2,268
FB-3 1,928 1,308 1,353 1,202 1,310 1,029 1,502 1,229 884 11,745 1,305
FB-2 1,485 1,164 1,214 1,184 1,169 1,024 1,149 1,283 1,102 10,774 1,197
Total 6,037 4,729 5,020 4,488 4,605 4,163 5,396 4,675 3,822 42,935 4,771
The peak period for visitations for book borrowing from the three ‘FastBook’ stations was
15:00-18:59. For individual stations the peak periods were: FB-1 at 15:00-17:59; FB-2 at
17:00-19:59 after class/duty hour; FB-3 at 12:00-13:59 noon time and 15:00-15:59.

11
Table 9 Visitations for book borrowing at ‘FastBook’ stations per time period
Time/FB FB-1 FB-2 FB-3 Total
0:00-0:59 42 29 2 73
1:00-1:59 15 7 9 31
2:00-2:59 2 7 6 15
3:00-3:59 4 5 0 9
4:00-4:59 8 12 1 21
5:00-5:59 22 57 0 79
6:00-6:59 46 105 34 185
7:00-7:59 162 331 300 793
8:00-8:59 516 452 682 1,650
9:00-9:59 763 388 407 1,558
10:00-10:59 1,252 447 713 2,412
11:00-11:59 1,578 440 810 2,828
12:00-12:59 1,628 595 1,323 3,546
13:00-13:59 1,662 600 1,314 3,576
14:00-14:59 1,619 562 675 2,856
15:00-15:59 1,814 714 1,379 3,907
16:00-16:59 2,258 778 861 3,897
17:00-17:59 1,844 1,050 1,165 4,059
18:00-18:59 1,523 1,090 1,128 3,741
19:00-19:59 1,320 1,028 563 2,911
20:00-20:59 1,416 885 253 2,554
21:00-21:59 555 666 87 1,308
22:00-22:59 273 405 21 699
23:00-23:59 94 121 12 227
Total 20,416 10,774 11,745 42,935
B. Quantity and category of book borrowing
The total borrowing/returning quantity for the three ‘FastBook’ stations was 106,572 for
January-September, 2013. The order of stations from highest to lowest borrowing/returning
quantity was: FB-1, FB-2 and FB-3. The total loans from the three stations were 56,504 books
(average 6,278 books per month). The order of stations from highest to lowest loans was: FB-
1, FB-3 and FB-2 (the difference between the latter two stations was only 416 books). With
regard to quantity of returns, the combined total for the three ‘FastBook’ stations was 50,068
books (average 5,563 books per month). The order of stations from highest to lowest returns
was: FB-2, FB-3 and FB-1.

12
With regard to statistics for the highest month for borrowing/returning – January was the
highest month, July was the second highest and the lowest month was September. The highest
month for the quantity of loans was January, second highest was July and the lowest month
was June.
Table 10 Quantity of borrowing/returning for ‘FastBook’ stations
Jan. Feb. Mar. Apr. May Jun. Jul. Aug. Sep. Total Avg.
FB-1
Borrow 3,640 3,204 3,458 2,942 3,050 3,032 3,689 3,037 2,508 28,560 3,173
Return 1,987 1,718 1,669 1,420 1,409 1,468 2,292 1,927 1,666 15,556 1,728
Sub-Total 5,627 4,922 5,127 4,362 4,459 4,500 5,981 4,964 4,174 44,116 4,901
FB-2
Borrow 1,894 1,521 1,573 1,519 1,496 1,284 1,466 1,613 1,398 13,764 1,529
Return 2,279 1,883 1,977 1,917 2,013 1,939 2,037 2,148 1,978 18,171 2,019
Sub-Total 4,173 3,404 3,550 3,436 3,509 3,223 3,503 3,761 3,376 31,935 3,548
FB-3
Borrow 2,283 1,634 1,593 1,439 1,568 1,282 1,844 1,493 1,044 14,180 1,576
Return 1,200 1,845 2,120 1,842 2,042 1,700 2,133 1,969 1,490 16,341 1,816
Sub-Total 3,483 3,479 3,713 3,281 3,610 2,982 3,977 3,462 2,534 30,521 3,392
Total
Borrow 7,817 6,359 6,624 5,900 6,114 5,598 6,999 6,143 4,950 56,504 6,278
Return 5,466 5,446 5,766 5,179 5,464 5,107 6,462 6,044 5,134 50,068 5,563
Borrow
+Return 13,283 11,805 12,390 11,079 11,578 10,705 13,461 12,187 10,084 106,572 11,841

13
With regard to the demographic profile for users of the three ‘FastBook’ stations, more than
half of the loans were by females. With regard to age, people aged 41-50 (29%) accounted for
the highest quantity of loans, and people aged 31-40 were the second highest (25%). With
regard to the highest borrowing period, the overall peak period from the three ‘FastBook’
stations was 12:00-13:59 and 15:00-18:59. Peak periods varied across the individual stations
as follows: FB-1 was at 16:00-16:59 during opening hour of the main library; FB-2 at 17:00-
19:59 after class/duty hour; FB-3 at 12:00-13:59 noon time and 15:00-15:59. ‘
Table 11 Quantity of book borrowing per time period from ‘FastBook’ stations
Time/FB FB-1 FB-2 FB-3 Total
0:00-0:59 130 137 2 269
1:00-1:59 22 26 11 59
2:00-2:59 5 21 6 32
3:00-3:59 13 5 0 18
4:00-4:59 8 12 1 21
5:00-5:59 66 80 0 146
6:00-6:59 72 105 36 213
7:00-7:59 320 368 530 1,218
8:00-8:59 742 524 1,158 2,424
9:00-9:59 1,052 397 459 1,908
10:00-10:59 1,795 544 839 3,178
11:00-11:59 2,139 461 881 3,481
12:00-12:59 2,169 859 1,785 4,813
13:00-13:59 2,222 737 1,819 4,778
14:00-14:59 1,942 664 675 3,281
15:00-15:59 2,386 846 1,551 4,783
16:00-16:59 3,059 1,014 861 4,934
17:00-17:59 2,534 1,381 1,267 5,182
18:00-18:59 2,097 1,534 1,351 4,982
19:00-19:59 1,971 1,421 574 3,966
20:00-20:59 2,160 1,120 254 3,534
21:00-21:59 981 843 87 1,911
22:00-22:59 507 527 21 1,055
23:00-23:59 168 138 12 318
Total 28,560 13,764 14,180 56,504

14
The book borrowing category or topic with the highest loans from the three ‘FastBook’
stations was ‘Language and literature’ with (49%).
Table 12 Category of book borrowing from ‘FastBook’ stations
Category/FastBook FB-1(%) FB-2(%) FB-3(%) Total(%)
Language &
literature 16,223(57%) 5,250(38%) 6,392(45%) 27,865(49%)
Applied science 3,726(13%) 2,698(20%) 2,473(17%) 8,897(16%)
Social science 2,758(10%) 1,869(14%) 1,126(8%) 5,753(10%)
World history &
geography 2,125(7%) 1,763(13%) 1,767(12%) 5,655(10%)
Philosophy 1,692(6%) 627(5%) 907(6%) 3,226(6%)
Arts 642(2%) 630(5%) 742(5%) 2,014(4%)
Sciences 746(3%) 489(4%) 353(2%) 1,588(3%)
Religions 252(1%) 132(1%) 206(1%) 590(1%)
Chinese history &
geography 188(1%) 196(1%) 174(1%) 558(1%)
Generalities 208(1%) 84(1%) 40(0%) 332(1%)
Pre-school books 0(0%) 26(0%) 0(0%) 26(0%)
Total 28,560 13,764 14,180 56,504
C. Borrowing rate for the collections at ‘FastBook’ stations
The total quantity of loans from the three ‘FastBook’ stations was 56,504 books for
January-September, 2013. Calculated on the basis of a total collection of 5,450 items across
the three stations, the average borrowing rate per book was 10.4 times. Analysis of the
individual stations showed that the highest turnover rate for the collection was from FB-1
(18.2 times), second highest was FB-2 (7.6 times) and the lowest was FB-3 (6.8 times).
Table 13 Borrowing rate of collection for ‘FastBook’ stations
FB-1 FB-2 FB-3 Total
Number of library
collections 1,570 1,800 2,080 5,450
Number of collection
borrowings 28,560 13,764 14,180 56,504
Borrowing rate
(times) of
collections(each book
average)
18.2 7.6 6.8 10.4

15
2. Questionnaire analysis for “Assessment of the Benefits of Intelligent Libraries”
(1)Usage of Intelligent Libraries
A. Frequency of use
Questionnaire respondents for the six Intelligent Libraries reported their frequency of use as
mostly 1-3 times per month (33%), i.e. IL-1 (41%), IL-6 (32%), IL-5 (25%), IL-4 (40%) and
IL-2 (40%). A frequency of use of one time per 6 months (and up) was mostly reported by
users in IL-3 (32%).
1 3 2 5 24
2 1 12 6
14
21
10 3
28
14
37
64
1811
29
10
38
66
29
20
74
20
81
71
54
9
19
9
15
22
26
3
20
29
12
22
30
0
50
100
150
200
250
300
IL-1 IL-2 IL-3 IL-4 IL-5 IL-6
nu
mb
er of p
eop
le
1 time per 6 month(and
up)
1-2 times per 3 month
1-3 times per month
1 time per week
2-3 times per week
4-6 times per week
every day
Fig.1 Frequency of use for Intelligent Libraries
B. Approaches for using Intelligent Libraries
Users of IL-1 mostly used this location because of shopping and living nearby (45% each);
users of IL-4 and IL-5 reported living nearby, up to 70% (86% and 69%, respectively) ; users
of IL-6 and IL-2 reported living nearby and commuting (30% each); users of IL-3 reported
travelling (34%) followed by commuting for school (25%).
0%
10%
20%
30%
40%
50%
60%
70%
80%
90%
100%
number of people %
IL-1
IL-2
IL-3
IL-4
IL-5
IL-6
Fig.2 Approaches for using Intelligent Libraries

16
C. Reasons for using Intelligent Libraries
The overall reason reported for using Intelligent Libraries was because of their ‘convenient
location’ (76%). This was the main reason provided by respondents at each location. The
reason which had the lowest response rate was ‘collections meet requirements’ (20%). In
addition, the Intelligent Libraries where respondents reported the highest rate for ‘convenient
transportation’ were located in MRT stations or nearby Metro Mall, i.e. IL-2 (63%), IL-6
(57%) and IL-3 (53%).
10%
20%
30%
40%
50%
60%
70%
80%
90%
nu
mb
er of p
eop
le %
IL-1
IL-2
IL-3
IL-4
IL-5
IL-6
average
Fig.3 Reasons of using Intelligent Libraries
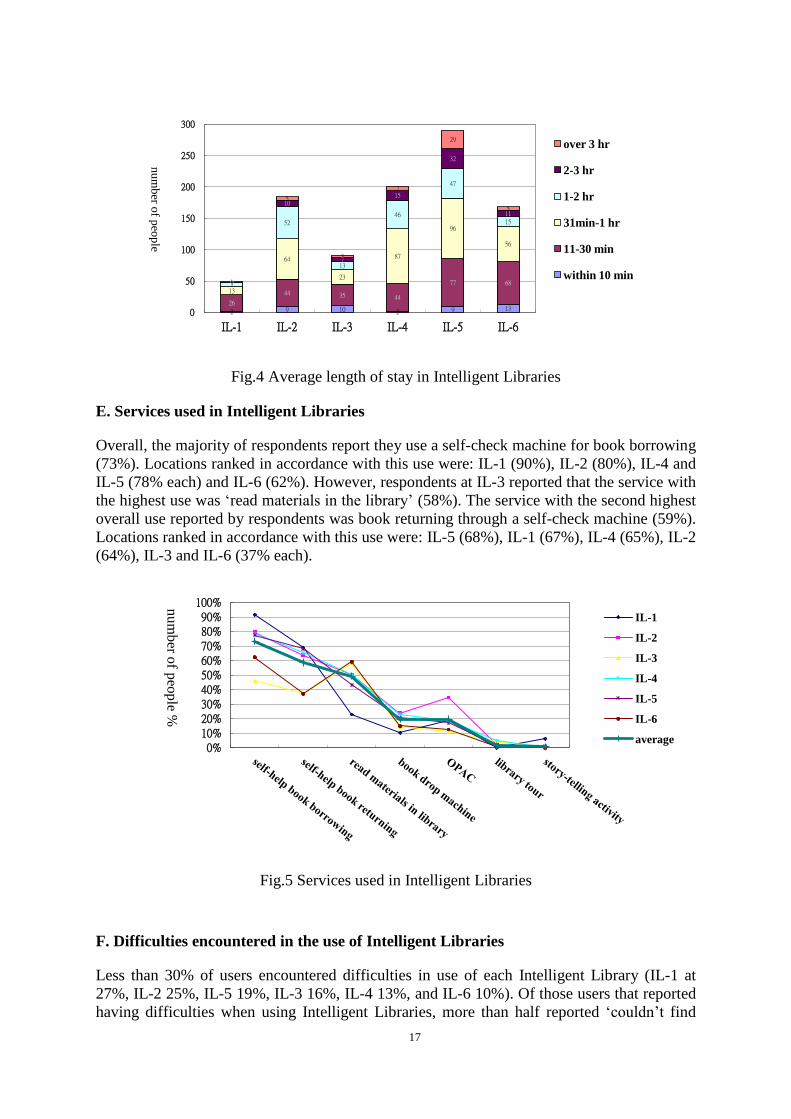
D. Average length of stay in intelligent libraries
Overall, the questionnaire respondents most frequently reported that their average length of
stay was 31 min - 1 hour (35%), and this applied at IL-4 (43%), IL-2 (35%) and IL-5 (33%).
While the average length of stay most frequently reported at IL-1 (53%), IL-6 (41%) and IL-3
(39%) was 11-30 minutes.
17
2 9 10 2 9 13 26
44 35 44
77 68 13
64
23
87
96
56
7
52
13
46
47
15
0
10
7
15
32
11
1
5
3
7
29
5
0
50
100
150
200
250
300
IL-1 IL-2 IL-3 IL-4 IL-5 IL-6
num
ber o
f peo
ple
over 3 hr
2-3 hr
1-2 hr
31min-1 hr
11-30 min
within 10 min
Fig.4 Average length of stay in Intelligent Libraries
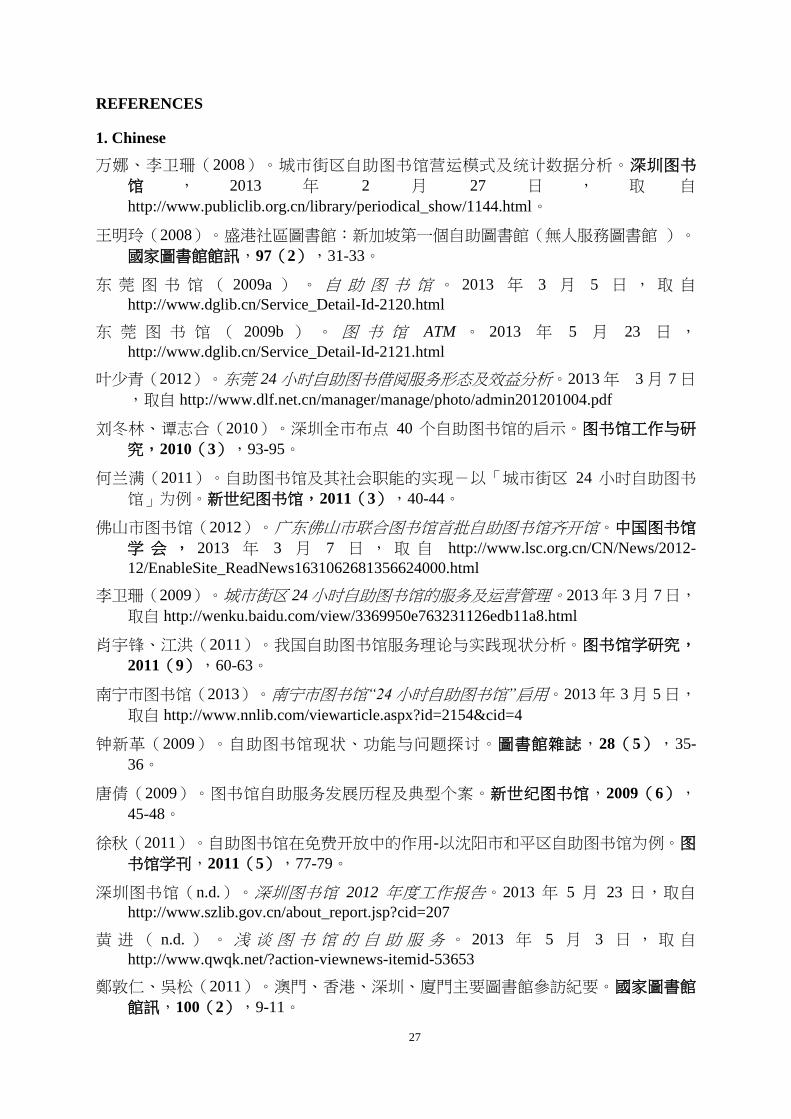
E. Services used in Intelligent Libraries
Overall, the majority of respondents report they use a self-check machine for book borrowing
(73%). Locations ranked in accordance with this use were: IL-1 (90%), IL-2 (80%), IL-4 and
IL-5 (78% each) and IL-6 (62%). However, respondents at IL-3 reported that the service with
the highest use was ‘read materials in the library’ (58%). The service with the second highest
overall use reported by respondents was book returning through a self-check machine (59%).
Locations ranked in accordance with this use were: IL-5 (68%), IL-1 (67%), IL-4 (65%), IL-2
(64%), IL-3 and IL-6 (37% each).
0%10%20%30%40%50%60%70%80%90%
100%nu
mb
er of p
eop
le %IL-1
IL-2
IL-3
IL-4
IL-5
IL-6
average
Fig.5 Services used in Intelligent Libraries
F. Difficulties encountered in the use of Intelligent Libraries
Less than 30% of users encountered difficulties in use of each Intelligent Library (IL-1 at
27%, IL-2 25%, IL-5 19%, IL-3 16%, IL-4 13%, and IL-6 10%). Of those users that reported
having difficulties when using Intelligent Libraries, more than half reported ‘couldn’t find

18
needed books’ in IL-2 (52%). There was a higher ratio for ‘failure to borrow and return books
through self-check machine’ in IL-1, of the remaining five Intelligent Libraries the most
commonly reported difficulty was ‘failure to find needed books’.
G. Awareness of Intelligent libraries
Respondents report that they mainly became aware of Intelligent Libraries because they
passed by and knew – response ranked in order: IL-6 (75%), IL-3 (70%), IL-4 (60%) and
IL-2 (54%). Users at IL-1 became aware mainly through the TPL website (45%) and also
through passing by (39%). Users at IL-5 became aware of the service through their friends,
classmates, colleagues and neighbours (40%) and also through family members (30%).
H. Relationship between using Intelligent Library and reading frequency
Users of the six Intelligent Libraries most commonly reported that using the service increased
their reading frequency (more than 90% for all), satisfied their requirements for convenient to
access library services (more than 80% for all), and changed their ways and habits of
acquiring books (more than 70% for all).
(2)Satisfaction of Intelligent Libraries
A. Overall satisfaction
Overall satisfaction with the six Intelligent Libraries was between “no comments” and
“satisfied”(3.93), in which IL-5 was the highest satisfaction(4.05) and IL-3 in the second
place(4.04), meaning both reached satisfaction and the remaining four were between “no
comments” and “satisfied”- score in ranked order: IL-1 (3.96), IL-4 (3.87), IL-6 (3.83)
and IL-2 (3.82).
3.5
4.0
4.5
IL-5 IL-3 IL-1 IL-4 IL-6 IL-2
satisfaction score
overall
satisfaction
Fig.6 Overall satisfaction of Intelligent Libraries
B. Satisfaction in all aspects
Overall, users of Intelligent Libraries were most satisfied with the ‘spatial environment’
(4.20). The second highest satisfaction rating was for ‘entrance/exit gate’ (4.16), and then in

19
ranked order: ‘self-check machine’ (4.04), ‘self-help book drop’ (3.88), ‘OPAC computer’
(3.84), ‘service hotline’ (3.73) and ‘library collection’ (3.65).
3.0
3.5
4.0
4.5
satisfaction score
IL-1
IL-2
IL-3
IL-4
IL-5
IL-6
Avg.
Fig.7 Satisfaction of Intelligent Libraries in all aspects
(3)Expectations for Intelligent Libraries
A. Collection improvements by subject or category:
Overall, at the six Intelligent Libraries 53% of users want more ‘bestsellers’ in the collection.
0%
10%
20%
30%
40%
50%
60%
70%
number of people %
IL-1
IL-2
IL-3
IL-4
IL-5
IL-6
Avg.
Fig.8 Collection subjects or categories for improvement at Intelligent Libraries.

20
B. Additional locations expected to set up intelligent libraries
Overall, respondents want additional Intelligent Libraries established at MRT stations (69%),
other favourable locations reported were shopping centers, community activity centers, parks
and railway stations.
0%
10%
20%
30%
40%
50%
60%
70%
80%
90%
100%
num
ber o
f peo
ple %
IL-1
IL-2
IL-3
IL-4
IL-5
IL-6
Avg.
Fig.9 Additional locations wanted for establishment of Intelligent Libraries
3. Questionnaire analysis for “Assessment of the Benefits of ‘FastBook’ Automatic Book
Lending Stations”
(1)Usage of ‘FastBook’ stations
A. Frequency of use
Overall, most users reported they use the three ‘FastBook’ stations 1-3 times per month
(29%). However for FB-1, users reported ‘1 time per 6 months’ (35%), followed by ‘1-3
times per month’ (24%).

21
14 5 10
29
14
40
46
20
34
89
67
77
61
38
28
128
52
37
0
50
100
150
200
250
300
350
400
FB-1 FB-2 FB-3
num
ber o
f peo
ple
1 time per 6 month(and
up)
1-2 times per 3 month
1-3 times per month
1 time per week
2-3 times per week
4-6 times per week
every day
Fig.10 Frequency of use for ‘FastBook’ stations
B. Approaches for using ‘FastBook’ stations
More than half of the users of FB-1 used the ‘FastBook’ station on the way to the main
library (58%); half of the users of FB-2 used the station when commuting (50%). With FB-3,
42% of users were employees of city government and used the station as it was nearby, the
second highest use reported was when commuting (25%) and the general public used this
station when visiting city government on business (24%).
C. Reasons of using ‘FastBook’ Stations
65% of users considered the ‘convenient locations’ of the three ‘FastBook’ stations as the
main reason for use, the second highest reason was ‘service hours meet requirements.’
0%
10%
20%
30%
40%
50%
60%
70%
80%
90%
100%
num
ber o
f peo
ple %
FB-1
FB-2
FB-3
Avg.
Fig.11 Reasons of using ‘FastBook’ stations

22
D. Services used at ‘FastBook’ stations
More than 80% of respondents used the three ‘FastBook’ stations to borrow books. The
second highest use was to return books. Use rate for returning books was 80% (FB-2 and FB-
3) and 54% (FB-1), respectively. The lowest used service was ‘book renewal’ at less than
20%.
0%
10%
20%
30%
40%
50%
60%
70%
80%
90%
100%
nu
mb
er of p
eop
le %
FB-1
FB-2
FB-3
Avg.
Fig.12 Services used at ‘FastBook’ stations
E. Difficulties encountered in the use of ‘FastBook’ stations
Less than 40% of users reported they had difficulties in using ‘FastBook’ stations (FB-2 32%;
FB-1 30%; FB-3 15%). More than half of the users reported they had no difficulty. The issue
most encountered by users was that they ‘were not familiar with operation of machine’ at FB-
1 (40%), for the other stations the reason was mostly ‘machine breakdown - FB-2 and FB-3
(30% each).
F. Awareness of ‘FastBook’ stations
The majority of users of the three ‘FastBook’ stations reported they were aware of the service
because they ‘passed by and knew’ (FB-2 76%, FB-3 64% and FB-1 60%).
G. Relationship between using ‘FastBook’ stations and reading frequency
More than half of the users of the three ‘FastBook’ stations recognised that by using the
services they increased their reading frequency, changed their ways and habits of acquiring
books and satisfied their requirements for convenient access to library services.

23
(2)Satisfaction with ‘FastBook’ stations
A. Overall satisfaction
Overall satisfaction with the three ‘FastBook’ stations was between “no comments” and
“satisfied.” In ranked order of highest to lowest satisfaction: FB-3 (3.95), FB-2 (3.93) and
FB-1 (3.81).
3.5
3.6
3.7
3.8
3.9
4.0
FB-3 FB-2 FB-1
satisfa
ction
score
overall
satisfaction
Fig.13 Overall satisfaction with ‘FastBook’ stations
B. Satisfaction in all aspects
As a whole, users were most satisfied with the locations of ‘FastBook’ stations (4.16), the
second highest satisfaction was with the borrowing/returning system (4.05 each), and then in
order of satisfaction: renewal function (3.85), side screen for browsing (3.83), side screen for
inquiry (3.72), collections (3.71) and service hotline (3.65).
(3)Expectations for ‘FastBook’ stations
A. Collection improvements by subject or category
On average, 61% of users want increased ‘bestsellers’ at the three ‘FastBook’ stations.

24
0%
10%
20%
30%
40%
50%
60%
70%
80%
nu
mb
er of p
eop
le %
FB-1
FB-2
FB-3
Avg.
Fig.14 Collection subjects or categories for improvement at ‘FastBook’ stations
B. Additional locations wanted for ‘FastBook’ stations
Up to 81% of users of the three ‘FastBook’ stations want additional stations established with
most wanting them at MRT stations. Other favourable locations were railway stations,
shopping centers and government institutions.
0.0%
10.0%
20.0%
30.0%
40.0%
50.0%
60.0%
70.0%
80.0%
90.0%
100.0%
nu
mb
er o
f peo
ple
%
FB-1
FB-2
FB-3
Avg.
Fig.15 Additional locations wanted for ‘FastBook’ stations

25
Conclusions
This study aimed to explore usage as well as users’ satisfaction and expectations of Taipei
Public Library’s six Intelligent Libraries and three ‘FastBook’ Automatic Book Lending
Stations. The following is a summary of the important conclusions based on the analysis of
the usage statistics and questionnaire research results:
1. Usage of Intelligent Libraries (IL) and ‘FastBook’ stations
(1)Average book borrowing person-time of IL and ‘FastBook’ stations is similar, between
1,000-2,000 person-times per month.
(2) Book borrowing quantity from IL-5 (Bailing IL) and IL-4 (Solar Library and Energy-
Optimized House) are at the top two; FB-1 (The main library’s ‘FastBook’) is the highest.
( 3)Each IL and ‘FastBook ’station has different peak periods - depending on the
characteristics of the set location and reader profile.
(4)Females borrow more books and males from IL and ‘FastBook’ stations.
(5)Users aged 41-50 have the highest book borrowing quantity from IL and ‘FastBook’
stations, followed by users aged 31-40.
(6)The most popular category of books borrowed from IL and ‘FastBook’ stations is
‘Language and literature.’
(7)Average borrowing rate (turnover rate) of the collection is IL 4.2 times; and from
‘FastBook’ stations it is 10.4 times.
2. Usage behaviours of Intelligent Libraries (IL) and ‘FastBook’ stations
(1)Frequency of using IL and ‘FastBook’ stations is mostly 1-3 times per month.
(2)Approach for using IL and ‘FastBook’ stations varies depending on the characteristics
of the set location, for example, more people use the locations in MRT stations and railway
stations when commuting.
(3)The main reason for using IL and ‘FastBook’ stations is their ‘convenient location'.
(4)User’s length of stay in IL is mostly 11 minutes to 1hour.
(5)The main purpose of using IL and ‘FastBook’ stations is ‘book borrowing.’
(6)Users mainly look for needed books by direct shelf browsing in IL and ‘FastBook’
stations.
(7)Less than 40% of the users had difficulties in use of IL and ‘FastBook’ stations. The
main difficulty reported for IL is ‘cannot find needed books’; whereas in ‘FastBook’ stations
it is ‘machine is unavailable due to breakdown.’

26
(8)The channel for becoming aware of IL and ‘FastBook’ stations is mostly that users
‘passed by and knew.’
(9)More than 50% of the users recognized that using IL and ‘FastBook’ stations can
increase their reading frequency, change their ways and habits of acquiring books and satisfy
their requirements for convenient access to library services.
3. Users’ satisfaction, expectations and suggestions for Intelligent Libraries (IL) and
‘FastBook’ stations
(1)Average overall satisfaction of IL is similar to that of the ‘FastBook’ stations, which is
between “no comments” and “satisfied”.
(2)Satisfaction at IL-5 (Bailing IL) and IL-3 (Songshan Airport IL) are highest, between
“satisfied” and “very satisfied”; overall satisfaction of FB-3 (Taipei City Hall FastBook) is
the highest.
(3)Satisfaction with different aspects between IL and ‘FastBook’ stations varies - it may
be higher or lower.
(4)The majority of users want additional IL and‘FastBook’stations at MRT stations.
(5)The majority of users want increased bestseller books in IL and ‘FastBook’ stations.
(6)Users expect that IL and ‘FastBook’ stations can provide the service of taking reserved
books.
(7)Users want improved book shelving at IL to reduce the situation of being unable to find
needed books.
(8)Users expect that ‘FastBook’ stations have the functionality to support online inquiry
of personal borrowing records.
Acknowledgement:
Sponsored by Prof. Margaret Chang Fung Traveling Fellowship from Library Association of
the Republic of China (Taiwan) for participating the session of the 80th IFLA General
Conference and Assembly in Lyon, 2014.
English language version revised by Sharan Harvey
27
REFERENCES
1. Chinese
万娜、李卫珊(2008)。城市街区自助图书馆营运模式及统计数据分析。深圳图书
馆 , 2013 年 2 月 27 日 , 取 自
http://www.publiclib.org.cn/library/periodical_show/1144.html。
王明玲(2008)。盛港社區圖書館:新加坡第一個自助圖書館(無人服務圖書館 )。
國家圖書館館訊,97(2),31-33。
东 莞 图 书 馆 ( 2009a ) 。 自 助 图 书 馆 。 2013 年 3 月 5 日 , 取 自http://www.dglib.cn/Service_Detail-Id-2120.html
东 莞 图 书 馆 ( 2009b ) 。 图 书 馆 ATM 。 2013 年 5 月 23 日 ,
http://www.dglib.cn/Service_Detail-Id-2121.html
叶少青(2012)。东莞 24 小时自助图书借阅服务形态及效益分析。2013 年 3 月 7 日
,取自 http://www.dlf.net.cn/manager/manage/photo/admin201201004.pdf
刘冬林、谭志合(2010)。深圳全市布点 40 个自助图书馆的启示。图书馆工作与研
究,2010(3),93-95。
何兰满(2011)。自助图书馆及其社会职能的实现-以「城市街区 24 小时自助图书
馆」为例。新世纪图书馆,2011(3),40-44。
佛山市图书馆(2012)。广东佛山市联合图书馆首批自助图书馆齐开馆。中国图书馆
学 会 , 2013 年 3 月 7 日 , 取 自 http://www.lsc.org.cn/CN/News/2012-
12/EnableSite_ReadNews1631062681356624000.html
李卫珊(2009)。城市街区 24小时自助图书馆的服务及运营管理。2013年 3月 7日,
取自 http://wenku.baidu.com/view/3369950e763231126edb11a8.html
肖宇锋、江洪(2011)。我国自助图书馆服务理论与实践现状分析。图书馆学研究,
2011(9),60-63。
南宁市图书馆(2013)。南宁市图书馆“24小时自助图书馆”启用。2013年 3月 5日,
取自 http://www.nnlib.com/viewarticle.aspx?id=2154&cid=4
钟新革(2009)。自助图书馆现状、功能与问题探讨。圖書館雜誌,28(5),35-
36。
唐倩(2009)。图书馆自助服务发展历程及典型个案。新世纪图书馆,2009(6),
45-48。
徐秋(2011)。自助图书馆在免费开放中的作用-以沈阳市和平区自助图书馆为例。图
书馆学刊,2011(5),77-79。
深圳图书馆(n.d.)。深圳图书馆 2012 年度工作报告。2013 年 5 月 23 日,取自http://www.szlib.gov.cn/about_report.jsp?cid=207
黄 进 ( n.d. ) 。 浅 谈 图 书 馆 的 自 助 服 务 。 2013 年 5 月 3 日 , 取 自http://www.qwqk.net/?action-viewnews-itemid-53653
鄭敦仁、吳松(2011)。澳門、香港、深圳、廈門主要圖書館參訪紀要。國家圖書館
館訊,100(2),9-11。

28
陈秀军(2010)。公共图书馆自助服务利弊分析与研究-以沈阳市和平区自助图书馆为例。2013年 3月 7日,取自 http://www.docin.com/p-125210460.html
2. English
Aljunied, Zahra & Choh, Ngian Lek (2004). A totally self-help library- prototype and
management: the Singapore experience. Retrieved March 13, 2013, from
http://www.docstoc.com/docs/48261502/A-Totally-Do-It-Yourself-Library---Prototype-
and-Management
Contra Costa County Library (2009). Contra Costa County Library receives 2 awards for
Library-a-Go-Go service. Retrieved May 23, 2013, from
http://ccclib.org/press_releases/oitpaward.html
Edmonton Public Library (2010). Edmonton Public Library opens lending machine at LRT
station. Retrieved March 23, 2013, from http://www.epl.ca/releases/2010-Sep-21%20-
%20Library%20Opens%20Lending%20Machine%20at%20LRT%20Station
Edmonton Public Library (n.d.). 2012 annual report. Retrieved March 17, 2013, from
http://www.epl.ca/sites/default/files/pdf/annual-
reports/eplannual2012.pdf#search=vending machine
Fort Vancouver Regional Library District (2012a). Grand opening of Yacolt Library Express
set for Oct. 20. Retrieved March 17, 2013, from
http://mylibrary2.fvrl.org/about/news/2012_1008-YacoltLibraryExpressGrandOpening-
rel.pdf
Fort Vancouver Regional Library District (2012b). Library district and town of yacolt plan
first “Library Express” facility. Retrieved March 17, 2013, from
http://mylibrary2.fvrl.org/about/news/2012_0529-YacoltLibraryExpressPlanned-rel.pdf
Fullerton Public Library (2012). FPL station. Retrieved May 23, 2013, from
http://fullertonlibrary.org/wp-content/uploads/2012/06/Publication1.pdf
http://www.kcls.org/about/annualreport/archives/2009%20YIR%20&%20Annual%20Report
%20Final.pdf
Lasota, Anna & Fellow, Rovelstad (2003). Staff-free libraries: Singapore's experiment
in "Cybrarianship". Retrieved March 13, 2013, from
http://www.clir.org/pubs/issues/issues35.html/issues35.html#anna
MacEwan (2013). Edmonton Public Library lending machine has arrived at city centre
campus!. Retrieved March 23, 2013, from http://library.macewan.ca/node/1080
Mid-Continent Public Library (2011). Budget message. Retrieved March 3, 2013, from
http://www.mymcpl.org/_uploaded_resources/Proposed_Budget_2011-2012_2.pdf
Mid-Continent Public Library (2012). 2010-2011 annual report. Retrieved March 22, 2013,
from http://www.mymcpl.org/_uploaded_resources/2011_annual_report_for_web.pdf
Mid-Continent Public Library (n.d.). Library-To-Go. Retrieved March 3, 2013, from
http://www.mymcpl.org/about-us/library-to-go
Monley (2011). Vending machine collection dispensers in libraries. Retrieved April 2, 2013,
from
http://www.plconnect.slq.qld.gov.au/__data/assets/pdf_file/0018/230517/SLQ_Library-
Vending-facilities_2011-07.pdf

29
National Library Board Singapore (2005). Sengkang Community Library. Retrieved March
13, 2013, from http://infopedia.nl.sg/articles/SIP_671_2005-01-24.html
National Library Board Singapore (2013). Library@chinatown - NLB's first community
supported library. Retrieved March 13, 2013, from
http://www.nlb.gov.sg/page/PlMicrositeContent/LibraryGuidePage#cnpl
Oder (2009). King County Library System opens unstaffed "Express" Branch. Retrieved
March 19, 2013, from http://www.libraryjournal.com/article/CA6710470.html
Orange County Register (2012). Fullerton installs $35,000 book vending machine. Retrieved
May 23, 2013, from http://www.ocregister.com/articles/machine-359831-books-
library.html
Ottawa Public Library (n.d.). Kiosk. Retrieved March 23, 2013, from
http://biblioottawalibrary.ca/en/library/kiosk
Peninsula Library System (n.d.). Free2 Read and Ride. Retrieved May 23, 2013, from
http://www.plsinfo.org/libdispenser
Sanford, Cathy E. (2008). Contra Costa County Library brings Book-Dispensing Machines to
U.S. Retrieved March 23, 2013, from
http://ccclib.org/locations/marketinglibraryservices.pdf
Solo, Crash (2012). Yacolt Library Express Tour. Retrieved March 23, 2013, from
http://www.youtube.com/watch?v=nzmarKbEuM4
Urban Libraries Council (n.d.). Opl library kiosk service. Retrieved March 17, 2013, from
http://www.urbanlibraries.org/opl-library-kiosk-service-innovation-667.php?page_id=89