Embed Size (px)
Citation preview

ASSESSMENT OF THE IMPACT OF
ORGANIZATIONAL CULTURE ON EMPLOYEE
CREATIVITY;
A CASE STUDY OF MINKAH-PREMO & CO
By
Twumasi-Ankrah, Christopher
(PG4147810)
A Thesis submitted to the Centre for Distance and
Continuing Education, Kwame Nkrumah University of
Science and Technology in partial fulfillment of the
requirements for the degree of
COMMONWEALTH EXECUTIVE MASTERS OF BUSINESS
ADMINISTRATION
September 2012
ii
DECLARATION
I hereby declare that this submission is my own work towards the Executive Masters
of Business Administration and that, to the best of my knowledge, it contains no
material previously published by another person nor material which has been
accepted for the award of any other degree of the University, except where due
acknowledgment has been made in the text.
Christopher Twumasi-Ankrah ………………… ……………………
Student Name & ID Signature Date
Certified by:
Dr. Kwame Asamoah ………….......... ……………………
Supervisor(s) Name Signature Date
Certified by:
Prof. I. K. Dontwi ………………… ………………….
Dean, IDL Signature Date
iii
ABSTRACT
This study examined the impact of organizational culture on employee
creativity, using Minkah-Premo & Co (MPAC) as a case study. This case study and
questionnaire-interview based research employed the convenience and purposive
sampling techniques to select a sample of 40 employees out of which 32 responded
to and returned the research questionnaire. The Holistic Management (KEYS) Model
(2000) was used in analyzing the organizational culture of MPAC, it came out that,
the culture of MPAC was not open to creativity. Pearson‘s Correlation coefficient of
(0.716) on the data gathered, showed a strong and positive relationship between
organizational culture and employee creativity. Employee creativity was positively
related to supervisor-rated employee job performance. Employee autonomy had the
greatest and positive impact on creativity whilst financial reward (for creative work)
was negatively correlated with employee creativity. Based on this study, it was
concluded that; organizational culture impacts employee creativity positively with
‗autonomy‘ having the most impact on creativity. Besides, it was affirmed that there
exist a positive correlation between employee creativity and job performance.
iv
DEDICATION
This Research is dedicated to Victor Twumasi Blay (my brother) whose immense
help in the house gave me ample time and freedom to undertake this study.
v
ACKNOWLEDGEMENTS
I would like to thank Dr. Kwame Asamoah, my Supervisor who helped me in
streamlining the thoughts advanced herein with useful comments, suggestions,
guidance and encouragement and hence, making this study fruitful.
I would also like to thank Mr. Justice Minkah-Premo (Managing Partner of
Minkah-Premo & Co [MPAC]), management and other staff and especially Mr.
Robert Dodoo (H.R.M) of MPAC for: first, allowing me to use their law firm as the
case for this study, and second, for their cooperation and immense support in the data
gathering stage of this study.
I would like to acknowledge my family and especially Victor Twumasi Blay,
for relieving me of ‗familiar‘ stress. The freedom, which came from such release,
gave me the impetus to complete this study.
Last but not the least, I would especially like to thank the School of Graduate
Studies (KNUST) and all their representatives who tutored and guided me through
out the entire duration of this study.
vi
TABLE OF CONTENTS
TITLE PAGE ……………………………………………………………………..i
DECLARATION ………………………………………………………………....ii
ABSTRACT ……………………………………………………….......................iii
DEDICATION …………………………………………………………………...iv
ACKNOWLEDGEMENTS ……………………………………………………....v
TABLE OF CONTENTS ………………………………………………………...vi
LIST OF TABLES …………………………………………………………….....ix
LIST OF FIGURES …………………………………………………………….....x
LIST OF ABBREVIATIONS ……………………………………………………xi
CHAPTER ONE ……………………………………………………………………1
INTRODUCTION …………………………………………………………………,1
1.1 BACKGROUND TO THE STUDY ………………………………………….1
1.2 STATEMENT OF THE PROBLEM……………………………………….....3
1.3 OBJECTIVES OF THE STUDY ……………………………………………..4
1.4 RESEARCH QUESTIONS …………………………………………………...5
1.5 SIGNIFICANCE OF THE STUDY.…………………………………………..5
1.6 ORGANIZATION OF THE STUDY ………………………………………...6
1.7 LIMITATION OF THE STUDY ……………………………………………..7
CHAPTER TWO …………………………………………………………………...8
LITERATURE REVIEW ………………………………………………………….8
2.1 INTRODUCTION …………………………………………………………….8
2.2 ORGANIZATIONAL CULTURE AND ORGANIZATIONAL CLIMATE…8
2.3 EMPLOYEE CREATIVITY AND ORGANIZATIONAL INNOVATION...14
2.4 ORGANIZATIONAL CULTURE AND EMPLOYEE CREATIVITY……..17
2.5 RELATIONSHIP BETWEEN EMPLOYEE CREATIVITY AND
PERFORMANCE.............................................................................................25
2.6 SUMMARY OF LITERATURE …………………………………………….26
CHAPTER THREE ……………………………………………………………….29
METHODOLOGY ………………………………………………………………..29
3.1 INTRODUCTION …………………………………………………………...29
3.2 THE STUDY AREA ………………………………………………………...29
3.3 POPULATION AND SAMPLING TECHNIQUES ………………………...29
3.4 DATA COLLECTION PROCEDURE.……………………………………...31
3.5 RESEARCH INSTRUMENTS ……………………………………………...32
3.6 RESEARCH DESIGN ………………………………………………………33
3.7 DATA ANALYSIS ………………………………………………………….33
3.8 PROFILE OF CASE …………………………………………………………36
vii
CHAPTER FOUR ………………………………………………………………...37
ANALYSIS, DISCUSSION & PRESENTATION OF RESULTS………...........37
4.1 INTRODUCTION …………………………………………………………...37
4.2 OPENNESS OF MPAC‘S CULTURE TO CREATIVITY ………………....37
4.3 RELATIONSHIP BETWEEN ORGANIZATIONAL & EMPLOYEE
CREATIVITY ……………………………………………………………….40
4.4 CONSTITUENTS OF CULTURE THAT IMPACT EMPLOYEE
CREATIVITY ……………………………………………………………….40
4.5 EMPLOYEE CREATIVITY AND PERFORMANCE ……………………..42
4.6 DISCUSSION OF RESULTS ……………………………………………….43
CHAPTER FIVE ………………………………………………………………….46
SUMMARY OF FINDINGS, CONCLUSIONS & RECOMMENDATIONS…46
5.1 SUMMARY OF FINDINGS ………………………………………………...46
5.2 CONCLUSION ………………………………………………………………48
5.3 RECOMMENDATIONS …………………………………………………….48
REFERENCES …………………………………………………………………..51
APPENDIXES ...…………………………….…………………………………...56
viii
LIST OF TABLES
Table 2.1 Population of MPAC…………………………………………………...30
Table 4.1 The Holistic Management Pty Key…………………………………… 60
Table 4.2 Raw data from survey on culture open to creativity…………………...61
Table 4.3 Analysis of organizational culture data by Staff Category…………….38
Table 4.4 Openness of organizational culture to creativity………………………38
Table 4.5 Departmental Analysis of the openness of the culture to creativity…...39
Table 4.6 Raw data on employee creativity………………………………………63
Table 4.7 Raw data matching Organizational Culture with Employee Creativity..64
Table 4.8 Raw data matching creativity with the constituents of culture ………..65
Table 4.9 Correlation between the constituents of organizational culture &
creativity ………………………………………………………………..41
Table 5.0 Correlation between employee creativity & performance……………..42
ix
LIST OF FIGURES
Figure 3.1 Organizational Structure of MPAC…………………………………..36
Figure 4.1. A culture not open to creativity……………………………………...62
x
LIST OF ABREVIATIONS
ATNMY - Autonomy
CHLNGS – Internal Challenges
CORR – Correlation
C. RATING – Creativity Rating
C.R – Client Relations
FIN RD – Financial Reward for Creativity
FORM – Formalization
GSD – General Services Department
HR – Human Resource
H.R.M – Human Resource Manager
ID – Participant Identity Number
IT – Information Technology
LDRSHP – Leadership
MPAC – Minkah-Premo & Co
O. C RATING – Organizational Culture Rating
RECOG – Recognition for Creativity
RES – Resource Allocation
S&C – Secretarial and Courier
ST. – Statement
SUP RES – Supervisor‘s Respect
TEAM – Team Dynamics
WRK LD – Workload

1
CHAPTER ONE
INTRODUCTION
1.1 BACKGROUND
A great deal has been written about organizational culture, its impact on the
effectiveness of the organization and its relevance to strategic issues as well as
corporate success. However, because of its profound role in influencing
organizational behavior, organizational culture can mark out the difference between
strategic success and failure hence the need to explore it into detail. Since the
organization‘s source of competitive advantage lies with its employees, what they
believe and how they behave influence the organization‘s success. It is therefore
imperative that managers do well to understand the culture in their organizations.
Organizational creativity and innovation are closely related sets of activities
that involve the development of new ideas with subsequent application. Based on the
work of a number of authors, (Amabile, 1988; Kanter, 1988; Woodman et al., 1993),
the creativity and innovation process can be considered as involving multiple facets.
Creativity begins with problem recognition, which leads to the generation of novel
ideas, products, services, or processes by an individual or group of individuals. At
this stage the process shifts from one of generation of a new idea or solution to
implementation within the larger organization. This requires organizational
innovation, which involves further development of novel ideas and putting them to
use in the organization. Although recognizing that organizational creativity and
innovation are closely intertwined, my focus will be on relationships between
organizational culture and creativity. A wide range of organizational attributes in
addition to culture and climate are necessary for effective organizational innovation
2
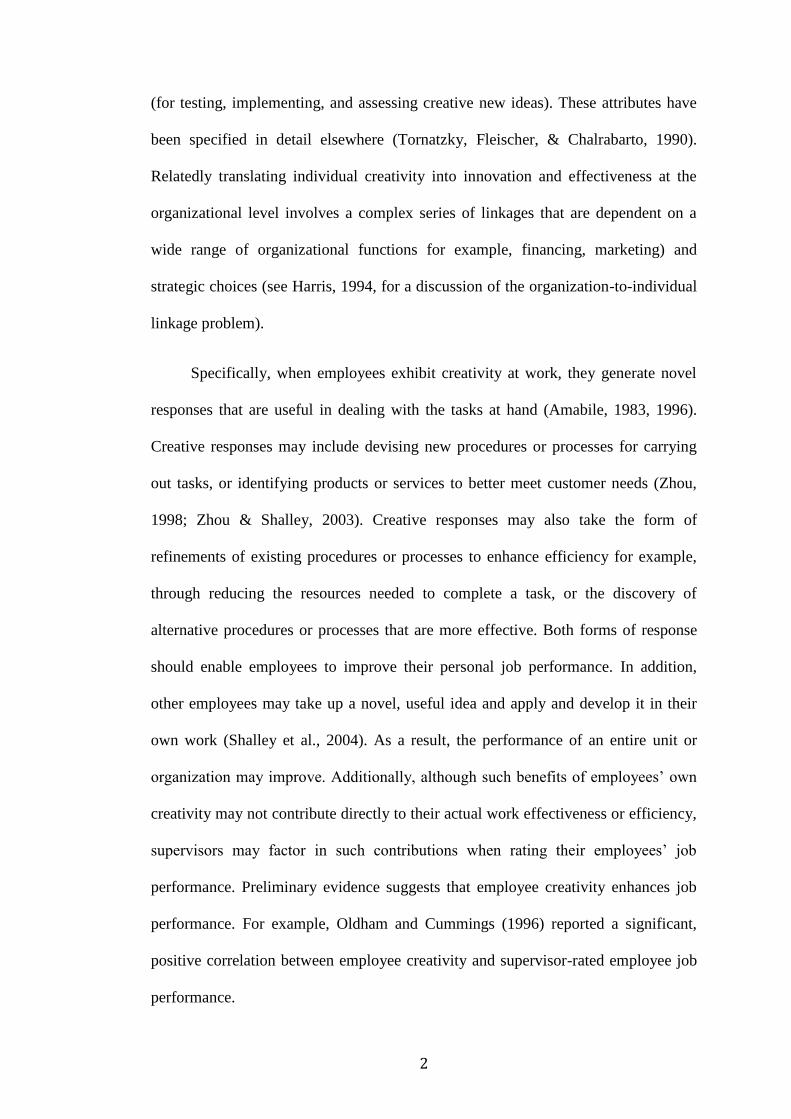
(for testing, implementing, and assessing creative new ideas). These attributes have
been specified in detail elsewhere (Tornatzky, Fleischer, & Chalrabarto, 1990).
Relatedly translating individual creativity into innovation and effectiveness at the
organizational level involves a complex series of linkages that are dependent on a
wide range of organizational functions for example, financing, marketing) and
strategic choices (see Harris, 1994, for a discussion of the organization-to-individual
linkage problem).
Specifically, when employees exhibit creativity at work, they generate novel
responses that are useful in dealing with the tasks at hand (Amabile, 1983, 1996).
Creative responses may include devising new procedures or processes for carrying
out tasks, or identifying products or services to better meet customer needs (Zhou,
1998; Zhou & Shalley, 2003). Creative responses may also take the form of
refinements of existing procedures or processes to enhance efficiency for example,
through reducing the resources needed to complete a task, or the discovery of
alternative procedures or processes that are more effective. Both forms of response
should enable employees to improve their personal job performance. In addition,
other employees may take up a novel, useful idea and apply and develop it in their
own work (Shalley et al., 2004). As a result, the performance of an entire unit or
organization may improve. Additionally, although such benefits of employees‘ own
creativity may not contribute directly to their actual work effectiveness or efficiency,
supervisors may factor in such contributions when rating their employees‘ job
performance. Preliminary evidence suggests that employee creativity enhances job
performance. For example, Oldham and Cummings (1996) reported a significant,
positive correlation between employee creativity and supervisor-rated employee job
performance.
3
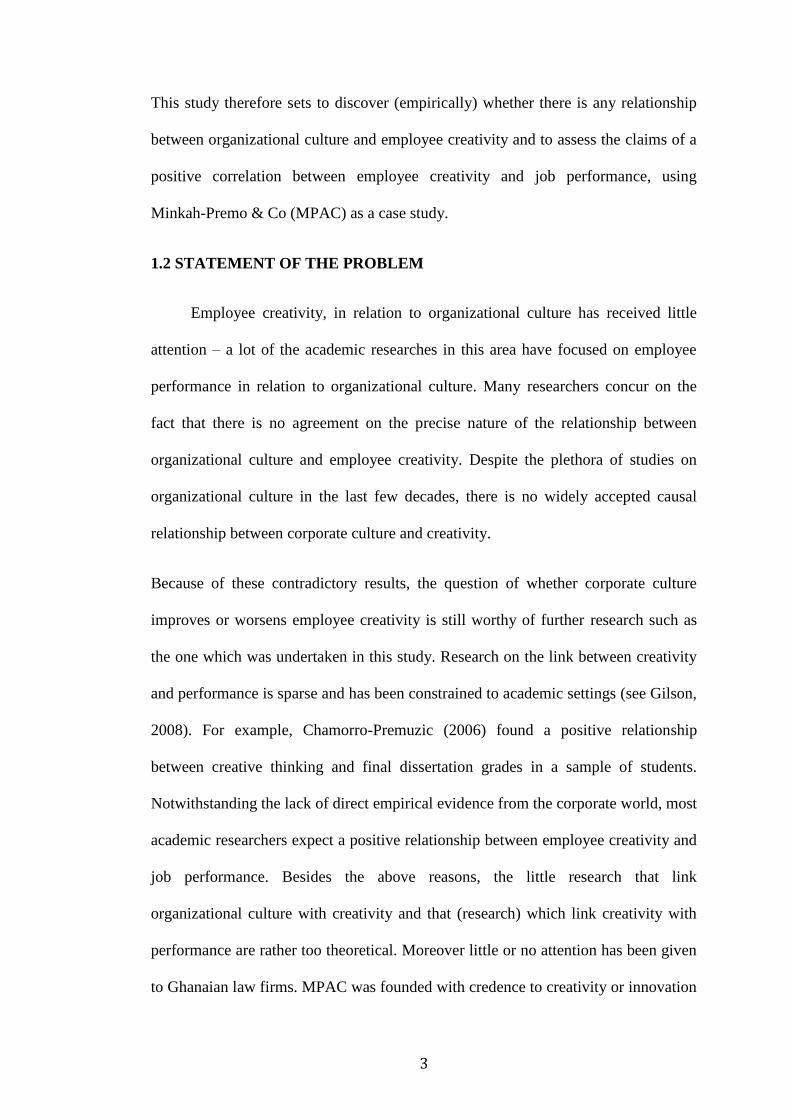
This study therefore sets to discover (empirically) whether there is any relationship
between organizational culture and employee creativity and to assess the claims of a
positive correlation between employee creativity and job performance, using
Minkah-Premo & Co (MPAC) as a case study.
1.2 STATEMENT OF THE PROBLEM
Employee creativity, in relation to organizational culture has received little
attention – a lot of the academic researches in this area have focused on employee
performance in relation to organizational culture. Many researchers concur on the
fact that there is no agreement on the precise nature of the relationship between
organizational culture and employee creativity. Despite the plethora of studies on
organizational culture in the last few decades, there is no widely accepted causal
relationship between corporate culture and creativity.
Because of these contradictory results, the question of whether corporate culture
improves or worsens employee creativity is still worthy of further research such as
the one which was undertaken in this study. Research on the link between creativity
and performance is sparse and has been constrained to academic settings (see Gilson,
2008). For example, Chamorro-Premuzic (2006) found a positive relationship
between creative thinking and final dissertation grades in a sample of students.
Notwithstanding the lack of direct empirical evidence from the corporate world, most
academic researchers expect a positive relationship between employee creativity and
job performance. Besides the above reasons, the little research that link
organizational culture with creativity and that (research) which link creativity with
performance are rather too theoretical. Moreover little or no attention has been given
to Ghanaian law firms. MPAC was founded with credence to creativity or innovation
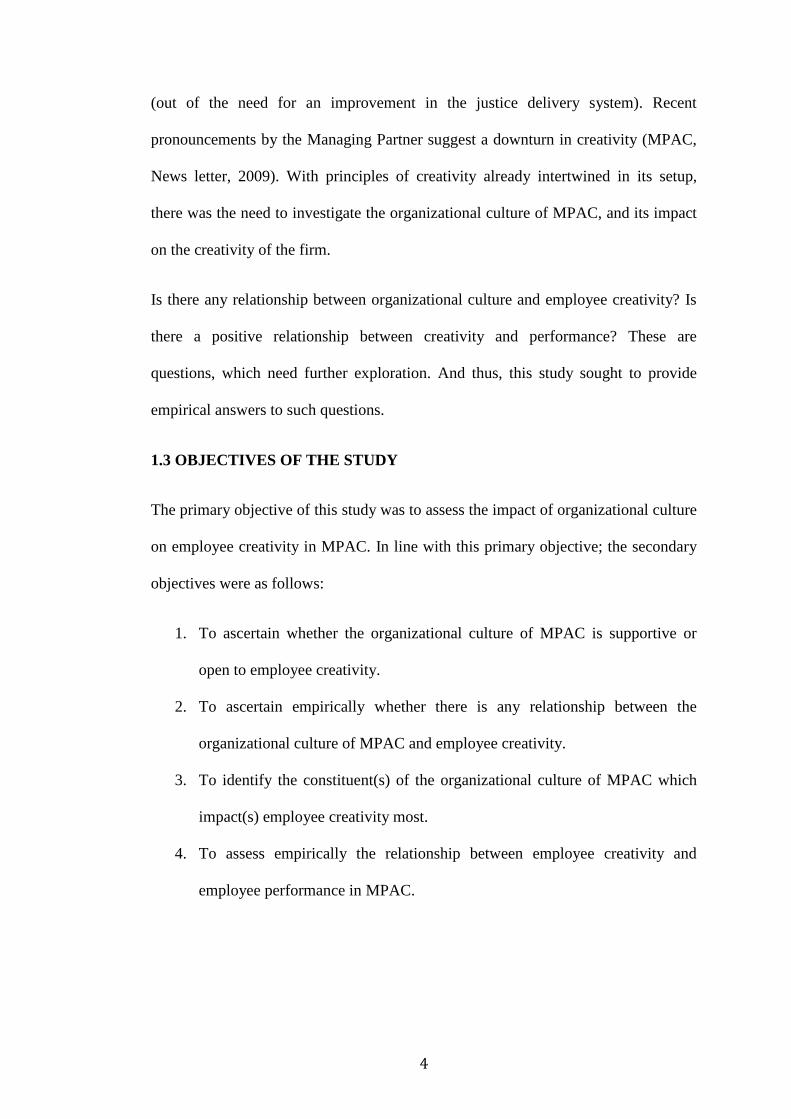
4
(out of the need for an improvement in the justice delivery system). Recent
pronouncements by the Managing Partner suggest a downturn in creativity (MPAC,
News letter, 2009). With principles of creativity already intertwined in its setup,
there was the need to investigate the organizational culture of MPAC, and its impact
on the creativity of the firm.
Is there any relationship between organizational culture and employee creativity? Is
there a positive relationship between creativity and performance? These are
questions, which need further exploration. And thus, this study sought to provide
empirical answers to such questions.
1.3 OBJECTIVES OF THE STUDY
The primary objective of this study was to assess the impact of organizational culture
on employee creativity in MPAC. In line with this primary objective; the secondary
objectives were as follows:
1. To ascertain whether the organizational culture of MPAC is supportive or
open to employee creativity.
2. To ascertain empirically whether there is any relationship between the
organizational culture of MPAC and employee creativity.
3. To identify the constituent(s) of the organizational culture of MPAC which
impact(s) employee creativity most.
4. To assess empirically the relationship between employee creativity and
employee performance in MPAC.
5
1.4 RESEARCH QUESTIONS
Based on the problem statement, the following research questions were asked:
1. How open is the organizational culture of MPAC to creativity?
2. How does Organizational culture of MPAC impact on employee creativity?
3. Which of the constituent(s) of the organizational culture of MPAC impact(s)
employee creativity most?
4. How does employee creativity impact on employee performance in Minkah-
Premo & Co?
1.5 SIGNIFICANCE OF THE STUDY
The study discussed the all-encompassing nature of organizational culture and
its influence or impact on organizational creativity with particular reference to
MPAC. Moreover, the research was intended to offer empirical verification of what
academic research has offered on the relationship between employee creativity and
performance. In light of these, the goals of this Research were threefold. First, the
study offered a theoretical framework that described how organizational culture and
climate operate together in conjunction with organizational structures, most notably,
human resource practices, to form a larger organizational context for behavior in
organizations. Second, using this framework, the study unearthed the empirical
linkages between organizational culture and individual or employee creativity. Third,
based on this review and integration, some directions are suggested for future
research and practice for understanding and developing a culture and climate for
creativity in organizations. The researcher chose MPAC because; in any category of
activity involved in the organized association of law firms in Ghana, MPAC features
as either the trendsetter or one of the best law firms (Company Profile, MPAC,
6
2007). The economic benefits Ghana stands to gain from this study are enormous:
Firstly, if it is established (from this research) that there is a relationship between the
organizational culture of MPAC and the creativity of its employees, then MPAC will
have the impetus to adjust its culture accordingly in order to enhance creativity.
Since MPAC is a pace setter in the industry of law firms (Company Profile, MPAC,
2007), this enhanced creativity will eventually trickle down to most firms in the
industry.
Secondly, improved creativity will consequently lead to the introduction of new
products, which will give the government of Ghana new and greater tax
opportunities. Likewise, improved creativity will then impact job performance
greatly and thereby promoting efficiency and effectiveness in the work environment.
1.6 LIMITATION OF THE STUDY
The study is limited first by confining it to MPAC. Different studies showed
aspects where different industries behaved differently, and therefore it was not clear
that the findings of this study could be generalized to other industries (Stevens &
Burley, 1997), and therefore this study was limited to the industry of Ghanaian law
firms. The convenience sampling technique that was used to arrive at the sample
population may also be seen as a limitation as it might have led to the use of a
sample, which was uncharacteristic of the population. Besides, this study did not
employ objective employee job performance measures in view of the fact that, only
few of the employees or staff of MPAC were involved in work that directly
contributed to sales and thus made it so arduous a task to measure performance
objectively.
7
1.8 ORGANIZATION OF THE STUDY
The following chapters are organized as follows: Chapter one contains a
background to the study, the research problem, research objectives and questions. It
also discussed the research scope, significance and limitation of the research.
Chapter two contains a review of the literature on organizational culture, innovation
and creativity, and employee job performance. It addressed the differences and
relationship between the terms organizational culture and climate and innovation and
creativity. Chapter three describes the research methodology and design that were
used in this study. Chapter four includes the results from the study. Finally, Chapter
five includes the conclusions from the study, a summary of the findings and
recommendations.
8
CHAPTER TWO
LITERATURE REVIEW
2.1 INTRODUCTION
Whilst there exist abundant material, which center on organizational culture,
this study concentrated on material or literature that related the employee creativity.
In order to develop a reliable conceptual framework for this study, the literature
review touched on the salient or most important subject areas namely: organizational
culture, employee creativity and employee performance. In order to avoid
unnecessary confusion, the pain was taken to highlight the linkages and distinctions
between organizational culture and organizational climate on the one hand, and
employee creativity and innovation on the other hand.
2.2 ORGANIZATIONAL CULTURE AND ORGANIZATIONAL
CLIMATE.
Organizational culture has been defined as the ―normative glue‖ that holds an
organization together (Tichy, 1982). Forehand and von Gilmer (1964) suggest that
culture is the set of characteristics that describe an organization and distinguish it
from others. Schein (1990), in a more comprehensive fashion defines culture as
values and behaviors that are believed to lead to success and are thus taught to new
members. The study agrees more with the definition provided by Forehand and von
Gilmer (1964) to the extent that, it is the culture of the organization that distinguishes
it from another. The definition of (Tichy, 1982), culture as the ―normative glue‖,
appears to be an inadequate definition for organizational culture by virtue of the fact
that organizational culture can be a strong divisive force or instrument in the
organization as well. To look at organizational culture as consisting only of positive
9
norms or traditions (of an organization) which are transmitted consciously from
management to other employees is coterminous to trying to eliminate the aspects of
culture (negative or positive) which members of the organization imbibe
unconsciously for being part of the organization. The definition of Schein (1990), as
stated above also fails to give credence to the fact that, the culture of an organization
may encapsulate negative or unhealthy values or traditions which may not
necessarily lead to success and thus are not consciously taught but get assimilated by
members of the organization unconsciously.
Central to the culture definition is the idea that culture must be learned and
shared (Titiev, 1959). The culture of a group can be defined as:
“A pattern of shared basic assumptions that the group learned as it solved its
problems of external adaptation and internal integration, that has worked well
enough to be considered valid and therefore, to be taught to new members as the
correct way to perceive, think, and feel in relation to those problems. (Schein,
1990).”
In other words, as groups evolve over time, they face two basic challenges:
integrating individuals into an effective whole, and adapting effectively to the
external environment in order to survive. As groups find solutions to these problems
over time, they engage in a kind of collective learning that creates the set of shared
assumptions and beliefs called ―culture.‖
However, Schein‘s (1990) definition of group or organizational culture is some
what myopic because, group or organizational culture may also result from the
group‘s inability to solve its problems of external adaptation and internal integration.
Besides, organizational culture may also encapsulate values or norms that have not
been proven to work well enough in order to warrant them been taught to new
members. Thus, organizational culture may also include the wrong way to perceive,
10
think, and feel and which despite not being taught consciously or formally, may be
imbibed by members unconsciously.
Morgan, 1997 describes culture as:
“an active living phenomenon through which people jointly create and recreate the
worlds in which they live.”
For Morgan, the three basic questions for cultural analysts are:
i. What are the shared frames of reference that make organizations possible?
ii. Where do they come from?
iii. How are they created, communicated, and sustained?
The definition postulated above by Morgan (1997) gives a vivid picture of what
organizational culture encapsulates. It points to the role of people, the importance of
communication and values or traditions that underpin the organization as important
ingredients in developing and sustaining organizational culture.
There are elements of the organization‘s culture that are ‗on the surface‘ and
are relatively easily visible. We can see many cultural symbols (for example,
whether your office is on a floor close to the top or the bottom of the building, how
big your office is), artifacts and patterns of behavior (example, how and where
people interact, how they behave in formal and informal meetings). Equally
important, but less visible aspects of culture are norms, values and basic assumptions
people make. Another way of conceptualizing organizational culture is in terms of its
‗hard‘ and its ‗soft‘ sides. Organizational culture is ‗supported‘ by both social or
psychological aspects for example, stories, symbols, rituals (soft side) and by some
11
more concrete elements such as power structures, hierarchical structure and control
systems such as, financial, assessment and reward systems (hard side).
Organizational culture has been linked to economic performance and
organizational viability or success (Sorensen, 2002; Devis, 2007). For example
organizations dedicated to continuous improvement, with visionary leaders who
‗walk their talk‘ and focus on a set of core values, have been shown to be more
financially successful in the long-term (Kotter & Heskett, 1992). I also believe that
the opposite of this assertion is also true; organization culture can also cause the
doom for an organization appertaining to its economic performance. This is to say
that, scholars must not lose sight of the fact that the culture of an organization can
either be positive or negative and thus a negative culture can equally impact
economic performance negatively.
Various studies indicate that companies with strong cultures are more likely to
be successful, but only under a particular set of conditions. The effect of
organizational culture depends partly in its strength. Organizational culture strength
refers to how widely and deeply employees hold the company‘s dominant values and
assumptions. In a strong organizational culture, most employees across all subunits
hold the dominant values. These values are also institutionalized through well-
established artifacts, thereby making it difficult for those values to change.
Furthermore, strong cultures tend to be long lasting; some can be traced back to
company founder‘s values and assumptions.
In contrast, companies have weak culture when the dominant values are short-
lived and held mainly by a few people at the top of the organization. A strong
12
organizational culture potentially increases a company‘s success by serving three
important functions (Olu, 2009):
i. Control System: organizational culture is a deeply embedded form of social
control that influences employee decisions and behavior. Culture is pervasive
and operates unconsciously.
ii. Social glue: organizational Culture is the „social glue‟ that bonds people
together and makes them feel part of the organization‟s experience.
Employees are motivated to internalize the organization‟s dominant culture
because this helps fulfill their need for social identity. This social glue is
increasingly important as a way to attract new staff and retain top
performers.
iii. Sense making: organizational culture assists the sense-making process. It
helps employees understand what goes on and why things happen in the
company. Organizational culture also makes it easier for them to understand
what is expected of them and to interact with other employees who know the
culture and believe in it.
People are constantly surrounded by culture. It forms the background (often
invisible) of our work-lives, coloring everything in an organization. Organizational
culture also provides a powerful mechanism for controlling behavior by influencing
how we attach meaning to our world and how we interpret events.
As already intimated, although often treated interchangeably, culture and
climate are distinct constructs operating at different levels of meaning; yet at the
same time, they are closely interrelated. Culture is the beliefs and values held by
management and communicated to employees through norms, stories, socialization
processes, and observations of managerial responses to critical events (Paul et al,
1997). For example, the beliefs and values that typify a culture for creativity become
manifested in organizational structures, practices, and policies. In turn, these
structures, practices, and policies guide and shape individual creativity by creating a
climate that communicates both the organization's goals regarding creativity and the
means to achieve those goals.

13
Although closely related and interdependent, culture and climate are in fact
distinct constructs that, when considered in combination, can specify with some
precision the contextual environment that impacts behavior in organizations
(Reichers & Schneider, 1990). Denison (1996) asserted that culture is ―the deep
structure of organizations, which is rooted in the values, beliefs and assumptions held
by organizational members‖. That is, when we speak of organizational culture, we
refer to the meanings inherent in the actions, procedures, and protocols of
organizational commerce and discourse. James et al. (2007) described culture as ―the
normative beliefs and shared behavioral expectations in an organization‖.
Following Glisson and James (2002), this study views organizational culture
and climate as distinct but interrelated constructs. According to Beugelsdijk, Koen,
and Noorderhaven (2006), organizational culture is specific to an organization, is
relatively constant, and can influence inter-organizational relations. For these
reasons, organizational culture is widely viewed as a source of sustained competitive
advantage to businesses (Miron, Erez, & Naheh, 2004). Whereas organizational
culture focuses on the shared behavioral expectations and normative beliefs in work
units, climate describes the way individuals perceive the personal impact of their
work environment on themselves (Glisson & James, 2002).
James et al. (2007) differentiate organizational from psychological climate.
Whereas the former is an aggregation of individual perceptions of the work
environment, the latter refers to the perceptions individuals have of those workplaces
as they reflect personal values and psychological desires. In this study, the focus is
more in line with the concept of organizational climate as measured by the
organization‘s openness to change and its provision of resources to become
innovative. Although organizational culture and climate are distinct but interrelated
14
constructs, in this study, these concepts are used interchangeably and as such invoke
the same meaning.
2.3 EMPLOYEE CREATIVITY AND ORGANIZATIONAL
INNOVATION
In contrast with innovation, which is considered an organizational function or
capability, creativity “can only be found in the head of individuals” (Anderson,
1992). Haner (2005) added,
“Individual persons initiate, contribute to and evaluate all parts of creativity and
innovation processes. Their individual efforts and achievements are the basis for
creativity and innovation”. Individual creativity is a component of organizational
creativity, often referred to as “invention”
Montour and Purser (1995), however, criticized the individualistic focus on
creativity. They did not diminish the role of the individual, but put it in context:
“A contextual approach to creativity will almost by necessity be interdisciplinary,
historical, ecological, systemic, and aware of cultural and gender differences, while
at the same time continuing to address personality issues”.
Analysis of their criticism shows that they do, in fact, agree that the creation of the
creative idea is an individual function, although they wanted to emphasize the role
that the organization (and other elements) play in the ability of that individual to
generate the creative idea, although they did not claim that the idea generation occurs
in many people at the same time, or at the organization as an entity.
Abedi (2002) claimed that the lack of a universally acceptable operational
definition of creativity led to the development of multiple instruments to assess
creativity, varying in what they measure. Smith, (2005) defined it as follows:
15
“We judge thought to be creative when it produces something that is both novel and
interesting and valuable”.
Shalley (1995) defined individual creative behavior as:
“Developing solutions to job-related problems that are judged as both novel and
appropriate for the situation”.
Employee creativity is the production of novel and potentially useful ideas for
solving problems, and for developing new products, services, processes, systems,
work methods and etcetera (Amabile, 1988). It is a vital resource for an
organization‘s innovation, and employees at any level in the organization can
contribute to this goal (Madjar et al., 2002; Shalley et al., 2004).
Creativity is defined in this study as the creative human attributes and qualities
concerned with imagination, inventiveness, improvisation, insight, intuition, and
curiosity the natural ‗artful‘ genius and talent of people (Lloyd 2007).
Barron and Harrington (1981) proposed two creativity definition categories:
“Creativity as socially recognized achievement in which there are novel products to
which one can point as evidence, such as inventions, theories, buildings, published
writings, paintings and sculptures and films; laws; institutions; medical and surgical
treatments, and so on; and creativity as an ability manifested by performance in
critical trials, such as tests, contests, etcetera, in which one individual can be
compared with another on a precisely defined scale.”
The terms innovation and creativity have often been confused and used
interchangeably (Turnipseed, 1994). The two most consistent distinctions between
innovation and creativity are: (1) innovation is an organizational function, whereas
creativity is an individual component (Amabile, 1988); and (2) creativity is a
necessary, but not sufficient component of innovation (Basadur & Gelade, 2006;
Basset-Jones, 2005).
Amabile (1988) stated,
16
“Individual creativity and organizational innovation are closely interlocked systems.
Individual creativity is the most crucial element of organizational innovation, but it
is not, by itself, sufficient”.
Bharadwaj and Menon (2000) stated,
“Innovation is a function of individual efforts and institutional systems to facilitate
creativity”.
Basadur and Hausdorf (1996) stated that,
“Both improved and new methods and goods and services result from creativity”.
Basset-Jones (2005) stated, “Creativity is a necessary precondition for successful
innovation”.
Mauzy and Harriman (2003) suggested the simple relationship between creativity
and innovation: “creativity generates ideas, and innovation implements them”, and
Zhou (2003) offered the relationship as a simple formula: “Organizational
innovation = individual creativity + implementation”.
In summary, the relationship between innovation and creativity can be
summarized through (1) innovation is an organizational function while creativity is
an individual one, and (2) innovation is made of the generation of a creative idea,
and the implementation of it. Organizational creativity and innovation are closely
related sets of activities that involve the development of new ideas with subsequent
application. Based on the work of a number of authors (example, Amabile, 1988),
the creativity and innovation process can be considered as involving multiple facets.
Creativity begins with problem recognition, which leads to the generation of novel
ideas, products, services, or processes by an individual or group of individuals. At
this stage the process shifts from one of generation of a new idea or solution to
17
implementation within the larger organization. This requires organizational
innovation, which involves further development of novel ideas and putting them to
use in the organization. In this study, we focus exclusively on creativity.
2.4 ORGANIZATIONAL CULTURE AND EMPLOYEE CREATIVITY
For the purpose of this study, organizational culture means the aggregation of factors
that would potentially affect creativity of individuals within an organization and
these factors include:
2.4.1 Extrinsic and Intrinsic Motivation
Amabile (1998) developed a model of the context for creativity, including
three components: expertise (personal), creative thinking skills (personal), and
motivation (external). She included two types of motivation: extrinsic and intrinsic,
and claimed that motivation (both types) is the easiest for management to influence,
and that it is the most important component of the three (Amabile, 1988). Extrinsic
motivation was defined as external to the task environment, while intrinsic
motivation is contained within the task and the person conducting the task. Shalley
(1995) categorized the conditions for creative behavior relatively similarly, including
ability, certain cognitive activities, and intrinsic motivation (not considering extrinsic
motivation at all). Extrinsic motivation is easier for management to influence than
intrinsic motivation because it is easier to measure and implement. It is made mostly
of financial rewards and promotions, and in general contingent rewards (Benabou &
Tirole, 2003).
King (1990) claimed that in the need hierarchy theory, the state of being
motivated is the equivalent of self-actualization—the highest level in the need
hierarchy. The following discussion reviews two opposing schools: one claimed that
18
intrinsic motivation is conducive to creativity while extrinsic motivation is
detrimental to creativity, and the other claimed that extrinsic motivation promotes
creativity. No position was found that claimed that intrinsic motivation is detrimental
to creativity.
Amabile (1988) posited “the intrinsically motivated state is conducive to
creativity, whereas the extrinsically motivated state is detrimental” (Amabile, 1996).
Benabou and Tirole (2003) contrasted the economic belief that incentives promote
effort and performance with the psychological controversy on the topic. Their paper,
supported by economical mathematics, concluded;
“Explicit incentive schemes may sometimes backfire, especially in the long run, by
undermining agents‟ confidence in their own abilities or in the value of the rewarded
task. This side of social psychology has been largely neglected by economists”.
They further claimed that contingent rewards, due to cognitive dissonance, may be
negative re-enforcers, especially in the long run, and that employees find
contingency rewards an alienating and dehumanizing way of control.
Cummings, Hinton, and Gobdel (1975) characterized the bureaucratic
organization as, among other things, heavily reliant on extrinsic rewards, which,
together with the other characteristics, inhibit creativity. Cummings (1975) explained
this by stating that the extrinsic reward system (money, promotions, status) promoted
conformity and not novelty. They concluded that most dissatisfaction with wages
was based on fairness—differences from other employees, and that wage incentives
failed to work when they were not aligned with social values, thus making both
fairness and social value alignment more important than the rewards themselves.
On the other hand, not all researchers agreed that extrinsic rewards inhibit
creativity. Freeman and Engel (2007) stated that one of the two central elements of

19
innovation is the alignment of incentives. George and Zhou (2002) concluded that
perceived rewards for creative performance acted as a moderator on the positive link
between negative mood and creative performance. The rewards they identified
seemed to be extrinsic, although not contracted, made of pay raises and promotions.
Tellis et al. (2009) found in their multinational study that; incentives for enterprise
(innovation, new business creation) were important practices that allowed
engendering and sustaining radical innovations.
A few additional positions on intrinsic and extrinsic motivation are also worth
mentioning. Basadur and Gelade (2006) claimed that there is a cyclical relationship
between creative activity and motivation. Creative activity increases motivation,
which, in turn, increases the interest in more creative activity.
The following are the intrinsic motivators that through research were shown to affect
individual creativity.
2.4.2 Autonomy and Freedom
Autonomy, freedom, independence, discretion, and self-managing were terms
used interchangeably in the literature to describe a situation where the employee is
given latitude to design his or her task execution without intervention, specifically
from management. Ekvall (1996) defined it as the ―independence in behavior exerted
by the people in the organization‖. Autonomy was claimed theoretically and found
empirically to be one of the most influential antecedents of individual creativity in
work setting (Amabile, 1998; Anderson et al., 2004). McCoy and Evans (2002)
claimed that physical work design (architecture) that is conducive to creativity is
what instills feeling of freedom in a work environment.
20
2.4.3 Support and Encouragement for Creativity
Another important factor affecting employee creativity is the support the
employee is receiving-encouraging him or her to be creative. The employee needs to
feel that being creative is a desired behavior. Different authors focused on different
sources of such support: (1) non-specific organizational support (Anderson et al.,
2004; Basadur & Gelade, 2006); (2) support from management in general and
executive management in particular (Amabile, 1998; Andrew et al., 2008).
2.4.4 Challenge of Job
One of many dictionary definitions for the word “challenge” is: “difficulty in
a job or undertaking that is stimulating to one engaged in it.” Mathisen and Einarsen
(2004) review of creativity climate instruments provided the following definitions for
challenge:
“The degree to which the people of the organization are emotionally involved in its
operations and goals and find pleasure and meaningfulness in their job” and “A
belief that tasks are important and therefore provide a source of motivation, work
that is intellectually challenging”.
Defining challenge as an antecedent of individual creativity suggests that facing
difficulties in a job forces individual employees to find a creative solution.
Sometimes, simply telling someone that something cannot be done is incentivizing
enough to have it done. Amabile made challenge one of the top six antecedents of
creativity (Amabile et al., 1996). This study agrees perfectly with Mathisen and
Einarsen on their notion on challenge as incentive for creativity. However, in as
much as creative people want to feel challenged, they don‘t want to have to surmount
unnecessary obstacles. The former situation inspires greatness; the latter migraines-
hardly an ideal condition for creative thought.
21
2.4.5 Recognition
Recognition has many forms, but in general it is a positive statement made by
one person on another person‘s work product, also associated with appreciation. The
recognition is important and impactful when it comes from a peer, a supervisor, a
senior executive, a respected industry authority, and the more public it is. Users are
motivated to innovation through recognition they get (Ahuja et al., 2008; Amabile,
1988). Ahuja et al. (2008) added that the recognition is important not only as a
temporary feeling, but also as a link to reputation that helps in the job market in the
future. While accepting assertion of Ahuja, it is worth intimating that the opposite of
positive recognition, are obstacles to creativity. George and Zhou (2002) learned that
perceived recognition acts as a moderator of the link between (negative) mood and
creativity. Taylor (1990) claimed that individual recognition is more important than
salaries, bonuses, or promotions to maintain creativity. Although recognition was not
part of the leading organizational creativity climate instruments (Mathisen &
Einarsen, 2004), it was supported by a significant body of research as a positive
antecedent of creativity, and was therefore included as one of the factors explored in
this study.
2.4.6 Resources
Different approaches were taken as far as how resources affected creativity.
Different types of resources were addressed in the literature: financial and budgetary,
materials, time, personnel, tools, facilities, geography, and manufacturing (Andrew
et al., 2008). Andrew et al. (2008) suggest; key people need to be allocated to
innovation, and not just anyone. This ties well with the notion that, some people are
more creative or than others. I strongly disagree with Andrew in respect of the above
22
statement in view of the fact that we are now considering the influences of the
culture of the organization on creativity. His statement would have sufficed if we
were looking at innate motivators of creativity in the individual. Freeman and Engel
(2007) noted that a central element of innovation is the organization‘s ability to
mobilize resources. The conclusion is that the availability of resources (specifically
funding, facilities, materials, people, information, and time) has a positive impact on
creativity, as emerged from prior research.
2.4.7 Team Dynamics
Several factors associated with the dynamics of teamwork were identified by
different studies as antecedents of individual creativity: team cohesion, internal
competition, trust and openness, supportive presence of coworkers, team support,
conflicts and debate, internal communications, and play, humor, and fun. Isaksen and
Lauer (2002) studied team creativity, stating: ―Teams are one of the basic building
blocks of every organization.... considered the most important resource in any
organization.‖ The purpose of their study was to explore the climate for creativity
within the team.
Their study concluded that the most creative teams were characterized by
respect, communications, clear roles and responsibilities, freedom to develop ideas,
―play hard, work harder‖, reaching the goal, enthusiasm, commitment; comfortable
discussing everything, brainstorming to improve others‘ ideas without feelings of
hurt; leading by example, encouraging new ideas, sharing best practices, leader
provided guidance, support, encouragement, and secured support and resources from
outside the team; common, clear, compelling, open, and challenging goals.
23
In contrast, the study found that the least creative teams were characterized
with lack of communication, animosity, jealousy, political posturing; lack of
motivation, initiative, ideas, inability to recognize the value of the end result;
individuals placing their own interests above the team‘s, not listening to other
opinions than own, wanting to finish as quickly as possible; leaders causing
confusion, fear, distrust, kept control; conflicting agendas, different missions, and no
agreement on the end results. Amabile (1988, 1998) identified the qualities of the
team as a factor promoting individual creativity. She further claimed that the intrinsic
task motivation, domain relevant skills, and creativity skills model that applied to
individuals also applied to small teams.
Several theories and research showed the importance of the physical separation
of teams of creative individuals from the rest of the organizations (Amabile, 1998;
Andrew et al., 2008; Freeman & Engel, 2007). Zhou (2003) used the social cognitive
theory (claiming that individuals tend to exhibit the same type of behaviors that they
observe others exhibiting), and in two studies learned that the presence of creative
coworkers moderated (increased) the relationship between supervisory close
monitoring and the level of creativity. In summary, several elements of team
dynamics were shown through research to affect individual creativity of team
members, including conflict and debate, internal competition, trust and openness, and
internal communications.
2.4.8 Structure, Bureaucracy, and Formalization
Ahuja et al. (2008), in a literature review, claimed that bureaucracy stifled
innovation. Dormen and Edidin (1989) suggested that conformity stifled creativity.
Amabile (1988) identified good project management as a factor promoting creativity,
24
but later (Amabile, 1998) added that “creativity is undermined unintentionally every
day in work environments that were established for entirely good reasons to
maximize business imperatives such as coordination, productivity, and control”,
essentially contradicting her earlier statement.
Cummings (1965) specified the features of the bureaucratic organization that
inhibited creativity: discouragement of diversity and conflict, division of labor that
prevents cross- fertilization, intolerance for instability (bi-product of creativity),
whereas the features of the creative organizations included low formalization, high
flexibility, low human resource specificity, and flexible power-authority-influence
structure, all opposite characteristics to the bureaucratic organization.
Damanpour (1991) claimed that formalization does not affect organizational
innovativeness. If creativity is a necessary part of innovativeness, then this finding
goes against the belief that formalization stifles creativity. He did conclude, though,
that decentralization, functional differentiation, and professionalism have positive
effects on innovation. Although the term ―process‖ is associated with bureaucracy
(thus assumed to be stifling creativity), some processes (such as brainstorming and
predicting technology trends) are used to fuel creative thinking (Solomon, 2007).
2.4.9 Leadership
Leadership is an important aspect of the work environment for employees
(Oldham & Cummings, 1996). Transformational leadership describes a class of
behaviors enacted by a leader composed of four dimensions: intellectual stimulation
(challenging the status quo and taking novel approaches to problems), charisma or
idealized influence, inspirational motivation (energizing followers by articulating a
compelling vision), and individualized consideration (supporting, mentoring, and
25
developing followers) (Bass, 1985). From the perspective of social cognitive theory
(Bandura, 1997), transformational leadership represents a critical external factor in
employee learning.
Transformational leaders, by engaging in intellectual stimulation, set the
expectation for creativity and serve as creative role models for employees. Because
transformational leaders are charismatic and inspirational, employees are likely to
attend to and learn from such leaders. Through the influence of behavioral modeling,
transformational leaders enhance followers‘ ability to develop new ideas and
question outmoded operating rules (Bass & Avolio, 1990). Through individualized
consideration, transformational leaders show empathy, consideration, and support for
employees, which should help overcome the fear of challenging the status quo,
leading to higher creativity. Finally, transformational leaders delegate and encourage
follower autonomy and use their greater knowledge and experience to develop their
protégés (Dvir et al., 2002). Such a developmental orientation should enhance
employee learning, and thus creativity.
2.5 RELATIONSHIP BETWEEN EMPLOYEE CREATIVITY AND
PERFORMNCE
Research on the link between creativity and performance is sparse and has
been constrained to academic settings (Gilson 2008). For example, Chamorro-
Premuzic (2006) found a positive relationship between creative thinking and final
dissertation grades in a sample of students. Notwithstanding the lack of direct
empirical evidence from the corporate world, most academic researches have
claimed they expect a positive relationship between employee creativity and job
performance. Specifically, when employees exhibit creativity at work, they generate
novel responses that are useful in dealing with the tasks at hand (Amabile, 1996).
26
Creative responses may include devising new procedures or processes for
carrying out tasks, or identifying products or services to better meet customer needs
(Zhou & Shalley, 2003). Creative responses may also take the form of refinements of
existing procedures or processes to enhance efficiency (through reducing the
resources needed to complete a task), or the discovery of alternative procedures or
processes that are more effective. Both forms of response should enable employees
to improve their personal job performance. In addition, other employees may take up
a novel, useful idea and apply and develop it in their own work (Shalley et al., 2004).
As a result, the performance of an entire unit or organization may improve.
Additionally, although such benefits of employees‘ own creativity may not
contribute directly to their actual work effectiveness or efficiency, supervisors may
factor in such contributions when rating their employees‘ job performance.
Preliminary evidence suggests that employee creativity enhances job performance.
For example, Oldham and Cummings (1996) reported a significant, positive
correlation between employee creativity and supervisor-rated employee job
performance.
2.6 SUMMARY OF LITERATURE
Organizational culture helps in distinguishing one company or institution from
another. It consists of stories, totems, values, norms and practices which all the
members of the organization accept and which shape their perspectives on issues and
the way and manner they respond to their work. Apart from organizational culture
been described as ―normative glue‖, or in other words a strong binding force in an
organization, one must not loose sight of the fact that, it can also be a strong divisive
force in the organization. When the stories, symbols, values and norms that are
common to most people in an organization are highly divisive, then organizational
27
culture for that organization cease to be ―normative glue‖ but suffice to be a divisive
force.
The culture of an organization may be transmitted consciously or imbibed
unconsciously. To look at organizational culture as consisting only of positive norms
or traditions (of an organization) which are transmitted consciously from
management to other employees is coterminous to trying to eliminate the aspects of
culture (negative or positive) which members of the organization imbibe
unconsciously for being part of the organization. This is to say that, organizational
culture, may encapsulate negative or unhealthy values or traditions, which may not
necessarily lead to success and thus are not consciously taught but get assimilated by
members of the organization unconsciously.
Creativity is the creation or generation of an idea or product which is new,
authentic and concrete, and which product or idea when talked about or mentioned
alludes to the creator or generator. Creativity may not necessarily lead to the
development of a new product or idea; it may result in the continuation of a product
or idea already initiated. Creativity in my view lies in the mind- it is a mental activity
and therefore very difficult to be measured. Every physical product initiated is a
result of a mental creative work. Employee creativity is the exhibition of the creative
tendencies as intimated above by an employee. Creativity, as mental and individual
as it can be, does not exist or is not initiated in a vacuum, but needs some
organizational constituents in order for it to be ‗aroused‘. Some of these
organizational constituents are; autonomy and freedom to work, motivational
leadership, rewards for creative work (intrinsic or extrinsic), organizational support
and recognition for creative work, challenge inherent in ones work, adequate supply
28
of organizational resources for productivity, the impact of team dynamics and
etcetera.
Employee creativity must have a corresponding positive impact on employee
performance. For instance, a creative idea can be an idea for reducing the production
time for a particular good or service. Correct implementation of this idea must cut
production time and thereby create efficiency, minimize time wasting and ultimately
improve performance.

29
CHAPTER THREE
RESEARCH METHODOLOGY
3.1 INTRODUCTION
The term methodology is a system of explicit rules and procedures in which research
is based and against which claims of knowledge are evaluated (Ojo, 2009).
Therefore, this section focuses on the research techniques adopted and used for this
study with the aim of achieving the research objectives.
3.2 THE STUDY AREA
This study sought to assess the impact of organizational culture on employee
creativity with MPAC being the case under study. First we defined the boundaries
for the data search area as restricted to the employees or staff of MPAC. In this
study, the perceptions and the attitudes of the staff of MPAC in relation to their
organizational culture and creativity were sought. Data sought on organizational
culture were only relevant to as far as they related to employee creativity. The
independent variable that was studied in this research is ―Organizational Culture‖
with the dependent variable being ―Employee creativity‖ This study therefore
examined the impact of organizational culture on employee creativity and innovation
(specifically the employees of MPAC).
3.3 RESEARCH POPULATION AND SAMPLING TECHNIQUES
MPAC has three offices in: Accra, Kumasi and Tamale, with total staff
strength of 116 (which constitutes the Population of this Study). The staff size of the
particular offices of MPAC is found below:
30
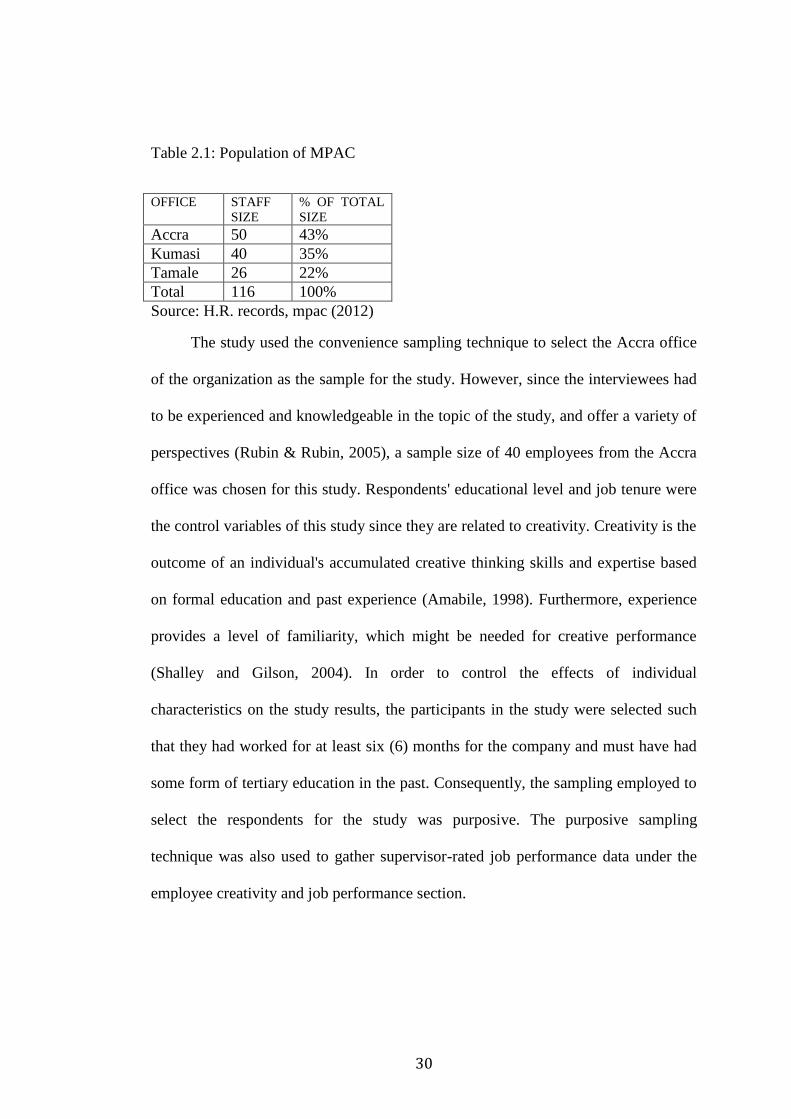
Table 2.1: Population of MPAC
OFFICE STAFF
SIZE
% OF TOTAL
SIZE
Accra 50 43%
Kumasi 40 35%
Tamale 26 22%
Total 116 100%
Source: H.R. records, mpac (2012)
The study used the convenience sampling technique to select the Accra office
of the organization as the sample for the study. However, since the interviewees had
to be experienced and knowledgeable in the topic of the study, and offer a variety of
perspectives (Rubin & Rubin, 2005), a sample size of 40 employees from the Accra
office was chosen for this study. Respondents' educational level and job tenure were
the control variables of this study since they are related to creativity. Creativity is the
outcome of an individual's accumulated creative thinking skills and expertise based
on formal education and past experience (Amabile, 1998). Furthermore, experience
provides a level of familiarity, which might be needed for creative performance
(Shalley and Gilson, 2004). In order to control the effects of individual
characteristics on the study results, the participants in the study were selected such
that they had worked for at least six (6) months for the company and must have had
some form of tertiary education in the past. Consequently, the sampling employed to
select the respondents for the study was purposive. The purposive sampling
technique was also used to gather supervisor-rated job performance data under the
employee creativity and job performance section.
31
3.4 DATA COLLECTION PROCEDURE
Primary data was employed in this study. The primary data collection was
interview based, with the researcher acting as the data collection instrument. The
Data Collection Procedure that was used in this study is presented below;
3.4.1 Face-Face Interview
The researcher interviewed the Human Resource Manager of MPAC in order
to identify the creative aspects of working at MPAC. The researcher asked the
interviewee to describe what would represent creativity in their job activities. Some
examples of creativity in acquiring new clients and sales included: (1) holding parties
for classmates or alumni in order to introduce them to certain legal products; (2)
delivering seminars addressing topics of concern to clients, their relatives, and
friends (for example, changes in the retirement system and what the law requires for
one to enjoy his/her retirement benefits), and designing custom-made legal products
(for example, paralegal training sessions for workers); and (3) organizing cock-tail
parties for clients and their friends in order to acquire new clients. Five items
measuring employee creativity were developed on the basis of information that the
researcher gathered from this interview. The Human Resource Manager was also
interviewed on the most ‗visible‘ aspects of the organizational culture and the
answers he provided, gave me the impetus to identify the ten constituents of the
culture of MPAC as listed in Chapter Four, Section 4.3.
3.4.2 Questionnaire Based Interview
The primary data also consisted of information gathered from a number of
items in structured likert questionnaire with scale; (1=―strongly disagree,‖ to 5
=―strongly agree‖) which were administered to the respondents. Some of the items
32
included in the questionnaire were; ―In my organization, change is viewed as a
challenge and an opportunity‖, "We've always done it that way is a philosophy that
describes my company's response to new ideas‖, ―This person is good at finding
creative ways to solve problems‖ and ―This person‘s work performance always
meets the expectations of the supervisor‖ (see Appendix A for all the items). The
questionnaire data offered an opportunity for coding the participants‘ responses such
that statistical procedures could be used for quantitative data analysis in order to
deduce the correlation between the independent and dependent variable.
3.5 RESEARCH INSTRUMENTS
A research instrument is a survey, questionnaire, test, scale, rating, or tool
designed to measure the variable(s), characteristic(s), or information of interest, often
a behavioral or psychological characteristic. In this study, we employed a 34 item
likert scale questionnaire ―The Organizational culture and Employee Creativity
Questionnaire‖ (Appendix ‗A‘) to gather the information needed for this study. The
Holistic Management Pty. Key (2000) was used to assess the openness of MPAC‘s
Culture to creativity. ‗Employee-Self-Rated-Creativity-Index‘ (Tierney & Farmer,
2004) was the measure for employee creativity used in this study. Using ‗Supervisor-
Rated-Employee-Performance-Index‘ (Madjar et al., 2002), we assessed employee
performance. Pearson‘s Correlation was the instrument used to assess the
relationships whilst Bar Chart was used to present some information graphically.
3.6 RESEARCH DESIGN
The study focused on employee or creativity and the organizational culture
affecting it, and the relationship between creativity and employee performance. In
this study, case study research design was employed. Case study research design was
33
used because the sample elements and the variables that were being studied were
simply being observed as they were without making any attempt to control or
manipulate them. Yin (2003) made the distinction between case study and
quantitative surveys by the type of questions answered by each. Case study is the
preferred strategy to answer how or why questions (exploratory), whereas a survey is
the preferred strategy when answering who, what, where, how many, or how much
questions (confirmatory). The current study explored through ―how‖ questions, and
was therefore best served by case study research design.
3.7 DATA ANALYSIS
In order to find out whether the culture of MPAC was open to or supportive of
creativity, data collected from the (organizational culture section, item 1-15)
questionnaire was analyzed, summarized, and interpreted accordingly with the aid of
Holistic Management (KEYS). The Holistic Management (KEYS) 2000 consisted of
15 qualitative questionnaire items, with a scale of (1=―strongly disagree,‖ to 5
=―strongly agree‖) for measuring the degree of openness of an organizations culture
to creativity (items [1- 15] of the questionnaire attached hereto in Appendix A).
Employee Self-rated creativity index (Tierney & Farmer, 2004) Supervisor-rated
creative index were the measures of creativity used in this study. By this, the
respondents were made to respond to items on the creativity section (refer to the
items numbered 16-20 on the questionnaire in Appendix A) of the questionnaire in
order to measure their creative potential.
The items used to measure employee creativity were:
―16. This person often develops creative custom-made product/service packages for
clients (1 = strongly disagree, to 5 = strongly agree)‖.
34
―17. This person often uses creativity to develop new clients through different means
and channels. (1 = strongly disagree, to 5 = strongly agree)‖
―18. This person often develops creative methods for promotion and sales. (1 =
strongly disagree, to 5 = strongly agree)‖
―19. This person is good at finding creative ways to solve problems. (1= strongly
disagree, to 5 = strongly agree)‖
―20. This person‘s work is creative. (1 = strongly disagree, to 5 = strongly agree)‖
Consistent with previous research (Madjar et al., 2002), we then used
supervisory ratings to assess employee creativity in order to avoid subjective biases-
this adaptation is consistent with the recommendation by Farh, Cannella, and Lee
(2006) on developing valid instruments for research. In pursuance of this approach,
Table 6 in Appendix E was derived. The relationship between organizational culture
employee creativity and employee Creativity and performance was assessed using
the Pearson‘s Correlation. Descriptive simple percentage tables and graphs were
used to present the responses of the respondents pictorially.
3.8 PROFILE OF CASE
MPAC was established out of the need for an improvement in the justice
delivery system. From the conditions in which lawyers had to work, through client
satisfaction to the judicial process, the justice delivery system was bedeviled with
uncertainties, poor standards and tortoise-paced products. The desire and vision to
commence and achieve positive change compelled Mr. Justice Kusi-Minkah Premo,
a lawyer who was called to the Ghana Bar in 1984, to set up MPAC after stints with
State Insurance Corporation, Kwaku Baah & Co. and Kokroko Chambers. The
35
experience gathered from the three places mentioned afore became useful raw
materials in the mental process of creating and establishing a law firm that will
achieve service beyond client expectation, job satisfaction and faith in the legal
process. In any category of activity involved in the organized association of law
firms in Ghana, MPAC features as either the trendsetter or one of the best law firms
(Company Profile, MPAC, 2007). MPAC has three ultra-modern offices nation wide
(Accra, Kumasi & Tamale). The firm places great emphasis on providing a
comfortable working environment with a view to achieving client satisfaction
through maximization of productivity. With this criterion in mind, the partners of the
firm commissioned custom-designed premises. The entire offices are networked and
internet-linked, with instant access to an immense database of information at any
given time. Upon entering their offices, the atmosphere of professionalism and
efficiency in a comfortable environment is immediately palpable. Their professional
front office staff warmly welcomes clients and ensures that they are referred to the
right lawyer with the minimum of delay. At the front office of MPAC is a visible
glass plaque intimating their Vision and Mission as follows:
Vision Statement of MPAC:
“To be a leading Law firm providing integrated professional services for effective
legal solutions with integrity”
Mission Statement of MPAC:
“To provide effective legal solutions in satisfying clients through the transformation
of legal documents and theories into practical realities, in the most professional of
atmospheres, raising standards of the justice delivery system through training and
communication skills”
The organizational structure of MPAC is as follows:
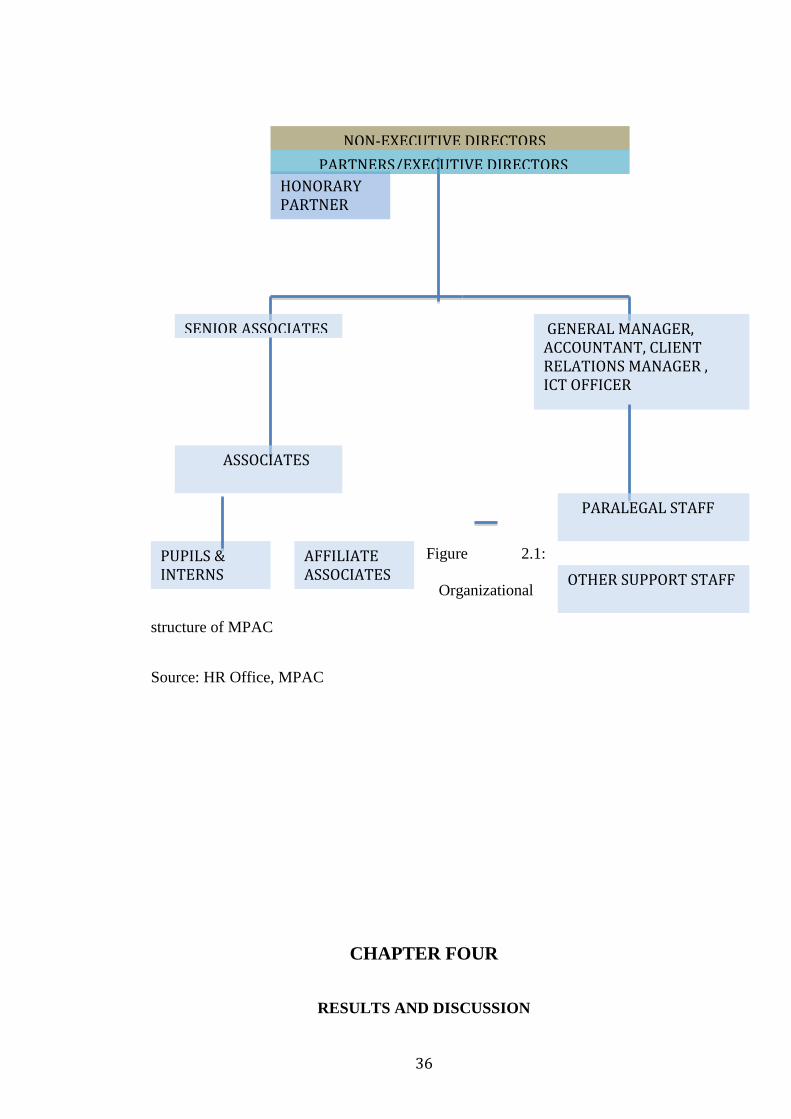
36
Figure 2.1:
Organizational
structure of MPAC
Source: HR Office, MPAC
CHAPTER FOUR
RESULTS AND DISCUSSION
HONORARY PARTNER
GENERAL MANAGER, ACCOUNTANT, CLIENT RELATIONS MANAGER , ICT OFFICER
SENIOR ASSOCIATES
PUPILS & INTERNS
AFFILIATE ASSOCIATES OTHER SUPPORT STAFF
PARALEGAL STAFF
ASSOCIATES
PARTNERS/EXECUTIVE DIRECTORS
NON-EXECUTIVE DIRECTORS
37
4.1 INTRODUCTION
This chapter presents the analysis and discussion of data gathered from the study
conducted at MPAC. Responses from all the respondents were examined, compiled
and evaluated to answer the research questions asked at the beginning of the study.
As far as possible, data were tabulated and displayed through tables with the aim of
identifying and discerning any patterns that provided the best interpretation of the
results of the study.
4.2 OPENESS OF MPAC’S CULTURE TO CREATIVITY
According to the Holistic Management KEY (2000), in order to measure an
organization‘s culture adaptability to change, the 15-item likert questionnaire should
be assessed using the key presented on Appendix B, Table 4.1. This key was then
used on the raw data gathered from the survey and which can be seen in Table 4.2 on
Appendix C. Based on the total points gathered from the 15 itemed likert scale
questionnaire on each respondent, out of the 32 participants interviewed, 7
participants representing approximately 21.9% of the participants scored the
organizational culture of MPAC 60 points and above whilst 25 participants,
representing approximately 78.1% of the participants scored the organizational
culture of MPAC 59 points and below. Linking this finding to the first of the
secondary objectives of this study, that is (to ascertain whether the organizational
culture of MPAC is open to creativity), 78.1% of the participants affirmed that,
MPAC‘s culture is not open to creativity whilst 21.9% responded that the culture of
the organization is open to creativity. Find a pictorial representation of this
information on Appendix D, Figure 4.1.
38
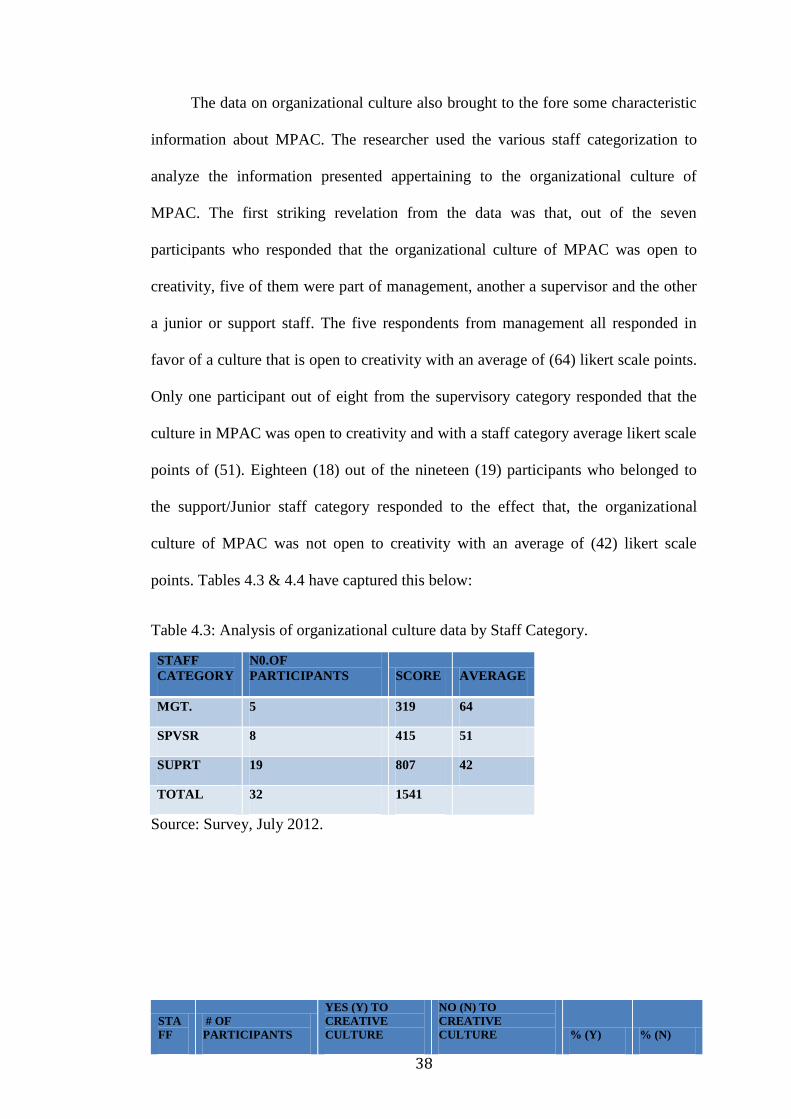
The data on organizational culture also brought to the fore some characteristic
information about MPAC. The researcher used the various staff categorization to
analyze the information presented appertaining to the organizational culture of
MPAC. The first striking revelation from the data was that, out of the seven
participants who responded that the organizational culture of MPAC was open to
creativity, five of them were part of management, another a supervisor and the other
a junior or support staff. The five respondents from management all responded in
favor of a culture that is open to creativity with an average of (64) likert scale points.
Only one participant out of eight from the supervisory category responded that the
culture in MPAC was open to creativity and with a staff category average likert scale
points of (51). Eighteen (18) out of the nineteen (19) participants who belonged to
the support/Junior staff category responded to the effect that, the organizational
culture of MPAC was not open to creativity with an average of (42) likert scale
points. Tables 4.3 & 4.4 have captured this below:
Table 4.3: Analysis of organizational culture data by Staff Category.
STAFF
CATEGORY
N0.OF
PARTICIPANTS SCORE AVERAGE
MGT. 5 319 64
SPVSR 8 415 51
SUPRT 19 807 42
TOTAL 32 1541
Source: Survey, July 2012.
STA
FF
# OF
PARTICIPANTS
YES (Y) TO
CREATIVE
CULTURE
NO (N) TO
CREATIVE
CULTURE % (Y) % (N)
39
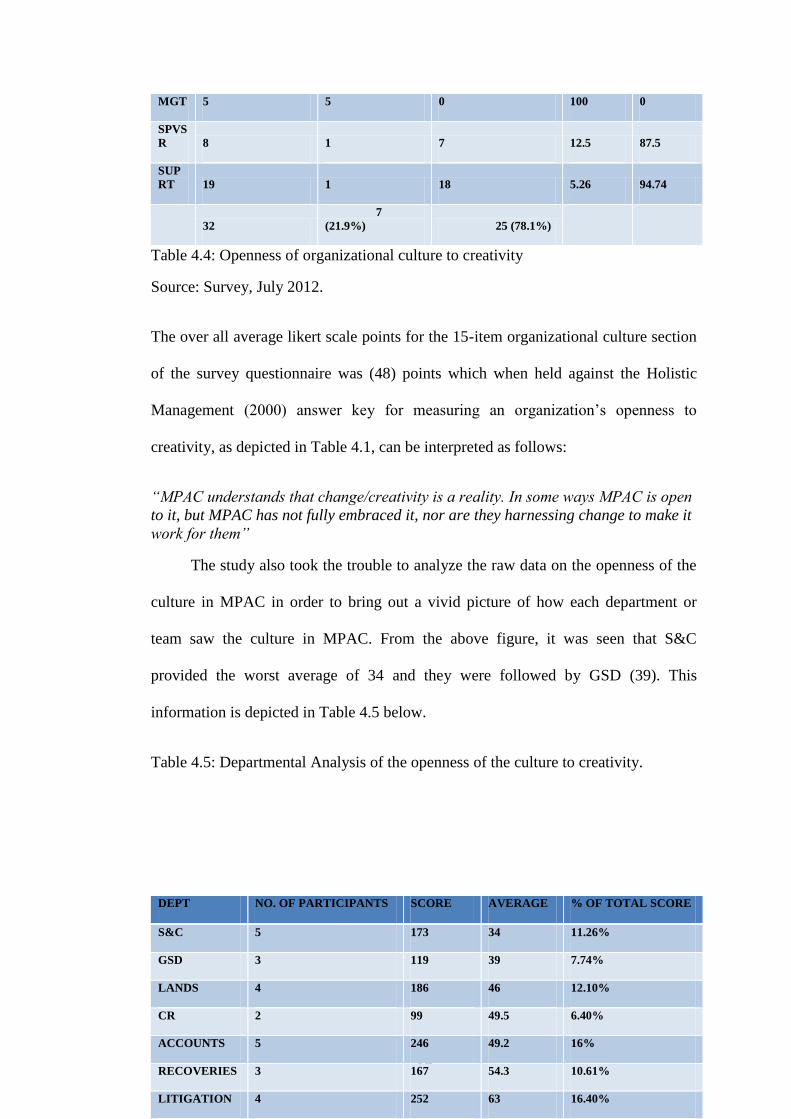
Table 4.4: Openness of organizational culture to creativity
Source: Survey, July 2012.
The over all average likert scale points for the 15-item organizational culture section
of the survey questionnaire was (48) points which when held against the Holistic
Management (2000) answer key for measuring an organization‘s openness to
creativity, as depicted in Table 4.1, can be interpreted as follows:
“MPAC understands that change/creativity is a reality. In some ways MPAC is open
to it, but MPAC has not fully embraced it, nor are they harnessing change to make it
work for them”
The study also took the trouble to analyze the raw data on the openness of the
culture in MPAC in order to bring out a vivid picture of how each department or
team saw the culture in MPAC. From the above figure, it was seen that S&C
provided the worst average of 34 and they were followed by GSD (39). This
information is depicted in Table 4.5 below.
Table 4.5: Departmental Analysis of the openness of the culture to creativity.
MGT 5 5 0 100 0
SPVS
R 8 1 7 12.5 87.5
SUP
RT 19 1 18 5.26 94.74
32
7
(21.9%) 25 (78.1%)
DEPT NO. OF PARTICIPANTS SCORE AVERAGE % OF TOTAL SCORE
S&C 5 173 34 11.26%
GSD 3 119 39 7.74%
LANDS 4 186 46 12.10%
CR 2 99 49.5 6.40%
ACCOUNTS 5 246 49.2 16%
RECOVERIES 3 167 54.3 10.61%
LITIGATION 4 252 63 16.40%
40
Source: Survey, July 2012.
4.3 RELATIONSHIP BETWEEN ORGANIZATIONAL CULTURE&
EMPLOYEE CREATIVITY.
The Study then went on to answer the second question ―how does
organizational culture impact employee creativity?‖ By this question, the research
wanted to ascertain whether there is any relationship between organizational culture
and employee creativity in MPAC. The study therefore employed the Pearson‘s
Correlation on the data gathered on organizational culture and employee creativity
on MPAC (Items 1-15[organizational culture/independent variable] and 16-
20[employee creativity/dependent variable] of the organizational culture and
creativity questionnaire). Refer to Table 4.6 on Appendix E for the raw data. The
study arrived at a Pearson‘s Correlation Coefficient of (0.716) by using the Pearson‘s
Correlation (in Microsoft Excel) on the data represented in Table 4.7 on Appendix F.
4.4 CONSTITUENTSOF CULTURE THAT IMPACT EMPLOYEE
CREATIVITY
The study sought to unearth the constituent of the organizational culture that
impacted employee creativity most at MPAC. Ten constituents of the organizational
culture of MPAC were identified (items labeled 21-30 on the questionnaire
(Appendix A). The constituents comprised; autonomy at the workplace (ATNMY),
work load (WRK LD.), formalization/ red tape (FORM.), recognition for creative
work (RECOG), financial reward for creative work (FIN RD), supervisor respect for
employees at the workplace (SUP. RES), leadership (LDRSHP), resource allocation
CORPORATE 2 113 56.5 7.35%
IT 1 67 67 4.40%
N/A 2 75 37.5 4.88%
HR 1 44 44 2.86%
32 1541
100.00%
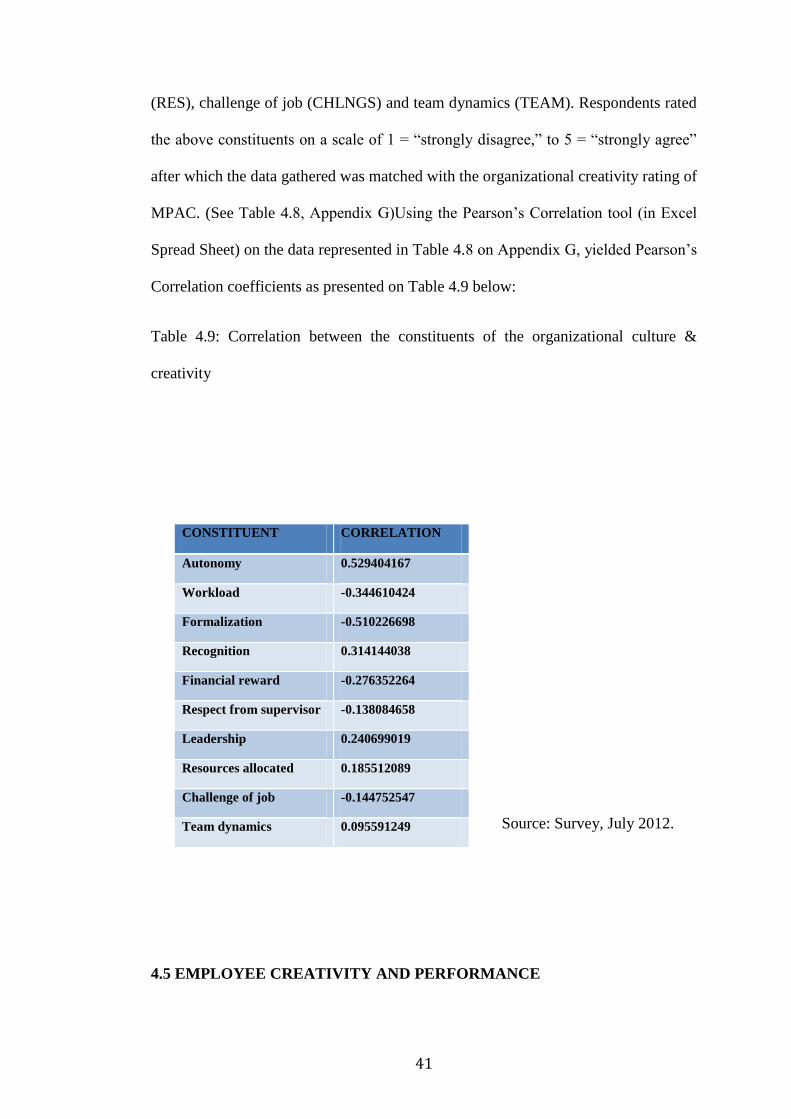
41
(RES), challenge of job (CHLNGS) and team dynamics (TEAM). Respondents rated
the above constituents on a scale of 1 = ―strongly disagree,‖ to 5 = ―strongly agree‖
after which the data gathered was matched with the organizational creativity rating of
MPAC. (See Table 4.8, Appendix G)Using the Pearson‘s Correlation tool (in Excel
Spread Sheet) on the data represented in Table 4.8 on Appendix G, yielded Pearson‘s
Correlation coefficients as presented on Table 4.9 below:
Table 4.9: Correlation between the constituents of the organizational culture &
creativity
Source: Survey, July 2012.
4.5 EMPLOYEE CREATIVITY AND PERFORMANCE
CONSTITUENT CORRELATION
Autonomy 0.529404167
Workload -0.344610424
Formalization -0.510226698
Recognition 0.314144038
Financial reward -0.276352264
Respect from supervisor -0.138084658
Leadership 0.240699019
Resources allocated 0.185512089
Challenge of job -0.144752547
Team dynamics 0.095591249
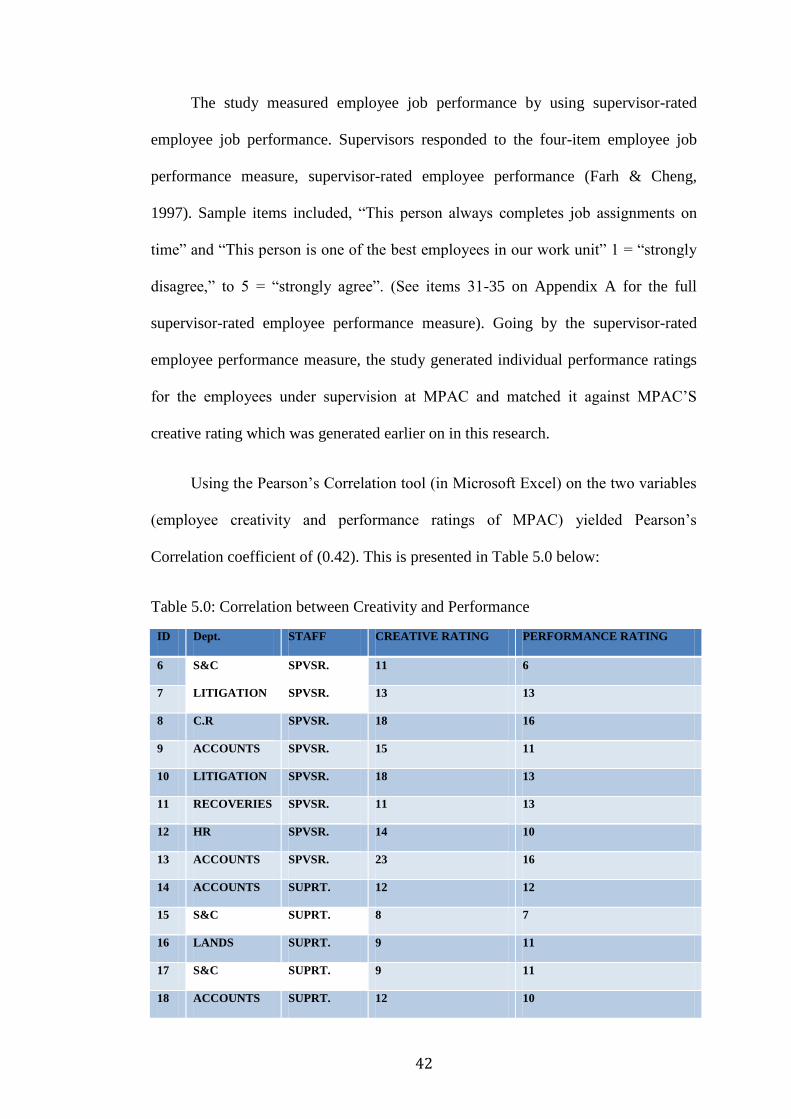
42
The study measured employee job performance by using supervisor-rated
employee job performance. Supervisors responded to the four-item employee job
performance measure, supervisor-rated employee performance (Farh & Cheng,
1997). Sample items included, ―This person always completes job assignments on
time‖ and ―This person is one of the best employees in our work unit‖ 1 = ―strongly
disagree,‖ to 5 = ―strongly agree‖. (See items 31-35 on Appendix A for the full
supervisor-rated employee performance measure). Going by the supervisor-rated
employee performance measure, the study generated individual performance ratings
for the employees under supervision at MPAC and matched it against MPAC‘S
creative rating which was generated earlier on in this research.
Using the Pearson‘s Correlation tool (in Microsoft Excel) on the two variables
(employee creativity and performance ratings of MPAC) yielded Pearson‘s
Correlation coefficient of (0.42). This is presented in Table 5.0 below:
Table 5.0: Correlation between Creativity and Performance
ID Dept. STAFF CREATIVE RATING PERFORMANCE RATING
6 S&C SPVSR. 11 6
7 LITIGATION SPVSR. 13 13
8 C.R SPVSR. 18 16
9 ACCOUNTS SPVSR. 15 11
10 LITIGATION SPVSR. 18 13
11 RECOVERIES SPVSR. 11 13
12 HR SPVSR. 14 10
13 ACCOUNTS SPVSR. 23 16
14 ACCOUNTS SUPRT. 12 12
15 S&C SUPRT. 8 7
16 LANDS SUPRT. 9 11
17 S&C SUPRT. 9 11
18 ACCOUNTS SUPRT. 12 10
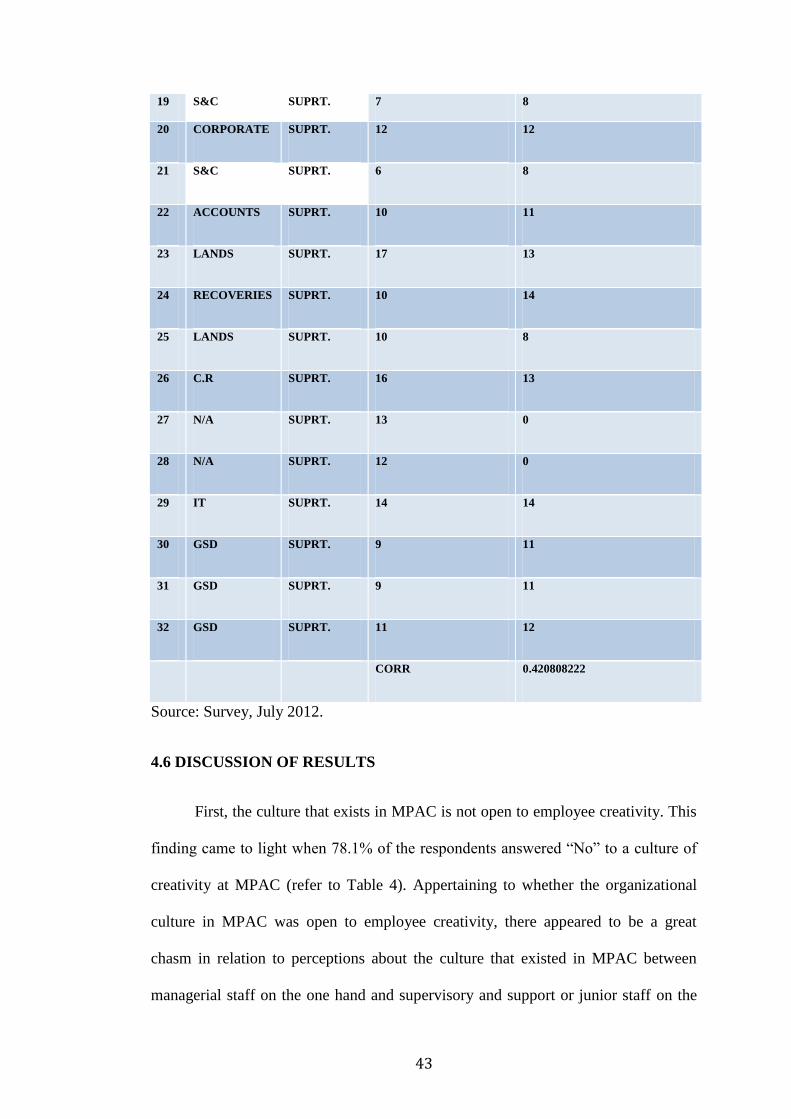
43
19 S&C SUPRT. 7 8
20 CORPORATE SUPRT. 12 12
21 S&C SUPRT. 6 8
22 ACCOUNTS SUPRT. 10 11
23 LANDS SUPRT. 17 13
24 RECOVERIES SUPRT. 10 14
25 LANDS SUPRT. 10 8
26 C.R SUPRT. 16 13
27 N/A SUPRT. 13 0
28 N/A SUPRT. 12 0
29 IT SUPRT. 14 14
30 GSD SUPRT. 9 11
31 GSD SUPRT. 9 11
32 GSD SUPRT. 11 12
CORR 0.420808222
Source: Survey, July 2012.
4.6 DISCUSSION OF RESULTS
First, the culture that exists in MPAC is not open to employee creativity. This
finding came to light when 78.1% of the respondents answered ―No‖ to a culture of
creativity at MPAC (refer to Table 4). Appertaining to whether the organizational
culture in MPAC was open to employee creativity, there appeared to be a great
chasm in relation to perceptions about the culture that existed in MPAC between
managerial staff on the one hand and supervisory and support or junior staff on the
44
other hand. Whilst all the managerial staff who responded (100% of them) scored the
organizational culture of MPAC as open to creativity, almost all of the supervisory
and junior staff (85.5% and 94.74% respectively) scored the organizational culture as
not open to creativity.
In answering the research question ―How does organizational culture impact
employee creativity in MPAC?‖ The Pearson‘s Correlation coefficient of (0.716)
reveals that, organizational culture impacts employee creativity positively. In other
words, when the organizational culture of MPAC is positive or very strong,
employee creativity tends to be high and vice versa.
Appertaining to finding the constituents of the organizational culture of MPAC,
which impacted creativity most; from the correlation analysis as presented in Table 9
above, autonomy had a positive relationship with creativity at MPAC. This means
that creativity tends to increase with an increase in autonomy and vice versa.
Autonomy also had the highest correlation coefficient (0.53) and thereby indicating
that the autonomy component of the organizational culture influenced employee
creativity most at MPAC. Staff of MPAC, who had the greatest or much autonomy
(Managers and some supervisors) exhibited much creativity in the conduct of their
work. This finding is in line with the following research(s) (Amabile, 1988; 1998;
Anderson et al., 2004; Isaksen & Lauer, 2002; Mathisen & Einarsen, 2004).
Formalization/Red-Tape had the next considerable impact on employee creativity at
MPAC, notwithstanding the fact that it was a negative impact or relationship. The
negative relationship between formalization at the work place and employee
signified that, the higher the formalization in MPAC, the lower employee creativity
and the obverse also holds. This finding went far to buttress the research findings of
Ahuja et al. (2008) who suggested that, bureaucracy and conformity stifled
45
creativity. The other striking information gathered from the above table was the
negative correlation between financial reward and employee creativity at MPAC.
What this means is that, rewarding people financially for creative work will
eventually kill their creative drive. This is in line with what Amabile, (1996) said
about extrinsic rewards, that it is ―detrimental to employee creativity‖. Recognition,
as a reward for creative work however had a positive correlation with employee
creativity at MPAC and with a Pearson‘s Correlation coefficient of (0.31).
Leadership had a Pearson‘s Correlation coefficient of (0.24), which means that
leadership also had a considerable positive influence on employee creativity. This
finding emphasized leadership‘s influence in inspiring employee creativity as
intimated by (Oldham & Cummings, 1996).
The study assessed the relationship between employee creativity and employee
performance. Holding a Pearson‘s Correlation of (0.42) against the fourth Research
Objective, ―to assess empirically the relationship between employee creativity and
employee performance‖, indicates that there is a positive relationship between
employee creativity and employee performance at MPAC. This is to say that
employee performance tends to increase when employee creativity is on the high at
MPAC. With this realization notwithstanding, it is also worth mentioning that,
creativity only impacts performance by (42%) at MPAC. This finding is coterminous
to Chamorro-Premuzic‘s (2006) research finding of a positive relationship between
creative thinking and final dissertation grades in a sample of students.
CHAPTER FIVE
46
CONCLUSION AND RECOMMENDATION
5.1 SUMMARY OF FINDINGS
The present study was motivated by four goals: To ascertain whether the
organizational culture of MPAC was open to employee creativity; to ascertain
empirically whether there was any relationship between the organizational culture
and employee creativity in MPAC; to identify the constituent(s) of the organizational
culture that impacted employee creativity most in MPAC; and assess empirically the
relationship between employee creativity and employee performance.
The results obtained lead to four conclusions:
First, the culture that existed in MPAC was not very open to employee
creativity. Appertaining to whether the organizational culture in MPAC was open to
employee creativity, there appeared to be a great chasm in relation to perceptions
about the culture that existed in MPAC between managerial staff on the one hand
and supervisory and support or junior staff on the other hand. Whilst all the
managerial staff who responded scored the organizational culture of MPAC as open
to creativity, almost all of the supervisory and junior staff scored the organizational
culture as not open to creativity. Organizational culture is not just about what
management knows or believes but it also encapsulates what has been transmitted
down to other staff (what supervisory or support staff believes). This chasm between
the perceptions of management and supervisory and junior staff brought to the fore, a
fundamental problem in MPAC- communication problem. Furthermore, whilst
teamwork is very good for organizational development, team identity or team culture
should not be allowed to overshadow the organizational culture as pertains in
MPAC.

47
Second, there was a positive relationship between the organizational culture of
MPAC and employee creativity.
Third, autonomy was found to be the constituent of the organizational culture,
which impacted employee creativity most (positively) in MPAC. The study found
that, members of the organization who had more autonomy (managerial staff)
exhibited more creativity in their work. However, staff who had minimal or no
autonomy exhibited minimal or no creativity in their work. Formalization or red tape
also impacted creativity considerably and negatively. This is to say that; the lesser
the formalization in MPAC, the greater would be the tendency to be creative and
vice versa. Workload also was shown to impact creativity negatively. Thus, the
greater the workload on employees the less tendency they would have to be creative
in their work and vice versa. Recognition, as a reward (for creative work) was shown
to impact employee creativity positively. Financial rewards (for creative work) also
impacted employee creativity negatively in MPAC. What it means is that; giving
people money for being creative in or with their work would eventually kill their
creative drive. This is in line with what Amabile, (1996) said about extrinsic rewards,
that it is ―detrimental to employee creativity‖.
Fourth, there was a positive relationship between employee creativity and
employee performance in MPAC. Whereas prior work has shown a positive
relationship between creativity and performance in an academic setting (for a review,
see Gilson 2008), we demonstrated this relationship within a corporate setting
(MPAC).
5.2 CONCLUSION
48
21.9% of the participants acknowledged that the organizational culture of
MPAC is open to creativity whilst 78.1% of the acknowledged the obverse. This is to
say that, in accordance with this study, the organizational culture of MPAC is not
supportive of employee creativity.
Secondly, this study revealed that organizational culture impacts employee
creativity positively and this is in answer to research question (2). A Pearson‘s
Correlation coefficient of (0.716) illuminated such a relationship.
Furthermore, on the ― which constituent(s) of the organizational culture that
impact(s) employee creativity most at MPAC‖, the study revealed that, employee
Autonomy had the most influence with a Pearson‘s Correlation coefficient of (0.529)
and was followed by Formalization (-0.510). Workload had a negative correlation of
(-0.345) and was followed by Recognition (0.314). Financial rewards came next with
a negative correlation of (-0.276).
Last but not the least, and on the ―relationship between employee creativity and
employee performance‖, a Pearson‘s Correlation coefficient of (0.42) revealed an
appreciable positive relationship.
5.3 RECOMMENDATIONS
The following recommendations are made to the management of MPAC and other
organizations that are interested in modifying their culture in order to improve their
employees‘ creativity and job performance:
First and foremost, management must help generate a culture supportive of
creativity with emphasis on enhanced communication in order to influence attitudes,
opinions and beliefs. Van de Ven (1983a) suggests that the primary role of
49
executives should be to articulate and embody a mission and role for the
organization. Ouchi & Price (1978) suggest that executives should articulate a
philosophy of management that describes organizational goals. Since organizational
culture is not only about what management believes, the management of MPAC
should communicate organizational goals, values, beliefs, mission and vision more
evenly and effectively across all staff levels. Notwithstanding the fact that teamwork
is good for organizational development, the management of MPAC must strive to
relieve members of staff of their team identities and help them embrace the
organizational identity more. Organizational culture must be binding on all
employees of the company as this will encourage uniformity among members of the
organization and thus enhance commitment.
Secondly, in order to promote creativity across all staff levels at MPAC,
management must pay particular attention to autonomy, formalization, workload,
recognition and financial rewards. Since autonomy had a positive correlation with
creativity, management at MPAC must give staff across all levels reasonable
autonomy for them to perform their duties. Closely related to autonomy is
formalization. Formalization in this study was found out to impact creativity
negatively. Management at MPAC should endeavor to minimize formalization
within the organization in order to enhance creativity at MPAC-there should be the
willingness to deviate from ―the way things are done around here‖, and supervisors
who disliked ideas opposite to theirs. In order to enhance creativity at MPAC,
management must give employees reasonable workload. A financial reward for
creative work according to this study had a negative correlation with creativity.
However, recognizing a person as a reward for creative work in accordance with this
study has a positive correlation with creativity. We therefore advice management to
50
desist from giving employees financial rewards for creative work but rather
recognize them for such creative work.
Finally, management must do well to promote creativity in MPAC
since this study has brought to the fore a positive relationship between employee
creativity and performance.
REFERENCES
51
Abedi, J. (2002) A Latent-variable modeling approach to assessing reliability and
validity of a creativity instrument. Creativity Research Journal, 14(2), 267-276.
Ahuja, G., Lampert, C. M., & Tandon, V. (2008) Chapter 1: Moving beyond
Schumpeter: Management research on the determinants of technological innovation.
The Academy of Management Annals, 2, 1 - 98.
Amabile, T. M. (1996) Creativity in context. Boulder, CO: Westview.
Amabile, T. M. (1998) How to kill creativity. Harvard Business Review, 76(5), 76-
87.
Amabile, T. M. (1988) A Model of creativity and innovation in organizations. In B.
M. Staw & L. L. Cummings (Eds.), Research in Organizational Behavior (Vol. 10,
pp. 123-167). Greenwich, CT: JAI Press.
Anderson, N., de Drew, C. K. W., & Nijstad, B. A. (2004) The routinization of
innovation research: a constructively critical review of the state-of-the-science.
Journal of Organizational Behavior, 25(2), 147-173.
Anderson, J. V. (1992) Weirder than fiction: the reality and myths of creativity.
Academy of Management Executive, 6(4), 40-47.
Andrew, J. P., Haanaes, K., Michael, D. C., Sirkin, H. L., & Taylor, A. (2008)
Innovation 2008: Is the tide turning? A BCG senior management survey. Boston,
MA: The Boston Consulting Group, Inc.
Bandura, A. (1997) Self-efficacy: The exercise of control. New York: W.H.
Freeman.
Barron, F., & Harrington, D. M. (1981) Creativity, intelligence, and personality.
Annual Review of Psychology, 32, 439-476.
Bass, B. M., & Avolio, B. J. (1990) The implications of transactional and
transformational leadership for individual, team, and organizational development. In
R. W. Woodman & W. A. Pasmore (Eds.), Research in organizational change and
development, vol. 4: 231–272. Greenwich, CT: JAI Press.
Basadur, M., & Gelade, G. A. (2006) The role of knowledge management in the
innovation process. Creativity & Innovation Management, 15(1), 45-62.
Basadur, M., & Hausdorf, P. A. (1996) Measuring divergent thinking attitudes
related to creative problem solving and innovation management. Creativity Research
Journal, 9(1), 21-32.
Bass, B. M. (1985) Leadership and performance beyond expectations. New York:
Free Press.
Bassett-Jones, N. (2005) The paradox of diversity management, creativity and
innovation. Creativity & Innovation Management, 14(2), 169-175.
Benabou, R., & Tirole, J. (2003) Intrinsic and extrinsic motivation. Review of
economic studies, 70(244), 489-520.
52
Beugelsdijk, S., Koen, C. I., & Noorderhaven, N. G. (2006) Organizational culture
and relationship skills. Organization Studies, 27(6), 833-854.
Bharadwaj, S., & Menon, A. (2000) Making innovation happen in organizations:
Individual creativity mechanisms, organizational creativity mechanisms or both?
Journal of Product Innovation Management, 17(6), 424-434.
Carlopio, J. (2000) Organizational Culture Questionnaire: Holistic Management
Model. Holistic Management Pty. Ltd. Bonogin, QLD.
Chamorro-Premuzic, T. (2006) Creativity versus conscientiousness: Which is a
better predictor of student performance? Applied Cognitive Psychology, 20: 521–
531.
Cummings, L. L., Hinton, B. L., & Gobdel, B. C. (1975) Creative behavior as a
function of task environment: Impact of objectives, procedures, and controls.
Academy of Management Journal, 18(3), 489-499.
Damanpour, F. (1991) Organizational innovation: A meta-analysis of effects of
determinants and moderators. Academy of Management Journal, 34(3), 555-590.
Denison, D. R. (1996) What is the difference between organizational culture and
organizational climate? Academy of Management Review, 21(3), 619-654.
Dvir, T., Eden, D., Avolio, B. J., & Shamir, B. (2002) Impact of transformational
leadership on follower development and performance: A field experiment. Academy
of Management Journal, 45: 735–744.
Ekvall, G. (1996) Organizational climate for creativity and innovation. European
Journal of Work and Organizational Psychology, 5, 105–123.
Farh, J. L., & Cheng, B. S. (1997) Modesty bias in self- ratings in Taiwan: Impact of
item wording, modesty value, and self-esteem. Chinese Journal of Psychology, 39:
103–118.
Farh, J. L., Cannella, A. A., & Lee, C. (2006) Approaches to scale development in
Chinese management research. Management and Organization Review, 2: 301– 318.
Forehand, G. A. & B. von Gilmer, (1964) Environmental Variations in Studies of
Organizational Behavior, Psychological Bulletin, 62, pp. 361-382.
Freeman, J., & Engel, J. S. (2007) Models of innovation: Startups and mature
corporations. California Management Review, 50(1), 94-119.
Gilson, L. L. (2008) Why be creative: A review of the practical outcomes associated
with creativity at the individual, group, and organizational levels. In J. Zhou & C. E.
Shalley (Eds.), Handbook of organizational creativity: 303–322. Mahwah, NJ:
Erlbaum.
Glisson, C., & James, L. R. (2002) The cross-level effects of culture and climate in
human service teams. Journal of Organizational Behavior, 23, 767-794.
Harris D. H. (1994) Organizational Linkages: Understanding the productivity
paradox. Washington D.C: National Academy Press.
53
Haner, U. E. (2005) Spaces for creativity and innovation in two established
organizations. Creativity & Innovation Management, 14(3), 288-298.
Isaksen, S. G., & Lauer, K. J. (2002) The climate for creativity and change in teams.
Creativity & Innovation Management, 11(1), 74-86.
James, L. R., Choi, C. C., Ko, C-H. E., McNeil, P. K., Minton, M. K., Wright, M. A.,
et al. (2007) Organizational and psychological climate: A review of theory and
research. European Journal of Work and Organizational Psychology, 17(1), 5-32.
King, N. (1990) Innovation at work: The research literature. In M. A. West & I. L.
Farr (Eds.), Innovation and creativity at work (pp. 15-59). New York: Wiley.
Kotter, J. P., & Heskett, J. L. (1992) Corporate culture and performance. New York:
Free Press.
Lloyd, C. (2007) The Role of Arts-based Learning in a Creative Economy. Partial
Report and Dissertation, Queensland University of Technology, Faculty of Creative
Industries, Doctorate of Creative Industries. Submitted and Approved, August 2007.
Brisbane, Queensland, Australia.
Madjar, N., Oldham, G. R., & Pratt, M. G. (2002) There‘s no place like home? The
contributions of work and none work creativity support to employees‘ creative
performance. Academy of Management Journal, 45(4), 757-767.
Mathisen, G. E., & Einarsen, S. l. (2004) A review of instruments assessing creative
and innovative environments within organizations. Creativity Research Journal,
16(1), 119-140.
Mauzy, J., & Harriman, R. (2003) Creativity, Inc.: Building an inventive
organization. Boston: Harvard Business School Publishing.
McCoy, J. M., & Evans, G. W. (2002) The potential role of the physical environment
in fostering creativity. Creativity Research Journal, 14(3/4), 409-426.
Miron, E., Erez, M., & Naheh, E. (2004) Do personal characteristics and cultural
values that promote innovation, quality, and efficiency compete or complement each
other? Journal of Organizational Behavior, 25, 175-199.
Montuori, A., & Purser, R. (1995) Deconstructing the lone genius myth: Toward a
contextual view of creativity. Journal of Humanistic Psychology, 35(3), 69-112.
Morgan, G. (1997) Images of Organization, Thousand Oaks: Sage Publications.
Oldham, G. R., & Cummings, A. (1996) Employee creativity: Personal and
contextual factors at work. Academy of Management Journal, 39: 607–634.
Olu, O. (2009) Impact Assessment of Corporate Culture on Employee Job
Performance. Business Intelligence Journal, 2 (2).
Ouchi, W. G. , Price, R. (1978) ―Hierarchies, clans, and theory z: A new perspective
on organizational development. ―Organ. Dynam. 7(2) : 25-44.
54
Paul E. Tesluk, James L. Farr, Stephanie A. Klein (1997) Influences of
Organizational Culture and Climate on individual Creativity, 31,1.
Reichers, A.E. G. Schneider .B. (1990) Climate and culture: An evolution of
constructs. B. Schneider (Ed.). Organizational climate and culture. San Francisco:
Jossey-Bass.
Rubin, H. J., & Rubin, I. S. (2005) Qualitative interviewing: The art of hearing data
(2nd ed.). Thousand Oaks, CA: Sage Publications.
Schein, E. H. (1990) Organizational Culture, American Psychologist, 43 (2), 109-
119.
Shalley, C. E., Zhou, J., & Oldham, G. R. (2004) The effects of personal and
contextual characteristics on creativity: Where should we go from here? Journal of
Management, 30: 933–958.
Shalley, C. E. (1995) Effects of coaching, expected evaluation, and goal setting on
creativity and productivity. Academy of Management Journal, 38(2), 483-503.
Solomon, Y. (2007) Bowling with a crystal ball: How to predict technology trends,
create disruptive implementations and navigate them through industry. Charleston,
SC: Book Surge Publishing.
Sorensen J.B. (2002) ―The Strength of Corporate Culture and the Reliability of Firm
Performance‖. Administrative Science Quarterly, Vol 47. No. 1, pp. 70-91.
Stevens, G. A., & Burley, J. (1997) 3,000 raw ideas = 1 commercial success!
Research Technology Management, 40(3), 16-27.
Taylor, W. (1990) The business of innovation: An interview with Paul Cook.
Harvard Business Review, 68(2), 97-106.
Tellis, G. J., Prabhu, J. C., & Chandy, R. K. (2009) Radical innovation across
nations: The preeminence of corporate culture. Journal of Marketing, 73(1), 3-23.
Tichy, N. M. (1982) Managing Change Strategically: The Technical, Political, and
Organizational Dynamics (Autumn) pp. 59-80.
Tierney, P., & Farmer, S. M. (2004)The Pygmalion process and employee creativity.
Journal of Management, 30: 413–432.
Titiev, M. (1959) Introduction to Cultural Anthropology, New York: Henry Holt &
Company.
Tornatzky, L.G., Fleisher, M., Chalrabarto, A.K. (1990) The process of
technological innovation. Lexington. MA: Lexington Books.
Turnipseed, D. (1994) The relationship between the social environment of
organizations and the climate for innovation and creativity. Creativity and Innovation
Management, 3(3), 184–195.
55
Van de Ven, A. (1983) Creating and sustaining a corporate culture in fast changing
organizations. Univ. Minn. Working Paper.
Yin, R. K. (2003) Case study research: Design and methods (3rd ed.). Thousand
Oaks, CA: Sage Publications.
Zhou, J., & Shalley, C. E. (2003) Research on employee creativity: A critical review
and directions for future research. In J. Martocchio (Ed.), Research in person.
APENDIX A

56
SURVEY QUESTIONNAIRE
(ORGANIZATIONAL CULTURE AND EMPLOYEE CREATIVITY)
Organization’s Name…………………………………………………………………………………………
Organization’s Location…………………………………………………………………………………...
Name of Department………………………………………………………………………………
What is your position in your Organization? (tick) Managerial Staff [ ] Senior/Supervisory Staff [ ] Support Staff [ ]
Date and Time of Survey……………………………………………………………………………...........
1.0 INTRODUCTION
This survey questionnaire is strictly for academic research purposes and seeks to find out the relationship between organizational culture and employee creativity. I shall be grateful if you could take time off your already busy schedule to respond frankly to the questions below. Information you provide in this questionnaire will in no way be held against you as any information provided will be held very confidential. You need not write your name on this questionnaire. It is very important that you answer all questions in view of the fact that there are no right or wrong answers. I thank you in advance for your cooperation.
1.1 ORGANIZATIONAL CULTURE SECTION
Survey Statement
(1)
strongly
Disagree
(2)
Disagree
(3
Neither
Disagree
nor
Agree
(4) Agree (5)
Strongly
Agree
1. In my organization, change is viewed as a challenge and
an opportunity
1 2 3 4 5
2. Organizational policies are reviewed annually to assess
effectiveness.
1 2 3 4 5
3. Rewards are given to suit the preference of recipients
1 2 3 4 5
4. Our HR department is creative in finding new ways to
attract top talent among diverse groups. 1 2 3 4 5
5. There is an openness to suggestions from staff at all
levels of the organization. 1 2 3 4 5

57
Organizational Culture is defined as “the beliefs and values held by management
and communicated to employees through norms, stories, socialization processes, and
observations of managerial responses to critical events‖. It is also defined as ―the
way things are done here or in this organization‖
Please pick a number from the scale provided to show how much you agree or
disagree with each statement and circle the number to the right of the statement.
Scale:
1 = Strongly Disagree 2 = Disagree 3 = Neither Disagree nor Agree 4 = Agree
5 = Strongly Agree.
1.2 EMPLOYEE CREATIVITY SECTION
Creativity is the ability to produce work that is both new and valuable. New means
unusual, unique, new point of view, varied, original, breaking from existing patterns
and contributing something to the field, which was not there before.
Please pick a number from the scale provided to show how much you agree or
disagree with each statement and circle the number to the right of the statement .
Scale:
6. Our strategic plan is evaluated once a year and revised
as needed
1 2 3 4 5
7. "We've always done it that way" is a philosophy that
describes my company's response to new ideas.
1 2 3 4 5
8. When problems emerge, there is a willingness to fix
them. 1 2 3 4 5
9. Our products and services reflect the awareness of a diverse
consumer base. 1 2 3 4 5
10. My boss values new ideas and implements them quickly 1 2 3 4 5
11. Performance evaluations in this organization measure an
Employee’s adaptation to change.
1 2 3 4 5
12. Top executives in this company are innovative and
approachable
1 2 3 4 5
13. We can and do make 'mid-course' corrections easily.
1 2 3 4 5
14. There is little variation in style of dress among employees. 1 2 3 4 5
15. People at all levels of the organization are continuously
trying to build or rebuild a organization.
1 2 3 4 5
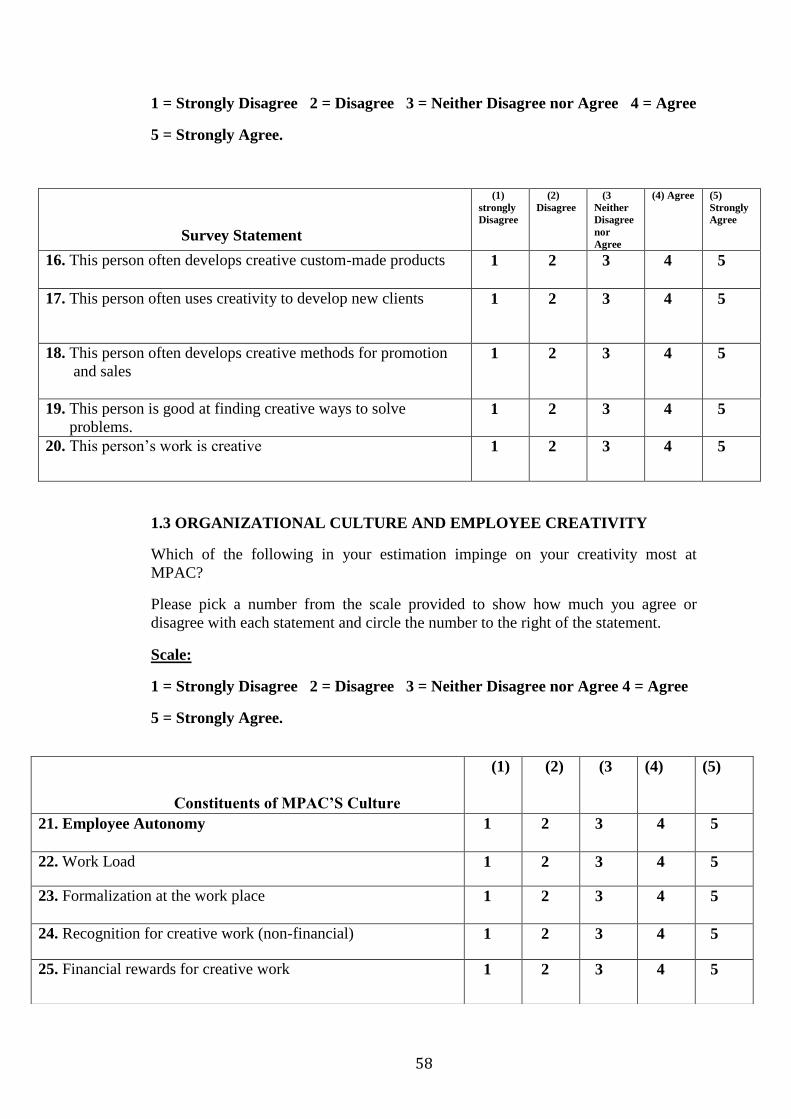
58
1 = Strongly Disagree 2 = Disagree 3 = Neither Disagree nor Agree 4 = Agree
5 = Strongly Agree.
Survey Statement
(1)
strongly
Disagree
(2)
Disagree
(3
Neither
Disagree
nor
Agree
(4) Agree (5)
Strongly
Agree
16. This person often develops creative custom-made products 1 2 3 4 5
17. This person often uses creativity to develop new clients 1 2 3 4 5
18. This person often develops creative methods for promotion
and sales
1 2 3 4 5
19. This person is good at finding creative ways to solve
problems. 1 2 3 4 5
20. This person‘s work is creative 1 2 3 4 5
1.3 ORGANIZATIONAL CULTURE AND EMPLOYEE CREATIVITY
Which of the following in your estimation impinge on your creativity most at
MPAC?
Please pick a number from the scale provided to show how much you agree or
disagree with each statement and circle the number to the right of the statement.
Scale:
1 = Strongly Disagree 2 = Disagree 3 = Neither Disagree nor Agree 4 = Agree
5 = Strongly Agree.
Constituents of MPAC’S Culture
(1) (2) (3 (4) (5)
21. Employee Autonomy 1 2 3 4 5
22. Work Load 1 2 3 4 5
23. Formalization at the work place 1 2 3 4 5
24. Recognition for creative work (non-financial) 1 2 3 4 5
25. Financial rewards for creative work 1 2 3 4 5
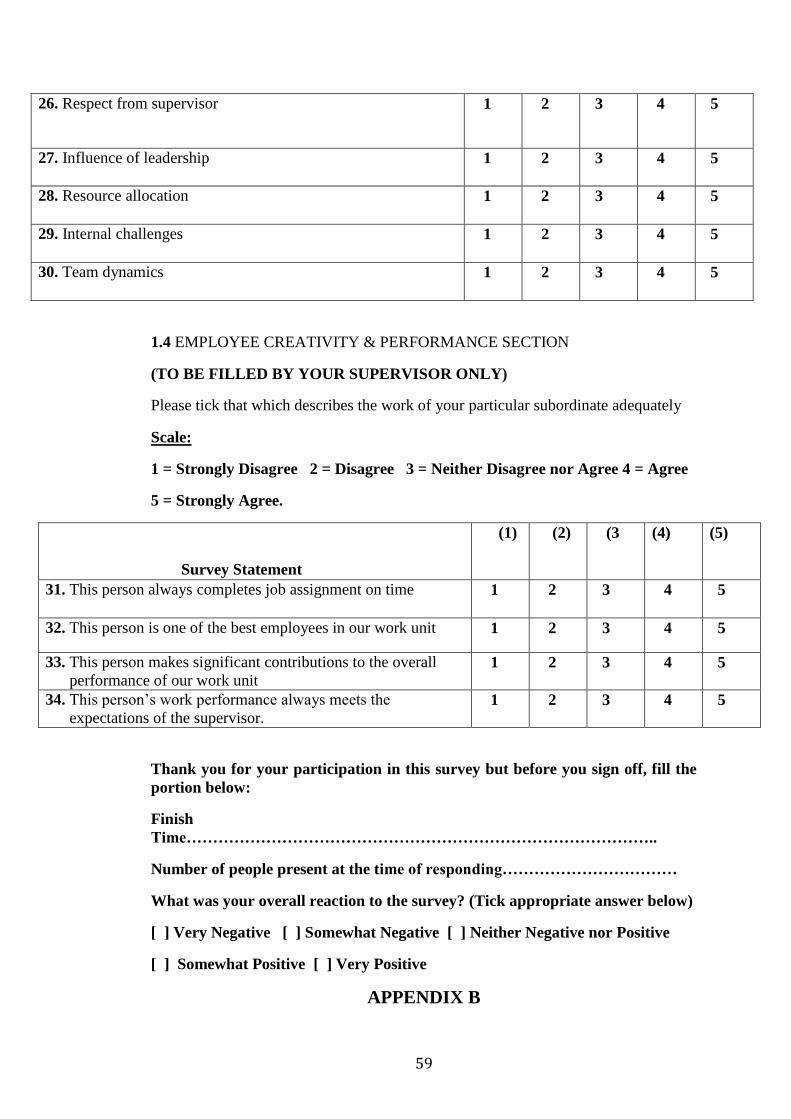
59
1.4 EMPLOYEE CREATIVITY & PERFORMANCE SECTION
(TO BE FILLED BY YOUR SUPERVISOR ONLY)
Please tick that which describes the work of your particular subordinate adequately
Scale:
1 = Strongly Disagree 2 = Disagree 3 = Neither Disagree nor Agree 4 = Agree
5 = Strongly Agree.
Survey Statement
(1) (2) (3 (4) (5)
31. This person always completes job assignment on time 1 2 3 4 5
32. This person is one of the best employees in our work unit 1 2 3 4 5
33. This person makes significant contributions to the overall
performance of our work unit 1 2 3 4 5
34. This person‘s work performance always meets the
expectations of the supervisor. 1 2 3 4 5
Thank you for your participation in this survey but before you sign off, fill the
portion below:
Finish
Time……………………………………………………………………………..
Number of people present at the time of responding……………………………
What was your overall reaction to the survey? (Tick appropriate answer below)
[ ] Very Negative [ ] Somewhat Negative [ ] Neither Negative nor Positive
[ ] Somewhat Positive [ ] Very Positive
APPENDIX B
26. Respect from supervisor 1 2 3 4 5
27. Influence of leadership 1 2 3 4 5
28. Resource allocation 1 2 3 4 5
29. Internal challenges 1 2 3 4 5
30. Team dynamics 1 2 3 4 5
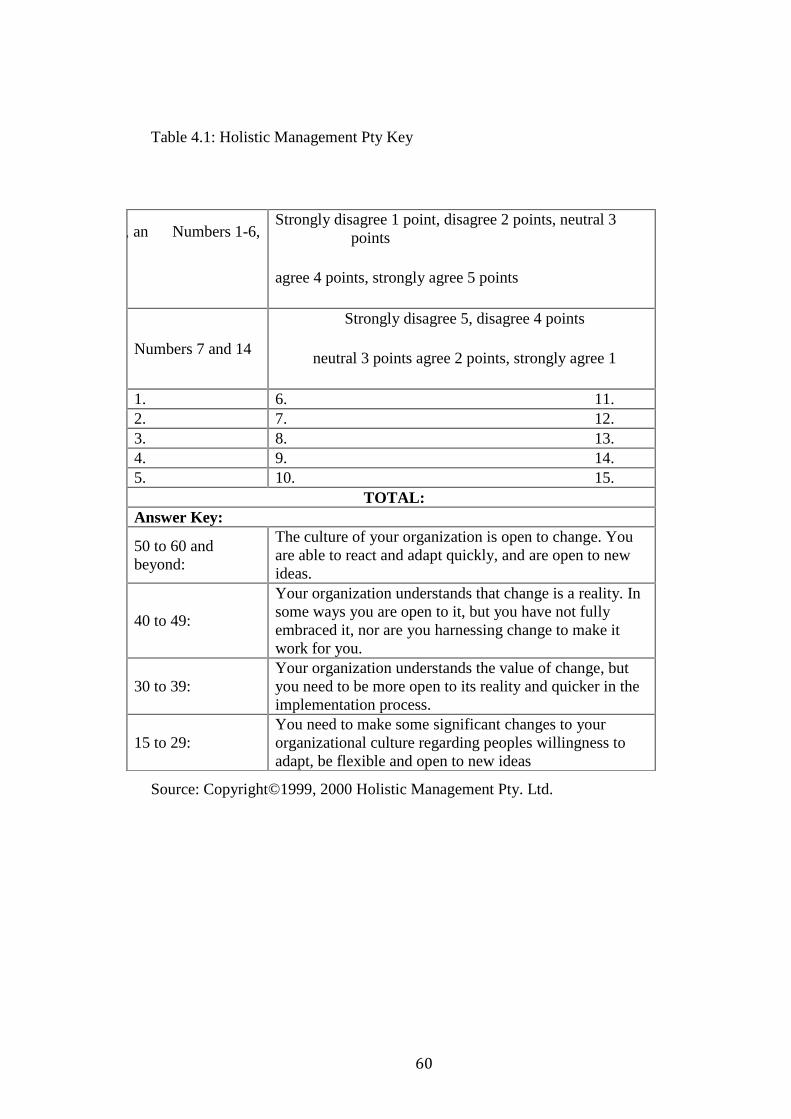
60
Table 4.1: Holistic Management Pty Key
Source: Copyright©1999, 2000 Holistic Management Pty. Ltd.
Numbers 1-6, 8-13, an Numbers 1-6,
8-13, & 15
&
Strongly disagree 1 point, disagree 2 points, neutral 3
points
agree 4 points, strongly agree 5 points
Numbers 7 and 14
Strongly disagree 5, disagree 4 points
neutral 3 points agree 2 points, strongly agree 1
1. 6. 11.
2. 7. 12.
3. 8. 13.
4. 9. 14.
5. 10. 15.
TOTAL:
Answer Key:
50 to 60 and
beyond:
The culture of your organization is open to change. You
are able to react and adapt quickly, and are open to new
ideas.
40 to 49:
Your organization understands that change is a reality. In
some ways you are open to it, but you have not fully
embraced it, nor are you harnessing change to make it
work for you.
30 to 39:
Your organization understands the value of change, but
you need to be more open to its reality and quicker in the
implementation process.
15 to 29:
You need to make some significant changes to your
organizational culture regarding peoples willingness to
adapt, be flexible and open to new ideas
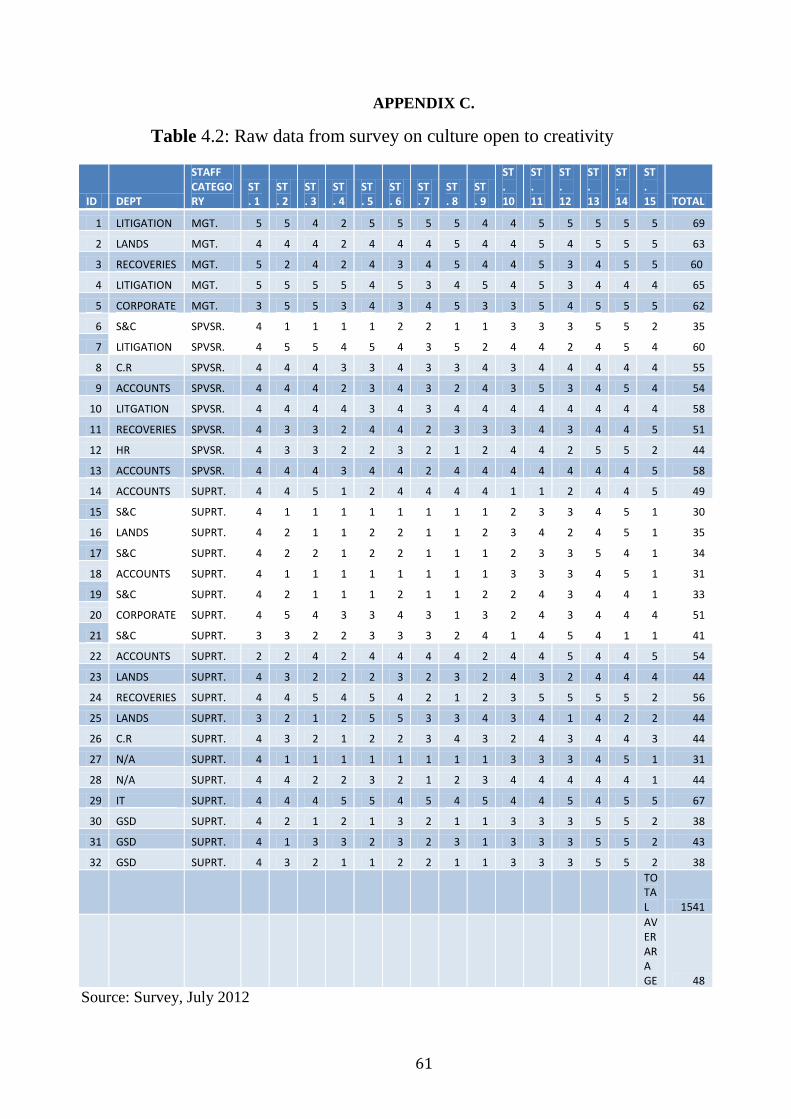
61
APPENDIX C.
Table 4.2: Raw data from survey on culture open to creativity
Source: Survey, July 2012
ID DEPT
STAFF CATEGORY
ST. 1
ST. 2
ST. 3
ST. 4
ST. 5
ST. 6
ST. 7
ST. 8
ST. 9
ST. 10
ST. 11
ST. 12
ST. 13
ST. 14
ST. 15 TOTAL
1 LITIGATION MGT. 5 5 4 2 5 5 5 5 4 4 5 5 5 5 5 69
2 LANDS MGT. 4 4 4 2 4 4 4 5 4 4 5 4 5 5 5 63
3 RECOVERIES MGT. 5 2 4 2 4 3 4 5 4 4 5 3 4 5 5 60
4 LITIGATION MGT. 5 5 5 5 4 5 3 4 5 4 5 3 4 4 4 65
5 CORPORATE MGT. 3 5 5 3 4 3 4 5 3 3 5 4 5 5 5 62
6 S&C SPVSR. 4 1 1 1 1 2 2 1 1 3 3 3 5 5 2 35
7 LITIGATION SPVSR. 4 5 5 4 5 4 3 5 2 4 4 2 4 5 4 60
8 C.R SPVSR. 4 4 4 3 3 4 3 3 4 3 4 4 4 4 4 55
9 ACCOUNTS SPVSR. 4 4 4 2 3 4 3 2 4 3 5 3 4 5 4 54
10 LITGATION SPVSR. 4 4 4 4 3 4 3 4 4 4 4 4 4 4 4 58
11 RECOVERIES SPVSR. 4 3 3 2 4 4 2 3 3 3 4 3 4 4 5 51
12 HR SPVSR. 4 3 3 2 2 3 2 1 2 4 4 2 5 5 2 44
13 ACCOUNTS SPVSR. 4 4 4 3 4 4 2 4 4 4 4 4 4 4 5 58
14 ACCOUNTS SUPRT. 4 4 5 1 2 4 4 4 4 1 1 2 4 4 5 49
15 S&C SUPRT. 4 1 1 1 1 1 1 1 1 2 3 3 4 5 1 30
16 LANDS SUPRT. 4 2 1 1 2 2 1 1 2 3 4 2 4 5 1 35
17 S&C SUPRT. 4 2 2 1 2 2 1 1 1 2 3 3 5 4 1 34
18 ACCOUNTS SUPRT. 4 1 1 1 1 1 1 1 1 3 3 3 4 5 1 31
19 S&C SUPRT. 4 2 1 1 1 2 1 1 2 2 4 3 4 4 1 33
20 CORPORATE SUPRT. 4 5 4 3 3 4 3 1 3 2 4 3 4 4 4 51
21 S&C SUPRT. 3 3 2 2 3 3 3 2 4 1 4 5 4 1 1 41
22 ACCOUNTS SUPRT. 2 2 4 2 4 4 4 4 2 4 4 5 4 4 5 54
23 LANDS SUPRT. 4 3 2 2 2 3 2 3 2 4 3 2 4 4 4 44
24 RECOVERIES SUPRT. 4 4 5 4 5 4 2 1 2 3 5 5 5 5 2 56
25 LANDS SUPRT. 3 2 1 2 5 5 3 3 4 3 4 1 4 2 2 44
26 C.R SUPRT. 4 3 2 1 2 2 3 4 3 2 4 3 4 4 3 44
27 N/A SUPRT. 4 1 1 1 1 1 1 1 1 3 3 3 4 5 1 31
28 N/A SUPRT. 4 4 2 2 3 2 1 2 3 4 4 4 4 4 1 44
29 IT SUPRT. 4 4 4 5 5 4 5 4 5 4 4 5 4 5 5 67
30 GSD SUPRT. 4 2 1 2 1 3 2 1 1 3 3 3 5 5 2 38
31 GSD SUPRT. 4 1 3 3 2 3 2 3 1 3 3 3 5 5 2 43
32 GSD SUPRT. 4 3 2 1 1 2 2 1 1 3 3 3 5 5 2 38
TOTAL 1541
AVERARAGE 48
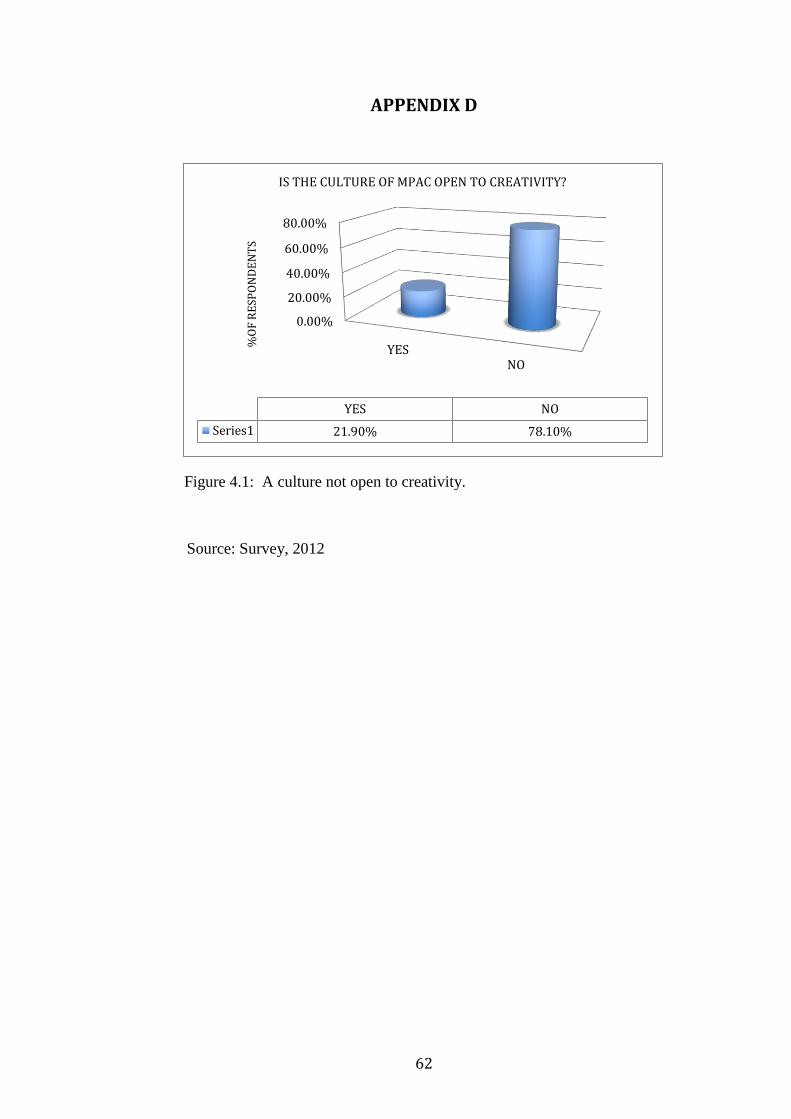
62
APPENDIX D
Figure 4.1: A culture not open to creativity.
Source: Survey, 2012
0.00%
20.00%
40.00%
60.00%
80.00%
YESNO
%O
F R
ESP
ON
DE
NT
S
YES NO
Series1 21.90% 78.10%
IS THE CULTURE OF MPAC OPEN TO CREATIVITY?
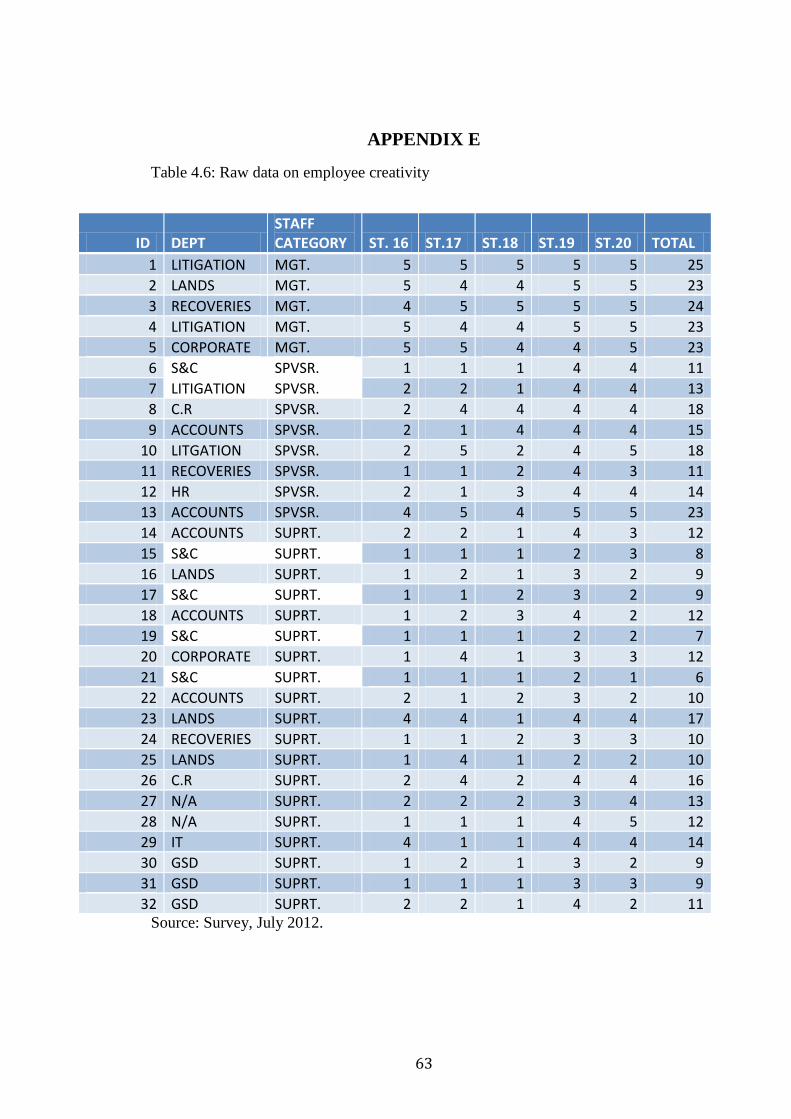
63
APPENDIX E
Table 4.6: Raw data on employee creativity
Source: Survey, July 2012.
ID DEPT STAFF CATEGORY ST. 16 ST.17 ST.18 ST.19 ST.20 TOTAL
1 LITIGATION MGT. 5 5 5 5 5 25
2 LANDS MGT. 5 4 4 5 5 23
3 RECOVERIES MGT. 4 5 5 5 5 24
4 LITIGATION MGT. 5 4 4 5 5 23
5 CORPORATE MGT. 5 5 4 4 5 23
6 S&C SPVSR. 1 1 1 4 4 11
7 LITIGATION SPVSR. 2 2 1 4 4 13
8 C.R SPVSR. 2 4 4 4 4 18
9 ACCOUNTS SPVSR. 2 1 4 4 4 15
10 LITGATION SPVSR. 2 5 2 4 5 18
11 RECOVERIES SPVSR. 1 1 2 4 3 11
12 HR SPVSR. 2 1 3 4 4 14
13 ACCOUNTS SPVSR. 4 5 4 5 5 23
14 ACCOUNTS SUPRT. 2 2 1 4 3 12
15 S&C SUPRT. 1 1 1 2 3 8
16 LANDS SUPRT. 1 2 1 3 2 9
17 S&C SUPRT. 1 1 2 3 2 9
18 ACCOUNTS SUPRT. 1 2 3 4 2 12
19 S&C SUPRT. 1 1 1 2 2 7
20 CORPORATE SUPRT. 1 4 1 3 3 12
21 S&C SUPRT. 1 1 1 2 1 6
22 ACCOUNTS SUPRT. 2 1 2 3 2 10
23 LANDS SUPRT. 4 4 1 4 4 17
24 RECOVERIES SUPRT. 1 1 2 3 3 10
25 LANDS SUPRT. 1 4 1 2 2 10
26 C.R SUPRT. 2 4 2 4 4 16
27 N/A SUPRT. 2 2 2 3 4 13
28 N/A SUPRT. 1 1 1 4 5 12
29 IT SUPRT. 4 1 1 4 4 14
30 GSD SUPRT. 1 2 1 3 2 9
31 GSD SUPRT. 1 1 1 3 3 9
32 GSD SUPRT. 2 2 1 4 2 11
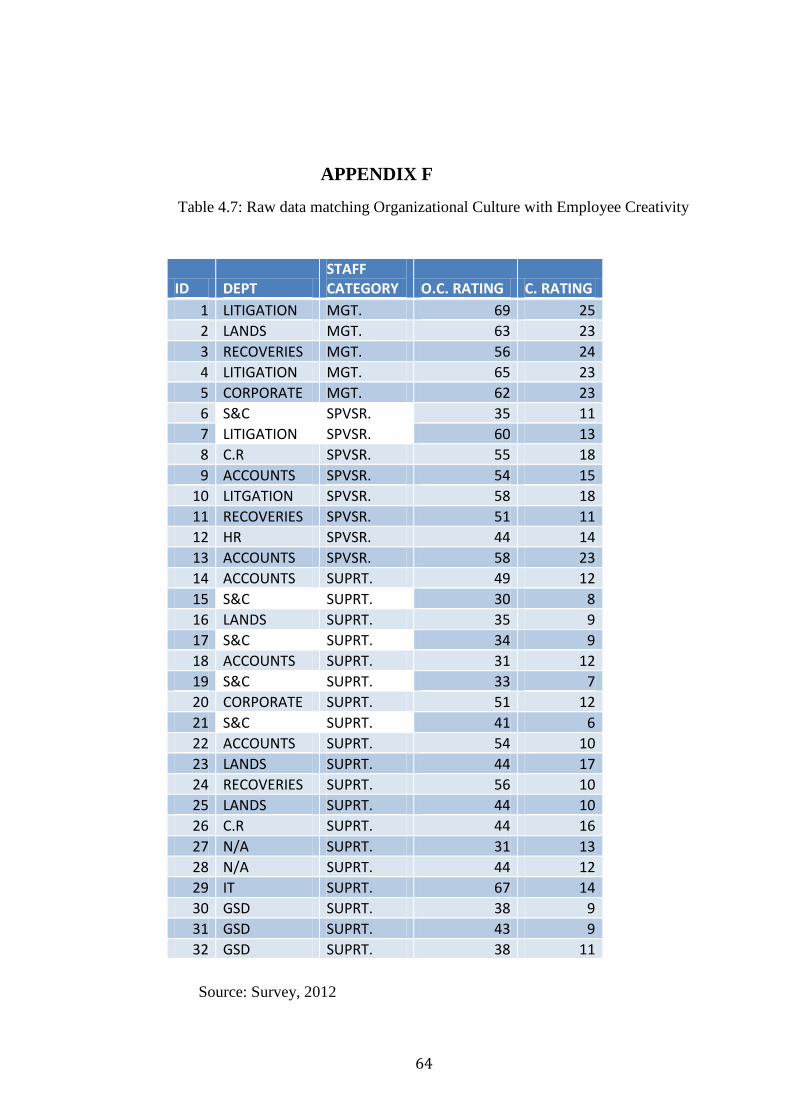
64
APPENDIX F
Table 4.7: Raw data matching Organizational Culture with Employee Creativity
Source: Survey, 2012
ID DEPT STAFF CATEGORY O.C. RATING C. RATING
1 LITIGATION MGT. 69 25
2 LANDS MGT. 63 23
3 RECOVERIES MGT. 56 24
4 LITIGATION MGT. 65 23
5 CORPORATE MGT. 62 23
6 S&C SPVSR. 35 11
7 LITIGATION SPVSR. 60 13
8 C.R SPVSR. 55 18
9 ACCOUNTS SPVSR. 54 15
10 LITGATION SPVSR. 58 18
11 RECOVERIES SPVSR. 51 11
12 HR SPVSR. 44 14
13 ACCOUNTS SPVSR. 58 23
14 ACCOUNTS SUPRT. 49 12
15 S&C SUPRT. 30 8
16 LANDS SUPRT. 35 9
17 S&C SUPRT. 34 9
18 ACCOUNTS SUPRT. 31 12
19 S&C SUPRT. 33 7
20 CORPORATE SUPRT. 51 12
21 S&C SUPRT. 41 6
22 ACCOUNTS SUPRT. 54 10
23 LANDS SUPRT. 44 17
24 RECOVERIES SUPRT. 56 10
25 LANDS SUPRT. 44 10
26 C.R SUPRT. 44 16
27 N/A SUPRT. 31 13
28 N/A SUPRT. 44 12
29 IT SUPRT. 67 14
30 GSD SUPRT. 38 9
31 GSD SUPRT. 43 9
32 GSD SUPRT. 38 11
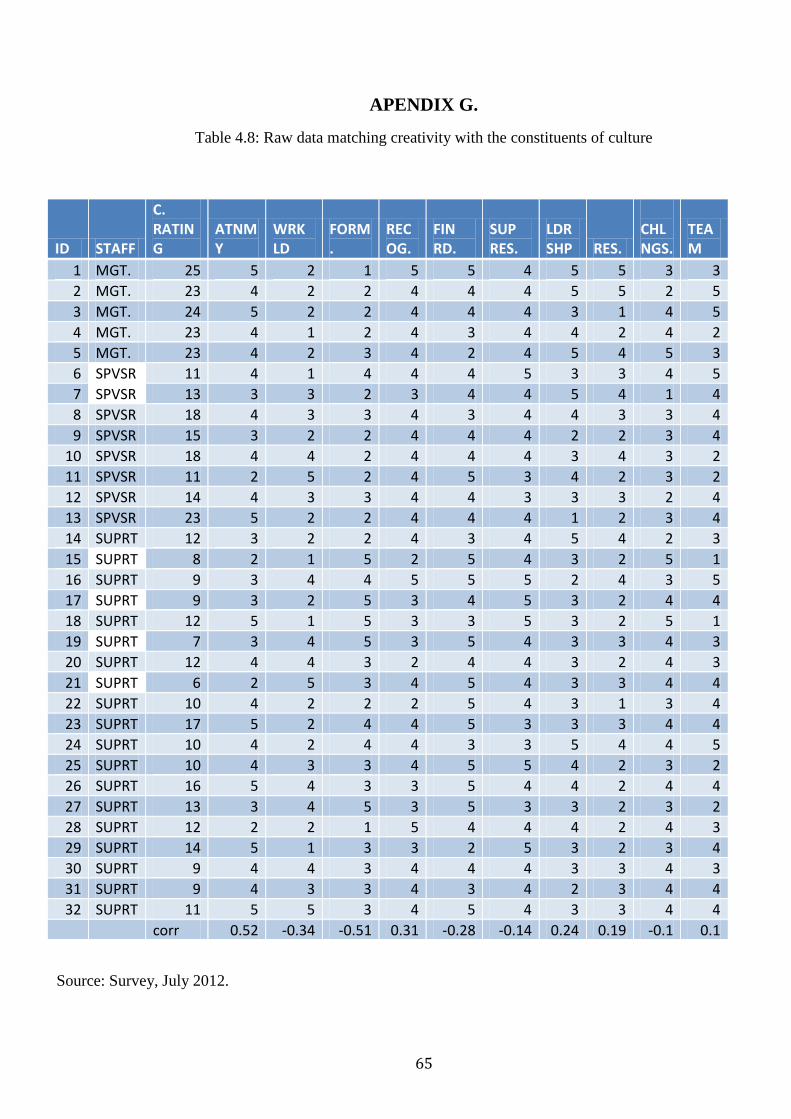
65
APENDIX G.
Table 4.8: Raw data matching creativity with the constituents of culture
Source: Survey, July 2012.
ID STAFF
C. RATING
ATNMY
WRK LD
FORM.
RECOG.
FIN RD.
SUP RES.
LDRSHP RES.
CHLNGS.
TEAM
1 MGT. 25 5 2 1 5 5 4 5 5 3 3
2 MGT. 23 4 2 2 4 4 4 5 5 2 5
3 MGT. 24 5 2 2 4 4 4 3 1 4 5
4 MGT. 23 4 1 2 4 3 4 4 2 4 2
5 MGT. 23 4 2 3 4 2 4 5 4 5 3
6 SPVSR 11 4 1 4 4 4 5 3 3 4 5
7 SPVSR 13 3 3 2 3 4 4 5 4 1 4
8 SPVSR 18 4 3 3 4 3 4 4 3 3 4
9 SPVSR 15 3 2 2 4 4 4 2 2 3 4
10 SPVSR 18 4 4 2 4 4 4 3 4 3 2
11 SPVSR 11 2 5 2 4 5 3 4 2 3 2
12 SPVSR 14 4 3 3 4 4 3 3 3 2 4
13 SPVSR 23 5 2 2 4 4 4 1 2 3 4
14 SUPRT 12 3 2 2 4 3 4 5 4 2 3
15 SUPRT 8 2 1 5 2 5 4 3 2 5 1
16 SUPRT 9 3 4 4 5 5 5 2 4 3 5
17 SUPRT 9 3 2 5 3 4 5 3 2 4 4
18 SUPRT 12 5 1 5 3 3 5 3 2 5 1
19 SUPRT 7 3 4 5 3 5 4 3 3 4 3
20 SUPRT 12 4 4 3 2 4 4 3 2 4 3
21 SUPRT 6 2 5 3 4 5 4 3 3 4 4
22 SUPRT 10 4 2 2 2 5 4 3 1 3 4
23 SUPRT 17 5 2 4 4 5 3 3 3 4 4
24 SUPRT 10 4 2 4 4 3 3 5 4 4 5
25 SUPRT 10 4 3 3 4 5 5 4 2 3 2
26 SUPRT 16 5 4 3 3 5 4 4 2 4 4
27 SUPRT 13 3 4 5 3 5 3 3 2 3 2
28 SUPRT 12 2 2 1 5 4 4 4 2 4 3
29 SUPRT 14 5 1 3 3 2 5 3 2 3 4
30 SUPRT 9 4 4 3 4 4 4 3 3 4 3
31 SUPRT 9 4 3 3 4 3 4 2 3 4 4
32 SUPRT 11 5 5 3 4 5 4 3 3 4 4
corr 0.52 -0.34 -0.51 0.31 -0.28 -0.14 0.24 0.19 -0.1 0.1