Embed Size (px)
Citation preview

European Commission, DG RTD
Assessment of the Impact of the 6th Framework Programme on new Member States Final Report
May 2009

European Commission, DG RTD
Assessment of the Impact of the 6th Framework Programme on new Member States Final Report
May 2009
COWI A/S Parallelvej 2 DK-2800 Kongens Lyngby Denmark Tel +45 45 97 22 11 Fax +45 45 97 22 12 www.cowi.com
Report no. COWI Portal/69472/Project documents/Reporting
Issue no. 2
Date of issue 24/05-2009
Prepared MS, MRJE, CHSU, ANLE, MDTJ. MIKL, AR, AV, EL
Checked Karen Siune, MRJE
Approved AR

Assessment of the Impact of the 6th Framework Programme on new Member States
C:\Documents and Settings\ms\Local Settings\Temporary Internet Files\OLK36\FP6_New MS_Final Report_24 05 09_final (2).doc
1
.
Table of Contents
Executive Summary 2
1 Introduction 8
2 FP6 and the new Member States 14 2.1 Early experiences of FP participation 14 2.2 New MS' FP6 participation 15
3 Policy and conditions for FP6 involvement 29 3.1 Measures to promote FP6 29 3.2 Needs of the country 33 3.3 Research policy developments 34
4 Impact of FP6 participation 38 4.1 System learning 38 4.2 Organisational impact 42 4.3 Unintended consequences 43 4.4 Examples of social and economic impacts 43 4.5 Barriers to FP6 participation 44
5 Conclusion 51
Table of Appendices
Appendix 1 List of literature Appendix 2 List of persons interviewed Appendix 3 A brief presentation of FP6 Appendix 4 Research in the new Member States

Assessment of the Impact of the 6th Framework Programme on new Member States
C:\Documents and Settings\ms\Local Settings\Temporary Internet Files\OLK36\FP6_New MS_Final Report_24 05 09_final (2).doc
2
.
Executive Summary Since 1992 when cooperation in research with the then-candidate countries
began, the new EU Member States have been progressively more closely inte-grated into Community research activities. Certain positive trends as well as persisting challenges have been identified. This 'Assessment of the Impact of the 6th Framework Programme on new Member States' has as its purpose to de-scribe the impact on and evolving participation of the 12 new Member States (MS) in the 6th Framework Programme and into Community research activities in general.
The assessment addresses nine evaluation questions which cover the quantita-tive and qualitative aspects of the new MS's FP6 participation, such as the level of participation, the impact of participation and barriers to participation.
The assessment is based on three complementary data sources namely, a quan-titative description using the DG Research FP6 database covering all 12 new Member States, five detailed country studies covering Poland, Lithuania, Ro-mania, Slovenia, and Czech Republic, follow-up interviews with international experts. Data was then analysed and the evaluation questions were answered.
Figure 1 Overview of the evaluation design
Background and purpose of study
Data and methodol-ogy

Assessment of the Impact of the 6th Framework Programme on new Member States
C:\Documents and Settings\ms\Local Settings\Temporary Internet Files\OLK36\FP6_New MS_Final Report_24 05 09_final (2).doc
3
.
The assessment was undertaken for the Directorate General for Research in the wider context of the independent high-level ex-post evaluation of the European Union Framework Programmes. It was carried out by COWI A/S together with its consortium partner IDEA during the period June 2008 - January 2009 (in the further context of the Framework Contract on evaluation and evaluation-related services (BUDF 06/PO/01/Lot3), signed with a consortium led by COWI A/S. The study process was supervised by a Steering Committee made up of Com-mission representatives which met at the occasion of the Kick-off meeting (8/7-08), Inception meeting (5/9-08), Interim meeting (28/10-08) and the Final meeting (27/1-09).
The report presents the findings and views of the Consultant which do not nec-essarily coincide with those of the Commission.
The evaluation covers four themes:
• The general picture regarding the participation of new MS in the FP6 • Degree to which new MS have maximised the potential of FP6 • Impact of FP6 on the research system and involved research institutions • Barriers that have limited the participation
The total amount dedicated to FP6 in all 27 Member States was 16.7 billion EUR and from this amount research institutions in new Member States have managed to attract around EUR 824 million, equal to 4.9% of the total.
To put these figures in perspective, the research performers in EU27 have re-ceived a funding similar to 34 EUR per inhabitant in EU27 while the EUR 824 million allocated to research performers in new MS amounts to 8 EUR per in-habitant in the new MS.1
The level of participation of new MS may therefore at first sight appear to have been limited. However, the analysis also shows that:
• The FP6 funding going to new MS - if compared against GERD (national RD expenditure) - amounts to no less than 4.33% of national R&D expen-diture which is significantly higher than EU27 average (2.1%); hence the allocation represents a significant 'volume' of resources in the context of the national research sectors
• Relative to GDP, the FP6 contribution is not far below the EU27 average. Six new MS actually receive a FP6 contribution which, compared to the countries' GDP, is above the EU27 average
1 The FP6 funding is attributed to participants in FP6 and not to a specific country; thus the amounts presented are accumulated amounts gathered by participants according to national origin.
Study organisation
The general picture regarding the partici-pation of the new MS in the FP6

Assessment of the Impact of the 6th Framework Programme on new Member States
C:\Documents and Settings\ms\Local Settings\Temporary Internet Files\OLK36\FP6_New MS_Final Report_24 05 09_final (2).doc
4
.
• The overall difference between new MS and EU27 in FP6 funding is re-duced to some degree when adjusted for the different price structures in the countries (purchasing power parity)
It is therefore a main conclusion of this study that there is no simple measure to adequately illustrate the position of new Member States participation in FP6. The analysis shows that research performers from some countries - Slovenia, Cyprus, Malta and Estonia - have participated intensively in FP6 and for these countries the degree of participation is close to or above the EU27 average (de-pending on indicator). Next, there is an 'in-between' group of countries includ-ing the Czech Republic and Hungary, while the level of participation of re-search performers from Bulgaria, Latvia, Lithuania, Poland, Romania and Slo-vakia was significantly below the EU27 average.
It can further be concluded that the new MS are well integrated into FP6 in so far that research performers in new MS have been involved in all the FP6 the-matic areas2 and all the different instruments offered by FP6. Specifically, the study shows that:
• The research area producing the highest EC contribution to the new MS is 'Information society and technologies' (more than 20% of the total) with 'Sustainable development', and 'Human resources and mobility' the second most popular priorities gathering between 10 and 15% of the total EC con-tribution
• The new MS appears relatively homogenous in the prioritising between the priority areas: Information society and Sustainable development are the two areas attracting most participants from all new MS
• The distribution of contributions per instrument to the new MS follows roughly that of FP6 as a whole, however with some exceptions. The new MS have attracted significantly more contributions related to specific sup-port actions (app. 11%) than the total EC contributions (app 6%). One of the new instruments of FP6 - integrated projects (IP) - accounts for 40% of the total EC contributions, but only 26% of the contributions to the new MS. Thus the instrument to which the largest amount of contributions is at-tributed, at the same time a new instrument introduced by FP6, has resulted in a significantly smaller share of the funding going to the new MS as compared with the EU27 as a whole
A low level of industry participation in FP6 has been identified. Whereas indus-try in the new MS managed to attract 11% of the total contribution, the same figure was 18% for industry globally in the EU27. In the context of the case country studies, four factors have subsequently been identified as barriers: Lim-ited knowledge of FP6 (only some countries), a general low focus on R&D (specifically Poland and Romania while much less so in Slovenia and Czech Republic), FP6 administrative procedures perceived as unreasonable demand- 2 Seven priority areas, three cross-cutting research activities, two activities targeted the foundation of ERA and five activities directed at the structuring of ERA.

Assessment of the Impact of the 6th Framework Programme on new Member States
C:\Documents and Settings\ms\Local Settings\Temporary Internet Files\OLK36\FP6_New MS_Final Report_24 05 09_final (2).doc
5
.
ing, and finally have industry representatives in new MS suffered from less de-veloped contacts with research institutions in 'old' EU MS.
It should finally be noted that an almost perfect correlation has been identified between national macro-economic performance (GDP) and EC contribution to the individual new MS: the higher GDP of a country the more will its research sector participate in FP6. The causality of this correlation has not been fully explored but it appears plausible that the prerequisites for a successful partici-pation in FP (access to equipment, high-level research competences, established international contacts, familiarity with networking processes, etc.) are more commonly found in well-developed economies.
The new MS have to a high degree maximised the potential of FP6 via three types of actions:
FP6 as a driver for specific policy changes. FP6 has had a profound impact on national research policies as it has, to a significant (but varying) degree, in-spired a process of aligning national research priorities with the FP priorities. Examples are thus given of countries studied in the context of this assessment (e.g. Romania and Lithuania, and to lesser extent also Poland, Czech Republic and Slovenia) where the impact has been massive and FP6 priorities have effec-tively substituted 'national' priorities. It should be noted however, that the over-all assessment of such change needs to be carefully weighed: some critics in the countries concerned, representing a minority of the national experts that were consulted, see this process as a 'copying' of the European model and with a risk of overlooking national research areas.
FP6 as a driver for a more strategic approach to national research policy. In some of the new Member States FP6 has been a vehicle for a transformation and re-orientation of the research policy planning (Romania, Lithuania, Poland) where the programmatic qualities of the FP6 have been used. These qualities include:
• The strategic and 'applied' approach to research with priority areas • The planning horizon (e.g. adopting a 2007-2013 time horizon) • The evaluation procedure for national research proposals
Launch of activities to promote FP6 participation. The new MS were in a less favourable situation than other MS due to a lack of contacts and previous ex-perience with the EU-programmes, and to counter this situation the following promotion activities were implemented:
• Comprehensive awareness-raising activities organised by a system of Na-tional Contact Points (NCP). These operated in all countries but a differ-ence could be seen between countries where the system was well institu-tionalised (like Czech Republic and Slovenia) and countries where a 'first generation' of NCPs should be organised (Romania)
• Financial support measures for proposal preparation (Poland, Slovenia, Czech Republic) as well as support to cover the participant's own contribu-
Degree to which new MS have maximised the potential of FP6

Assessment of the Impact of the 6th Framework Programme on new Member States
C:\Documents and Settings\ms\Local Settings\Temporary Internet Files\OLK36\FP6_New MS_Final Report_24 05 09_final (2).doc
6
.
tion to project budgets (Poland, Romania) seem to have had a significant effect in terms of motivating potential participants
• National research liaison offices were set up in Brussels. All the Member States have RTD offices in Brussels to promote participation in FP6
• FP6 participation counts in national research evaluations. To stimulate an international reorientation of national research, some countries (Romania, Lithuania, Poland) reward submission of FP6 proposals in national re-search evaluation procedures, using a standardised 'uplift' (for instance in Romania, where an FP6 submitted proposal automatically receives a 5 point bonus; out of 100 points)
Many of the stakeholders in the new MS that were consulted for this study con-sider that the 'culture' and design of the 6th Framework Programme - with the emphasis on multidisciplinary networks, a high degree of international coopera-tion and a need for beneficiaries to have appropriate infrastructure in terms of equipment (e.g. laboratories) and support services (e.g. financial and adminis-trative staff with required skills) - was not the most adequate to promote par-ticipation from the new MS. It has thus been pointed out that the specific needs of countries only to a limited degree were taken into account in the design of FP6 which on the one hand is seen as 'natural' since the new MS did not articu-late their priorities very well (they were preparing for accession to the EU at the time when the 6th Framework Programme was designed). It has on the other hand also been noted that DG RTD could have carried out a more systematic needs assessment prior to designing FP6, and that the communication between the accessing countries and DG RTD was not optimal for the exchange of viewpoints.
FP6 has had an important impact on research organisations' interests and capac-ity in networking and has inspired a networking approach to the management and implementation of research projects with more focus on cooperation, con-sortia-creation, multi-disciplinarity, communication and management skills. This value of the 6th FP does not rest only with the results of the funded pro-jects per se (where few tangible impacts have materialised), but also to FP6's structuring impact on national research systems and the participating institu-tions.
Table 1 The dynamics introduced with FP6
Before FP6 - a tendency towards… After FP6 - new dynamics introduced…
Sectoral approach Towards a multi-disciplinary and network approach
Basic research Towards more applied research
Unclear relations between research institu-tions and business
Towards increased cooperation between different actors
Less focus on communication and visibility of research projects
Towards a new focus on communication and project management
Impact of FP6 on the research system and involved research institutions

Assessment of the Impact of the 6th Framework Programme on new Member States
C:\Documents and Settings\ms\Local Settings\Temporary Internet Files\OLK36\FP6_New MS_Final Report_24 05 09_final (2).doc
7
.
For the institutions participating in FP6, the most significant impacts have been a gradual change of perspective and work culture towards a more collaborative, interdisciplinary, international, and project oriented work form - an effect that goes far beyond the individual FP6 projects hence representing an important behavioural additionality. This impact was emphasised by the research per-formers and other stakeholders, and the observation was confirmed via the fol-low-up interviews. The main impacts (across the countries):
• Access to state-of-the-art knowledge and skills • Getting to know the right people /networking • Visibility and ability to expose skills to international audience • Networking culture and project management skills into the organisation • Increased prestige attached to research performers part of FP6 The interviewed research performers were asked to make a condensed assess-ment of their FP experience by evaluating if benefits of the FP6 participation all in all would exceed the costs of participation. The answers were positive and it is therefore a final conclusion that while the participation in FP6 sometimes has been much less positive than expected for the involved institutions, they are nevertheless likely to be willing to take part in future FPs.
The main barriers are lack of professional contacts and networks and a percep-tion of the administrative burdens associated with FP6 projects.
Table 2 Importance of various barriers to FP6 participation
Barrier Importance
Information barriers Very important factor in some countries when FP6 was launched; mitigated via the NCP-system; im-portance of this factor is decreasing over time
Lack of professional contacts and research networks
Very important - mentioned by all stakeholders
Language barriers Some importance - in particular for administrative staff. Over time a less important barrier
Availability of national financing Important - a tendency to become a less important barrier for most countries experiencing increasing national research budgets
Perception of 'Brussels bureauc-racy' and lack of practice in project management
Very important factor (however, in Romania it was given less importance).
Barriers that have limited the participa-tion
Assessment of the Impact of the 6th Framework Programme on new Member States
C:\Documents and Settings\ms\Local Settings\Temporary Internet Files\OLK36\FP6_New MS_Final Report_24 05 09_final (2).doc
8
.
1 Introduction Since 1992 when cooperation in research with the then-Candidate Countries
began, the new EU Member States have been progressively more closely inte-grated into Community research activities and certain positive trends have been identified. However, there is also some evidence to the fact that certain chal-lenges persist for the new Member States to make full use of the opportunities afforded by the Community Framework Programmes. It is therefore relevant to identify current levels of participation in Community research activities and to identify the impacts that the participation has had in the countries.
The purpose of this 'Assessment of the Impact of the 6th Framework Pro-gramme on new Member States' is to describe the evolving participation of the 12 new Member States in the 6th Framework Programme and in the Commu-nity research activities in general. The assessment addresses specifically nine evaluation questions covering the quantitative and qualitative aspects of the new Member States' FP6 participation, such as: Level of participation, impact of participation and barriers to participation.
The 12 new Member States became members of the European Union on 1 May 2004 except Romania and Bulgaria who joined in 2007. This evaluation con-cerns FP6 2003-2006, thus the new Member States had access to FP6 before becoming EU Members, and Bulgaria and Romania participated when outside the EU. Today all 12 countries are EU Member States and contribute to the fi-nancing of the EU budget in accordance with the financing procedures (ap-proximately 1% of GDP) and are participating fully in policies and pro-grammes.
The fact-finding and analytical process has been guided by nine evaluation questions given by the ToR3. The questions have been categorised into four groups of questions depending on their nature:
• One question on the level of participation - i.e. the provision of the basic overview of the intensity of participation of the new MS in FP6
• Three questions on policy and overall conditions for FP involvement - i.e. a review of actions taken within the new MS to promote and prepare for
3 The ToR mentions ten questions whereof two questions concerning system learning and impact on national research infrastructure, respectively. These questions have been merged into one question on system learning, see section 4.3.
Background and purpose of study
Membership status of the 12 new MS
The evaluation ques-tions

Assessment of the Impact of the 6th Framework Programme on new Member States
C:\Documents and Settings\ms\Local Settings\Temporary Internet Files\OLK36\FP6_New MS_Final Report_24 05 09_final (2).doc
9
.
the FP and an analysis of the degree to which FP6 has influenced national research policy development
• Five questions on impacts of FP6 - i.e. describing and analysing the vari-ous types of impacts such as the direct impact on involved organisations and broader 'systemic' impacts on the research infrastructure
• One question on barriers and success factors - i.e. a review of factors that have hindered/contributed to achieve a given level of FP6 participation
Table 3 Organisation of evaluation questions
Overall theme Specific evaluation question as per ToR
Participation Q4: The general picture regarding the participation of new Member States in the FP6?
Q1: Specific measures to promote the Framework Programme participation?
Q2: Specific needs taken into account in designing the FP?
Policy and conditions for FP6 involve-ment Q6: Evidence of research policy development in order to maximise the potential of the FP?
Q5: Evidence of organisational or system learning amongst potential participants?
Q7: The impact of participation in the FP on the organisations involved?
Q9: Early examples of economic or social impacts?
Impacts - at different levels
Q8: Un-intended or possibly undesirable consequences of participation in the FP?
Barriers Q3: What have been the major barriers which have limited or prevented the participation?
Note: The evaluation questions are elaborated in relevant chapters. The numbering of questions given by the ToR
Based on a combination of desk review, database analysis, country case studies and interviews with national and international experts, the main part of the study consists of a quantitative description covering all 12 new Member States and 5 detailed country studies covering Poland, Lithuania, Romania, Slovenia, and the Czech Republic. The study has been undertaken in four work packages.
Figure 2 An overview of the evaluation design
Methodology: Four work packages

Assessment of the Impact of the 6th Framework Programme on new Member States
C:\Documents and Settings\ms\Local Settings\Temporary Internet Files\OLK36\FP6_New MS_Final Report_24 05 09_final (2).doc
10
.
The Scoping Analysis gives an overall and quantitative description of the in-volvement of all 12 new MS in FP6 and thereby addresses evaluation question no. 4: 'What is the general picture regarding the participation of the New Mem-ber States in the FP, e.g. types of organisation, etc.' The scoping analysis (per-formed as a quantitative analysis drawing on the DG Research database on FP and available Eurostat data) makes it possible to see differences and similarities across the countries. It does not, however, 'explain' the differences and does not reveal what the countries did to involve themselves with FP6. Instead this type of information is derived from the country studies.
The 'country studies' is the main work package of the study since it provides new and detailed insights into dynamics, barriers and developments brought about by FP6. It gives a detailed account of the countries' action towards FP6; what barriers they encountered and what the initial impacts have been. The country studies address qualitative issues and they were designed with a view to detect plausible explanations of the tendencies that are revealed by the scop-ing analysis. The study team has also tried to identify 'good practices' on how new Member States can build capacity for participation in international re-search activities. To be noted also, the country studies have had a focus first and foremost on compiling information necessary to answer the evaluation questions, while in the broader interpretation of data, it has made use of the al-ready existing descriptions of national R&D systems.4
The impact of FP6 was analysed in detail for five countries: Czech Republic, Lithuania, Poland, Romania and Slovenia. Several criteria were taken into ac-count in the selection of the five countries:
• Size of country (in terms of population): considering both large (Poland and Romania), medium (Czech Republic) and smaller (Lithuania, Slove-nia) Member States
4 European Innovation Scoreboard 2007. The European Innovation Scoreboard - based on 25 indicators - has been developed for some years to provide a comparative assessment of the innovation performance of EU Member States. The most recent version categorises two of the case countries as moderate innovators (Czech Republic, Slovenia) while three coun-tries belong to the catching-up category (Lithuania, Poland, Romania). It is obviously rele-vant to check for correlations with FP6 involvement. EC INNO-Policy Trend Chart country reports for Czech Republic, Lithuania, Poland, Romania and Slovenia provides a rather detailed overview of the countries' innovation systems, actors involved, national innovation objectives. EraWatch country reports for Czech Republic, Lithuania, Poland, and Romania provide information on national and regional research policies, structures, support measures and organisations. The reports are thus essential in preparing us for the fact-finding sessions as they inform on national research objectives and developments and also contain prelimi-nary assessments of the impact of EU framework programmes on the countries'. “POLICY MIX” country reports for Czech Republic, Lithuania, Poland, Romania and Slovenia. These reports analyse the combination of policy instruments which interact to influence the quantity and quality of R&D investments, and they likewise provide a wealth of back-ground information on the capacity and motivation for involvement with FP6.
Work package 1: Scoping analysis
Work package 2: The country studies
Criteria for selection of countries

Assessment of the Impact of the 6th Framework Programme on new Member States
C:\Documents and Settings\ms\Local Settings\Temporary Internet Files\OLK36\FP6_New MS_Final Report_24 05 09_final (2).doc
11
.
• Differences in national research intensity (R&D expenditure as % of GDP) where the Czech Republic and Slovenia rate high, whereas at the other end of the scale Romania rates low devoting less than 0.4% of GDP to R&D (as per 2005)5. Finally, Slovenia and Poland have a comparably high share of R&D personnel employed, relative to persons employed, whilst the Czech Republic is at the end of the scale, Lithuania and Romania being in the middle (as per 2004)6
• Differences in innovation performance as seen in the ranking on the Euro-pean Innovation Scoreboard (Trend chart 2007).7 The most recent version categorises two of the selected countries as moderate innovators (Czech Republic, Slovenia) while three countries belong to the catching-up cate-gory (Lithuania, Poland, Romania)
• Different stages of economic development and different geographical situations: considering those new Member States with a relatively high GDP per capita, i.e. Slovenia and the Czech Republic, and with a relatively low GDP per capita, i.e. Romania, with Lithuania and Poland being in the medium range; different geographical situations appear, which may influ-ence the thematic focus and the possibilities and traditions for international networks in the countries
The aim of applying these criteria - leading to a selection of five countries with clearly different starting points for FP6 participation - was to ensure that the five country studies in the best possible manner would be able to provide find-ings and lessons learned that reasonably well can be generalised to all new Member States. The following table gives an overview of how the selected countries are placed in relation to the selection criteria.
Table 4 Selection criteria
Czech Rep. Lithuania Poland Romania Slovenia
Size Medium Small Large Large Small
Geography Mid North east North east South east South
R&D Expenditure High Mid Mid Low High
Innovation level Moderate Catch-up Catch-up Catch-up Moderate
GDP pr. capita High Mid Mid Low High
Note: Absolute figures to be found in appendix 4
The overall analytic strategy was determined with a view to ensuring that the five country studies would produce results in their own right, i.e. national- 5 Based on DG Research (2008) Key Figures 2007 on Science, Technology and Innovation - Towards a European Knowledge Area. 6 Based on Eurostat (2007) Science, technology and innovation in Europe. 7 The European Innovation Scoreboard - based on 25 indicators - has been developed for some years to provide a comparative assessment of the innovation performance of EU Member States.
Different starting points for FP6 par-ticipation
From five to 12 countries

Assessment of the Impact of the 6th Framework Programme on new Member States
C:\Documents and Settings\ms\Local Settings\Temporary Internet Files\OLK36\FP6_New MS_Final Report_24 05 09_final (2).doc
12
.
specific findings, as well as providing a basis for making conclusions valid for all 12 new MS. To achieve the latter, the following considerations were ap-plied:
• The criteria for selection of case countries, cf. above, shall ensure that five case countries represents key differences between the new MS. It is shown in section 2.2 that the five countries are different in terms of FP6 participa-tion with countries close to the EU-average in terms of funding/capita (Slo-venia), countries significantly below EU-average (Lithuania, Poland, Ro-mania) and a group of in-between countries (Czech Republic)
• Triangulation. Another important basis for generalisation is the follow-up interviews (see below) with international experts with knowledge of FP6, European research and the new MS
• Analytical generalisation. Further, it is discussed throughout the report the degree to which it is likely that a particular observation can be extended to cover all new MS. In general, we consider that the overall evaluation con-clusions (see chapter 5) are valid for all new MS while the validity of a number of specific observations is limited to the national context
For details on how the country studies were undertaken, see the below text box.
Text box 1 The process of undertaking country studies
The impact of FP6 was analysed in detail for five countries: Poland, Romania, Lithuania, Slovenia and Czech Republic. The study process was as follows:
• An initial list of key persons/institutions in the countries was prepared. The list was discussed with representatives of the five national R&D Liaison Offices in Brussels (see http://www.iglortd.org/)
• The following categories of interviewees were consulted: a) the RTD responsible ministry and in some case also other relevant ministries (such as Ministries of Fi-nance); b) FP6 contact points; c) organisations involved with advice and coordination on research policy; d) research performers; and e) others, depending on the country
• Fact-finding tours were carried out during September and October 2008 to the above countries. A total of 44 interviews were carried out with the attendance of 73 national experts. See appendix 2
• A standardised interview guide and Country Reporting Format was used for reporting in order to ensure that the same types of questions were asked and to ensure consis-tency in reporting
• A draft version of the country report was submitted to the interview persons for veri-fication. The comments were received and incorporated into the final version of the country reports
Regarding the interviews with national experts it is worth noting that interviews have been held primarily with stakeholders in key institutional positions and

Assessment of the Impact of the 6th Framework Programme on new Member States
C:\Documents and Settings\ms\Local Settings\Temporary Internet Files\OLK36\FP6_New MS_Final Report_24 05 09_final (2).doc
13
.
persons with experiences with FP6 participation, i.e. persons having a detailed understanding of FP6 allowing them to reflect on the impact of FP6.
The country studies were followed by additional interviews with international experts in order to validate the findings, to assess the basis for generalisation, and to put the conclusions into perspective. We refer to Appendix 2 for an overview of the interview persons.
The compiled data and viewpoints were finally analysed and conclusions were formed. The study process has thus been as illustrated below.
Desk review Scoping analysis Country studies Follow up interviews Analysis
The study also entailed the identification of good practice, i.e. examples of concrete innovative initiatives and projects which have been promoted, imple-mented or sustained the FP6 participation.
Study organisation The assessment is undertaken for DG Research in the wider context of the independent high-level ex-post evaluation of the European Union Framework Programmes.
It was carried out by COWI A/S together with its consortium partner IDEA during the period of June 2008 - May 2009 (in the further context of the Frame-work Contract on evaluation and evaluation-related services (BUDF 06/PO/01/Lot3), signed within a consortium led by COWI A/S. The study process was supervised by a Steering Committee made up of Commission rep-resentatives which met at the occasion of the Kick-off meeting (8/7-08), Incep-tion meeting (5/9-08), Interim meeting (28/10-08) and the Final meeting (26/1-09).
The report presents the views of the Consultant which do not necessarily coin-cide with those of the Commission.
Work package 3: Follow-up interviews assessment
Work package 4: Analysis

Assessment of the Impact of the 6th Framework Programme on new Member States
C:\Documents and Settings\ms\Local Settings\Temporary Internet Files\OLK36\FP6_New MS_Final Report_24 05 09_final (2).doc
14
.
2 FP6 and the new Member States This chapter presents the results of the scoping analysis, thereby answering the evaluation question on the level of FP6 participation in the new Member States.
Text box 2 The EU Framework Programme - in short
The Framework Programme is the EU's main instrument for the funding of research in Europe. Proposed by the Commission and adopted by the Council and the Parliament in co-decision, it is open to all public and private entities, small and large.
The 6th Framework Programmes was fully operational January 1, 2003 and were thus im-plemented in the aftermath of the Lisbon Summit in March 2000 and in the context of making a better use of European research efforts through the creation of an internal market for science and technology - a 'European Research Area' (ERA). FP6 was therefore de-signed as the primary instrument to help with integrating, structuring and strengthening ERA. In this respect, FP6 should have a structuring effect on research and technological development in Europe, including the old and new MS, Associated countries and other countries. FP6 has been the main financial ‘tool’ supporting the creation of ERA, and it was an important building block in the EU's drive to increase overall R&D investment from 1.9% of GDP in 2002 to 3% of GDP by 2010 (the Barcelona European Council’s objective).
The overall budget covering the four year period 2003-2006 was €16,7 billion making up 3.9% of the Union's total budget (2001). See Appendix 3 for a brief introduction of FP6.
2.1 Early experiences of FP participation Cooperation in research with the then-Candidate Countries began already in 1992 under the Third Framework Programme in the context of the PECO/Copernicus Programme aimed at promoting S&T cooperation with Cen-tral and Eastern European Countries.
Subsequently, under FP4, Community programmes were opened to participa-tion by Candidate Countries. A further step was achieved when in the context of FP5, association agreements were concluded with the EU-12 candidate coun-tries allowing for full participation of their research institutes, universities and industries under the same conditions as Member State organisations. Also in the context of FP5, special initiatives were put in place to integrate the future Member States into the EU research community, including setting up a network
Purpose of chapter
The background of EU-12 participation in Community Re-search activities

Assessment of the Impact of the 6th Framework Programme on new Member States
C:\Documents and Settings\ms\Local Settings\Temporary Internet Files\OLK36\FP6_New MS_Final Report_24 05 09_final (2).doc
15
.
of 34 independent, multidisciplinary R&D institutions in the candidate coun-tries, thus making it possible to identify the economically and socially most promising sectors of the EU-12 science landscapes and stimulating their par-ticipation in FP5, and later, FP6.
As was the case for FP5, also in the context of FP6, all 12 countries signed as-sociation agreements, again giving them the same entitlements for participation as Member States. As a major development, research projects could now in-volve organisations from Candidate Countries only. More generally, the new instruments put in place by FP6, Networks of Excellence and Integrated Pro-jects, and the overall objective of creating a European Research Area, provided potentially increased momentum for the integration of Candidate Countries.
In its October 2002 Communication "The European Research Area: Providing new momentum", the Commission stated that "for reasons relating in particu-lar to the state of research systems in these countries, to the way in which they are organised and the lack of means from which they suffer, the integration of the Candidate Countries into the constitution of the European Research Area remains at a rather theoretical level." It concluded on the need for further ef-forts to integrate the Candidate Countries into a more highly structured Euro-pean research fabric, underlining that "activities of this kind are provided for in the Sixth Framework Programme".
2.2 New MS' FP6 participation Evaluation question: What is the general picture regarding the participation of the New Member States in the FP6, e.g. types of organisation, coverage of programmes, etc.?
The scoping analysis is based on data from "FP6 contracts and participation database (02/06/2008)", a database provided to the evaluation team by the DG Research and data from Eurostat. The database contains research projects in-formation relevant to participation levels in FP6, EC contribution to contracts according to participant origin, year, activity type, participant legal status, the-matic priority and instrument as well as contract details.
Please note that FP6 funding is attributed to participants in FP6 and not to a specific country, thus the amounts presented are accumulated amounts gathered by participants8 according to national origin.
2.2.1 Overall FP6 participation level The total amount dedicated to FP6 in all 27 Member States was 16,692 million EUR. From this amount new Member States have received approximately EUR 824 million, representing 4.9% of total FP6 funding.
8 A participant can both be a single individual or an organisation (firm/research organisa-tion etc.). A participant can have participated in more contracts.
Persistent challenges
Scoping analysis - the data sources
Close to 5% of total FP6 allocation

Assessment of the Impact of the 6th Framework Programme on new Member States
C:\Documents and Settings\ms\Local Settings\Temporary Internet Files\OLK36\FP6_New MS_Final Report_24 05 09_final (2).doc
16
.
The table below presents how the EC funding was distributed among national participants in FP6 in each of the new MS. The table also compare these amounts relative to GDP, and as a percentage of national R&D expenditure. Further, in the last two columns EC Contribution has been indexed with pur-chasing power parities reflecting the price level in the countries and wage lev-els. The two indexes shows that EC contribution is worth more in local pur-chasing power than EU average and that EC contribution can "purchase" more man-hours in the new Member States.
Table 5 EC Contributions, FP6, new Member States, 2003-2006
Amount Million €
% of GDP
% of R&D Expendi-ture
Indexed to PPP9 2006 Million €
Indexed wage level10 2006 Mil-lion €
Per capita
Bulgaria 41 0.16% 9.84% 92 403 5Czech Rep 131 0.12% 2.48% 214 312 13Estonia 34 0.26% 8.36% 50 100 26Cyprus 28 0.19% 13.52% 31 30 35Latvia 19 0.12% 6.92% 31 83 8Lithuania 27 0.11% 4.55% 47 104 8Hungary 150 0.17% 4.75% 248 369 15Malta 10 0.20% 11.33% 13 16 25Poland 218 0.08% 4.29% 351 607 6Romania 54 0.06% 4.50% 95 307 3Slovenia 76 0.26% 4.77% 100 106 38Slovakia 37 0.08% 4.87% 64 126 7
Total new MS 825 0.11% 4.33% 1,336 2,563 8Total FP6 EU 27 16,692 0.14% 2.10% 16,691 16,691 34Source: FP6 database, DG Research
9 EC Contribution has been adjusted by the 2006 PPP/comparative price levels from Euro-stat, indexed as EU27=100. Comparative price levels are the ratio between Purchasing power parities (PPPs) and market exchange rate for each country. PPPs are currency con-version rates that convert economic indicators expressed in national currencies to a com-mon currency, called Purchasing Power Standard (PPS), which equalises the purchasing power of different national currencies and thus allows meaningful comparison. The ratio is shown in relation to the EU average (EU27 = 100). If the index of the comparative price levels shown for a country is higher/ lower than 100, the country concerned is relatively expensive/cheap as compared with the EU average. 10 EC Contribution has been adjusted by the 2006 wage levels from Eurostat (Average monthly labour costs, defined as total labour costs per month divided by the corresponding number of employees), indexed as EU27=100.

Assessment of the Impact of the 6th Framework Programme on new Member States
C:\Documents and Settings\ms\Local Settings\Temporary Internet Files\OLK36\FP6_New MS_Final Report_24 05 09_final (2).doc
17
.
When the amount of EC contribution is expressed as a percentage of GDP it is observed that EC contribution for six countries (Slovenia, Estonia, Malta, Cy-prus, Hungary and Bulgaria) are above the EU-average while for the others it is below;
If the EC contribution is adjusted to reflect national price levels and wage lev-els, the value of the EC contribution is significantly higher than in real terms for most new Member States reflecting the lower price and wage levels. How-ever in a number of new Member States price levels are approaching the EU27 average (See chart below).
EC Contribution indexed
0
100
200
300
400
500
600
700
Bulgari
a
Czech
Rep
Estonia
Cyprus
Latvi
a
Lithu
ania
Hunga
ryMalt
a
Poland
Roman
ia
Sloven
ia
Slovak
ia
Member State
Mill
ion
€ Amount Million €Indexed to PPP 2006 Million €Indexed wage level 2006 Million €
Looking at the EC contribution received by the new MS as a percentage of GERD (national RD expenditure) it is observed that total FP6 contribution allo-cated to the new MS amounts to 4.33% of national R&D expenditure; hence it represents a significantly higher share than for the EU average (2.1%).
Table 5 also shows FP6 funding per capita. When looking at real terms (not adjusted for purchasing power) Malta, Slovenia, Cyprus and Estonia received close to or above the EU average. These countries also have price and wage levels closer to the EU27 average level than the rest of the new Member States. Czech Republic and Hungary follow in the 'in-between' group, and the remain-ing new MS receive much lower levels of EU funding per capita.
Relatively to GDP
Relatively to GERD expenditure
Per capita allocation

Assessment of the Impact of the 6th Framework Programme on new Member States
C:\Documents and Settings\ms\Local Settings\Temporary Internet Files\OLK36\FP6_New MS_Final Report_24 05 09_final (2).doc
18
.
However price levels in most of these countries are significantly lower than in the rest of the EU, therefore when adjusted for price levels they perform rela-tively better, as illustrated by the figure below.
EC Contribution FP6, indexed after EU27, 2003-2006
0
10
20
30
40
50
60
Bulgari
a
Czech
Rep
Estonia
Cyprus
Latvi
a
Lithu
ania
Hunga
ryMalt
a
Poland
Roman
ia
Sloven
ia
Slovak
ia
Total n
ew M
S
Total F
P6 EU 27
Member State
€ pe
r cap
ita
Per Capita, absolute termsPer Capita, indexed by PPP
Another way to contextualise the new MS's participation in FP6 is to compare the FP6 contribution received with the number of registered researchers in the countries (using Eurostat data). It can be seen that the new MS can be classified in sub-groups where the first group again includes Cyprus, Malta, Slovenia and Estonia. These countries are very close or surpass the EU average. Hungary is in the middle and the remaining countries are much below average.
Table 6 FP6 allocation per researcher in the new MS (EUR)
Per researcher Per researcher, indexed by PPP
Per researcher, indexed by wage level
Bulgaria 2,507 5,621 24,670Czech Rep 2,751 4,481 6,541Estonia 7,134 10,585 21,134Cyprus 22,691 25,072 24,418Latvia 2,858 4,724 12,678Lithuania 2,365 4,141 9,102Hungary 5,767 9,563 14,203Malta 13,363 17,913 21,066
Allocation per re-searcher

Assessment of the Impact of the 6th Framework Programme on new Member States
C:\Documents and Settings\ms\Local Settings\Temporary Internet Files\OLK36\FP6_New MS_Final Report_24 05 09_final (2).doc
19
.
Per researcher Per researcher, indexed by PPP
Per researcher, indexed by wage level
Poland 2,961 4,768 8,259Romania 1,765 3,091 9,961Slovenia 7,829 10,195 10,895Slovakia 2,441 4,253 8,408
Total new MS 3,381 5,478 10,512Total FP6 EU 27 7,701 7,701 7,701
When adjusting the EC contribution received by price levels the new Member states are performing relatively well, as seen by the figure below - again with the four above-mentioned countries (Slovenia, Malta, Cyprus, Estonia) per-forming above the EU27 average plus also Hungary.
EC Contribution FP6 per researcher, indexed after EU27, 2003-2006
0
5,000
10,000
15,000
20,000
25,000
30,000
Bulgari
a
Czech
Rep
Estonia
Cyprus
Latvi
a
Lithu
ania
Hunga
ryMalt
a
Poland
Roman
ia
Sloven
ia
Slovak
ia
Total n
ew M
S
Total F
P6 EU 27
Member State
€ pe
r res
earc
her
Per researcher, absolute termsPer researcher, indexed by PPP
2.2.2 Relation between macro-economic performance and level of participation
The figure below provides another element to the description and interpretation of the new MS's FP6 participation by showing the relation between national macro-economic performance (GDP, where EU27 = 100%) and EC contribu-tion to the countries (contribution per capita). It identifies a positive correlation
Positive correlation between GDP and FP6 participation

Assessment of the Impact of the 6th Framework Programme on new Member States
C:\Documents and Settings\ms\Local Settings\Temporary Internet Files\OLK36\FP6_New MS_Final Report_24 05 09_final (2).doc
20
.
between macro-economic performance and FP6 participation: the higher GDP of a country the more will its research sector participate in FP6.11
Figure 3 Relation between GDP and FP6 allocation (per capita)
Bulgaria
Czech Republic
Estonia
Cyprus
LatviaLithuania
Hungary
Malta
Poland
Romania
Slovenia
Slovakia
Total FP6 EU 27
0
5
10
15
20
25
30
35
40
20 40 60 80 100 120
GDP per Capita. 2006, EU27=100
EC
con
tribu
tion
per C
apita
In light of the results of the country case studies (chapters 2.2 and 4), the ob-served correlation is not surprising since it became evident that success in FP6 participation is more likely to happen when research institutions have access to high-level equipment, are part of a well-functioning national research sector, have developed an internal networking approach and can rely on already estab-lished international contacts. It appears plausible that these features are more commonly found in well-developed economies.
2.2.3 Participation of new MS according to priority areas and instruments
The table below presents the new MS's share of total FP6 allocations by re-search areas. Recalling that the new MS's overall share of total FP6 allocation is 4.9%, it can be seen that:
• The new MS receive a relatively higher share of FP6 funding for the fol-lowing research areas: Research and innovation, Support dev. of research & innovation policies, Citizens & governance, knowledge-based society and Science and society
11 Please note that if corrected for PPP the curve would be less steep but show the same tendency.

Assessment of the Impact of the 6th Framework Programme on new Member States
C:\Documents and Settings\ms\Local Settings\Temporary Internet Files\OLK36\FP6_New MS_Final Report_24 05 09_final (2).doc
21
.
• The new MS receive a relatively lower share for the following areas: Life Sciences, Aeronautics, and Research Infrastructures
Table 7 EC Contribution by priority area, 2003-2006
EU27 (M€) New MS (M€)
New MS share (%)
Priority areas
Life sciences, genomics and biotechnology 2,320.0 75.7 3.26%Information society technologies 3,807.2 178.2 4.68%Nanotechnologies and nanosciences, etc. 1,539.0 77.8 5.05%Aeronautics and space 1,074.8 33.4 3.11%Food quality and safety 751.6 42.4 5.64%Sustainable development, ecosystems, etc. 2,294.6 106.6 4.65%Citizens & gov., knowledge-based society 242.7 30.5 12.56%
Cross-cutting research activities
Policy support (scientific and tech. needs) 601.7 35.0 5.81%Horizontal research activities involving SMEs 475.4 46.9 9.87%Specific measures , support of int. coop. 352.1 14.1 4.00%
Strengthening the foundation of ERA
Support for the coordination of activities 288.0 13.3 4.61%Support dev. of research & inno. policies 13.8 2.7 19.66%
Structuring the ERA
Research and innovation 225.8 33.8 14.96%Human resources and mobility 1,723.8 90.9 5.27%Research infrastructures 717.8 25.3 3.52%Science and society 77.8 8.4 10.78%Euratom 185.0 9.6 5.18%Total 16,691.1 824.5 4.94%Source: FP6 database, DG Research
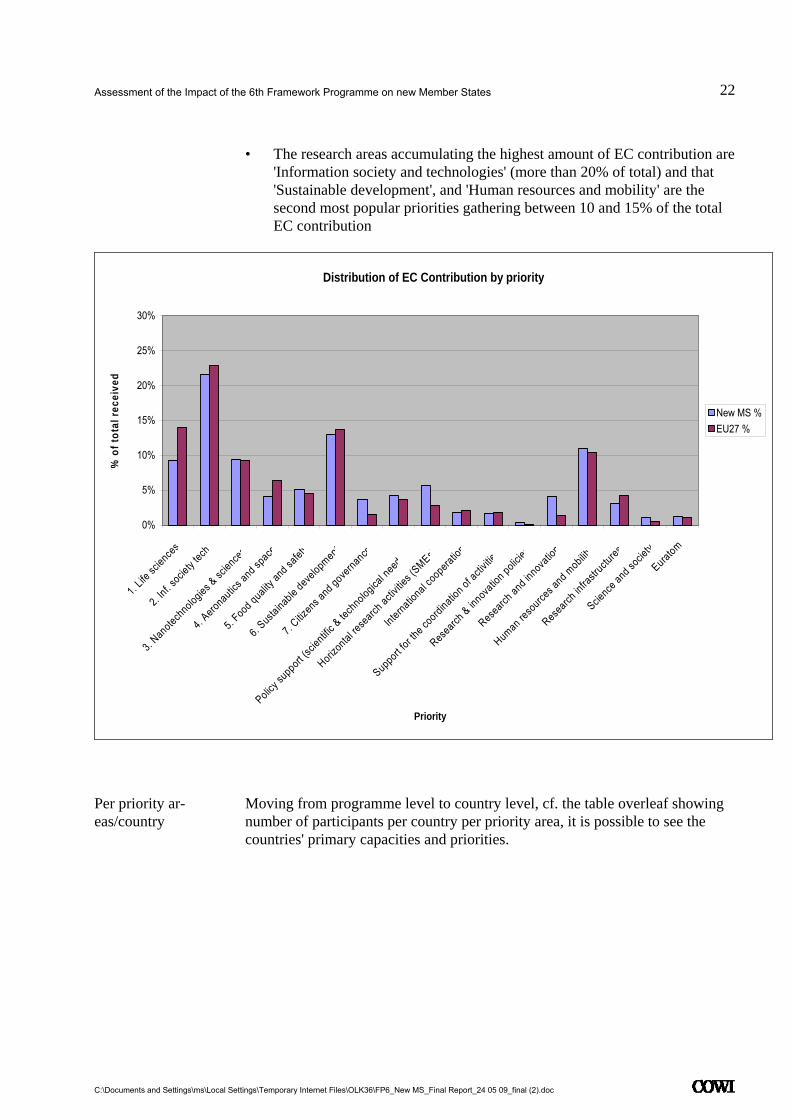
The figure below shows the distribution of the new MS's total contribution (i.e. MEUR 824 = 100%) between the FP6 priority areas and compares this with the total for the EU27 (i.e. 16.7 billion EUR = 100%); hence it shows the relative performance of each priority area for both new MS and EU27. It can be ob-served that:
• The overall tendency is the same for both new MS and the EU27: the same priority areas have a similar relative importance for both new MS and EU27
Most funding to In-formation society technologies
Assessment of the Impact of the 6th Framework Programme on new Member States
C:\Documents and Settings\ms\Local Settings\Temporary Internet Files\OLK36\FP6_New MS_Final Report_24 05 09_final (2).doc
22
.
• The research areas accumulating the highest amount of EC contribution are 'Information society and technologies' (more than 20% of total) and that 'Sustainable development', and 'Human resources and mobility' are the second most popular priorities gathering between 10 and 15% of the total EC contribution
Distribution of EC Contribution by priority
0%
5%
10%
15%
20%
25%
30%
1. Life
scienc
es
2. Inf. s
ociety
tech
3. Nan
otechnolog
ies & sc
iences
4. Aero
nautics
and sp
ace
5. Foo
d quality a
nd safet
y
6. Sus
tainable deve
lopment
7. Citiz
ens a
nd gove
rnance
Policy su
pport (
scien
tific & te
chno
logical n
eeds
Horizon
tal re
search
activitie
s (SMEs)
Internatio
nal coopera
tion
Support fo
r the co
ordinatio
n of activ
itie
Researc
h & innov
ation p
olicies
Researc
h and in
novatio
n
Human reso
urces a
nd mobility
Research
infra
structu
res
Science
and socie
ty
Euratom
Priority
% o
f tot
al re
ceiv
ed
New MS %EU27 %
Moving from programme level to country level, cf. the table overleaf showing number of participants per country per priority area, it is possible to see the countries' primary capacities and priorities.
Per priority ar-eas/country

Assessment of the Impact of the 6th Framework Programme on new Member States
C:\Documents and Settings\ms\Local Settings\Temporary Internet Files\OLK36\FP6_New MS_Final Report_24 05 09_final (2).doc
23
.
Table 8 Distribution of participants by new MS and priority area (index) 2003-2006
Priority area Bulgaria Czech R Cyprus Estonia Latvia Lithuania Hungary Malta Poland Romania Slovenia Slovakia
Total - new MS
Total - EU-27
Priority areas
1.Life sciences, genomics, etc 2.2 8.4 3 10.5 5.6 3.2 7.3 0.0 5.2 1.2 5.3 4.1 5.4 9
2.Info society technologies 16.7 12.6 23.1 14.2 14.5 20.8 18.2 21.3 14.6 15.4 19.3 13.6 16.0 19
3.Nanotechnologie, etc 7.4 7.2 2.1 3.4 7.9 5.3 5.5 2.4 10.4 11.9 9.1 10.6 8.0 8
4.Aeronautics and space 0.9 6.7 3 1.0 4.2 1.5 1.5 4.7 3.7 2.8 1.8 0.9 3.0 5
5.Food quality and safety 4.8 4.0 4.7 2.9 4.2 7.6 6.5 3.9 5.2 3.8 4.1 4.8 4.9 4
6. Sustainable devel. etc, 17.6 15.4 10.3 13.6 14.5 12.6 11.0 12.6 15.5 16.9 13.6 14.9 14.4 14
7. Citizens and governance, etc 6.7 3.5 2.6 5.8 6.1 4.7 5.7 4.7 3.6 3.6 5.2 2.9 4.4 3
Cross-cutting research activities
Policy support, etc. 7.4 7.1 6 6.6 8.9 6.4 8.2 6.3 6.8 5.1 7.5 6.6 7.0 6
Horizontal activities, SMEs 7.4 10.2 5.1 13.1 8.4 12.3 8.9 11.0 11.1 9.9 8.6 8.8 9.9 7
Specific measures int. coop. 3.0 1.5 7.7 1.3 1.9 0.9 1.2 10.2 0.7 3.0 2.6 0.5 1.8 3
Cross-cutting research activities
Support coord. of activities 1.3 1.9 3.4 3.4 2.8 1.2 2.8 2.4 2.5 2.6 3.6 2.0 2.5 2
Support research & inno policy 1.1 0.7 0.0 1.6 1.4 0.3 0.7 0.0 0.3 0.7 0.8 1.6 0.7 0
Structuring the ERA
Research and innovation 6.3 3.5 8.1 6.8 8.4 9.1 3.8 7.9 5.3 5.0 4.7 8.8 5.5 2
Human resources and mobility 6.7 8.9 13.7 6.8 3.7 6.4 11.9 4.7 10.4 8.6 6.5 10.0 9.2 11
Research infrastructures 4.3 2.1 4.7 2.4 3.3 2.6 2.6 3.1 3.0 4.0 1.9 2.5 2.9 2
Science and society 2.6 1.6 1.3 6.3 3.7 4.1 2.1 4.7 1.1 3.3 2.8 2.3 2.3 1
Euratom 3.5 4.9 1.3 0.3 0.5 1.2 2.3 0.0 0.6 2.3 2.8 5.2 2.2 2
Total (%) 100 100 100 100 100 100 100 100 100 100 100 100 100 100
Total (no) 460 1,072 234 381 214 342 1,186 127 1,886 605 617 442 7,566 74,584

Assessment of the Impact of the 6th Framework Programme on new Member States
C:\Documents and Settings\ms\Local Settings\Temporary Internet Files\OLK36\FP6_New MS_Final Report_24 05 09_final (2).doc
24
.
For each country, the four priority areas having most participants are shown in bold. It appears that:
• The new MS are relatively homogenous in the prioritising between the pri-ority areas: For all countries, Information society and Sustainable devel-opment are the two areas attracting most participants
• Some difference can be seen when compared to the EU-27, however the overall trend is similar between the new Member States and the EU aver-age
In terms of number of participants the new Member States has a much higher share of participation (10.1%) than when looking in monetary terms (receiving 4.9% of total FP6 contribution). When comparing participation by the size of population the new Member States follow a similar trend but generally at a lower level. Information Society Technologies (IST) and Sustainable Develop-ment have the highest participation (respectively 12 and 11 participants per mil-lion inhabitants).
Table 9 FP6 - number of participants per priority area
Participation - Num-ber
Share New MS
No of partici-pants per million inhabitants
EU27 New MS % EU27 New MS
Priority areas
Life sciences, genomics,etc 6,828 412 6.0% 14 4Information society technologies 14,340 1,213 8.5% 29 12Nanotechnologies, etc. 5,883 603 10.2% 12 6Aeronautics and space 3,496 226 6.5% 7 2Food quality and safety 3,209 372 11.6% 7 4Sustainable development, etc. 10,561 1,087 10.3% 21 11Citizens & gov., knowledge, etc. 1,949 333 17.1% 4 3
Cross-cutting research activities
Policy support 4,606 529 11.5% 9 5Horizontal activities, incl. SMEs 5,458 746 13.7% 11 7Specific measures , etc 2,514 136 5.4% 5 1
Strengthening the foundation of ERA
Support coordination of activities 1,204 188 15.6% 2 2Support dev. of research policies 169 51 30.2% 0 0
More participants from new MS

Assessment of the Impact of the 6th Framework Programme on new Member States
C:\Documents and Settings\ms\Local Settings\Temporary Internet Files\OLK36\FP6_New MS_Final Report_24 05 09_final (2).doc
25
.
Participation - Num-ber
Share New MS
No of partici-pants per million inhabitants
EU27 New MS % EU27 New MS
Structuring the ERA
Research and innovation 1,841 413 22.4% 4 4Human resources and mobility 8,475 694 8.2% 17 7Research infrastructures 1,841 217 11.8% 4 2Science and society 1,025 176 17.2% 2 2Euratom 1,185 170 14.3% 2 2Total 74,584 7,566 10.1% 151 73
The table below presents an overview of the distribution of EC funds per FP6 instruments.
Table 10 FP6 according to type of instrument, 2003-2006
EC Contribution to con-tracts - M €
Participation, Number
Instrument EU 27 New MS Share of total to new MS
(%)
EU 27 New MS Share of total to new MS (%)
Integrated projects - IP 6,661 214.4 3.2% 17,763 1,231 6.9%Networks of excellence – NOE 1,262 82.4 6.5% 5,153 400 7.8%Specific research projects – STREP 4,485 240.6 5.4% 21,451 1,907 8.9%Coordinated actions - CA 609 44.8 7.4% 7,123 932 13.1%Specific support action – SSA 949 88.7 9.4% 8,246 1,621 19.7%Marie Curie action - MCA 1,712 87.7 5.1% 8,195 606 7.4%Collective research pro-jects – CLR 148 14.5 9.8% 1,689 248 14.7%Specific actions research infrastruc. 543 9.4 1.7% 1,262 93 7.4%Cooperative Research Projects 322 31.0 9.6% 3,702 467 12.6%Other - I3 11.0 61 Total 16,692 824.5 4.9% 74,584 7,566 10.1%Source: FP6 database, DG Research
FP6 according to type of instrument
Assessment of the Impact of the 6th Framework Programme on new Member States
C:\Documents and Settings\ms\Local Settings\Temporary Internet Files\OLK36\FP6_New MS_Final Report_24 05 09_final (2).doc
26
.
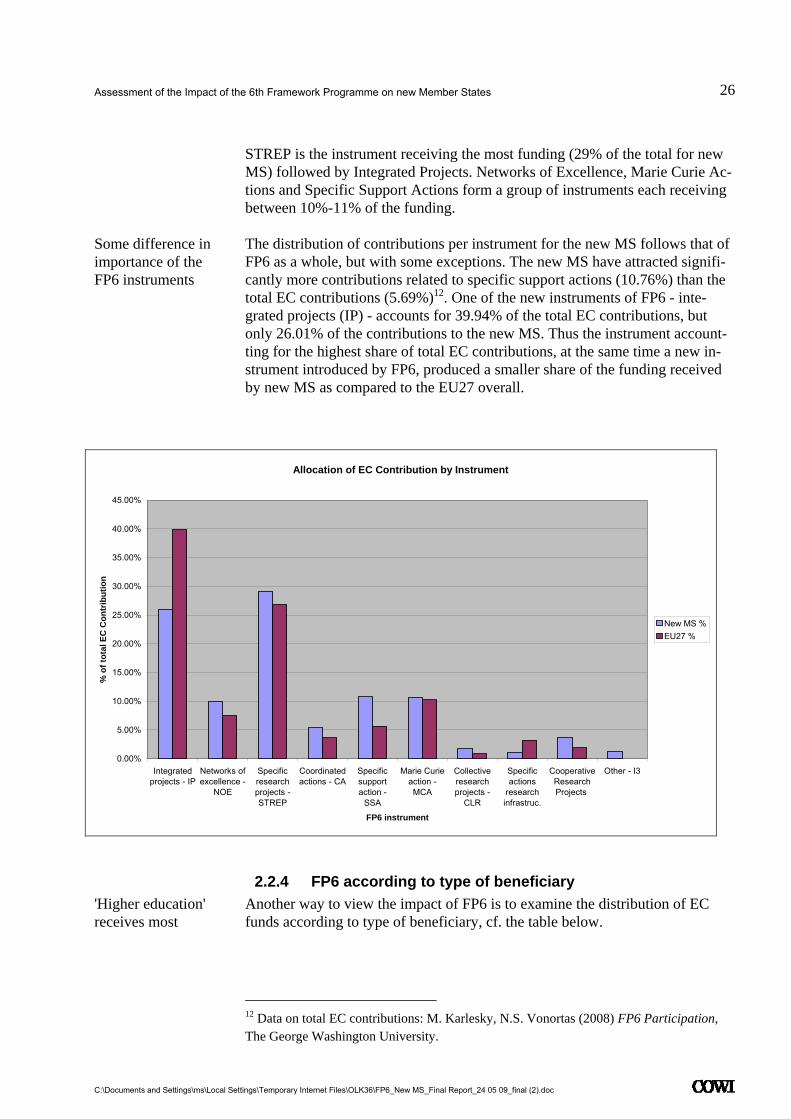
STREP is the instrument receiving the most funding (29% of the total for new MS) followed by Integrated Projects. Networks of Excellence, Marie Curie Ac-tions and Specific Support Actions form a group of instruments each receiving between 10%-11% of the funding.
The distribution of contributions per instrument for the new MS follows that of FP6 as a whole, but with some exceptions. The new MS have attracted signifi-cantly more contributions related to specific support actions (10.76%) than the total EC contributions (5.69%)12. One of the new instruments of FP6 - inte-grated projects (IP) - accounts for 39.94% of the total EC contributions, but only 26.01% of the contributions to the new MS. Thus the instrument account-ting for the highest share of total EC contributions, at the same time a new in-strument introduced by FP6, produced a smaller share of the funding received by new MS as compared to the EU27 overall.
Allocation of EC Contribution by Instrument
0.00%
5.00%
10.00%
15.00%
20.00%
25.00%
30.00%
35.00%
40.00%
45.00%
Integratedprojects - IP
Networks ofexcellence -
NOE
Specificresearchprojects -STREP
Coordinatedactions - CA
Specificsupportaction -
SSA
Marie Curieaction -MCA
Collectiveresearchprojects -
CLR
Specificactions
researchinfrastruc.
CooperativeResearchProjects
Other - I3
FP6 instrument
% o
f tot
al E
C C
ontr
ibut
ion
New MS %EU27 %
2.2.4 FP6 according to type of beneficiary Another way to view the impact of FP6 is to examine the distribution of EC funds according to type of beneficiary, cf. the table below.
12 Data on total EC contributions: M. Karlesky, N.S. Vonortas (2008) FP6 Participation, The George Washington University.
Some difference in importance of the FP6 instruments
'Higher education' receives most

Assessment of the Impact of the 6th Framework Programme on new Member States
C:\Documents and Settings\ms\Local Settings\Temporary Internet Files\OLK36\FP6_New MS_Final Report_24 05 09_final (2).doc
27
.
Table 11 FP6 according to field of activity in the new Member States, 2003-2006
EC Contribution to contracts Participation, Number
Instrument New MS Million €
New MS %
EU27 %
(of total FP6 budget)
EU 27 New MS
Higher education - HES 321 39% 37% 26,541 2,470
Industry - IND 89 11% 18% 13,936 953
Research - REC 269 33% 31% 20,650 2,244
Others - OTH 136 16% 14% 13,457 1,786
Total 824,5 100% 100% 74,584 7,566
Source: FP6 database, DG Research
'Higher Education'13 has received the majority of EC contributions (almost 40%). 'Research' comes second in terms of funds while industry receives less funding than the other two main categories. The distribution is in the same or-der when looking at the number of participants as illustrated by the graph be-low.
Participation according to type of activity
0.00%
5.00%
10.00%
15.00%
20.00%
25.00%
30.00%
35.00%
40.00%
Higher education - HES Industry - IND Research - REC Others - OTH, Not defined - N/A
Activity
% p
artic
ipat
ion
New MS %EU27 %
2.2.5 The general picture regarding the participation of New MS in the FP6
This section has addressed the evaluation question: What is the general picture regarding the participation of the New Member States in the FP6? Acknowl-edging that no single indicator can give a full picture and that a nuanced answer
13 Higher Education (e.g universities, colleges), Industry (industrial organisations private and public, both manufacturing and industrial services) and Research (organisations only or mainly established for research purposes)
Findings on the overall participation level

Assessment of the Impact of the 6th Framework Programme on new Member States
C:\Documents and Settings\ms\Local Settings\Temporary Internet Files\OLK36\FP6_New MS_Final Report_24 05 09_final (2).doc
28
.
to the question must be of a multi-dimensional nature, a number of features of the new Member States' FP6 participation have been presented.
The level of participation of new MS appears at first sight to have been limited. The new MS receive less than 5% of the total FP6 budget which represents a per capita allocation far beyond EU27 average. However, the analysis also shows that the FP6 allocation - if compared against GERD and GDP - repre-sents a significant 'volume' of resources in the context of the national research sectors. Furthermore, if the contributions allocated to research performers in the new MS are adjusted for purchasing power, the differences between new MS and EU27 levels out. The relative importance and contribution of FP6 is there-fore in this perspective more significant for new MS than for EU27 in general.
This condensed description is based on the specific findings that:
• The total amount dedicated to FP6 in all 27 Member States was 16.7 bil-lion EUR and from this amount new Member States have managed to at-tract around EUR 824 million equal to around 4.9% of the total
• The price and wage levels in the new MS are below those of the EU aver-age, thus the EC contribution received is relatively worth more in terms of purchasing power and salaries
• The new MS receive relatively more funding through FP6 than EU27 aver-age when comparing FP funding to GERD
• 'Information Society Technologies' and 'Sustainable Development' are the FP6 priority areas that attracted most funds and participants in the new MS
• Compared to the total contribution of FP6, overall the distribution of con-tributions per instrument in the new MS follows that of FP6 as a whole. However Integrated Projects (IP) account for a relatively low share of the contributions to the new MS whereas the new MS receive relatively more under specific support actions
• The new MS are relatively homogenous in the prioritising between the pri-ority areas: For all countries, Information society and Sustainable devel-opment are the two areas attracting most participants
• The new MS should not be seen as one common group. The analysis shows that research institutions from of group of countries - Slovenia, Cy-prus, Malta and Estonia - have participated intensively in FP6 implying that the degree of participation of these countries are close to or above EU27 average (depending on indicator). An in-between group of countries include Czech Republic and Hungary, while the level of participation of research institutions from Bulgaria, Latvia, Lithuania, Poland, Romania and Slovakia was significantly below EU27 average

Assessment of the Impact of the 6th Framework Programme on new Member States
C:\Documents and Settings\ms\Local Settings\Temporary Internet Files\OLK36\FP6_New MS_Final Report_24 05 09_final (2).doc
29
.
3 Policy and conditions for FP6 involvement
3.1 Measures to promote FP6 Evaluation question: What specific measures were taken to promote the Framework Pro-gramme and to improve the participation of the new MS in FP research activities?
The country studies reveal there have been a number of actions to stimulate the FP6 participation and that the awareness in the new MS of FP6 has increased significantly over the years; as exemplified by a statement by a Romanian in-dustry expert: 'In 2001, FP was foreign language in this country' (at that time the country was not an EU member). The study also shows that the guidelines and overall support structures provided by the European Commission to Mem-ber and Associated States have contributed to a certain level of homogenisation in the measures taken to promote the Framework Programme in the new MS.
Nevertheless, there are also some varieties in the setups and measures chosen in the five selected countries of this study, reflecting different national traditions, R&D landscape and strategies. The institutionalisation of measures to promote FP6 is more advanced in Slovenia (e.g. having intense general awareness ac-tivities and also national programmes sub-committees for particular FP6 the-matic areas) than in Romania where a 'first generation' set-up to promote FP6 was implemented. The tendency to institutionalise over time is also clearly seen from Lithuania where a dedicated Agency for International Science and Tech-nology Development Programmes to centralise promotion and administration of international research programmes was set up in 2002 following unsatisfac-tory participation levels in FP5.
The National Contact Point (NCP) system is promoted by the EC as the main information provider on Framework Programmes and it has been implemented in all the five studied countries. In some cases, the NCP is hosted by one or several research institutions (Institute of fundamental Technological Research in Poland and Technology Centre which is a consortium of research institutes in the Czech Republic) while in other cases the national ministry responsible for research and science is acting as NCP (Romania and Slovenia) or a specific agency for international programmes has taken on this responsibility (Lithua-nia). In some countries services are provided centrally by one single organisa-tion (e.g. Lithuania) while in others are based on a decentralised network in-
In 2001, FP was 'for-eign language' - now it is well-known
Differences between the countries
The National Contact Point system

Assessment of the Impact of the 6th Framework Programme on new Member States
C:\Documents and Settings\ms\Local Settings\Temporary Internet Files\OLK36\FP6_New MS_Final Report_24 05 09_final (2).doc
30
.
volving many organisations at the regional and local level (e.g. Poland, Roma-nia, Czech Republic). The value of regionalisation of contact points and tech-nology platforms has generally been accentuated as a positive measure by the experts interviewed.
The activities carried out by the NCP at the national level are quite similar with an emphasis on awareness raising and distribution of information. However, in the Czech and Slovenian cases, the NCP also provide advisory services such as reading through proposals and providing scientific advice. The Polish case shows that there is a growing demand for this kind of extended services which may contribute to improving the success rates of applications and it is antici-pated that this may lead to a reshaping of the Polish NCP in the near future.
Awareness raising To raise awareness of FP6 is a core responsibility of the NCP systems and the basic services provided in all the studied countries are: launching of confer-ences and seminar, the organisation of information meetings, and service in-formation via websites. Specific characteristics of the NCP-system and content of activities are also found, namely:
• In Slovenia, specific experts have been mobilised to give lectures to the research community about e.g. FP/EU research programmes and opportu-nities to apply for support, and seminars organised in Brussels by the Slovenian liaison office for programme managers and researchers have been successful in creating greater awareness of FP6. A hot-line phone service was set up by the Ministry responsible for science and research
• In the Czech Republic, the Technology Centre (to which all National Con-tact Points were connected) has since FP4 been the national information point and is therefore a well-known focal point. Also to be noted, specific regional centres specialised in specific scientific areas providing targeted information to the regional communities
• In Poland, stakeholders stressed the pro-activeness of the NCP notably in-forming specific target groups for concrete opportunities. The establish-ment of a nation-wide NCP network (with 200 members intervening at three levels: regional and local as well as thematic contact points run by universities and research institutions) was mentioned as a promising initia-tive to increase awareness
• In Romania, the promotion of FP6 was a first-time experience and the NCP system had to be established in the midst of a general restructuring process of the Romanian research sector. To ensure competences at NCP-level, the National Authority for Scientific Research in Romania therefore initiated the Phare funding project 'Support for improving on participation of Ro-mania in the Sixth Framework Programme and European Research Area'
• In Lithuania, the content of the awareness-raising activities in Lithuania are similar to those basic activities mentioned above but it is to be noted that the activities were organised by the Agency for International Science and Technology Development Programmes. All interviewed stakeholders

Assessment of the Impact of the 6th Framework Programme on new Member States
C:\Documents and Settings\ms\Local Settings\Temporary Internet Files\OLK36\FP6_New MS_Final Report_24 05 09_final (2).doc
31
.
have emphasised the importance of this relatively new agency as the focal point for FPs and other international research programmes
Financial support The case studies show that the countries have made use of different financial incentives to promote FP6 participation and that these measures were viewed as important in a context where many potential applicants found it very difficult to mobilise resources to prepare proposals through quite demanding processes and especially to contribute to the overall project budget with their own funds. The table below gives an overview of the various support schemes.
Table 12 Overview of financial incentives in the case countries
Slovenia Financial support for proposal application costs (for eligible projects)
The Czech Republic
Since 2004, it is possible to receive funding for the preparation of the pro-posal. This implies money for preparatory meetings, travelling costs, etc
(Since 2008 research institutions can ask for co-financing of up to 100% of the 25% of funding they do not receive from the EC)
Poland Grants for grants to cover application proposal costs
Contribution to funding of research institutions' own contribution share to the financing of FP6 projects.
Lithuania Increased salaries for participating researchers
Funding for infrastructure (e.g. laboratory equipment and computers)
VAT reimbursement for purchased equipment for FP6 projects
Romania Assistance to successful projects by covering applicants' own contribution
Financial rewards targeted individuals successful in contracting projects and managers of institutions hosting project teams
In several countries the "grants for grants" - that is financial support for pro-posal preparation (Poland, Slovenia, Czech Republic) as well as support to cover the participant's own contribution to project budgets (Poland, Romania) - seem to have had a significant effect in terms of motivating potential partici-pants. In Romania, specific individuals successfully contracting with FP6 as well as managers of institutions with awarded project teams were financially rewarded.
The extra funding gained through the projects in terms of possible funding for infrastructure/equipment such as PCs or laboratories, VAT reimbursement for purchased equipment for projects (Lithuania) and salary increases for partici-pating researchers (Lithuania, Romania) are also stressed in some cases. How-ever, these types of incentives have apparently not existed in all countries either due to different national regulations or to a lack of knowledge of FP procedures and/or national legislation. In both the Czech Republic and Poland, lack of re-imbursement of VAT was seen as a barrier to participation and insufficient salaries were also pointed out as a problem in Poland.

Assessment of the Impact of the 6th Framework Programme on new Member States
C:\Documents and Settings\ms\Local Settings\Temporary Internet Files\OLK36\FP6_New MS_Final Report_24 05 09_final (2).doc
32
.
In terms of cost-effectiveness some of these measures had some limits as the requirements to the beneficiaries were not always very high e.g. eligibility as the only criteria for benefiting from financial support to proposal preparation. Based on these experiences, some financial incentives have been revised (Po-land, Slovenia) in order to make them more results-based.
It was also stressed, by university representatives in particular, that the essential precondition for success with FP6 is scientific curiosity and competence.
Other measures Several other measures were used to familiarise national research communities with international research and specifically to stimulate FP6 participation of which the most important were:
• National research liaison offices in Brussels. All the Member States have RTD offices in Belgium and these were mentioned in several of the case studies as a way of promoting their country's participation in FP6 (Czech Republic, Poland, Romania)
• FP6 participation counts in national research evaluations. To stimulate an international reorientation of national research, some countries (Roma-nia, Lithuania, Poland) reward submission of FP6 proposals in national re-search evaluation procedures, using a standardised 'uplift' (for instance in Romania, where an FP6 submitted proposal automatically receives a 5 point bonus; out of 100 points)
• Specific initiatives targeted SMEs. While the success in promoting FP6 to enterprises is assessed to have been very low in Lithuania, Poland and Romania, the Czech and the Slovenian cases record more positive devel-opments in that area. In the Czech Republic, Czechinvest, an investment and business development agency established by the Ministry of Industry and Trade, has provided information and advisory services as well as fi-nancial support to SMEs. Likewise, in Slovenia, it is noted that industry and mainly SMEs are increasingly looking for FP-type funding and their level of involvement in FP6 has actually reached a level that is higher than the EU average (see further discussion on industry participation in section 4.5.2)
With regard to suggestions on how to improve the promotion of FP6 in the fu-ture, most country studies (Czech Republic, Poland, Romania, Slovenia) indi-cate that there is a need for even more target-oriented efforts which could draw on previous experiences and address the potential beneficiaries' specific con-cerns in a more direct manner.
Improving the pro-motion of FPs in the future?

Assessment of the Impact of the 6th Framework Programme on new Member States
C:\Documents and Settings\ms\Local Settings\Temporary Internet Files\OLK36\FP6_New MS_Final Report_24 05 09_final (2).doc
33
.
3.2 Needs of the country Evaluation question: Were the specific needs of the new MS particularly those likely to have an influence on FP participation, taken into account in designing the FP?
The five countries targeted in the current study were still preparing for acces-sion to the EU at the time when the 6th Framework Programme was designed. Representatives from some countries (Czech Republic, Poland, Slovenia) did present the positions of their countries through position papers and other com-munications, but in the view of the interviewees no direct effect was detected. The civil servants interviewed in the other countries also find that the specific needs of the countries only to a very limited degree were taken into account. An international expert (university professor in one of the new MS) asked for a more transparent process of articulating viewpoints on the design of the FPs: The problem for new MS to participate fully in the FP is not least caused by the obscure way that topics and themes are chosen. New MS have very little impact on that process. The topics and priorities are oriented toward certain industries and influenced by some resourceful groups'.
However, the study has not identified a widespread frustration on this issue al-though ideally a more systematic needs assessment should have been carried out. On the issue of ensuring a match between the FP6 design and the needs of the new MS, the study specifically shows that:
• DG RTD had an interest in promoting the participation of new MS and did so e.g. via supporting the set-up of the NCP system which overall have had a strong impact in raising awareness (cf. the previous section)
• The communication between the accessing countries and DG RTD was not optimal or well-enough prepared in terms of ensuring that the new MS would in fact have equal opportunities to participate in FP6, and that DG RTD did not carry out a needs assessment prior to designing FP6; hence the design of FP6 could not systematically reflect the needs of the new MS
• That research performers in the five countries overall find the FP6 priority areas reasonable but doubt has been expressed if the national research pri-orities are being too much aligned with FP priorities thereby not giving sufficient attention to particular national research niches (on this issue see further section 3.3)
• That the 'culture' and design of the 6th Framework Programmes - with the emphasis on multidisciplinary networks, a high degree of international co-operation and a need for beneficiaries to have appropriate infrastructure in terms of equipment (e.g. laboratories) and support services (e.g. financial
Needs considered only to a limited de-gree

Assessment of the Impact of the 6th Framework Programme on new Member States
C:\Documents and Settings\ms\Local Settings\Temporary Internet Files\OLK36\FP6_New MS_Final Report_24 05 09_final (2).doc
34
.
and administrative staff with required skills) - was not the most adequate to promote participation from the new MS14
• That a smaller bridging instrument and/or a specific transitional measure to assist the new MSs would have been appropriate if it was important for DG RTD to see higher participation levels from the new MS. But at the same time, the study also shows that the national experts in the new MS disagree whether it would have been correct normatively to install criteria favouring the new MS
3.3 Research policy developments Evaluation question: Is there evidence that the new MS has developed research policy in order to maximise the potential of the FP, including increasing (or decreasing) national research expenditure?
There is very clear evidence of important developments in the research policy of the new MS in directions that would maximise the potential of the FP. The new Member States' commitments to comply with the goals of the Lisbon Strat-egy and to encourage research and a favourable climate for innovation has translated into the adoption of national research programmes and strategies whose content in terms of objectives and thematic priorities are very close to that of FP6.
Most of the interviewed national experts find this alignment process positive and contributing to a needed modernisation of national research policy (a posi-tion most prominently found in Romania).15 Other stakeholders, in particular in Poland and Lithuania, find that the 'copying' - as it was termed by some inter-viewees - of the FP has gone too far and does not take into account some of the specific competencies in the new MS. This is argued to have negative unin-tended effects as some research fields where excellent results could be achieved
14 Indicative of the size-issue is the fact that the research area that accumulated the highest amount of EC contribution to the new MS - Information Science Tecnology (IST) - is the area with highest degree of centralization with the overall top 10% of participants account-ing for 69% of the funding. As the Marimón Report recommended: 'A greater role must be played by instruments such as STREPs and small consortium IPs. Such instruments are better adapted to […] participants from new Member States and smaller players in general' (R. Marimón (2004) Evaluation of the New Instruments of Framework Programme VI, In-dependent Panel of high-level experts, p. 3). 15 The interview persons had the opportunity to assess the statement: 'Increasing the partici-pation of the new MS in the FP is just as likely to damage the national research systems as support their development'. A significant majority in the countries (with the exception of Lithuania where viewpoints were more mixed) disagree with this statement. They acknowl-edge that there is an effect on the national system but this is likely to be a positive one and in the view of many stakeholders a very positive one indeed. Nevertheless, in all countries a minority of stakeholders do see a threat of damaging national research systems.
FP priorities incorpo-rated into national policy

Assessment of the Impact of the 6th Framework Programme on new Member States
C:\Documents and Settings\ms\Local Settings\Temporary Internet Files\OLK36\FP6_New MS_Final Report_24 05 09_final (2).doc
35
.
at the international level are being neglected. At the same time, research is be-ing conducted in areas where there is not always a national environment to back it up and where the potential benefits are therefore limited. This is for example the case of Lithuania which is prioritising participation in Euro Space, although it does not have its own aerospace industry, and from Slovenia it was men-tioned that its national niche in marine-related research does not easily 'fit' with FP priorities.16
The study shows another profound impact in that in certain countries FP6 has been an essential driver for transformation and re-orientation of the entire re-search systems. The FP6 programmatic qualities that have been adopted, to a varying degree, by the countries include:
• the strategic and 'applied' approach to research with priority areas • the planning horizon (e.g. adopting a 2007-2013 time horizon) • the evaluation procedure for national research proposals The figure below indicates roughly the degree to which the five case countries have aligned their research policy and processes with the FP - ranging from 'moderate' (Slovenia) to 'radical' (Romania).
Figure 4 Illustration of degrees of impact of FP6 on national research policy
Initiatives have thus been taken in the countries to address some of the short-comings of the existing R&D environment in the new MS in areas such as stra-tegic policy-making, partnerships between science and business, development of clusters and innovation developments in enterprises, etc. Such developments are not strictly caused by FP6 participation, but there is clear evidence that this kind of European collaboration has exposed some weaknesses in the national systems and acted as a driving force for the development of more comprehen-sive measures to improve the effectiveness of the national research systems. This was also confirmed by the follow-up interviews with international experts
16 A follow-up interview with an external expert (representing a university in one of the new MS) confirmed the potential dilemma between a 'European' and a 'national' research agenda as illustrated by this statement: 'After FP5 there were high expectations:: "If they are doing like this in the European programmes, then it is a certificate that it is correct, and we will do the same" Sometimes too much so. In general, it has been positive with the influence from FP6 since it has made it easier to make necessary reforms. But it has been too simplified; some creative thinking has been left out, and the local contexts have not been taken into consideration'.
The programmatic qualities of FP
Reform initiatives to improve the national R&D environment

Assessment of the Impact of the 6th Framework Programme on new Member States
C:\Documents and Settings\ms\Local Settings\Temporary Internet Files\OLK36\FP6_New MS_Final Report_24 05 09_final (2).doc
36
.
where a statement was made that FP6 was 'instrumental in deep national re-forms that had to take place in any event'.17
In four of the studied countries, the share of research expenditure to GDP has increased in the period 2000 to 2006, with Poland as the only exception to this rule, cf. the table below.
Table 13 Gross Expenditure on Research and Development
% of GDP
2000 2006
EU (27 countries) 1.86 1.84
Czech Republic 1.21 1.54
Lithuania 0.59 0.8
Poland 0.64 0.56
Romania 0.37 0.45
Slovenia 1.41 1.59
Source: Eurostat. GERD is Gross domestic expenditure on Research and Development) It is not possible to claim that the tendency of increased funding is a result of the influence of FP6. Nevertheless, the talks with national experts and also in light of the influence of FP6 on the national research agendas renders it plausi-ble that FP participation has been a contributing factor to this development as it stimulated the prioritising of research.
The table below presents an overview of the research policy developments in the case-study countries.
Table 14 Overview of research policy developments
Country Research policy developments
Czech Republic
• Emphasis on priority of R&D for competitiveness of the country • Priorities of the National research programme have been largely influ-
enced by the priorities of the FPs • Rationalisation and simplification of R&D system • Reform of R&D funding system
Lithuania • Changes in research and development strategy
17 In both Lithuania and Poland the development of national technology platforms are good examples of concrete initiatives that have been taken to restructure the R&D sector so as to stimulate joint research activities in strategically relevant fields. The Czech Republic and Poland are examples of countries where reforms of the R&D system have been initiated with the objective of rationalising and simplifying it and promoting more collaboration be-tween public and private research. In Romania, a thorough modernisation of research policy was explicitly motivated with a references to alignment with FP6.
Research expendi-ture
Overview of the re-search policy devel-opments

Assessment of the Impact of the 6th Framework Programme on new Member States
C:\Documents and Settings\ms\Local Settings\Temporary Internet Files\OLK36\FP6_New MS_Final Report_24 05 09_final (2).doc
37
.
Country Research policy developments
• Thematic priorities and activity areas from FP6 reflected in High Tech-nology Development programme 2002-2006
• Other policy developments: innovation policy and education strategies • Support for national technology platforms and development of clusters
Poland • Various policy and strategy documents issued by the ministry responsi-ble for science focusing on the Lisbon goals
• FP6 priorities directly reflected in strategic research areas of National Framework Programme
• Reform of R&D system, including funding system and restructuring of the R&D sector
• Development of technological platforms Romania • Development of strategic framework and action programme that follows
EU budgetary cycles • Content of national plan has a very clear European aspiration and moti-
vation • Increased R&D funding
Slovenia • Research priorities reshaped to some extent according to EU priorities and harmonisation in design
• FP is seen as reference to get national funding • Increased R&D funding • The research agenda could/should be considered as more important
and collaboration among the various ministries is needed.

Assessment of the Impact of the 6th Framework Programme on new Member States
C:\Documents and Settings\ms\Local Settings\Temporary Internet Files\OLK36\FP6_New MS_Final Report_24 05 09_final (2).doc
38
.
4 Impact of FP6 participation
4.1 System learning Evaluation question: Has there been evidence of system learning amongst potential par-ticipants. Does this include examples of type of organisations acting as information gate-keepers or facilitating the dissemination of experience?
While the previous chapter showed significant changes at the policy level, this section presents systemic learning impacts. System learning is defined in this context as changes in processes and functions within the national R&D systems resulting from their FP6 participation.
It is a first overall finding that the issue of system learning is of particular rele-vance for the new MS because of the very nature and character of FP6. A suc-cessful participation in FP6 requires competences and practices that are differ-ent from what typically have been the case in the new MS - such as having strong contacts to research institutions and other R&D organisations in Western Europe (often a key prerequisite for being invited into the large collaborative projects), a change of focus from individual knowledge producing organisa-tions to the knowledge chain, project management skills and a networking ap-proach. At this overall level, FP has been a driver for important systemic changes - viewed by national experts (and also confirmed by international re-search policy specialists) as one of the most positive and valuable impacts of FP participation. The figure below captures the dynamics introduced by FP6.
Figure 5 Simplified illustration of system learning
FP6 was a driver for systemic changes

Assessment of the Impact of the 6th Framework Programme on new Member States
C:\Documents and Settings\ms\Local Settings\Temporary Internet Files\OLK36\FP6_New MS_Final Report_24 05 09_final (2).doc
39
.
The specific system learning impacts are shown in the below table followed by a short elaboration.
Table 15 Formal and informal system learning effects
Learning effects
Formal system learning effects
(such as the creation of a new organi-sation or new formalised procedures for cooperation between actors in the research sector)
Increased collaboration between ministries re-lated to strategic policy-making - linking economy, R&D and education in some countries
Infrastructure enabling collaboration between re-search institutions and businesses; see also sec-tion on industry participation (section 4.5.2)
Informal system learning effects
(such as the creation and widespread acceptance within the research com-munity of new values and norms)
Cooperation and networking is increasingly being seen as an ideal
Mind-set change process within organisations towards networking and giving more attention to international collaboration
Increased prestige/branding of successful re-search performers - ability to attract more stu-dents
The study has detected examples of formal system learning effects at different levels:
At ministry level an increased collaboration between ministries responsible for research and the economy in setting research priorities is detected. This was the case in Lithuania where the Ministry of Economy and the Ministry of Educa-tion and Science have begun closer collaboration, a practice not developed until the beginning of FP6. The collaboration is part of a new strategy which to a larger extent attempts to link business and science.
At the university level/within academia FP6 has contributed to increasing the number of collaborative projects, events, drafting of joint papers, joint propos-als, etc. both between institutions within the same country, and between insti-tutes from the same university. The latter is an indicator and a consequence of an increased focus on multi-disciplinary approaches. Another type of learning at the institutional level regards the implementation of new software systems and the development of new research areas, which was underlined by an expert from Czech Republic.
Collaboration between research institutions and companies is increasingly pro-moted though clusters, networks and intersectoral technology platforms high-lighted by stakeholders in Poland, Lithuania and Slovenia.
Ministerial level
Universities and aca-demia
Business-R&D-collaboration

Assessment of the Impact of the 6th Framework Programme on new Member States
C:\Documents and Settings\ms\Local Settings\Temporary Internet Files\OLK36\FP6_New MS_Final Report_24 05 09_final (2).doc
40
.
Text box 1 Examples of collaboration
An output of the collaboration between the Ministry of Economy and the Ministry of Educa-tion and Science in Lithuania: the creation of Science & Technology Parks and 'Valleys' bringing together businesses, universities and public research institutes (as an example, see: www.sunrisevalley.lt).
In south eastern Poland centred in the Rzeszow region, the Polish Aerospace industrial cluster, "Aviation Valley", has been considerably consolidated in recent years. The Polish aerospace technological platform has strongly contributed to the development of a strategy for Polish aviation through the preparation of an ambitious national research programme, integration of key industrial and scientific partners and involvement in strategic research programmes at the European level.
Also in Poland, the Network of Excellence on Micri-Optics (NEMO, founded within FP6) has established an "Industrial user Club" with the purpose of facilitating access to the technolo-gies available for business development in micro-optics.
In each of the MS, various institutions involved in FP participation, and par-ticularly the NCPs, not only promote collaboration and networks, but also try to collect some data, experiences, etc. However, the systems in place do not seem to be optimal in terms of organising all the available knowledge in a way that it is accessible to potential users - some stakeholders express the view that the activities mostly target the actors already engaged and interested.
A way of addressing these issues could be the Poland bottom-up initiative taken by the FP coordinators who have established an association with the purpose of sharing experiences of FP participation and enhancing dialogue between differ-ent participating stakeholders. In addition they hold regular meetings with the Ministry responsible for science and technology.
This study has detected important informal system learning effects:
Participation in FP6 has not only generated concrete experiences of interna-tional collaboration, but also an increased international outlook as such. The increase in particular applies for research actors in those countries which had the least experience of international cooperation beforehand, but the earlier more widespread unawareness of FPs has been replaced by a clear recognition of European research which has become a point of orientation for institutes and individuals. As a Czech researcher exemplified, he could now send out students to conferences he got acquainted with by his contacts, could invite people to workshops in the Czech Republic, organise summer schools etc.
Probably the most profound learning effect of FP6 is its significant contribution to an increased emphasis on the value of networking as a general method to generate innovation, to utilise resources and to complement competencies - in the context of FP6 but also broader in the context of national research pro-grammes. This focus has a profound impact on the R&D systems in the sense that it involves not only the level of research or management, but also the levels
Coordination and information bodies
International outlook
New mind-set on networking

Assessment of the Impact of the 6th Framework Programme on new Member States
C:\Documents and Settings\ms\Local Settings\Temporary Internet Files\OLK36\FP6_New MS_Final Report_24 05 09_final (2).doc
41
.
of administration staff, education, teaching, etc. The stakeholders in the five countries were thus almost unanimous in saying that FP6 has led to considera-bly more networking activities.18 A Romanian researcher noted that the ten-dency to see cooperation as a zero-sum game has been replaced by seeing it as a win-win solution. The emphasis of networking is reflected in the Slovenian government White Paper of 2006 ‘Resolution on National Research and Devel-opment Programme’. Some of the research policy priorities outlined in this pa-per include the improvement of R&D co-operation and technology transfer, strengthening and creating centres/networks of excellence and improving em-ployment conditions to attract researchers and enhance their mobility.
Text box 2 An indicator of increased networking and project quality: Romania
The Romanian case provides an indicator of the impact of FP6 of proposal writing and the general thinking on research projects:
A comparison between national proposals submitted under the so-called NPI (before or in the beginning of the FP6 period) and NPII (since 2005) reveals a significant difference in quality of the national research proposals. There are more partners per proposals, a clearer indication of networking, and the proposal quality is rated as higher than earlier. Accord-ing to the national authority, the quality improvement should to a large extent be attributed to inspiration and experience of FP6.
Enough networking? The level of networking is assessed differently in the MS studied, with some stakeholders arguing that the level of collaboration is still not satisfactory, that competition between organisations supersedes collaboration, that the networks are not sustainable beyond FP6, or that the relations between research institu-tions and business needs to be developed in order to maximise innovation po-tential. The status appears thus to be the following: the value of networking has been widely accepted and is becoming a new standard, but actual behaviour sometimes deviates from the ideal.
Mobility Mobility effects seem to be most visible to researchers who have gained new favourable opportunities particularly with the Marie Curie programme. Besides, new contacts and networks also generate new opportunities. Yet, when it comes to the number of persons actually being willing to move to another region in the country or to another country, the effect of the FP is not evident and several stakeholders (e.g. in Poland and Slovenia) point out that researchers are not necessarily attracted by moving for longer periods of time (e.g. Poland, Slove- 18 Networking has been strongly promoted through instruments like the Networks of Excel-lence, and participation in various research activities has developed new contacts to col-leagues both within the country and across the borders. A lot of funding has been provided for conferences and workshops which used to be activities that many researchers in new MS could not afford. These new opportunities allow the research communities to be more aware of which events are useful to attend and to follow the latest events in European re-search which is essential if the researchers are to produce high quality science.

Assessment of the Impact of the 6th Framework Programme on new Member States
C:\Documents and Settings\ms\Local Settings\Temporary Internet Files\OLK36\FP6_New MS_Final Report_24 05 09_final (2).doc
42
.
nia). Even though the level of mobility has indeed increased, some interviewees see it as a ‘natural’ increase and not necessarily linked specifically to FP6.
4.2 Organisational impact Evaluation question: What has been the impact of participation in the FP on the organisa-tions involved, such as a new strategy, new areas of research, access to new skills, in-creased research expenditure, development of new markets, employment effects, etc?
Even though the assessments of the organisational impacts of FP6 participation differ across the countries, two common trends can be identified:
• A boost towards a new networking culture within the research institu-tions. For the institutions participating in FP6, the most significant impact has been a gradual change of perspective and work culture towards a more collaborative, interdisciplinary, international, and project-oriented work form - an effect that goes far beyond the individual FP6 projects hence represents an important behavioural additionality. This impact was empha-sised by the research performers and other stakeholders, and the observa-tion was confirmed via the follow-up interviews
• Benefits exceeding costs. The interviewed research performers were asked to make a condensed assessment of their FP experience by evaluating if benefits of the FP6 participation all-in-all would exceed the costs of par-ticipation. The answers were unambiguously positive and show that while the participation in FP6 sometimes has been much less positive than ex-pected for the institutions involved, they are nevertheless likely to be will-ing to take part in future FPs
The study specifically shows that the organisations that have been part of FP6 projects have acquired:
• An increase in skills and research capabilities of its key research staff
• Increased access to relevant international networks and research facilities
• A growing understanding of the value of networking and the development of a networking culture (as noted above)
• An increased focus and familiarisation with multidisciplinary and intersec-toral research
• Development of administrative capacity/competence to handle interna-tional project management processes
However, it has also been the assessment of some stakeholders that the diffu-sion of knowledge and results of FP6 projects within the research institutions has not been satisfactory, implying that the potential innovative capacities of
Same tendencies across the countries
Diffusion of knowl-edge

Assessment of the Impact of the 6th Framework Programme on new Member States
C:\Documents and Settings\ms\Local Settings\Temporary Internet Files\OLK36\FP6_New MS_Final Report_24 05 09_final (2).doc
43
.
projects were not fully realised. This seems to be the case in particular for those research institutions with a less developed networking culture and less focus on internal communication and knowledge sharing.
4.3 Unintended consequences19 Evaluation question: hat have been the unintended or possibly undesirable consequences of participation in the FP?
Administrative burden The administrative burdens related to FP6 participation were accentuated as unexpectedly problematic by stakeholders in all the countries studied, however less so in Romania. FP's are viewed as very bureaucratic in their design, and the procedural requirements are considered demanding, rigid and time-consuming. This entails a burden on the researchers who feel they have less time for re-search and on the administrative staff who are often not experienced with work-ing with EU institutions and international projects. These administrative cir-cumstances are by some stakeholders considered to lower the incentive to par-ticipate in the FPs. The administrative burden and long procedures are per-ceived as particularly unattractive for SMEs operating in fast-changing markets and with limited finances (see further section 4.5.2).
Section 3.3 on research policy developments showed significant policy changes driven by FP6, and the changes have in some countries (in particular Lithuania, Poland, Romania) been surprisingly radical for some of the stakeholders and some negative effects of the adjustment of priorities were brought forward: The focus on applied and policy-relevant research may entail less basic research and the focus on the priority areas of the FPs may not reflect national needs and academic traditions.
4.4 Examples of social and economic impacts Evaluation question: Have there been any early examples where FP6 research has already led to identifiable examples of economic or social impacts
The intermediate results of FP6 participation relating to policy development, system learning and organisational impacts have been presented in the previous chapter. In terms of identifiable examples of economic and social impacts - such as the creation of ready-to-market products, patents and ultimately the creation of new jobs - the study findings are inconclusive and preliminary. 19 The unintended consequences mentioned in this section are consequences that have been regarded as unintended by the stakeholders interviewed and persons/institutions involved in FP6.
Loss of control over national research agenda
Intermediate results - long term impacts have not materialised

Assessment of the Impact of the 6th Framework Programme on new Member States
C:\Documents and Settings\ms\Local Settings\Temporary Internet Files\OLK36\FP6_New MS_Final Report_24 05 09_final (2).doc
44
.
• Examples of projects which have come near to technological-breakthroughs were mentioned such as energy-environment projects (Ro-mania), laser technology projects (Lithuania) and aeronautic technology projects (Poland)
• It was learned that in Slovenia and the Czech Republic, a number of small consulting companies specialised in the facilitation of participation in FP6 have been established
In sum, FP6 can only to a very limited degree have influenced macro-development trends and has only to a limited degree resulted in ready-to-market products. When the overall impact of FP6 in the new MS nevertheless is posi-tive (and also perceived by national actors to be positive) it is due to the impor-tant and significant transformational impact of FP6 - it being a driver for re-search policy modernisation and 'softer' systemic and organisational changes.
4.5 Barriers to FP6 participation Evaluation question: What have been the major barriers which have limited or prevented the participation of the new MS in the FP?
4.5.1 A ranking of the general barriers Information on barriers to participation was collected in three ways: The inter-viewees were asked to respond to a number of statements on possible barriers to participation and indicate the degree to which they agree with a series of statements. They were further asked to rank a number of pre-defined possible barriers and finally they were asked to include additional barriers if necessary.
The table below shows that the most important barrier was perceived to be the 'lack of professional contacts and research networks'. This was mentioned by almost all those interviewed in the country case studies. Also to be noted, the language barrier is rated as having some importance (in the early phase of FP6 the language barrier was of higher importance than later in some countries, and this issue is still of high importance for the administrative staff).
The administrative requirements related to management of FP6 projects - in combination with a lack of practice in project management - have acted as an-other important barrier for participation. Hence, the mere perception of 'Brus-sels bureaucracy' - whether it can be justified or not - is seen as a barrier for participation20 and this signals a need for the European Commission to address this issue proactively. It is thus interesting to observe from the study that when the project managers and administrators actually learned the procedures they
20 The perception is in accordance with the assessment made in the Marimón Report that: 'Administrative procedures and financial rules should be significantly improved for more efficiency and flexibility in implementing participation instruments' (R. Marimón (2004) Evaluation of the New Instruments of Framework Programme VI, Independent Panel of high-level experts, p. 4).
Summary on the so-cial and economic impact
The main barrier to participation: Lack of contacts and net-works
Perception of 'Brus-sels bureaucracy'

Assessment of the Impact of the 6th Framework Programme on new Member States
C:\Documents and Settings\ms\Local Settings\Temporary Internet Files\OLK36\FP6_New MS_Final Report_24 05 09_final (2).doc
45
.
tended to be less negative. This can e.g. be seen from interviews with Roma-nian stakeholders arguing that the FP procedures were relatively easy to man-age compared to the national system.
Many interviewees argued that a number of barriers exist and the interviewees overwhelmingly agreed to the statement that 'there is no single reason why the participation of the new MS is relatively low as this is a complex problem which is not yet fully understood'. Also to be noted, barriers to the FP are highly contextual and change over time. Language barriers, for instance, were mentioned as a more significant barrier when FP6 was launched than today be-cause the use of the English language is being promoted also for national re-search projects (as in Romania where it is mandatory to prepare applications for national funded research also in the English language).
Table 16 Rating of categories of barriers to FP6 participation
Types of barriers CR LIT PL RO SLO Summary
Information barriers Low Low Medium Medium Low This potential barrier was mitigated via the NCP system
Lack of professional contacts and research networks
Medium High High High Medium The single most important barrier
Little practices in cross-country cooperation
Medium Medium High High Medium Important barrier for countries with low participation level
Language barriers Medium Medium Medium Medium Low Over time a less important barrier
Availability of national financ-ing
High Medium Medium Medium High Tendency to become a less important barrier for most countries experiencing increasing national research budgets
Perception of 'Brussels bu-reaucracy' and lack of prac-tice in project management
High High High Low High Perceived in most countries as an im-portant barrier
Other barriers • Many of the new MS have weak and non-innovative industries and SMEs; hence few options for exploitation at the national marked of research results
• Lack of human resources in administration as well as in research • Lack of financial incentives in making the proposal as in getting additional national
funding: matching fund principle did not encourage participation of academics. High: A barriers of high importance; Medium: A barrier of some importance; Low: A barrier of low importance
The interviewees considered that the statement: 'Significant increases in the participation of the new MS in the FP will not be possible before there are ma-jor economic and social changes in the new MS. A high degree of agreement was found among stakeholders in Poland, Romania and Lithuania while to a lesser extent in Slovenia and the Czech Republic.
This finding is fully in line with the general optimistic tone among the stake-holders on the countries' future FP-involvement where most interviewees were of the opinion that what they need is more involvement and the acquisition of more experience in dealing with and carrying out FP projects. It is therefore not surprising that most of the interviewees in all countries disagreed with the statement that 'the participation of the new MS in the FP will probably never
No single barrier….
An optimistic tone: Increased participa-tion is possible…

Assessment of the Impact of the 6th Framework Programme on new Member States
C:\Documents and Settings\ms\Local Settings\Temporary Internet Files\OLK36\FP6_New MS_Final Report_24 05 09_final (2).doc
46
.
reach the level of the 'old' MS'. The stakeholders support the view that they will catch up, but within a considerable time frame (many mentioning a 10 years period).
In spite of the optimistic tone, the progress should not be taken for granted:
• Relative attractiveness of FP funding may decrease. Up till 2007, national funding allocated to research and development has been increasing in most countries when the countries seek to fulfil the 1% public R&D objective, and national funding is sometimes perceived as an 'easy money' alternative compared to EU-funding
• Sustainability of results shall be documented. The degree to which research communities in the new MS will prioritise the FP in the future depends ob-viously on their success rates in terms of producing outputs and in main-taining contacts. In one of the follow-up interviews this was expressed like this: 'Participation in the next FPs is not guaranteed just because some re-searchers have participated in FP6. Negative experiences might indeed reduce incentives to participate in future FPs, especially if these experi-ences are the first experiences.' As described above (section 4.1), the inter-viewed research performers consider their FP6 participation to have been overall beneficial for their institution. This positive assessment of FP6 needs to shared by the broader research community (including the non-successful FP6 applicants) to ensure a high level of commitment from the research communities to be involved with future FPs
The overall role of the Commission was also investigated as the interviewees considered the statement that 'the Commission has done a good job in helping the new MS increase their participation in the FP'. Affirmative answers were given by a clear majority in Slovenia, Romania and the Czech Republic while the feedback was more mixed in Lithuania and Poland. It is difficult to explain the difference but it can be noted that in the same countries there was a strong scepticism towards other aspects of FP6 (administrative procedures and the ability of the countries to influence the design of FP6).
Based on the comments, the Commission assistance could have been even more useful if:
• The visibility of the new MS's researchers was given more focus by invit-ing them to take part in FP evaluation panels
• More support to the training of administrative staff was offered
4.5.2 Barriers for involvement of industry That the participation in FP6 of industry in the new Member States is low was already noted in section 2.2 and it is further detailed in the table below showing
…. but should not be taken for granted!
The role of the Com-mission
Low level of partici-pation

Assessment of the Impact of the 6th Framework Programme on new Member States
C:\Documents and Settings\ms\Local Settings\Temporary Internet Files\OLK36\FP6_New MS_Final Report_24 05 09_final (2).doc
47
.
a participation level well below the EU27 average. Therefore, a more detailed analysis of industry involvement has been undertaken.21
Table 17 FP6 contribution to industry
Country EC contribution to industry (% of total FP6 contribution)
Industry participants (% of total number of FP6 participants)
Czech Republic 17.0 16.6
Lithuania 10.4 13.8
Poland 8.3 12.0
Romania 7.5 10.7
Slovenia 13.0 14.9
New MS 11.0 12.6
EU 27 18.2 18.7
Source: FP6 Database, DG Research
The table shows that in all the new MS studied, the level of FP6 participation (measured as the EC financial contribution and number of participants) is lower than the EU average but with the Czech Republic and also Slovenia being close to the EU average. Romania and Poland are the countries with the lowest share of industry participation, also below the average of the new Member States. The study has identified four factors of specific importance to the participation of industry as shown in the table below.
Table 18 Four factors of importance for industry involvement
Factor Level of importance Comments
Knowledge of FP6 Somewhat important Only Czech industry rep. stated that companies had 'little knowledge'
Company focus on R&D Very important Low focus in all countries except Slovenia (and to extent Czech Rep.)
Administrative procedures of FP6
Very important Mentioned by all stake-holders
Partners and influence Very important In particular international but also domestic partners
21 For this part of the study a specific fact-finding exercise was carried out regarding the issue of participation of industry and private business in FP6. The data on the participation of private businesses have been collected through a number of supplementing ways: Studies of findings from existing reports (PRO-INNO TrendChart, ERAwatch), data from the FP6 Database of DG Research and from interviews with stakeholders in the five case study Member States - including interviews with industry representatives. The data collected through interviews expresses views on FP6 and FP6 participation found among key indus-trial players in the new Member States.
Assessment of the Impact of the 6th Framework Programme on new Member States
C:\Documents and Settings\ms\Local Settings\Temporary Internet Files\OLK36\FP6_New MS_Final Report_24 05 09_final (2).doc
48
.
Knowledge of FP6 On the knowledge of FP6 the study shows that:
• Information activities (from NCPs etc.) in particular reach business circles already interested or involved in FP6
• The level of knowledge varies from branch to branch with some business associations being more attentive and active than others, and with bigger companies having more knowledge than SMEs
• The level of knowledge of FPs is increasing in all countries
Lack of R&D focus On the R&D focus of companies the study shows that:
• The focus and investments in R&D and innovation among companies is generally low (with the exception of Slovenia and to some extent Czech Republic) which contributes to maintain a weak linkage between industry and research institutions, see further Appendix 4
On the administrative procedures the study shows that:
• Administrative procedures are regarded as complicated and resource-demanding
• The administrative procedures are in particular a burden to small compa-nies and companies with no/little experiences in international networking and programmes
Partners and influence On the partners and influence the study shows that:
• As relatively new players in the European field of R&D, companies often have less access to international networks
• Some companies experience reluctance from companies and institutions in the 'old' Member States to engage in consortia with partners from the new Member States whom they have no experience in working with
• Certain initiatives such as the creation of technology platforms, associa-tions including both research institutions and businesses, and policy initia-tives emphasising cooperation found in all the countries point in the direc-tion of increased levels of cooperation
• Companies from the new Member States do not have equal opportunities (due to resources or networks/traditions) to do lobbying at the EU level to influence the R&D agenda and priorities
Below is a short outline of the situation regarding industry in relation to R&D and FP6 participation for each of the five countries:
Czech Republic: The participation of Czech industry is the highest among the new Member States and close to the EU average. The share of private funding
FP6 administrative procedures
Participation and in-dustry in the five countries

Assessment of the Impact of the 6th Framework Programme on new Member States
C:\Documents and Settings\ms\Local Settings\Temporary Internet Files\OLK36\FP6_New MS_Final Report_24 05 09_final (2).doc
49
.
of R&D activities is also among the highest (close behind Malta and Slovenia) and roughly at the EU average level. The level of foreign controlled companies (and investments) is among the highest in the EU (INNO-Policy TrendChart 2008) which points to networking and collaboration as influencing the level of participation of Czech industry. INNO-Policy TrendChart (2008) identifies co-operation between public R&D and industry as one of the main innovation challenges for the Czech Republic. In spite of the relatively high level of par-ticipation, it was suggested that industry had 'little knowledge' of FP6 and that complicated administration procedures acted as a barrier for participation. Pol-icy initiatives aimed at setting up bodies with representatives from both re-search institutions and business was mentioned as positive measures.
Lithuania: The participation of Lithuanian industry is about average compared to the other new Member States and thus significantly below the EU average. The share of private funding of R&D activities is very low. INNO-Policy TrendChart (2008) identifies cooperation between public R&D and industry as a weakness in the Lithuanian innovation system, and the need for improved in-novation skills, entrepreneurial attidues and the development of knowledge-intensive clusters are the main challenges. The industry representatives from Lithuania emphasised the lack of R&D focus within industry and complicated administration procedures of FP6 as the main barriers for FP6 participation. The creation of national (and international) technology platforms was high-lighted as a positive measure.
Poland: The participation of Polish industry is below average compared to the other new Member States - especially as regards the level of EC contributions. The level is significantly below the EU average. The share of private funding of R&D activities is very low (See table 15) and Polish companies do not invest sufficiently in innovation (INNO-Policy TrendChart 2008). Also, the coopera-tion between science and industry is low.
Romania: The participation of Romanian industry is among the lowest com-pared to the other new Member States - and significantly below the EU aver-age. The share of private funding of R&D activities is very low, and so is the overall level of business R&D activities. Likewise, there is a need to improve business support infrastructure and industry-university-R&D research institu-tion partnerships (INNO-Policy TrendChart 2008). Romanian experts inter-viewed for the study have highlighted the networking aspect as having particu-lar importance in relation to FP6 participation - with some foreign companies and institutions often reluctant to engage in cooperation. The establishment of national networks comprising both private businesses and public R&D institu-tions was accentuated as a positive measure.
Slovenia: The share of participation of Slovenian industry is among the highest in the new Member States, but still a little below the EU average. Business en-terprises both perform and finance a high share of R&D activities, together with Malta the highest among the new Member States and about the level of the EU average. The number of innovative firms and level of capitalisation of results (in terms of patents) remains low, there is a need to increase human resources

Assessment of the Impact of the 6th Framework Programme on new Member States
C:\Documents and Settings\ms\Local Settings\Temporary Internet Files\OLK36\FP6_New MS_Final Report_24 05 09_final (2).doc
50
.
in R&D in the business sector and to improve cooperation among public R&D and business sectors (INNO-Policy TrendChart and Erawatch 2008).
Text box 3 Recommendations given by national industry representatives
The industry representatives interviewed for this study submitted the following recom-mendations on how the level of industry participation could be increased:
• Organisation of face-to-face brokerage events to support the building of consortia • More funding for SSA projects with a focus on topics relevant to new MS • Measures specifically targeting business circles not already involved in FP activities • More incentives to include partners from new Member States in consortia • Funding of projects with clear short-term production outcomes

Assessment of the Impact of the 6th Framework Programme on new Member States
C:\Documents and Settings\ms\Local Settings\Temporary Internet Files\OLK36\FP6_New MS_Final Report_24 05 09_final (2).doc
51
.
5 Conclusion This evaluation has described and analysed the evolving participation of the 12 new Member States in the 6th Framework Programmes to see the impact that it has left so far on the countries' research policy and the research communities. Based on three data sources - statistical data, interviews with national experts and follow-up interviews with international experts - the evaluation has ad-dressed four themes:
• The general picture regarding the participation of new MS in FP6 • Degree to which new MS have maximised the potential of FP6 • Impact of FP6 on the research system and involved research institutions • Barriers that have limited the participation The total amount dedicated to FP6 in all 27 Member States was 16.7 billion EUR and from this amount research institutions in new Member States have managed to attract around EUR 824 million, equal to 4.9% of the total.
To put these figures in perspective, the research performers in EU27 have re-ceived a funding similar to 34 EUR per inhabitant in EU27 while the EUR 824 million allocated to research performers in new MS amounts to 8 EUR per in-habitant in the new MS.22
The level of participation of new MS may therefore at first sight appear to have been limited. However, the analysis also shows that:
• The FP6 funding going to new MS - if compared against GERD (national RD expenditure) - amounts to no less than 4.33% of national R&D expen-diture which is significantly higher than EU27 average (2.1%); hence the allocation represents a significant 'volume' of resources in the context of the national research sectors
• Relative to GDP, the FP6 contribution is not far below the EU27 average. Six new MS actually receive a FP6 contribution which, compared to the countries' GDP, is above the EU27 average
22 Note: The FP6 funding is attributed to participants in FP6 and not to a specific country; thus the amounts presented are accumulated amounts gathered by participants according to national origin.
The general picture regarding the partici-pation of the new MS in the FP6

Assessment of the Impact of the 6th Framework Programme on new Member States
C:\Documents and Settings\ms\Local Settings\Temporary Internet Files\OLK36\FP6_New MS_Final Report_24 05 09_final (2).doc
52
.
• The overall difference between new MS and EU27 in FP6 funding is re-duced to some degree when adjusted for the different price structures in the countries (purchasing power parity)
It is therefore a main conclusion of this study that there is no simple measure to adequately illustrate the position of new Member States participation in FP6. The analysis shows that research performers from some countries - Slovenia, Cyprus, Malta and Estonia - have participated intensively in FP6 and for these countries the the degree of participation is close to or above the EU27 average (depending on indicator). Next, there is an 'in-between' group of countries in-cluding the Czech Republic and Hungary, while the level of participation of research performers from Bulgaria, Latvia, Lithuania, Poland, Romania and Slovakia was significantly below the EU27 average.
It can further be concluded that the new MS are well integrated into FP6 in so far that research performers in new MS have been involved in all the FP6 the-matic areas23 and all the different instruments offered by FP6. Specifically, the study shows that:
• The research area producing the highest EC contribution to the new MS is 'Information society and technologies' (more than 20% of the total) with 'Sustainable development', and 'Human resources and mobility' the second most popular priorities gathering between 10 and 15% of the total EC con-tribution
• The new MS appears relatively homogenous in the prioritising between the priority areas: Information society and Sustainable development are the two areas attracting most participants from all new MS
• The distribution of contributions per instrument to the new MS follows roughly that of FP6 as a whole, however with some exceptions. The new MS have attracted significantly more contributions related to specific sup-port actions (app. 11%) than the total EC contributions (app 6%). One of the new instruments of FP6 - integrated projects (IP) - accounts for 40% of the total EC contributions, but only 26% of the contributions to the new MS. Thus the instrument to which the largest amount of contributions is at-tributed, at the same time a new instrument introduced by FP6, has resulted in a significantly smaller share of the funding going to the new MS as compared with the EU27 as a whole
A low level of industry participation in FP6 has been identified. Whereas indus-try in the new MS managed to attract 11% of the total contribution, the same figure was 18% for industry globally in the EU27. In the context of the case country studies, four factors have subsequently been identified as barriers: Lim-ited knowledge of FP6 (only some countries), a general low focus on R&D (specifically Poland and Romania while much less so in Slovenia and Czech Republic), FP6 administrative procedures perceived as unreasonable demand- 23 Seven priority areas, three cross-cutting research activities, two activities targeted the foundation of ERA and five activities directed at the structuring of ERA.

Assessment of the Impact of the 6th Framework Programme on new Member States
C:\Documents and Settings\ms\Local Settings\Temporary Internet Files\OLK36\FP6_New MS_Final Report_24 05 09_final (2).doc
53
.
ing, and finally have industry representatives in new MS suffered from less de-veloped contacts with research institutions in 'old' EU MS.
It should finally be noted that an almost perfect correlation has been identified between national macro-economic performance (GDP) and EC contribution to the individual new MS: the higher GDP of a country the more will its research sector participate in FP6. The causality of this correlation has not been fully explored but it appears plausible that the prerequisites for a successful partici-pation in FP (access to equipment, high-level research competences, established international contacts, familiarity with networking processes, etc.) are more commonly found in well-developed economies.
The new MS have to a high degree maximised the potential of FP6 via three types of actions:
FP6 as a driver for specific policy changes. FP6 has had a profound impact on national research policies as it has, to a significant (but varying) degree, in-spired a process of aligning national research priorities with the FP priorities. Examples are thus given of countries studied in the context of this assessment (e.g. Romania and Lithuania, and to lesser extent also Poland, Czech Republic and Slovenia) where the impact has been massive and FP6 priorities have effec-tively substituted 'national' priorities. It should be noted however, that the over-all assessment of such change needs to be carefully weighed: some critics in the countries concerned, representing a minority of the national experts that were consulted, see this process as a 'copying' of the European model and with a risk of overlooking national research areas.
FP6 as a driver for a more strategic approach to national research policy. In some of the new Member States FP6 has been a vehicle for a transformation and re-orientation of the research policy planning (Romania, Lithuania, Poland) where the programmatic qualities of the FP6 have been used. These qualities include:
• The strategic and 'applied' approach to research with priority areas • The planning horizon (e.g. adopting a 2007-2013 time horizon) • The evaluation procedure for national research proposals
Launch of activities to promote FP6 participation. The new MS were in a less favourable situation than other MS due to a lack of contacts and previous ex-perience with the EU-programmes, and to counter this situation the following promotion activities were implemented:
• Comprehensive awareness-raising activities organised by a system of Na-tional Contact Points (NCP). These operated in all countries but a differ-ence could be seen between countries where the system was well institu-tionalised (like Czech Republic and Slovenia) and countries where a 'first generation' of NCPs should be organised (Romania)
• Financial support measures for proposal preparation (Poland, Slovenia, Czech Republic) as well as support to cover the participant's own contribu-
Degree to which new MS have maximised the potential of FP6
Assessment of the Impact of the 6th Framework Programme on new Member States
C:\Documents and Settings\ms\Local Settings\Temporary Internet Files\OLK36\FP6_New MS_Final Report_24 05 09_final (2).doc
54
.
tion to project budgets (Poland, Romania) seem to have had a significant effect in terms of motivating potential participants
• National research liaison offices were set up in Brussels. All the Member States have RTD offices in Brussels to promote participation in FP6
• FP6 participation counts in national research evaluations. To stimulate an international reorientation of national research, some countries (Romania, Lithuania, Poland) reward submission of FP6 proposals in national re-search evaluation procedures, using a standardised 'uplift' (for instance in Romania, where an FP6 submitted proposal automatically receives a 5 point bonus; out of 100 points)
Many of the stakeholders in the new MS that were consulted for this study con-sider that the 'culture' and design of the 6th Framework Programme - with the emphasis on multidisciplinary networks, a high degree of international coopera-tion and a need for beneficiaries to have appropriate infrastructure in terms of equipment (e.g. laboratories) and support services (e.g. financial and adminis-trative staff with required skills) - was not the most adequate to promote par-ticipation from the new MS. It has thus been pointed out that the specific needs of countries only to a limited degree were taken into account in the design of FP6 which on the one hand is seen as 'natural' since the new MS did not articu-late their priorities very well (they were preparing for accession to the EU at the time when the 6th Framework Programme was designed). It has on the other hand also been noted that DG RTD could have carried out a more systematic needs assessment prior to designing FP6, and that the communication between the accessing countries and DG RTD was not optimal for the exchange of viewpoints.
FP6 has had an important impact on research organisations' interests and capac-ity in networking and has inspired a networking approach to the management and implementation of research projects with more focus on cooperation, con-sortia-creation, multi-disciplinarity, communication and management skills. This value of the 6th FP does not rest only with the results of the funded pro-jects per se (where few tangible impacts have materialised), but also to FP6's structuring impact on national research systems and the participating institu-tions.
Table 19 The dynamics introduced with FP6
Before FP6 - a tendency towards… After FP6 - new dynamics introduced…
Sectoral approach Towards a multi-disciplinary and network approach
Basic research Towards more applied research
Unclear relations between research institu-tions and business
Towards increased cooperation between different actors
Less focus on communication and visibility of research projects
Towards a new focus on communication and project management
Impact of FP6 on the research system and involved research institutions

Assessment of the Impact of the 6th Framework Programme on new Member States
C:\Documents and Settings\ms\Local Settings\Temporary Internet Files\OLK36\FP6_New MS_Final Report_24 05 09_final (2).doc
55
.
For the institutions participating in FP6, the most significant impacts have been a gradual change of perspective and work culture towards a more collaborative, interdisciplinary, international, and project oriented work form - an effect that goes far beyond the individual FP6 projects hence representing an important behavioural additionality. This impact was emphasised by the research per-formers and other stakeholders, and the observation was confirmed via the fol-low-up interviews. The main impacts (across the countries):
• Access to state-of-the - art knowledge and skills • Getting to know the ight people /networking • Visibility and ability to expose skills to international audience • Networking culture and project management skills into the organisation • Increased prestige attached to research performers part of FP6 The interviewed research performers were asked to make a condensed assess-ment of their FP experience by evaluating if benefits of the FP6 participation all in all would exceed the costs of participation. The answers were positive and it is therefore a final conclusion that while the participation in FP6 sometimes has been much less positive than expected for the involved institutions, they are nevertheless likely to be willing to take part in future FPs.
The main barriers are lack of professional contacts and networks and a percep-tion of the administrative burdens associated with FP6 projects.
Table 20 Importance of various barriers to FP6 participation
Barrier Importance
Information barriers Very important factor in some countries when FP6 was launched; mitigated via the NCP-system; im-portance of this factor is decreasing over time
Lack of professional contacts and research networks
Very important - mentioned by all stakeholders
Language barriers Some importance - in particular for administrative staff. Over time a less important barrier
Availability of national financing Important - a tendency to become a less important barrier for most countries experiencing increasing national research budgets
Perception of 'Brussels bureauc-racy' and lack of practice in project management
Very important factor (however, in Romania it was given less importance).
Barriers that have limited the participa-tion

Assessment of the Impact of the 6th Framework Programme on new Member States
C:\Documents and Settings\ms\Local Settings\Temporary Internet Files\OLK36\FP6_New MS_Final Report_24 05 09_final (2).doc
56
.

Assessment of the Impact of the 6th Framework Programme on new Member States
C:\Documents and Settings\ms\Local Settings\Temporary Internet Files\OLK36\FP6_New MS_Final Report_24 05 09_final (2).doc
57
.
Appendix 1 List of literature DG Research (2008) Key Figures 2007 on Science, Technology and Innovation - Towards a European Knowledge Area.
Eurostat (2007) Science, technology and innovation in Europe.
M. Karlesky, N.S. Vonortas (2008) FP6 Participation, The George Washington University.
R. Marimón (2004) Evaluation of the New Instruments of Framework Pro-gramme VI, Independent Panel of high-level experts.
Policy Mix, R&D (2007) Monitoring and analysis of policies and public fi-nancing instruments conducive to higher levels of R&D investments: The "Pol-icy Mix" project.
PRO INNO Europe (2007) INNO-Policy TrendChart - Policy Trends and Ap-praisal Report.

Assessment of the Impact of the 6th Framework Programme on new Member States
C:\Documents and Settings\ms\Local Settings\Temporary Internet Files\OLK36\FP6_New MS_Final Report_24 05 09_final (2).doc
58
.
Appendix 2 List of persons interviewed
Name Organisation
Czech Republic
Anna Vosečková Czelo
Karel Sperlink The Association of Innovative Entrepreneurship of the Czech Republic;
Lenka Lepicová Czelo
Vladimir Albrecht Technology Centre AS
Eva Kudrnova Technology Centre As
Nada Konickova Technology Centre AS
Jarmila Tiosavljevičová Academy of Science
Milan Scasny Charles University Environment Centre
Marie Kolmanová Permanent representation of the Czech Republic in the EU
Hana Vlckova Permanent representation of the Czech Republic in the EU
Miloš Chvojka Ministry of Education, Youth and Sports
Romania
Prof. Adrian Curaj, Director Executive Agency for Higher Education and Research Funding, Ministry of Education and Research
Magda Cringasu, Deputy Director Executive Agency for Higher Education and Research Funding, Ministry of Education and Research
Anca Ghinescu, Director National Authority for Scientific Research, Department of European Integration and International Cooperation
Florin Vrejoiu
ARIES, the Association of Electronics and Software Com-panies of Romania.
Viorel Vulturescu, National Coordinator National Authority for Scientific Research, Department of European Integration and International Cooperation
Iulia Mihail, Director Romanian Office for Science and Technology, R.O.S.T
Catalina Melita, General Director Sectoral Operational Programme ' Increase of Economic Competitiveness', Ministry of Economy and Finance
Serban Pantaitescu, General Director National Centre for Programme Management, Ministry of Education and Research
Ecaterina Cica, Legal advisor National Centre for Programme Management, Ministry of Education and Research
Alexandru Müller; Laboratory Head National Institute for R&D in Microtechnologies, IMT, Bu-charest
Dana Christea, Head of Department National Institute for R&D in Microtechnologies, IMT, Bu-charest
Carmen Moldovan National Institute for R&D in Microtechnologies, IMT, Bu-charest
Claudia Roman National Institute for R&D in Microtechnologies, IMT, Bu-charest

Assessment of the Impact of the 6th Framework Programme on new Member States
C:\Documents and Settings\ms\Local Settings\Temporary Internet Files\OLK36\FP6_New MS_Final Report_24 05 09_final (2).doc
59
.
Name Organisation
Christian Ormindean, Consultant The Foundation 'Romanian Centre for Small and Medium-sized Enterprises
Daiana David, Consultant The Foundation 'Romanian Centre for Small and Medium-sized Enterprises
Monica Nicola, Coordinator The Foundation 'Romanian Centre for Small and Medium-sized Enterprises
Alexandru Marin, Director Research Management Department, Poly-technical Univer-sity of Bucharest
Loan Plotog, Executive Director Faculty of Electronics and Telecommunication, Poly-technical University of Bucarest
Barna Emil-Stefan, Vice-Rector University of Bucharest
Dena Dragos, Professor University of Bucharest
Angheluta Vadineanu, Professor, Head of De-partment
University of Bucharest, Department of Systems Ecology and Sustainability
Elona Toma Ministry of Education and Research - National Authority for science Research (ANCS)
Ms Isadora Precup, Head of Division Romanian Academy (ACAD), Division of International Rela-tions
Slovenia
Prof. dr. Tamara Lah – Director National Institute for Biology (NIB), Ljubljana
M.Sc. Peter Volasko – Head of the service for international co-operation and European Affairs
Ministry of Higher Education, Science and Technology (MHEST), Ljubljana
Marjeta Trobec – Technology transfer Institute Jozef Stefan Institute, Ljubljana
dr. Andreja Umek Venturini Ministry of Higher Education, Science and Technology (MHEST), Ljubljana
Doc. dr. Irena Mele – Intenational Relations and strategic issues
Agencija ARAO - Agency for Radwaste Management, Ljubljana
Dr. Radojka Vercko – undersecretary of the ser-vice for international co-operation and European Affairs
Ministry of Higher Education, Science and Technology (MHEST), Ljubljana
Prof. dr. Peter Stanovnik – Ex-director The Institute for Economic Research, Ljubljana
Prof. dr. Alenka Malej – Head Marine Biology Station, Piran
Prof. dr. P. Damijan University of Ljubljana
Prof. dr. Boriz Cizelj - Director Slovenian Business & Research Association (SBRA), Brussels
Lithuania
Dr Kastytis Gecas, Director
Milda Garmute, Project Consultant
Lithuanian Innovation Centre
Juras Ulbikas, Director EuroParama, RTD Consultancy
Dr Aiste Vilkanauskyte, Deputy The Agency for International Science and Technology Pro-grammes in Lithuania
Neringa Kranauskiene, Deputy Head
Kristina Babelyte, Chief Specialist
Ministry of Education and Science, Department of Science and Technology, Division of International Research Pro-
Assessment of the Impact of the 6th Framework Programme on new Member States
C:\Documents and Settings\ms\Local Settings\Temporary Internet Files\OLK36\FP6_New MS_Final Report_24 05 09_final (2).doc
60
.
Name Organisation grammes
Prof. Valdemaras Razumas, Secretary General Lithuanian Academy of Sciences
Dr Eugenijus Butkus, Chairman Lithuanian Science Council
Kestutis Jasiuna
EKSPLA (Lithuanian laser manufacturing company - mem-ber of Engineering Industries Association of Lithuania)
Juras Ulbikas
EuroParama, RTD Consultancy
Dr Juras Banys, Pro Rector for Research
Dr. Marija Snieckute, Head of Research Mangement Office Vida Lapinskaite, Reserach Management Office
Vilnius University
Prof. habil. dr. Rymantas Jonas Kazys, Vice Rec-tor for Research
Kaunas University of Technology
Dr Rolandas Urbonas, Scientific Secretary Lithuanian Energy Institute
Rima Putkiene, Deputy Head Ministry of Economy, Investment and Innovation Depart-ment, Investment and Innovation Department
Assoc. Prof. Dalia Satkovskiene Department of Theoretical Physics, Faculty of Physics of Vilnius University
Poland
Professor Maciej Zylicz, President of the Board, Executive Director
Foundation for Polish Science
Dr Tomasz Perkowski, Deputy President Foundation for Polish Science
Mr Jakub Wojnarowski, Director of Programme Division
Foundation for Polish Science
Mr Michal Pietras, Deputy Director of Programme Division
Foundation for Polish Science
Prof. Janusz Holyst, Faculty of physics, Centre of Excellence for Complex systems Research
Warsaw University of Technology
Prof. Malgorzota Kujawinska, Head of Optical En-gineering Division
Warsaw University of Technology
Ms Agnieszka Wozniak, Chief Specialist, Centre for International Cooperation
Warsaw University of Technology
Ms Marta Szajnowska-Ksit, Financial Specialist, Centre for international Cooperation
Warsaw University of Technology
Zygmunt Mozer Research and Development Department, PGE Polska Grupa Energetyczna S.A
Dr Andrzej Siemaszko, Director National Contact point for Research programmes of the EU
Prof. Andrzej Gorski, Vice-President Polish Academy of Science
Dr Michal Kabata, Director, Department of Sci-ence Promotion
Polish Academy of Science
Mr Dariusz Drewniak, Director Department of Strategy and Development of Science
Ministry of Science and Higher Education,

Assessment of the Impact of the 6th Framework Programme on new Member States
C:\Documents and Settings\ms\Local Settings\Temporary Internet Files\OLK36\FP6_New MS_Final Report_24 05 09_final (2).doc
61
.
Name Organisation
Ms Ewa Madej-Popiel, Head of Unit for EU Re-search Programmes, Department of EU Affairs
Ministry of Science and Higher Education,
Ms Isabela Wojtowicz, Director Research and Development Unit
Polish Agency for Enterprise Development
Dr Dorota Maciejko, Deputy Director Information Processing Centre (OPI)
Ms Krystyna Siwek, Director Plenipotentiary for RIS Mazovia
Information Processing Centre (OPI)
Mr Krzysztof Lipiec, Coordinator, EU Cooperation Fund Project - "Evaluation of participation in FP6 for Poland
Information Processing Centre (OPI)
Ms Edyta Czerwonka, International Research Programme Officer
University of Warsaw
Prof. Tadeusz Zoltowski, President Foundation for European Scientific Cooperation
Follow-up interviews
Prof. dr. Antanas Cenys Faculty of Fundamental Sciences, University of Vilnius
Prof. dr. Annamaria Inzelt Budapest University of Economics and Public Administra-tion
Prof. Jerzy M. Langer Polish Academy of Sciences
Dr. Andrea Scharnhorst Virtual Knowledge Studio, Royal Netherlands Academy of Arts and Sciences
Assoc. Prof. Lena Tsipouri University of Athens, InnoTrend Chart
Assessment of the Impact of the 6th Framework Programme on new Member States
C:\Documents and Settings\ms\Local Settings\Temporary Internet Files\OLK36\FP6_New MS_Final Report_24 05 09_final (2).doc
62
.
Appendix 3 A brief presentation of FP6 The Framework Programmes are the main instrument for the provision of re-search funding in Europe and have been implemented since 1984. The 6th Framework Programmes was fully operational January 1, 2003 and was thus implemented in the aftermath of the Lisbon Summit in March 2000 and in the context of making a better use of European research efforts through the creation of an internal market for science and technology - a 'European Research Area' (ERA). FP6 has been the main financial ‘tool’ supporting the creation of ERA.
The main actors that can participate in FP6 projects are the following24:
• A research group at a university or at a research institute; one of the main target groups, able to participate through a variety of actions
• A company intending to innovate and in particular SMEs, for which 15% of the budget of the thematic priorities is reserved
• An association or grouping of SMEs: business associations (consortia) may receive funding to entrust research activities to research institutions
• Public administrations (dealing with management of public research pro-grammes): the ERA-NET scheme supports trans-national coordination
• Undergraduate students are directly targeted in some actions promoting science among young people
• Early stage researchers (post-graduate) are supported through special mobility and training schemes
• Experienced researchers are supported through Special Mobility Actions providing advanced training or supporting the transfer of knowledge
• Top-level researchers: Excellence Grants enable promising researchers to create a team engaged in leading edge or multi-disciplinary research
• Institutions running research facility of transnational interest - offer support for transnational access for guest researchers from Europe
• Organisations and persons from third country - three complementary routes for participating and funding for International co-operation
• Others - entities like European Economic Interest Groups (EEIGs), inter-national organisations, non-governmental organisations, end-users, etc.
Instruments of FP6 The following list of instruments of FP6 corresponds to both new and
traditional instruments (those similar to instruments implemented in FP5).
• Integrated projects (IPs): ambitious objective-driven research dealing with different issues through a “programme approach”
• Specific Targeted Research: objective-driven research more limited in scope than IPs and usually focused on a single issue
• Networks of Excellence, (NoE): durable integration of the participants’ research activities
• Coordination Actions (CA): promoting and supporting the networking and coordination of research and innovation activities
• Specific Support Actions (SSA): preparation of future actions, support to policy, dissemination of results.
24 www.cordis.eu
Main objective of FP6
Main actors

Assessment of the Impact of the 6th Framework Programme on new Member States
C:\Documents and Settings\ms\Local Settings\Temporary Internet Files\OLK36\FP6_New MS_Final Report_24 05 09_final (2).doc
63
.
Among the above-listed instruments the Integrated Projects and the Networks of Excellence are new instruments of FP6 as a response to identified needs within the research community of EU. The Framework Programmes before the FP6 focussed on the implementation of co-operative research projects. Two main weaknesses identified with these programmes have called for the need of the implementation of new instruments in the context of FP6. These weak-nesses identified prior to FP6 can be summarised in the following25:
• The end of a research project was often equivalent to the end of the consor-tium of research partners as well.
• The projects often did not manage to reach the necessary 'critical mass' to have real impact (neither in scientific nor in industrial or economic terms).
The largest part of the budget of FP6 is spent on the so-called “focusing and integrating” research activities on seven thematic priority areas, listed below:
Information society technologies: to stimulate the development hardware and software technologies and applications at the heart of the creation of the infor-mation society in order to increase the competitiveness of European industry.
Life sciences, genomics and biotechnology for health: to exploit break-throughs achieved in decoding the genomes of living organisms, for the benefit of public health and to increase competitiveness of the biotechnology industry.
Sustainable development, global change and ecosystems, including energy and transport research: to strengthen the scientific and technological capaci-ties needed for Europe to be able to implement sustainable development, and integrating its environmental, economic and social objectives.
Nanotechnologies, multifunctional materials and new production proc-esses: to help Europe achieve a critical mass of capacities needed to develop and exploit, especially for greater eco-efficiency and reduction of discharges of hazardous substances to the environment, leading-edge technologies.
Aeronautics and space: to strengthen the European aeronautics and space in-dustry and encouraging it to become more competitive at international level.
Food quality and safety: to help establish the integrated scientific and techno-logical bases needed to develop an environmentally friendly production and distribution chain of safer and varied food.
Citizens and governance in a knowledge-based society: to mobilise research capacities in economic, political, social sciences and humanities to develop an understanding of the emergence of the knowledge-based society and new forms of relationships between citizens and between citizens and institutions.
25 www.cordis.eu
Thematic priorities

Assessment of the Impact of the 6th Framework Programme on new Member States
C:\Documents and Settings\ms\Local Settings\Temporary Internet Files\OLK36\FP6_New MS_Final Report_24 05 09_final (2).doc
64
.
These activities intend to complement research within the seven thematic areas.
Research for policy support: to respond to the scientific and technological needs of the policies of the Community, underpinning the formulation and im-plementation of Community policies, bearing in mind also the interests of fu-ture members of the Community and associated countries.
New and emerging science and technology (NEST): to respond flexibly and rapidly to major unforeseeable developments, emerging scientific and techno-logical problems and opportunities..
Specific SME activities: to support European competitiveness and enterprise and innovation policy, these specific activities are intended to help European SMEs in traditional or new areas to boost their technological capacities and de-velop their ability to operate on a European and international scale.
International co-operation activities: to support of the external relations, in-cluding the development policy of the Community, specific measures aimed at encouraging international research cooperation.
JRC activities: to provide independent, customer-driven support for the formu-lation and implementation of Community policies, including the monitoring of the implementation of such policies, within the areas of its specific competence.
In order to stimulate the development of research and technology policy in Europe there are also activities that may be implemented in any scientific and technological area to promote coordination of research activities:
Co-ordination of research activities: to develop synergies between existing national activities; enhance the complementarity between Community actions and those of other European scientific co-operation organisations.
Development of research/innovation policies: to encourage coherent devel-opment of research and innovation policies in Europe by early identification of challenges and areas of common interest and by providing policy makers with knowledge and decision-aiding tools.
Activities could also be taken aiming to deal with structural weaknesses of European research. These activities are applicable to all fields of research.
Research and innovation: to stimulate technological innovation, utilisation of research results, transfer of knowledge and technologies and the setting up of technology businesses, not least in the less developed areas.
Marie Curie Actions - Human resources and mobility: to support the devel-opment of abundant world-class human resources in all regions of the EU by promoting mobility for training purposes, the transfer of knowledge, and help to make Europe attractive to third country researchers.
Cross-cutting re-search activities
Strengthening the foundations of ERA
Structuring the ERA

Assessment of the Impact of the 6th Framework Programme on new Member States
C:\Documents and Settings\ms\Local Settings\Temporary Internet Files\OLK36\FP6_New MS_Final Report_24 05 09_final (2).doc
65
.
Research infrastructures: to help establish a fabric of research infrastructures of the highest level in Europe and to promote their optimum use.
Science and society: to encourage the development of harmonious relations between science and society, as well as contributing to scientists' critical think-ing and responsiveness, as a result of the establishment of an informed dialogue between researchers, industrialists, political decision-makers and citizens.

Assessment of the Impact of the 6th Framework Programme on new Member States
C:\Documents and Settings\ms\Local Settings\Temporary Internet Files\OLK36\FP6_New MS_Final Report_24 05 09_final (2).doc
66
.
Appendix 4 Research in the new Member States, in particular focussing on the five case countries Appendix 4 contains:
• a general overview of research in the new MS, addressing:
- public spending on education, - patent applications - level of exports of high-tech products, - the number of scientists and engineers (% of the labour force)
• an introduction to the research sector in each of the five case countries
Public expenditure on education The developments in public expenditure on education in the new MS show a general increase from 2000 to 2005 as in EU27 average. However, several ex-ceptions seem present such as: Estonia, Latvia, Malta and Slovakia.
Table 21 Total public expenditure on education as a percentage of GDP
2000 2005
EU (27 countries) 4.68 5.03
Bulgaria 4.19 4.51
Czech Republic 4.04 4.25
Estonia 5.57 4.87
Cyprus 5.44 6.92
Latvia 5.64 5.06
Lithuania 5.63 4.95
Hungary 4.5 5.45
Malta 4.52 2.93
Poland 4.87 5.47
Romania 2.88 3.48
Slovenia n.a. 5.83
Slovakia 4.15 3.85
Source: Eurostat Expenditure on R&D The table below shows expenditure on R&D as a percentage of GDP. The EU27 expenditure on research has remained constant during 2000-2006. Most

Assessment of the Impact of the 6th Framework Programme on new Member States
C:\Documents and Settings\ms\Local Settings\Temporary Internet Files\OLK36\FP6_New MS_Final Report_24 05 09_final (2).doc
67
.
new Member States have increased their relative share of research expenditure to GDP, but it still remains much lower than the rest of the EU.
Table 22 Gross Expenditure on Research and Development
% of GDP Share of funding % (2005)
2000 2006 Public Private Abroad
EU (27 countries) 1.86 1.84 34 55 9
Bulgaria 0.52 0.48 64 28 8
Czech Republic 1.21 1.54 41 54 4
Estonia 0.61 1.14 44 39 17
Cyprus 0.24 0.42 67 17 11
Latvia 0.44 0.7 46 34 19
Lithuania 0.59 0.8 63 21 11
Hungary 0.78 1 49 39 11
Malta n.a. 0.54 32 55 13
Poland 0.64 0.56 58 33 6
Romania 0.37 0.45 54 37 5
Slovenia 1.41 1.59 37 55 7
Slovakia 0.65 0.49 57 37 6
Source: Eurostat Note: The four indicators provided are GERD (Gross domestic expenditure on R) as a percentage of GDP, percentage of GERD financed by industry, percentage of GERD financed by government and percentage of GERD financed from abroad. Indicators on patents, high-tech and number of scientists The below table shows the performance of the new MS in regard to
• Patent applications. The number of patent applications to the European Patent Office (EPO) refers to applications filed under the European Patent Convention or to applications filed under the Patent Co-operation Treaty and designated to the EPO (Euro-PCT). Data from Table 10 shows that new Member States are lagging behind compared to the rest of the EU Member States because all are below EU average.
• Exports of high-tech products. Another indicator is exports of high tech-nology products. The share of high-tech exports to total exports shows that several of the new Member States are doing better than EU27 average no-tably the smaller Member states Malta and Cyprus but also Hungary and the Czech Republic are performing relatively well.
• Number of scientists and engineers. The percentage share of scientists and engineers is below EU27 average, apart from Slovenia and Poland.

Assessment of the Impact of the 6th Framework Programme on new Member States
C:\Documents and Settings\ms\Local Settings\Temporary Internet Files\OLK36\FP6_New MS_Final Report_24 05 09_final (2).doc
68
.
Table 23 RTD indicators
Patent EPO per million inhabitants, 2005
High-tech exports share of total, 2006
Scientists and Engi-neers, % of labour force, 2006
EU (27 countries) 101.3 16.65% 4.8%
Bulgaria 0.52 3.34% 3.0%
Czech Republic 6.95 12.74% 3.3%
Estonia 5.19 7.99% 4.0%
Cyprus 0 21.35% 4.2%
Latvia 5.2 4.2% 3.4%
Lithuania 0.58 4.65% 4.1%
Hungary 6.34 20.32% 4.2%
Malta 22.35 54.61% 3.9%
Poland 2.83 3.11% 5.2%
Romania 2.08 3.85% 4.0%
Slovenia 29.54 4.66% 5.5%
Slovakia 5.76 5.43% 3.0%
Source: Eurostat
Economic performance in new Member States This section gives an overview of the economy of the new Member States based on the size of the country, Gross Domestic Product (GDP), labour pro-ductivity and unemployment rates. The review of the basic economic dimen-sions of the new Member States is necessary since they influence the develop-ment of the research field and the participation in, as well as impact of, FP6.
GDP and population Population and GDP figures are presented in the table below. The 12 new Member States comprise 21% of the EU population and contribute 6.4% of the EU GDP.
This is further reflected in the indexed GDP per capita presented in the Table below expressed in relation to the European Union (EU27) average set to equal 100. All the new Member States have GDP per capita below the EU average, but the development from 2000 to 2006 shows a relatively improved economic situation. Countries like Czech Republic, Estonia, Cyprus and Slovenia are ei-ther close to EU average or approaching fast.

Assessment of the Impact of the 6th Framework Programme on new Member States
C:\Documents and Settings\ms\Local Settings\Temporary Internet Files\OLK36\FP6_New MS_Final Report_24 05 09_final (2).doc
69
.
Table 24 Population, GDP and GDP per capita in Purchasing Power Standards (PPS) (EU-27 = 100)
Population in mil-lion inhabitants
GDP Billion GDP per Capita/Index (EU-27 = 100)
2006 2006 2000 2006
Bulgaria 7.7 25.1 27.9 38.1
Czech Republic 10.3 113.1 68.6 81.5
Estonia 1.3 13.1 44.7 72.1
Cyprus 0.8 14.5 89 93.1
Latvia 2.3 16.2 36.8 58
Lithuania 3.4 23.7 39.4 60.3
Hungary 10.1 89.9 56.2 63.4
Malta 0.4 5.1 83.8 77.1
Poland 38.2 271.5 48.4 53.6
Romania 21.6 97.1 25.9 40.7
Slovenia 2 29.7 78.8 88.7
Slovakia 5.4 43.9 50.2 68.5
EU 12 103.5 742.9
EU (27 countries) 493 11536.2 100 100
Source: Eurostat
Czech Republic26
Czech Republic in FP6. Compared to the other new Member States, the Czech Republic is the country with the third highest number of particpants, Czech Re-public is above average in terms of EC contribution per capita and slightly be-low average regarding contribution per researcher. Hence Czech Republic is significantly below EU average.
Overview of socio-economic and research sector development. The Czech Republic is one of the fastest growing economies of the EU25 (according to 2006 figures) and has a high R&D expenditure compared to the other new Member States with a GERD (1.54 % of GDP) only superseded by Slovenia and not far below the EU average of 1.84 %. The share of private R&D funding is high and characterised by a high level of domination by foreign-controlled companies. The Czech Republic scores well in certain innovation indicators:
26 Sources of information: Erawatch (2008) Czech Republic Country Profile; INNO-Policy TrendChart (2008) Policy Trends and Appraisal Report Czech Republic; FP6 Database, DG Research; Eurostat; Czech Republic field trip interviews

Assessment of the Impact of the 6th Framework Programme on new Member States
C:\Documents and Settings\ms\Local Settings\Temporary Internet Files\OLK36\FP6_New MS_Final Report_24 05 09_final (2).doc
70
.
Employment in med/high-tech manufacturing, ICT expenditure, new-to-market products. On the other hand the country performs poorly regarding the indicator related to patenting, number of S&E graduates, Innovation expenditures, early stage venture capital and new-to-firm products.
Structure of the research and development sector. At the political level, the Resarch and Development Council proposes the allocation of public funds for R&D to be approved by the government. The funding within the Czech R&D system is largely institutional and involves a variety of actors, including 12 ministries (in particular the Ministry of Education, Youth and Sports and the Ministry of Industry and Trade) and other organisations such as the Czech Sci-ence Foundation. The public sector is, as in most of the ex-Communist coun-tries, split between the sectors of higher education and the Czech Academy of Sciences. The former is less research-oriented and more focused on teaching while the latter deals mainly with research activity, predominantly in basic re-search.
Strengths and weaknesses of the research and development sector
Strengths Weaknesses
• High economic growth rate • Increasing labour productivity • Incentives stimulating investment in
high value-added sectors and R&D • Good conditions for IT development
• Weak cooperation between universi-ties and business sector
• Low effectiveness of public administra-tion of R&D and innovation
• Low level of patents and commerciali-sation of R&D results
• Low number of S&E graduates
Lithuania27
Lithuania in FP6. Lithuania performs average among the new Member States regarding EC contribution per capita and as percentage of GDP. When contri-butions are counted per researcher, however, Lithuania only supersedes Roma-nia.
Overview of socio-economic and research sector development. Lithuania has showed a significant economic growth in recent years with an annual GDP growth rate above 6 % since 2001. Also GERD has risen significantly from 0.59 % of GDP in 2000 to 0.8 % in 2006, although the level is still less than half the EU average of 1.84 %. A general strength of Lithuania is a well devel-oped higher education system with strong science and technology research tra-ditions as well as a relatively high share of the population with tertiary educa-
27 Sources of information: Erawatch (2008) Lithuania Country Profile, PRO-INNO Europe (2008) INNO-Policy TrendChart - Policy Trends and Appraisal Report Lithuania, FP6 Da-tabase, DG Research, Eurostat, Lithuania field trip interviews
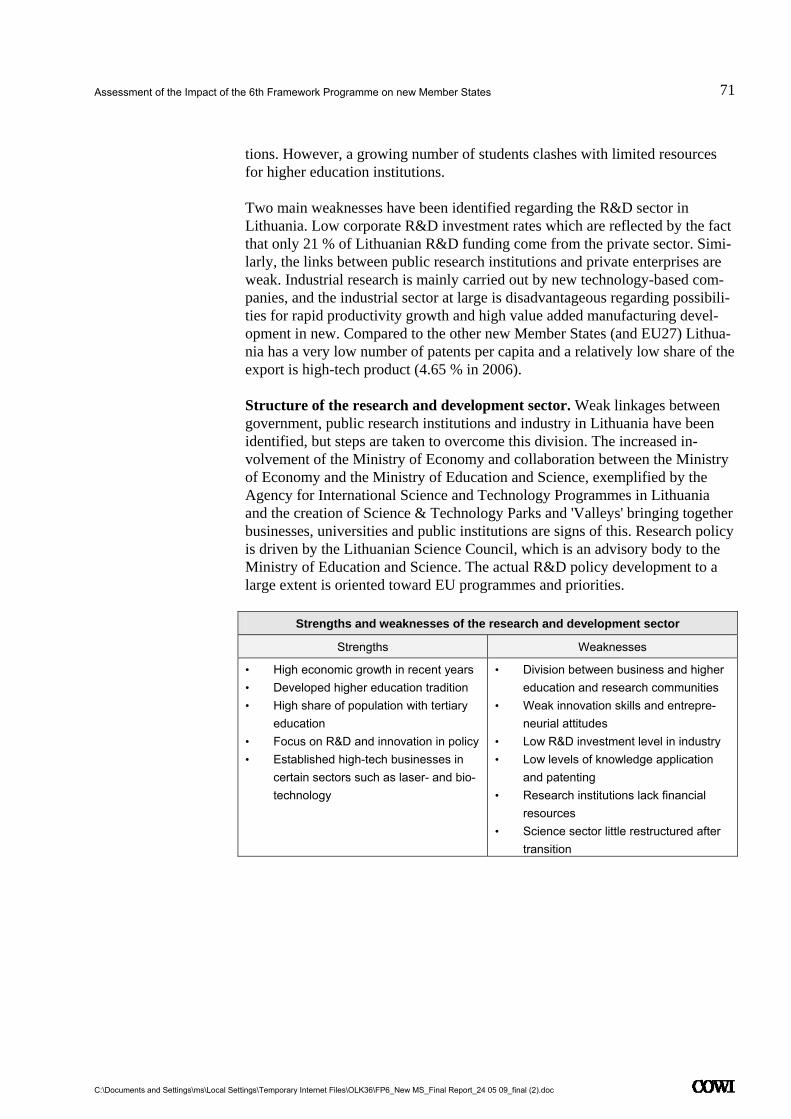
Assessment of the Impact of the 6th Framework Programme on new Member States
C:\Documents and Settings\ms\Local Settings\Temporary Internet Files\OLK36\FP6_New MS_Final Report_24 05 09_final (2).doc
71
.
tions. However, a growing number of students clashes with limited resources for higher education institutions.
Two main weaknesses have been identified regarding the R&D sector in Lithuania. Low corporate R&D investment rates which are reflected by the fact that only 21 % of Lithuanian R&D funding come from the private sector. Simi-larly, the links between public research institutions and private enterprises are weak. Industrial research is mainly carried out by new technology-based com-panies, and the industrial sector at large is disadvantageous regarding possibili-ties for rapid productivity growth and high value added manufacturing devel-opment in new. Compared to the other new Member States (and EU27) Lithua-nia has a very low number of patents per capita and a relatively low share of the export is high-tech product (4.65 % in 2006).
Structure of the research and development sector. Weak linkages between government, public research institutions and industry in Lithuania have been identified, but steps are taken to overcome this division. The increased in-volvement of the Ministry of Economy and collaboration between the Ministry of Economy and the Ministry of Education and Science, exemplified by the Agency for International Science and Technology Programmes in Lithuania and the creation of Science & Technology Parks and 'Valleys' bringing together businesses, universities and public institutions are signs of this. Research policy is driven by the Lithuanian Science Council, which is an advisory body to the Ministry of Education and Science. The actual R&D policy development to a large extent is oriented toward EU programmes and priorities.
Strengths and weaknesses of the research and development sector
Strengths Weaknesses
• High economic growth in recent years • Developed higher education tradition • High share of population with tertiary
education • Focus on R&D and innovation in policy • Established high-tech businesses in
certain sectors such as laser- and bio-technology
• Division between business and higher education and research communities
• Weak innovation skills and entrepre-neurial attitudes
• Low R&D investment level in industry • Low levels of knowledge application
and patenting • Research institutions lack financial
resources • Science sector little restructured after
transition
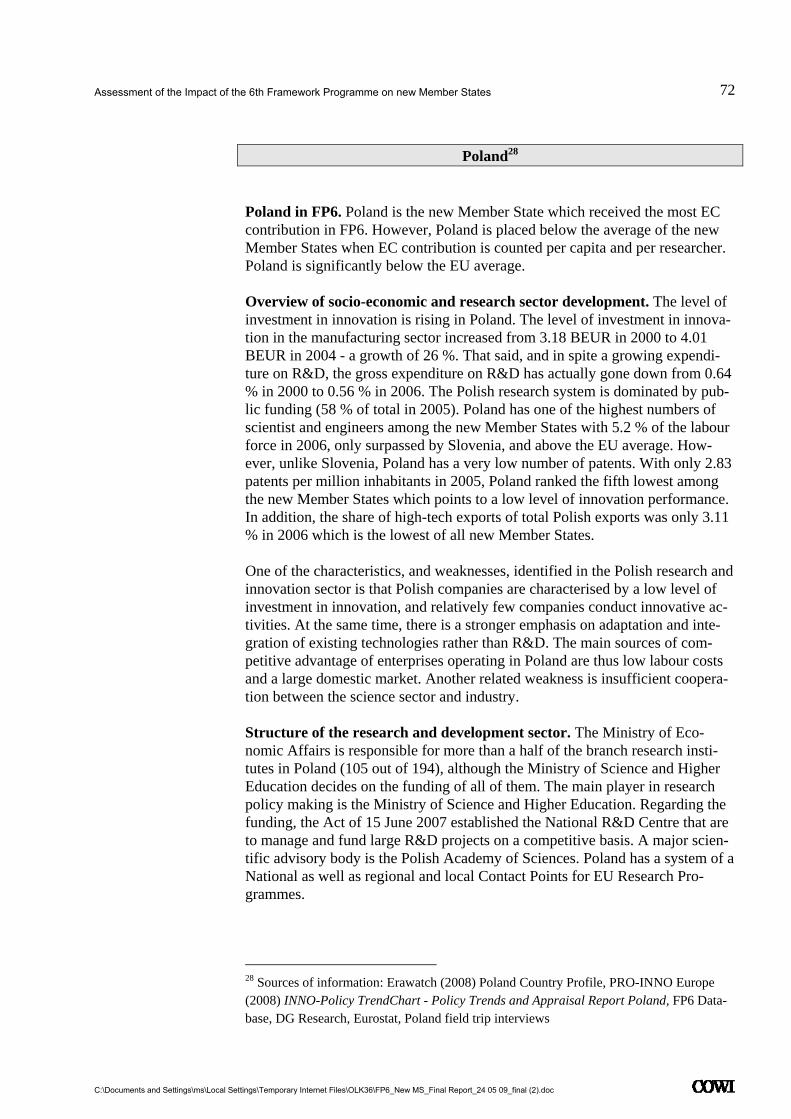
Assessment of the Impact of the 6th Framework Programme on new Member States
C:\Documents and Settings\ms\Local Settings\Temporary Internet Files\OLK36\FP6_New MS_Final Report_24 05 09_final (2).doc
72
.
Poland28
Poland in FP6. Poland is the new Member State which received the most EC contribution in FP6. However, Poland is placed below the average of the new Member States when EC contribution is counted per capita and per researcher. Poland is significantly below the EU average.
Overview of socio-economic and research sector development. The level of investment in innovation is rising in Poland. The level of investment in innova-tion in the manufacturing sector increased from 3.18 BEUR in 2000 to 4.01 BEUR in 2004 - a growth of 26 %. That said, and in spite a growing expendi-ture on R&D, the gross expenditure on R&D has actually gone down from 0.64 % in 2000 to 0.56 % in 2006. The Polish research system is dominated by pub-lic funding (58 % of total in 2005). Poland has one of the highest numbers of scientist and engineers among the new Member States with 5.2 % of the labour force in 2006, only surpassed by Slovenia, and above the EU average. How-ever, unlike Slovenia, Poland has a very low number of patents. With only 2.83 patents per million inhabitants in 2005, Poland ranked the fifth lowest among the new Member States which points to a low level of innovation performance. In addition, the share of high-tech exports of total Polish exports was only 3.11 % in 2006 which is the lowest of all new Member States.
One of the characteristics, and weaknesses, identified in the Polish research and innovation sector is that Polish companies are characterised by a low level of investment in innovation, and relatively few companies conduct innovative ac-tivities. At the same time, there is a stronger emphasis on adaptation and inte-gration of existing technologies rather than R&D. The main sources of com-petitive advantage of enterprises operating in Poland are thus low labour costs and a large domestic market. Another related weakness is insufficient coopera-tion between the science sector and industry.
Structure of the research and development sector. The Ministry of Eco-nomic Affairs is responsible for more than a half of the branch research insti-tutes in Poland (105 out of 194), although the Ministry of Science and Higher Education decides on the funding of all of them. The main player in research policy making is the Ministry of Science and Higher Education. Regarding the funding, the Act of 15 June 2007 established the National R&D Centre that are to manage and fund large R&D projects on a competitive basis. A major scien-tific advisory body is the Polish Academy of Sciences. Poland has a system of a National as well as regional and local Contact Points for EU Research Pro-grammes.
28 Sources of information: Erawatch (2008) Poland Country Profile, PRO-INNO Europe (2008) INNO-Policy TrendChart - Policy Trends and Appraisal Report Poland, FP6 Data-base, DG Research, Eurostat, Poland field trip interviews

Assessment of the Impact of the 6th Framework Programme on new Member States
C:\Documents and Settings\ms\Local Settings\Temporary Internet Files\OLK36\FP6_New MS_Final Report_24 05 09_final (2).doc
73
.
Strengths and weaknesses of the research and development sector
Strengths Weaknesses
• Rising level of investment in inno-vation
• High number of scientists and en-gineers
• Low labour costs and large domes-tic market
• Slow economic growth • Low level of company investments
in innovation • Very low level of patents and high-
tech exports • Insufficient cooperation between
science sector and industry
Romania29 Romania in FP6. Romania is the Member State that attracts the least EC con-tribution from FP6 per capita and per researcher. The contribution is also the lowest in percentage of GDP. Only when regarded as a percentage of R&D ex-penditure is the contribution received by Romanian participants above average which reflects that the Romanian R&D expenditure is low.
Overview of socio-economic and research sector development. Romania has by 2008 had six years of continuous economic growth with increased invest-ment levels and exports. The economic recession in the transition years had a large negative impact on the R&D system which is dependent on public fund-ing. In this light, the recent economic growth has benefitted the R&D sector with the level of funding increasing from 0.26 % of GDP in 2005 to 0.5 % in 2007 and an estimated 0.7 % in 2008. The government commitment to meet the Lisbon 3 % objective means that an increase up to 1 % is expected by 2010.
However, the R&D expenditure still remains low and the GERD is only under-gone by Cyprus (2006 figures). Innovation indicators, such as the level of pat-ent applications per capita, business R&D and exports of high tech products, place Romania among the poorest performers among the new Member States as well in EU 27. But even though innovation mechanisms and infrastructure is still weak, INNO-Policy TrendChart (2008) has identified three aspects where Romania is placed above the EU 25 average: non-technological change in SMEs, new-to-market products, and ICT expenditure.
Structure of the research and development sector. The major player in re-search policy-making is the Ministry of Education, Research and Youth (MERY) through the National Authority for Scientific Research (NASR). The Romanian Research and Innovation system has undergone significant changes during the last five years, mainly due to the efforts to comply to the 2007 EU accession requirements and for ensuring the necessary conditions to achieve the overall Lisbon tasks (Sandy, et al, 2007). 'National Plan for Research, Devel- 29 Sources of information: Erawatch (2008) Romania Country Profile, PRO-INNO Europe (2008) INNO-Policy TrendChart - Policy Trends and Appraisal Report Romania, FP6 Da-tabase, DG Research, Eurostat, Romania field trip interviews

Assessment of the Impact of the 6th Framework Programme on new Member States
C:\Documents and Settings\ms\Local Settings\Temporary Internet Files\OLK36\FP6_New MS_Final Report_24 05 09_final (2).doc
74
.
opment and Innovation for the period 2007-2013' (Ministry of Education and Research, 2006) thus follows the FP programme cycle and contains objectives that not least aims at increased FP-participation, such as strengthening the hu-man resources, opening the RDI-system to the international scientific environ-ment, increasing international visibility of Romanian research and stimulating partnerships across the field of RDI-actors. By 2008 there were about 720 R&D organisations - most of them active in engineering sciences. Romania has a Na-tional Contract Point and 8 regional offices that support universities, research organisations, SMEs, etc.
Strengths and weaknesses of the research and development sector
Strengths Weaknesses
• Continuous economic growth in recent years
• Rising level of investment in innovation • High level of ICT expenditure •
• Low level of industry-university-R&D institution partnerships
• Low level of R&D investments • Low level of company investments in
innovation • Low level of patents and high-tech
exports
Slovenia30
Slovenia in FP6. Slovenia is close to EU average regarding FP6 participation in terms of EC contribution per capita and per researcher. Hence Slovenia is significantly above the average of the new Member States.
Overview of socio-economic and research sector development. Slovenia scores high on a number of socio-economic indicators: During the past few years Slovenia has experienced a high GDP growth rate (6.1 % in 2007), and show progress in certain innovation indicators monitored by EIS - particularly as regards business R&D investments. The total R&D expenditure (% of GPD) is the highest among the new Member States, but still a little below EU aver-age. Slovenia followed a particular transistion path that partly originates from being part of Yugoslavia's institutional framework. Slovenia inherited an enter-prise ownership structure base don self-management which had particular con-sequences on the method of privatization and the speed of institutional change. The gradual transition led to greater creativity and a high level of R&D activi-ties, not least from the private sector. By 2005 business enterprises both per-formed and financed a higher share of R&D activities than EU average. The share of scientists and engineers in the labour force is also the highest (5.5 %) among the new Member States and above EU average (4.8 %). 30 Sources of information: Erawatch (2008) Slovenia Country Profile, PRO-INNO Europe (2008) INNO-Policy TrendChart - Policy Trends and Appraisal Report Slovenia, FP6 Da-tabase, DG Research, Eurostat, Slovenia field trip interviews

Assessment of the Impact of the 6th Framework Programme on new Member States
C:\Documents and Settings\ms\Local Settings\Temporary Internet Files\OLK36\FP6_New MS_Final Report_24 05 09_final (2).doc
75
.
Other indicators point in a somewhat other direction: The public-sector financ-ing of R&D activities has not increased at the same rate as the GDP growth rate, so the ambition to achieve the Lisbon and Barcelona targets of 3 % R&D investment by 2010 might not be reached. Even though the number of patents per million inhabitants is the highest among the new Member States (29.54 in 2005) it is still significantly below EU average (101.3). The share of high tech exports to total exports is also low (4.66 %) - both compared to EU average and most other new Member States. The lack of cooperation between public re-search institutions/universities and private business has been identified as a key issue of concern in the Slovenian R&D and innovation system.
Structure of the research and development sector. R&D activities in Slove-nia resort under the Ministry of Higher Education, Research and Technology. The Ministry supports clusters for companies and research companies as well as technology networks and platforms. In 2004 the Slovenian Research Agency was established as an executive agency in the field of science, and the Slove-nian Technology Agency was established with a focus on business sector R&D and innovation. The institutional research landscape today consists of about 400 research establishments, four universities, 15 national research institutes, about 100 private research institutes and 300 research units in business (Slovenian Research Agency, 2008). The current national R&D development programme argues for more specific priority settings with socio-economic relevance as an important criterion.
Strengths and weaknesses of the research and development sector
Strengths Weaknesses
• Sustainable long-term economic growth
• Recent progress regarding business R&D investments
• High share of researchers and engi-neers in the labour force
• Strong support for education and little brain drain
• Flexible attitude and willingness to change
• Experience in transnational coopera-tion
• Slow structural change of the regula-tory framework
• Insufficient implementation of policy objectives
• Low level of cooperation between re-search institutions/universities and pri-vate business
• University sector in need of reform for smaller and more specialized entities
• Lack of critical mass in many sectors • Poor exploitation of R&D investments

© European Communities, 2009