Embed Size (px)
Citation preview

Assessment of the Implementation of Bwari Master Plan
1Baba, Ezekiel Bahago,
2Olateju, Ademola 3
Mukaila & Lebana, Manasseh Daspan1,2&3
Department of Urban and Regional Planning, Kaduna Polytechnic, Kaduna
A b s t r a c t
he place of implementation in the planning process Tcannot be overemphasizing. Bwari master plan was designed in 2003 and has been the sole document that
guide physical development of Bwari urban area but the level at which the policy document has achieved in reality has become controversial which brought about this study. The study aimed at assessing the level of implementation of Bwari Master Plan with the view to determining the achievement of the master plan document for the urban area. The study adopted Kerg model as an analytical technique for the assessment. The model uses weight ranking criteria such as 0%, 01-19%, 20-39%, 40-59% and 60% and above to established whether the level of implementation is none, weak, low, fair and full. At the end of the study, it was established that the level of implementation of the plan is weak considering the current implementation phase of the plan. This indicates that the land use proposal might not attend full implementation if the present pace of its implementation is maintained. As such, the following recommendations were given They includes the adherence to Required Planning Standards and ethics by the professional bodies in the discharge of responsibility for the Development of the urban area, the introduction of Conscious Planning Regulation in the Development of Indigenous/organic Areas of the Urban Area, there should not be Partisan politics in the Land Use allocation in the Urban Area and there should conscious improvement in the approval of Budgetary allocation for agencies for the physical Development of the Urban Area.
Keywords:
Master plan,
Proposals, Level of
implementation,
Bwari urban area
Corresponding Author:
Baba, Ezekiel Bahago
Vol. 5, No. 2
December, 2017International Journal of Advanced Studies in Business Strategies and Management | IJASBSM
ISSN Print: 2354-4236 | ISSN Online: 2354-4244
http://internationalpolicybrief.org/journals/international-scientific-research-consortium-journals/intl-journal-of-business-vol5-no2-december-2017
IJASBSM | Pg. 111

Background to the StudyThe place of implementation in the planning process cannot be overemphasizing. Bwari master plan was designed in 2003 and has been the sole document that guide physical development of Bwari urban area but the level at which the policy document has achieved in reality has been controversial. Some are insinuating that the level of implementation of the plan is slow; some are saying that the implementation of the plan is moving at a required pace. Some has started speculating whether the proposal of the plan be reviewed or the adopting implementation strategies for some of the proposal be reviewed which brought about this study. The study aimed at assessing the level of implementation of Bwari Master Plan with the view to determining the level of achievement of the master plan document for the urban area. Though, the plan is in third phased of implementation, it calls for the need of the assessment. The assessment had help in proffering answers to some of the controversial issues raised concerning the performance of the plan and also it had helped in ascertaining the progress of the implementation of the plan overtime.
The achieve the success of this study, the following objectives were outlined; to review the proposal of Bwari master plan for Bwari urban area; and to assess the level of implementation of the proposals of the master plan for the urban area. Notwithstanding, the study aimed at proffering answers to the following questions; what are the proposals of Bwari master plan? What is the level of the implementation of the proposals of the plan for the urban area? The study only focuses on the implementation of the land use proposals of the plan for the urban area. The choice of the land use proposal of the plan is of the facts that land use development controls the development of others provisions of the master plan such as the infrastructure provision and the provision of services. And if there is any problem in the implementation of the land use proposals of the plan, the provision of other social services and infrastructure in the area will be affected.
Description of the Study AreaBwari urban area is located in the north-eastern part of FCT, Abuja. It is approximately 15 kilometer north of Abuja city and 25 kilometer northeast of Suleja, in Niger state. Geographically, the area is bound by two natural regions: the Kau plain and Zuma Bwari Aso Hills in the northeast. The northern expressway of Abuja is the boundary between Abuja Municipal Area council and the Bwari Area Council. The Bwari urban area is dominated by Gbagyi natives (the original settler of the area). The natives are the original settlers of the urban area and constitute almost 40% of the residents of urban area.
IJASBSM | Pg. 112
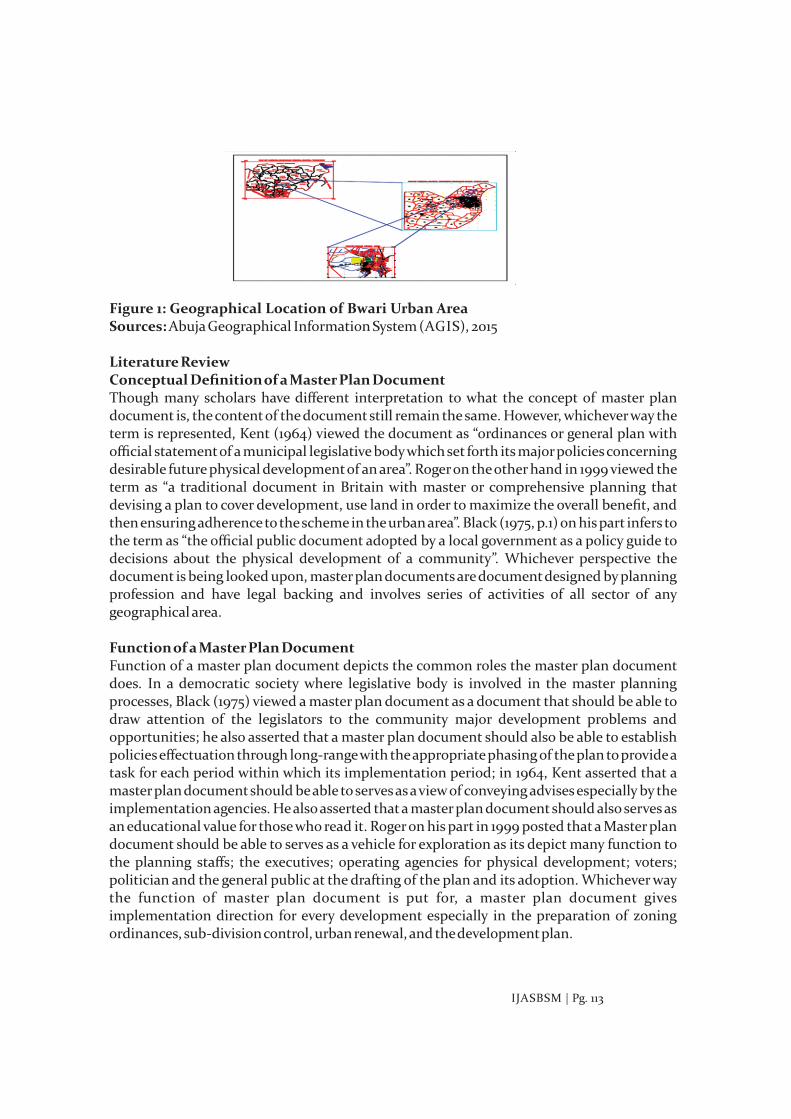
Figure 1: Geographical Location of Bwari Urban AreaSources: Abuja Geographical Information System (AGIS), 2015
Literature ReviewConceptual Definition of a Master Plan DocumentThough many scholars have different interpretation to what the concept of master plan document is, the content of the document still remain the same. However, whichever way the term is represented, Kent (1964) viewed the document as “ordinances or general plan with official statement of a municipal legislative body which set forth its major policies concerning desirable future physical development of an area”. Roger on the other hand in 1999 viewed the term as “a traditional document in Britain with master or comprehensive planning that devising a plan to cover development, use land in order to maximize the overall benefit, and then ensuring adherence to the scheme in the urban area”. Black (1975, p.1) on his part infers to the term as “the official public document adopted by a local government as a policy guide to decisions about the physical development of a community”. Whichever perspective the document is being looked upon, master plan documents are document designed by planning profession and have legal backing and involves series of activities of all sector of any geographical area.
Function of a Master Plan DocumentFunction of a master plan document depicts the common roles the master plan document does. In a democratic society where legislative body is involved in the master planning processes, Black (1975) viewed a master plan document as a document that should be able to draw attention of the legislators to the community major development problems and opportunities; he also asserted that a master plan document should also be able to establish policies effectuation through long-range with the appropriate phasing of the plan to provide a task for each period within which its implementation period; in 1964, Kent asserted that a master plan document should be able to serves as a view of conveying advises especially by the implementation agencies. He also asserted that a master plan document should also serves as an educational value for those who read it. Roger on his part in 1999 posted that a Master plan document should be able to serves as a vehicle for exploration as its depict many function to the planning staffs; the executives; operating agencies for physical development; voters; politician and the general public at the drafting of the plan and its adoption. Whichever way the function of master plan document is put for, a master plan document gives implementation direction for every development especially in the preparation of zoning ordinances, sub-division control, urban renewal, and the development plan.
IJASBSM | Pg. 113
The Bwari Master Plan DocumentBwari master plan was designed to proffer solution to impending physical development issues of the urban area. These issues includes unavailability of land for development purposes by intending developers, inadequate health facilities for the in habitance of the urban area and the problems of technical and infrastructure inadequacy, lack of pipe borne water; epileptic power supply; most roads are untarred and without drainage channels; physical structures are jumbled together almost without planning input; indiscriminate sitting of uses and misused of land and unavailability of financial institutions except Bwari Aso Saving and Loan Limited which was overstretched and always congested. The master plan document was designed by Molaj Design consultant in collaboration with Frontline Design Associates.
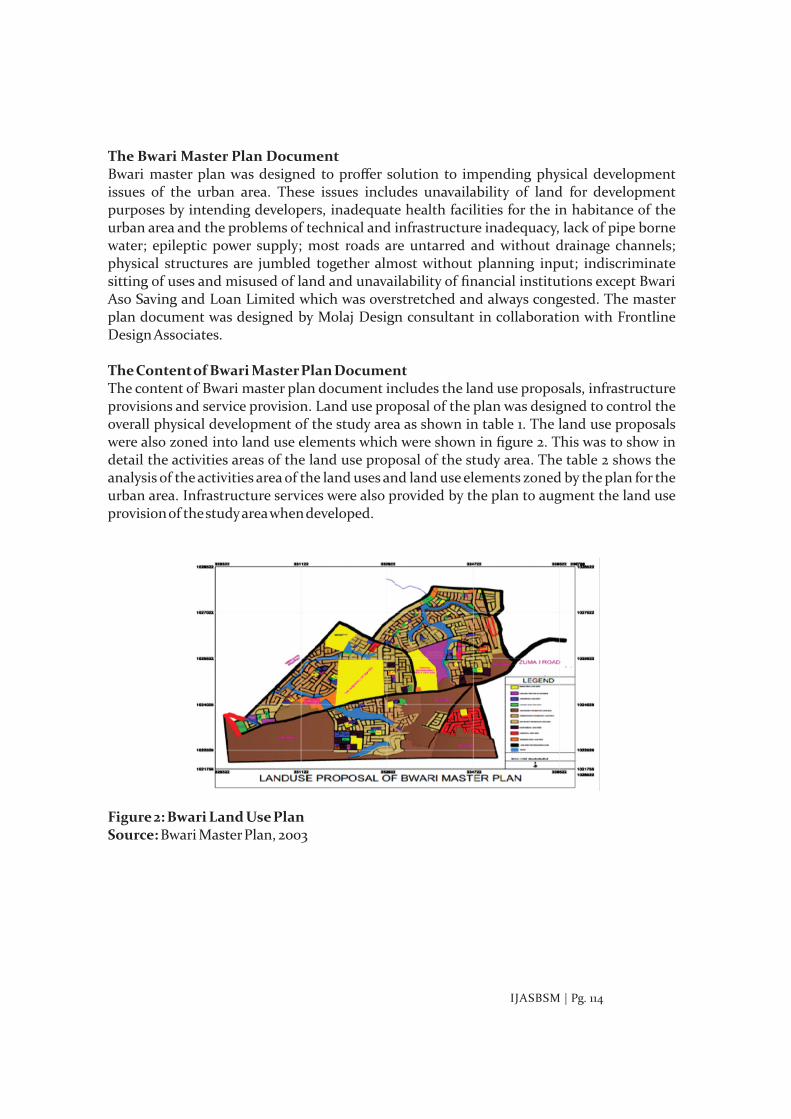
The Content of Bwari Master Plan DocumentThe content of Bwari master plan document includes the land use proposals, infrastructure provisions and service provision. Land use proposal of the plan was designed to control the overall physical development of the study area as shown in table 1. The land use proposals were also zoned into land use elements which were shown in figure 2. This was to show in detail the activities areas of the land use proposal of the study area. The table 2 shows the analysis of the activities area of the land uses and land use elements zoned by the plan for the urban area. Infrastructure services were also provided by the plan to augment the land use provision of the study area when developed.
Figure 2: Bwari Land Use PlanSource: Bwari Master Plan, 2003
IJASBSM | Pg. 114

Table 1: Detail Land Use Proposals of Bwari Master Plan
Proposed Land Uses
Proposed Land use elements Proposed land area coverage in (ha)
Land Use for Residential Density
6460 plots of High income residential Density, 9690 plots of Medium Density
and 13850 plots of
Low Density
residential land uses. Total =30,000
1587.568hafor High income residential, 610.60ha for Medium Density and 305.30ha for Low Density
residential land uses
Total =2503.46ha
Educational land uses
15 plots for Primary school, 25 for Nursery school, 4 for Nursery/primary School
and 2 for Specialized institution. Others include 9 plots for Secondary schools, 4 for Technical/vocational school, 1 for Secondary/technical/vocational
and a University. Total =61
The primary school was proposed to cover 3.75ha, Nursery school for 4.50ha, Nursery/primary School1.75ha while Specialized institution
100ha. Other include Secondary schools4.50ha, Technical/vocational school
2.00ha, Secondary/technical/vocational 0.50ha and the university 160.00ha. Total =277.68ha
Land uses for health services
9 plots for Maternity homes/Health clinics, 6
Health centers, 1 General hospital/Medical centers, 3 Neighborhood hospital, 13 Dispensaries
and 18 plots for Health offices. Total =50
The 9 Maternity homes/Health wereproposed to cover 1.11ha, Health centers1.50ha, 1 General hospital/Medical centers2.01ha, Neighborhood hospital4.11ha, Dispensaries 0.50ha and health offices 5.02ha.
Total =14.25
Socio-cultural land uses
10 plots for Place of worship (6 for Church
and 4 for mosque), 2 Cemeteries (1 for Muslim
and 1 for Christian), 2 Public libraries, 1 Post offices, 4 Community sport center, 1 Stadium, 6 neighborhood parks, 2 Central parks and a Museum. Total =27
The places of worship was proposed to cover 3.2ha (2.36ha for churches and 0.86ha for mosques), cemeteries to cover 1.86ha (1.41 for Christian and 0.45ha for Muslims), public library 0.50ha, post office 0.50ha, Community sport center6.30ha, Stadium 8.03ha, Neighborhood parks9.00ha, Central parks 2.01ha and a Museum 1.00ha. Total =32.42ha
Industrial land uses
31 plots for Large or major industries, 64 for Medium scale industries and 895 plots for Small scale industries. Total =990
The 31 plot for Large or major industries was proposed to cover 37.56ha, 64 Medium scale industries for 48.70ha and 895 plots for Small scale industries to cover 53.70ha. Total =139.96ha
Recreational land uses
3 plots for Children playground, 6 for Organized open spaces, 2 Parking area/space, 1 Playground (adult), 1 Sport complex/game village, 1 African garden, 2 Recreation/open spaces, 1 Organized
open spaces/children Playground, 3 general Public open spaces, 1 District parks
and a Motor parks. Total =22
The 3 plot for Children playground was proposed for 0.84ha, 6 Organized open spaces for 3.28ha, 2 Parking area/spacefor 0.58ha, an adult playground for 0.41ha, a sport complex for 22.37ha, an African garden for 0.22ha, 1 organized open space/children playground for 1.27ha, 3 general Public open spaces for 0.40ha, a district park for 2.24ha and a motor park for 0.95ha. Total =33.93ha
Institutional land uses
34 plots for Administrative institutions, 1 plot
for Traditional institutions, 5 for Judicial institutions and 10 plots for Security/safety institutions. Total =50
The
Administrative institutions plots was proposed to cover 49.22ha, plots for Traditional institutions 0.64ha, plots for Judicial institutions 4.90ha while plots for Security/safety institutions to cover 11.21ha. Total =165.97ha
IJASBSM | Pg. 115

Commercial land uses
23 plots for Shopping centers, 4 for Petrol/filing stations, 3 for Corner’s shops, 3 for Markets, 1 for Local market, 2 for Banks, 1 for each of
Business centers, Commercial centers, Shopping malls
and Departmental store. Total =38
The 23 plots for Shopping centers was proposed to cover 10.00ha, the 4 Petrol/filing stations
for 2.52ha, the 3
Corner’s shops
for 0.42ha, 3 markets for
2.25ha, a local
market for 1.23ha, 2 banks for 1.30ha, a business centers, commercial center, shopping malls and departmental store for 0.71ha, 1.11ha, 0.89ha and 0.41ha respectively. Total =19.54ha
Land use for Road circulation
An Arterial road, 3 Collector road
and 270 of Local access road. The service roads were expected to be developed within each given facility of the urban area.
Total
=274
The arterial road was proposed to cover 22.78ha, collector road to cover 107.04ha while local access road was proposed to cover
672.45ha.
Total =802.27ha
Unorganized open space/vacant land
Unorganized open space/green area and agric/Vacant land
The Unorganized open space/green area and agricultural and Vacant land were proposed to cover 2186.80ha in the study area.
Total 31,512 6455.011
Source: Bwari Master Plan, 2003
Designed Phasing for the Implementation of Bwari Master PlanBwari master plan was designed to undergo twenty (20) years implementation process (2003-2023) as shown in table 2. 2017 supposed to be the last year of the third phase of the implementation process of the plan as shown in the table.
Table 2: Designed Phasing of the Implementation Process of the Plan
Source: Bwari, Master Plan, 2003
Research MethodologyThe Conceptual Framework for the StudyTo achieve the success of this study, the study employed five technical stages. These stages include the reviewing of the proposal of the plan for the urban area; the identification of the proposal of the plan in Bwari urban area; the collection of the land use data on the identified land use proposal in the urban area and the analysis and cross examination of the data collected in the study area with the reviewed data of the master plan document.
Data Required for the Study and Its SourcesAs specified in the scope, the study only focuses on the land use proposals of the master plan. As such, data reviewed in this study was basically on land uses. These data as revealed in table 3 include the types of land uses and land use elements in the study area, their individual
Phases Subjects Timeline Remarks 1st
2nd
3rd
4th
I & II III & IV
V & VI VII, VIII & IX
2004-2008 2009-2013
2014-2017 2018-2023
Implemented ImplementedOn-going implementation stageNot yet implemented
IJASBSM | Pg. 116

number in space and the land area of each individual land use and the land use elements in spaces.
Table 3: Data Required for the Study and Their Sources
Source: Field survey, 2015
Methods of Data CollectionIn the collection of the data, the study area was divided into land uses and land use elements. data on each category of these individual land use element were collected and analyzed before cross examination was carried out to show the extent of its implementation vis-avis the provision of the plan for the urban area.
Survey Instrument Used for Data AcquisitionThree survey instruments were used for data collection in this study. They include satellite imagery, field survey and observation. Satellite imagery was used to obtain raster information from the Google earth. This was to establish the extent of physical development of the study area. The information from this instrument were then digitized and analyzed for the study. Field survey and observation were used to establish the relationship between ground conditions of the land uses and satellite images. This was to obtain information on development extent of the individual land uses and land use elements based on eye witness accounts, coordinates and altitude. This information was obtained through the use of Hand held Global Position System (GPS) and Mobile GPS. The hand held GPS was used to take geographic coordinates of the individual land uses and land use elements while the mobile GPS was used to get instant image of different land uses of the study area.
Figure 3: Satellite Image of Bwari Urban AreaSource: Lansat2015
Data types Data required Sources Primary data
Types of the land uses developed in the study area, the q uantity of the land uses developed and
their
land
use elements in the study area, the land
area
coverage for each
of the land uses and land use elements.
Satellite imagery and reconnaissance surveyInterview with FCDA, BACAGIS, AMMC and STDA
Secondary data
Theoretical review of already made information relevant to
the study.
Bwari master plan, FCT master plan, FCT Regional Development Plan, text books, journals, government official documents and internets.
IJASBSM | Pg. 117
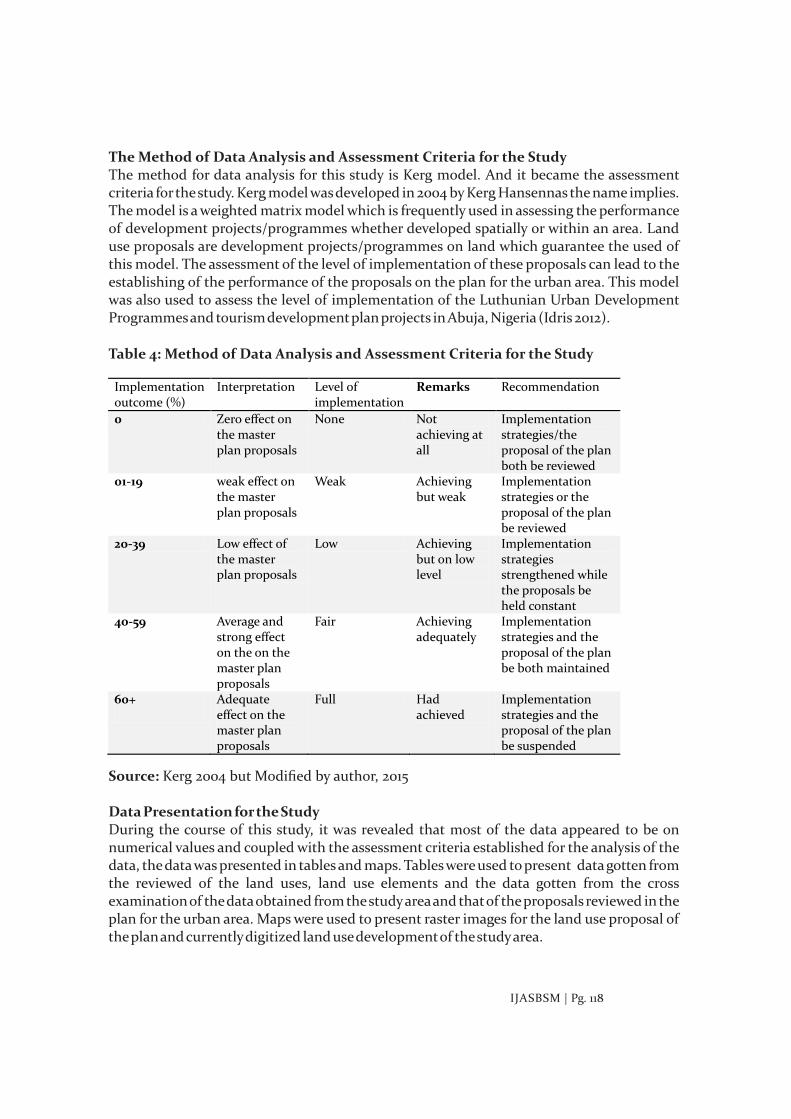
The Method of Data Analysis and Assessment Criteria for the StudyThe method for data analysis for this study is Kerg model. And it became the assessment criteria for the study. Kerg model was developed in 2004 by Kerg Hansennas the name implies. The model is a weighted matrix model which is frequently used in assessing the performance of development projects/programmes whether developed spatially or within an area. Land use proposals are development projects/programmes on land which guarantee the used of this model. The assessment of the level of implementation of these proposals can lead to the establishing of the performance of the proposals on the plan for the urban area. This model was also used to assess the level of implementation of the Luthunian Urban Development Programmes and tourism development plan projects in Abuja, Nigeria (Idris 2012).
Table 4: Method of Data Analysis and Assessment Criteria for the Study
Source: Kerg 2004 but Modified by author, 2015
Data Presentation for the StudyDuring the course of this study, it was revealed that most of the data appeared to be on numerical values and coupled with the assessment criteria established for the analysis of the data, the data was presented in tables and maps. Tables were used to present data gotten from the reviewed of the land uses, land use elements and the data gotten from the cross examination of the data obtained from the study area and that of the proposals reviewed in the plan for the urban area. Maps were used to present raster images for the land use proposal of the plan and currently digitized land use development of the study area.
Implementation outcome (%)
Interpretation Level of implementation
Remarks Recommendation
0
Zero effect on the master plan proposals
None
Not achieving at all
Implementation strategies/the proposal of the plan both be reviewed
01-19
weak effect on the master plan proposals
Weak
Achieving but weak
Implementation strategies or the proposal of the plan be reviewed
20-39
Low effect of the master plan proposals
Low
Achieving but on low level
Implementation strategies strengthened while the proposals beheld constant
40-59
Average and strong effect on the on the master plan proposals
Fair
Achieving adequately
Implementation strategies and the proposal of the plan be both maintained
60+ Adequate effect on the master plan proposals
Full Had achieved
Implementation strategies and the proposal of the plan be suspended
IJASBSM | Pg. 118

Data Analysis and PresentationThe Land Use Development of Bwari Urban AreaAt the end of the assessment, it was revealed in figure 4 and table 5 that Bwari land use development comprises of 17975 residential uses, 30 commercial uses, 28 educational uses, 22 land uses for health services, 16 public/institutional uses, 268 industrial uses, and 21 land use for socio-cultural services. Others include there is no recreational land uses in the study area, rather there are 11 land use for hospitality industry and 67 land use for road circulation. However, open spaces which are meant for future implementation tend dominated most parts of the study area as some of the proposal has not been developed in the study area. This was revealed in figure 4 and table 5
Figure 4: Existing Land Use Development of Bwari Urban AreaSources: Field Survey, 2014
Table 5: Existing Land Use Development of Bwari Urban Area
Land Uses Existing Land Use Elements
in the Study
Area
Level of Development in (ha)
Existing
Residential Land Uses
1471 of Low
income
residential density, 3519 of Medium residential density and 12985 of High income residential density. Total = 17975
Low
income
residential density 147.93ha,
Medium residential density 211.20ha while High income residential density 210.37ha. Total =569.50ha
Educational Land Uses
5 Primary schools, 12 Nursery schools 3 Nursery/primary Schools, no Specialized institution, 7 Secondary schools, no Technical/vocational school, no Secondary/technical/vocational but there a University. Total =28
Primary schools 1.40ha, Nursery schools 0.96ha, Nursery/primary Schools combined 0.00ha, Specialized institution0.00ha, Secondary schools 2.30ha, Technical/vocational school 0.00ha, Secondary/technical/vocationalcombined 0.00ha and a University102.49ha. Total =108.10ha
IJASBSM | Pg. 119

Land Uses for Health Services
4 Maternity homes/Health clinics, 5
Health centers, a General hospital/Medical centers, 3 Neighborhood hospital, 13 Dispensaries
and 18 Health offices.
Total =22
Maternity homes/Health clinics0.67ha,Health centers
0.46ha, the
General hospital/Medical centers1.61ha, Neighborhood hospital 3.23ha, Dispensaries0.24ha and Health offices 0.20ha. Total =8.87ha
Socio-cultural Land Uses
17 Places
of worship, 2 Cemeteries, 1 Public libraries, 1 Post office, no of either Community sport center, Stadium, Neighborhood parks, Central parks
or Museum. Total =21
Places
of worship
5.06ha, Cemeteries3.17ha, Public libraries
0.23ha, Post office0.13ha, Community sport center, Stadium, Neighborhood parks, Central parks
or Museum has 0.00ha each as none of them was found in the study area. Total =8.59ha
Industrial Land Uses
4 Large scale or major industries, 26
Medium scale industries
and 238 Small scale industries. Total =268
Large scale or major industries 6.05ha, Medium scale industries6.92ha and Small scale industries 14.27ha. Total =27.24ha
Recreational Land Uses
None of the land use elements
that constitutes recreational
land use was found in the study area. As such, the land use has 0 of the land use elements in the study area. Total =0
None of these elements was found in the study area. As such each of them cover 0.00ha in the study area. Total = 0.00ha
Institutional Land Uses
4 Administrative institutions, 1 Traditional institutions, 5 Judicial institutions
and 6 Security/safety institutions. Total =16
Administrative institutions 115.95ha, Traditional institutions
0.47ha, Judicial institutions4.01ha and Security/safety institutions
5.30ha.Total =125.73ha
Commercial Land Uses
7 Shopping centers, 3 Petrol/filing stations, 2 Corner’s shops, 3 Markets, 5 Commercial Banks, 6 Business centers, 2 of either Commercial centers or Shopping malls. Total =30
Shopping centers 2.94ha, Petrol/filing stations 0.95ha, Corner’s shops 0.16ha, Markets 2.05ha, Commercial Banks 3.90ha, Business centers 0.67ha, Commercial centers 2.01ha and Shopping malls 1.57ha. Total =14.25ha
Land Use for Road Circulation
An arterial road, 3 Collector roads and 63 Local access roads.
Total
=67
The arterial road cover 21.09ha, Collector roads 102.84ha and Local access roads111.96ha.
Total =235.89ha
111.96
IJASBSM | Pg. 120

Unorganized open space/vacant land
Unorganized open space/green area and agricultural/Vacant land
The existing Unorganized open space/green area and agricultural/Vacant land
cover 5356.16ha
Total 18,413 6455.011ha
Source: Field survey, 2015
The Assessment of the Implementation of the Land UsesIn the assessment of the implementation of the land uses, the study assumes that any plot that is developed is also implemented because there can be no development on land without a plot and any plot developed in the study area must have passed through approval by the agencies responsible for physical development of the area. And it is also obvious that any plot of land developed has an effect in the proposal of the plan. It is curtained that all lands in the FCT has been geo-referenced by the Abuja Geographic Information System (AGIS) which makes monitory and subsequent supervision of development by the FCDA easier without compromise. FCDA is the pioneer agency responsible for overseeing effective physical development of the study area. Notwithstanding, the assessment was done through the use of the criteria below.
Κ =Σ x/n*100
Implementation of Land Uses for Residential DensityDuring the assessment, the study which is revealed in table 6 shows that despite that the master plan is in its third phase of implementation, the level of implementation of the residential uses is low indicating that the land use could attend full implementation if the pace at which the implementation of the plan is maintain. Though, this level of performance was affected by low residential land use element which has weak level of implementation. The land use element has an implementation outcome of 9.32% indicating that the implementation level is weak. The medium income residential land use element has low level of implementation but however, the land use element can attend full implementation if the pace of the implementation of the land use element is maintained into the last phase of the plan's implementation.
Table 6: Implementation of the Land Area for Residential Density
Source: Field Survey, 2015
Land use elements Proposed Land Area in (ha)
Existing Land Area Implemented in (ha)
Implementation Outcome in (%)
Implementation Level
High residential Density
305.30
210.37
68.90
Full
Medium residential density
610.60
211.20
34.58
Low
Low residential density
1587.57
147.93
9.32
Weak
Total 2503.47 569.50 22.75 Low
IJASBSM | Pg. 121
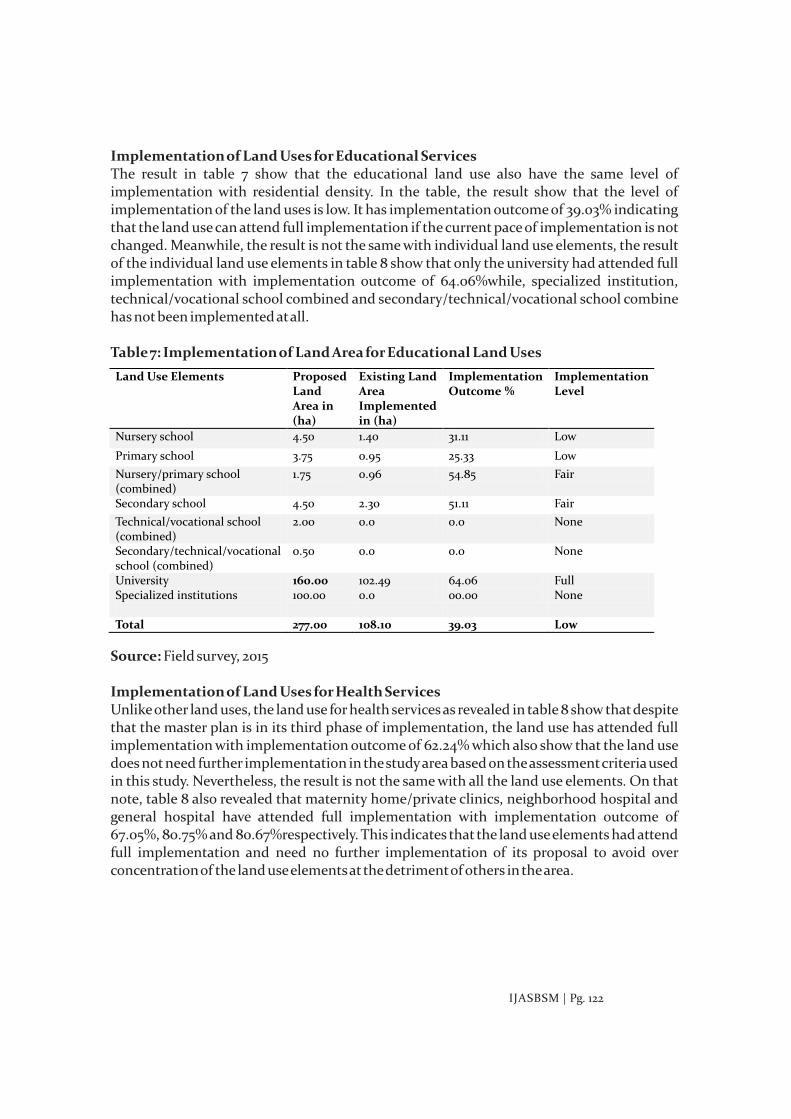
Implementation of Land Uses for Educational ServicesThe result in table 7 show that the educational land use also have the same level of implementation with residential density. In the table, the result show that the level of implementation of the land uses is low. It has implementation outcome of 39.03% indicating that the land use can attend full implementation if the current pace of implementation is not changed. Meanwhile, the result is not the same with individual land use elements, the result of the individual land use elements in table 8 show that only the university had attended full implementation with implementation outcome of 64.06%while, specialized institution, technical/vocational school combined and secondary/technical/vocational school combine has not been implemented at all.
Table 7: Implementation of Land Area for Educational Land Uses
Source: Field survey, 2015
Implementation of Land Uses for Health ServicesUnlike other land uses, the land use for health services as revealed in table 8 show that despite that the master plan is in its third phase of implementation, the land use has attended full implementation with implementation outcome of 62.24% which also show that the land use does not need further implementation in the study area based on the assessment criteria used in this study. Nevertheless, the result is not the same with all the land use elements. On that note, table 8 also revealed that maternity home/private clinics, neighborhood hospital and general hospital have attended full implementation with implementation outcome of 67.05%, 80.75% and 80.67%respectively. This indicates that the land use elements had attend full implementation and need no further implementation of its proposal to avoid over concentration of the land use elements at the detriment of others in the area.
Land Use Elements Proposed Land Area in (ha)
Existing Land Area Implemented
in
(ha)
Implementation Outcome %
ImplementationLevel
Nursery school
4.50
1.40
31.11
Low
Primary school
3.75
0.95
25.33
Low
Nursery/primary school (combined)
1.75
0.96
54.85
Fair
Secondary school
4.50
2.30
51.11
Fair
Technical/vocational school (combined)
2.00
0.0
0.0
None
Secondary/technical/vocational school (combined)
0.50
0.0
0.0
None
University
Specialized institutions
160.00
100.00
102.49
0.0
64.06
00.00
FullNone
Total 277.00 108.10 39.03 Low
IJASBSM | Pg. 122
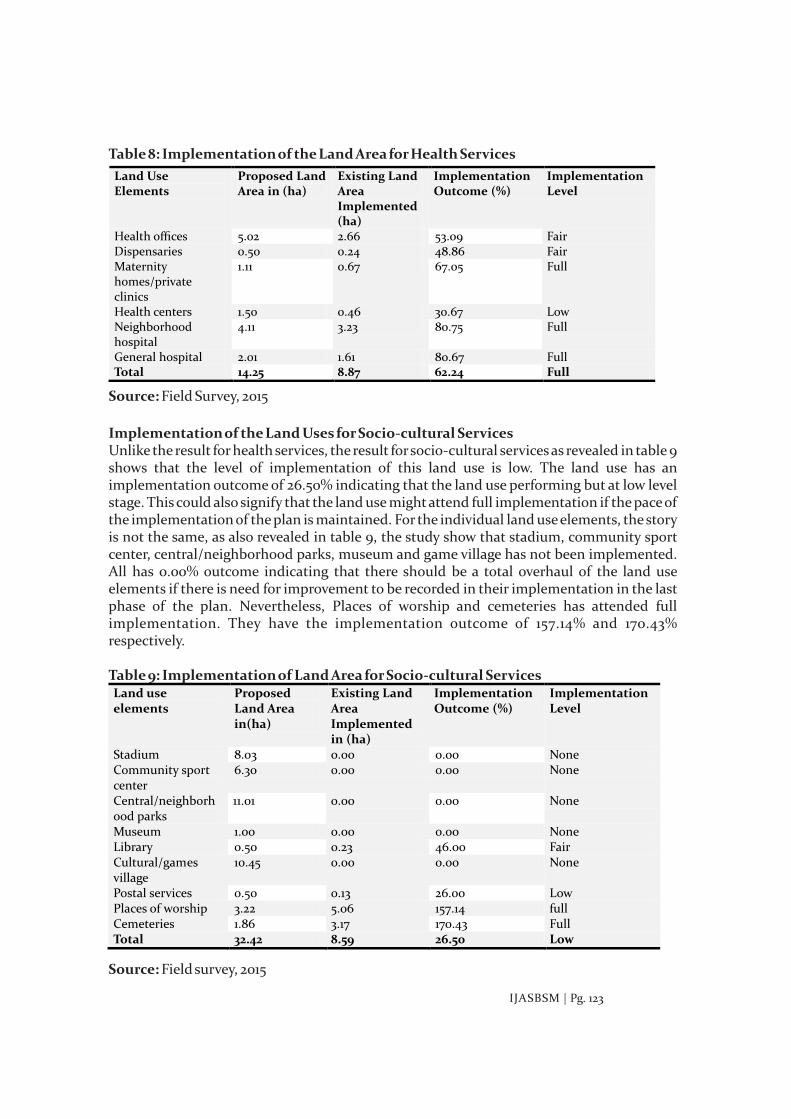
Table 8: Implementation of the Land Area for Health Services
Source: Field Survey, 2015
Implementation of the Land Uses for Socio-cultural ServicesUnlike the result for health services, the result for socio-cultural services as revealed in table 9 shows that the level of implementation of this land use is low. The land use has an implementation outcome of 26.50% indicating that the land use performing but at low level stage. This could also signify that the land use might attend full implementation if the pace of the implementation of the plan is maintained. For the individual land use elements, the story is not the same, as also revealed in table 9, the study show that stadium, community sport center, central/neighborhood parks, museum and game village has not been implemented. All has 0.00% outcome indicating that there should be a total overhaul of the land use elements if there is need for improvement to be recorded in their implementation in the last phase of the plan. Nevertheless, Places of worship and cemeteries has attended full implementation. They have the implementation outcome of 157.14% and 170.43% respectively.
Table 9: Implementation of Land Area for Socio-cultural Services
Source: Field survey, 2015
Land Use Elements
Proposed Land Area in (ha)
Existing Land Area Implemented (ha)
Implementation Outcome (%)
Implementation Level
Health offices
5.02
2.66
53.09
Fair
Dispensaries
0.50
0.24
48.86
FairMaternity homes/private clinics
1.11
0.67
67.05
Full
Health centers
1.50
0.46
30.67
Low Neighborhood hospital
4.11
3.23
80.75
Full
General hospital 2.01 1.61 80.67 FullTotal 14.25 8.87 62.24 Full
Land use elements
Proposed Land Area in(ha)
Existing Land Area Implemented in (ha)
Implementation Outcome (%)
ImplementationLevel
Stadium
8.03
0.00
0.00
None
Community sport center
6.30
0.00
0.00
None
Central/neighborhood parks
11.01
0.00
0.00
None
Museum
1.00
0.00
0.00
None Library
0.50
0.23
46.00
Fair Cultural/games village
10.45
0.00
0.00
None
Postal services
0.50
0.13
26.00
Low Places of worship 3.22 5.06 157.14 fullCemeteries 1.86 3.17 170.43 FullTotal 32.42 8.59 26.50 Low
IJASBSM | Pg. 123

Implementation of Land Uses for Industrial ServicesIn the case of industrial land use, the result is worse compared to other land use revealed above. The result for industrial services as revealed in table 10 shows that the land use has weak level of implementation. The land use has implementation outcome of 19.46% which indicates that the level of implementation is not encouraging bearing the present stage of the plan's implementation phase. This level of performance call for immediate action to improve in the level of implementation of the land use. In the case of the individual land uses, the result in the table also revealed that small scale and medium scale industrial land use elements has also weak level of implementation despite the current implementation phase of the plan. This indicates that the land use elements might not attend full implementation if nothing is done on either their proposal or the implementation strategies use in the implementation of the land use elements.
Table 10: Implementation of Land Area for Industrial Services
Source: Field survey, 2015
Implementation of Land Uses for Public InstitutionsFor institutional land use, though the study revealed in table 11 that the land use has attended full implementation, the land use only covered 27.07% of the overall land use element proposed by the plan for the urban area. This indicates that only few of the land use elements proposed has been implemented and the implemented land use elements commands the largest land area of the land use proposed by the plan. However, the level of implementation also indicates that the land use needs no further implementation to avoid over concentration of the land use over other. Notwithstanding, the performance of the individual land use elements seems to be the same, except for security and safety institution which has fair level of implementation. The land use element has an implementation outcome of 50.45% indicating that the level of implementation is adequate considering the current implementation phase of the plan.
Land use elements Proposed Land Area in
(ha)
Existing Land Area Implemented in (ha)
Implementation Outcome in (%)
ImplementationLevel
Small scale industrial land uses
53.70
6.05
11.26
Weak
Medium scale industrial land uses
48.70
6.92
14.21
Weak
Large scale industrial land uses
37.56
14.27
37.99
Low
Total 139.96 27.24 19.46 Weak
IJASBSM | Pg. 124

Table 11: Implementation of Land Area for Public Institutions
Source: Field Survey, 2015
Implementation of Commercial Land UsesFor commercial land use, the study excluded the land use elements for informalities because there was no land provided for the uses by the plan for the urban area. Nevertheless, the study revealed in table 12 that the land use has attended full implementation and needed no further implementation of its proposals in the study area. The land use has an implementation outcome of 72.93%. As in the case of individual land use elements, the study also show that commercial banks, specialized market, business centers, commercial centers, shopping malls and petrol/filing station has attended full implementation with only shopping centers with low level of implementation with implementation outcome of 28.11%. The land use element with low level of implementation indicates that the land use element can still attend full implementation considering the current phase of the plan's implementation. That is when the present pace of the implementation of the plan is maintained.
Table 12: Implementation of Land Area for Commercial Land Uses
Source: Field survey, 2015
Land use elements Proposed Land Area in (ha)
Existing Land Area
Implemented in (ha)
Implementation Outcome in (%)
ImplementationLevel
Administrative institutions
149.18
115.77
77.60
Full
Judicial institution
4.90
4.03
82.24
Full Traditional institution
0.64
0.47
73.43
Full Security/safety institution
10.50
5.30
50.47
Fair
Total 165.97 125.73 75.75 Full
Land Use Elements
Total Land Area Proposed (ha)
Total Land Area Implemented (ha)
Implementation outcome (%)
Implementation Level
Commercial Banks
1.30
3.90
300
Full
Specialized market
3.48
2.05
91.22
Full
Business centers
0.71
0.67
95.77
Full Shopping centers
10.00
2.94
28.11
Low Commercial center
1.11
2.01
180.00
Full
Shopping malls
0.89
1.57
176.41
Full Petrol station
2.52
0.95
87.21
FullDepartmental store
0.41
0.0
0.0
None
Corner’s shop 0.42 0.16 38.69 Fair Total 19.54 14.25 72.93 Full
IJASBSM | Pg. 125

Implementation of Land Uses for Road CirculationThe result for road circulation as revealed in table 13 show that the level of implementation is low. This indicates that the land use can attend full implementation if the pace of its implementation is maintained. Though, arterial and collector roads has attended full implementation, the bulk of the remaining implementation is on the local access road when the implementation is controlled by the rate of housing development of the urban area. The continued implementation of the local access road in the last phase of the plan implementation can guarantee full level of implementation of the land use for road circulation.
Table 13: Implementation of Land Area for Road Circulation
Source: Field survey, 2015
The Overall Level of Implementation of the Land Uses of the PlanAt the end of the study, the result revealed in table 14 show that the overall level of implementation of the plan is weak. Considering the current phase of the plan's implementation, the performance of the implementation is not encouraging. This implementation stage indicates that the land use proposal of the master plan might not attend full implementation if the present pace of implementation is maintained. This can also be buttressed by the performance of the implementation of the individual land uses revealed in table 14. The table revealed that among the land uses revealed, none of the land uses has attended full implementation. All have either none, low and weak performance with only public institution and education that has fair level of implementation. Though this may seem encouraging because they can attend full implementation at least before the last implementation stage expired. But for others, it is doubtful especially the recreational land use that has not experienced any form of implementation since the adoption of the plan.
Land Use Elements
Proposed Land Area in (ha)
Existing Land Area Implemented in (ha)
Implementation Outcome (%)
ImplementationLevel
Arterial roads 22.78
21.09
92.56
Full
Collector’s roads
107.04
102.84
96.08
Full
Local access roads
672.45
111.96
16.65
Weak
Total 802.27 235.89 29.40 Low
IJASBSM | Pg. 126
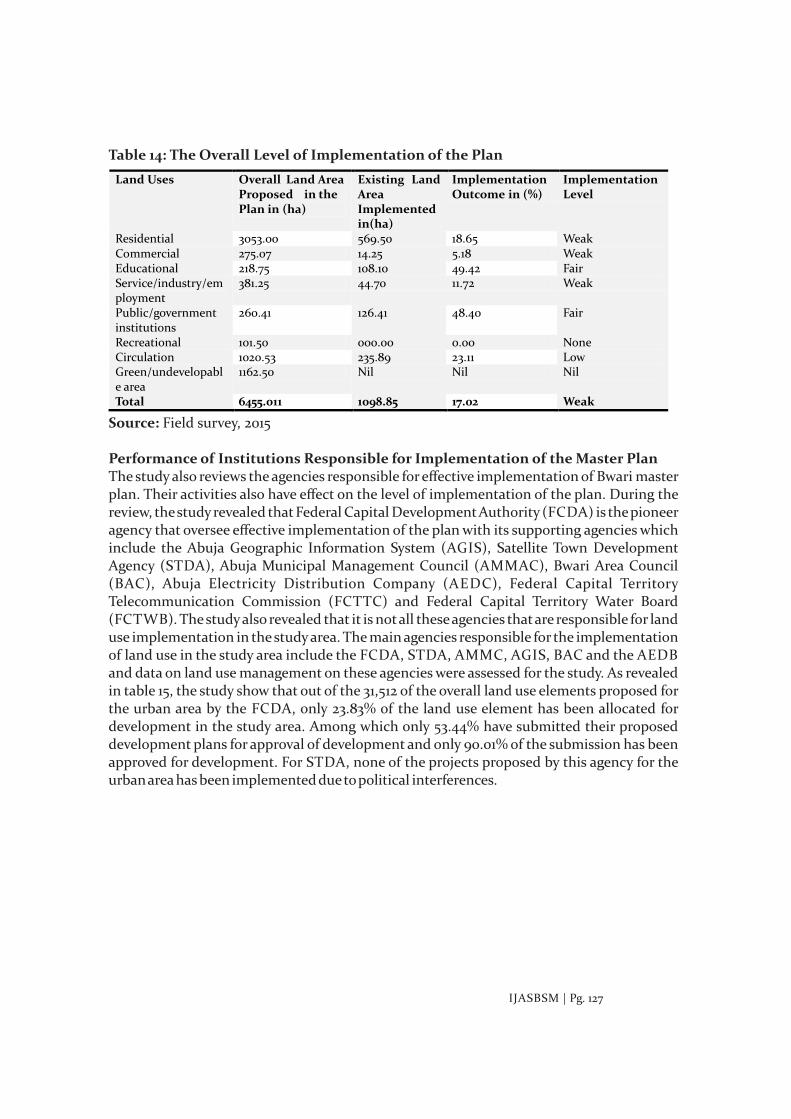
Table 14: The Overall Level of Implementation of the Plan
Source: Field survey, 2015
Performance of Institutions Responsible for Implementation of the Master PlanThe study also reviews the agencies responsible for effective implementation of Bwari master plan. Their activities also have effect on the level of implementation of the plan. During the review, the study revealed that Federal Capital Development Authority (FCDA) is the pioneer agency that oversee effective implementation of the plan with its supporting agencies which include the Abuja Geographic Information System (AGIS), Satellite Town Development Agency (STDA), Abuja Municipal Management Council (AMMAC), Bwari Area Council (BAC), Abuja Electricity Distribution Company (AEDC), Federal Capital Territory Telecommunication Commission (FCTTC) and Federal Capital Territory Water Board (FCTWB). The study also revealed that it is not all these agencies that are responsible for land use implementation in the study area. The main agencies responsible for the implementation of land use in the study area include the FCDA, STDA, AMMC, AGIS, BAC and the AEDB and data on land use management on these agencies were assessed for the study. As revealed in table 15, the study show that out of the 31,512 of the overall land use elements proposed for the urban area by the FCDA, only 23.83% of the land use element has been allocated for development in the study area. Among which only 53.44% have submitted their proposed development plans for approval of development and only 90.01% of the submission has been approved for development. For STDA, none of the projects proposed by this agency for the urban area has been implemented due to political interferences.
Land Uses Overall Land Area Proposed in the Plan in (ha)
Existing Land Area Implemented
in(ha)
Implementation Outcome in (%)
ImplementationLevel
Residential
3053.00
569.50
18.65
Weak Commercial
275.07
14.25
5.18
Weak Educational
218.75
108.10
49.42
Fair Service/industry/employment
381.25
44.70
11.72
Weak
Public/government institutions
260.41
126.41
48.40
Fair
Recreational
101.50
000.00
0.00
None Circulation
1020.53
235.89
23.11
Low Green/undevelopable area
1162.50
Nil
Nil
Nil
Total 6455.011 1098.85 17.02 Weak
IJASBSM | Pg. 127

Table 15: Performance of Institutions Responsible for Implementation of Bwari Master Plan
Source: Field survey, 2015
Explanatory Factors Responsible for the Implementation Level of the Plan
1) There is high bureaucratic nature in land allocation, acquisition and distribution.
2) There is always high political interferences in the Land Allocation
3) There is always the issues of non-approval of Budget for Proposed development
Projects by National Assembly
4) There is also the issue of not adherence to the professional standards or ethic by
professional bodies in the allocation of land resources in the urban area.
5) There is the issues of over concentration of the implemented land uses in the
customary or high density residential areas where no conscious planning regulations
is applied during implementation of the land uses.
6) There is no involvement of Public Private Partnership arrangement in the
development of commercial land uses as proposed by the plan for urban area.
7) There are the issues of absent of basic infrastructures facilities such as roads,
electricity and water supply especially for the development of industrial sector.
8) There has low demand especially for citing of the public institutional as proposed by
the plan for the urban area.
9) There is none approval of budget especially for the implementation of the
recreational land use elements in the study area.
10) There is slow rate of urban expansion that led to the low level of implementation
of land use for road circulation.
Public institutions
Performance of the institutions for Land use development of the urban area
FCDA
It’s
responsible for the 31,512 of the land use el ements proposed by the
plan but 23.83%
of the land use elements have been allocated for
development among which only 53.44% have submitted their plans for approval of development and only 90.01% of the submission have been approved
STDA
None of the project proposed by this agency had been imp lemented in urban area
AMMC
The study revealed that controversial structures have been mark for demolition but no action was made on them because of the political interferences in the urban area.
AGIS
The study revealed that all the land use plots propo sed of the plan has been computerized as the cadastral and land registry of the FCT.
BAC
The area council has been the institutions responsible for the provision some of health, educational recreational services of the urban area. Others include the services of solid and liquid waste management of the urban area.
IJASBSM | Pg. 128
Conclusion and RecommendationsConclusionAt the end of the assessment, the study revealed that the level of implementation of the plan is weak. This indicates that the land use proposal might not attend full implementation if the present pace of its implementation is maintained. And if improvement must be recorded in the implementation level of the plan before the last implementation phase of the plan expire in 2023, the following recommendation must be made and followed suit.
RecommendationsBased on the established facts of this study, the following recommendations were given;
1) There should be adherence to professional ethics and standard by professional bodies
in the discharge of their duties of physical development in the urban area
1) There should be frequent approval of budgetary allocation for the agencies
responsible for implementation of the master plan for the urban area.
2) Government should create an enabling environment for public private partnership
involvement in the implementation of land use projects and programmes.
3) BAC and the FCDA should develop site and service schemes area in the urban area to
attract development of the land uses in the urban area.
4) Bwari Area Council should step up to the quest for the development of recreational
sector of the urban area through their budgetary allocation and other subventions.
5) The FCDA should relocate some of the institutional land uses of the FCC to Bwari
urban area to decongest the city center and to also improve in the development of
Bwari urban area.
6) Government should consciously introduce physical planning regulation for the
indigenous or customary land area.
IJASBSM | Pg. 129

ReferencesBaer, W. (1997). General Plan Evaluation Criteria. Journal of the American Planning
Association, 63 (3), 329-344
Black, A. (1975). The Comprehensive Plan, in the Comprehensive Planning Process: Several Views. Massachusetts: American Institutes of Planners.
Doxiadis Associates (1983). Regional Development Plan for Federal Capital Territory, Abuja, Nigeria
Greene, T. M. (1973). The Arts and the Art of Criticism. New York: Gordian, p.369.
Iliasu, I. (2012). Assessment of the Implementation of Abuja Tourism Master Plan. Unpublished thesis, URP Department, A.B.U. Zaria
International Planning Associates (1979). The Abuja Master Plan. Federal Republic of Nigeria.
Kent, T. J. (1964). The Urban General Plan. San Francisco: Chandler Publishing Co.
Kerg, H. (2004). Application of Weighted Metrix Models in Assessing the Implementation of Spatial Projects. Case Study of Luthunian Urban Development Programmes. Journal of planning Literature, 16 (2), 384-412.
Keunta, K. (2010). An Assessment of the Impact of Form‐Based Code and Conventional Zoning on Fort McPherson Redevelopment. M.sc Thesis, School of City and Regional Planning, Georgia Institute of Technology, U.S.A
Molaj and Frontline (2003). Master Plan for Bwari Satellite Town. FCT, Abuja- Nigeria
Obetaru, W. (2003). Towards a successful implementation of development plan. Journal of Environmental science, university of Ibadan, III, 34
Roger, A. R. (1999). Planning for Performance: Developing Programmes that Produced Result. Cooperative Extension Services, University of Kentucky
IJASBSM | Pg. 130