Embed Size (px)
Citation preview
Water Resour ManageDOI 10.1007/s11269-006-9075-6
ORIGINAL ARTICLE
Assessment of the levels of coastal marine pollution ofChennai city, Southern India
Palanisamy Shanmugam · S. Neelamani ·Yu-Hwan Ahn · Ligy Philip · Gi-Hoon Hong
Received: 7 December 2005 / Accepted: 9 June 2006C© Springer Science + Business Media B.V. 2006
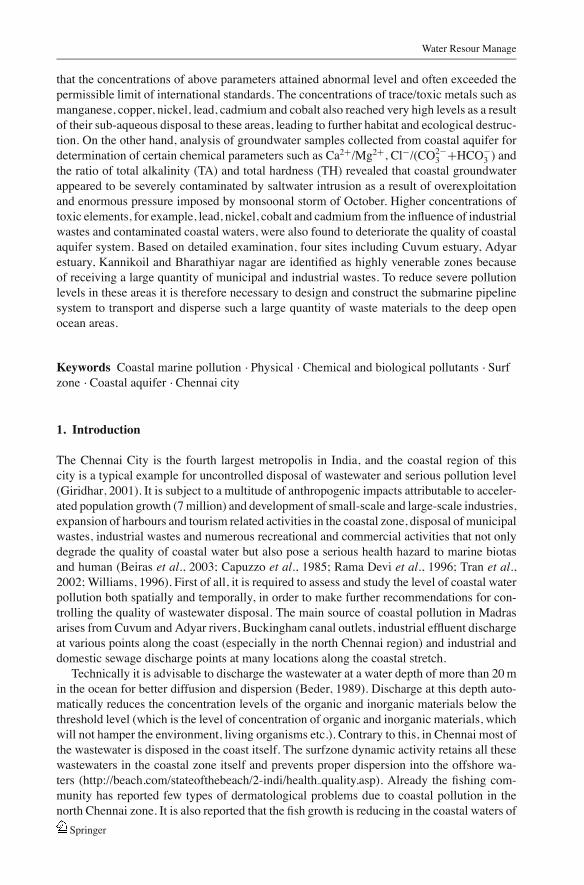
Abstract The levels of hydrological pollution of Chennai coastal zone in the southeasternpart of India have been increased in the recent years by an uncontrolled disposal of wastewaterand pollutants due to human activities. This study gave a special emphasis on the determi-nation of the levels of pollution, the identification of vulnerable zones and providing someprobable remedial measures for severely impacted coastal zone of Chennai city. During theperiod from September to November 2002, sampling was carried out along the shore in twotraverses running in the seaside (surf zone) and landside (coastal aquifer). When sampling ef-forts took place the middle of the above period experienced a monsoonal storm over Chennaicoast that significantly influenced large variations in the pollution level at both traverses in sea-side and landside. Analysis of physical, chemical and biological parameter determinationsindicated that the concentrations of dissolved oxygen (DO), biochemical oxygen demand(BOD), chemical oxygen demand (COD), nutrients (nitrate, nitrite and phosphate), turbidity,maximum probable number (MPN) and chlorophyll a (Chl a) reached notably high levels atall sample locations before monsoonal storm prevailed over these areas during October 2002,which resulted in large fresh water input to the coastal system reducing the levels of pollutionto some extent. Analysis of water samples collected during November apparently indicated
Current address: P. Shanmugam, Korea Ocean Research and Development Institute, Ansan P.O. Box 29,Seoul, 425-600, Korea
P. Shanmugam ( ) · Y.-H. AhnOcean Satellite Research Group, Korea Ocean Research and Development Institute, AnsanP. O. Box 29, Seoul 425-600, Koreae-mails: [email protected], [email protected]
S. NeelamaniDepartment of Ocean Engineering, Indian Institute of Technology, Chennai 600 036, India
L. PhilipDepartment of Civil Engineering, Indian Institute of Technology, Chennai- 600 036, India
G.-H. HongChemical Oceanography Division, Korea Ocean Research and Development Institute, Ansan P.O. Box29, Seoul 425-600, Korea
Springer
Water Resour Manage
that the concentrations of above parameters attained abnormal level and often exceeded thepermissible limit of international standards. The concentrations of trace/toxic metals such asmanganese, copper, nickel, lead, cadmium and cobalt also reached very high levels as a resultof their sub-aqueous disposal to these areas, leading to further habitat and ecological destruc-tion. On the other hand, analysis of groundwater samples collected from coastal aquifer fordetermination of certain chemical parameters such as Ca2+/Mg2+, Cl−/(CO2−
3 +HCO−3 ) and
the ratio of total alkalinity (TA) and total hardness (TH) revealed that coastal groundwaterappeared to be severely contaminated by saltwater intrusion as a result of overexploitationand enormous pressure imposed by monsoonal storm of October. Higher concentrations oftoxic elements, for example, lead, nickel, cobalt and cadmium from the influence of industrialwastes and contaminated coastal waters, were also found to deteriorate the quality of coastalaquifer system. Based on detailed examination, four sites including Cuvum estuary, Adyarestuary, Kannikoil and Bharathiyar nagar are identified as highly venerable zones becauseof receiving a large quantity of municipal and industrial wastes. To reduce severe pollutionlevels in these areas it is therefore necessary to design and construct the submarine pipelinesystem to transport and disperse such a large quantity of waste materials to the deep openocean areas.
Keywords Coastal marine pollution . Physical . Chemical and biological pollutants . Surfzone . Coastal aquifer . Chennai city
1. Introduction
The Chennai City is the fourth largest metropolis in India, and the coastal region of thiscity is a typical example for uncontrolled disposal of wastewater and serious pollution level(Giridhar, 2001). It is subject to a multitude of anthropogenic impacts attributable to acceler-ated population growth (7 million) and development of small-scale and large-scale industries,expansion of harbours and tourism related activities in the coastal zone, disposal of municipalwastes, industrial wastes and numerous recreational and commercial activities that not onlydegrade the quality of coastal water but also pose a serious health hazard to marine biotasand human (Beiras et al., 2003; Capuzzo et al., 1985; Rama Devi et al., 1996; Tran et al.,2002; Williams, 1996). First of all, it is required to assess and study the level of coastal waterpollution both spatially and temporally, in order to make further recommendations for con-trolling the quality of wastewater disposal. The main source of coastal pollution in Madrasarises from Cuvum and Adyar rivers, Buckingham canal outlets, industrial effluent dischargeat various points along the coast (especially in the north Chennai region) and industrial anddomestic sewage discharge points at many locations along the coastal stretch.
Technically it is advisable to discharge the wastewater at a water depth of more than 20 min the ocean for better diffusion and dispersion (Beder, 1989). Discharge at this depth auto-matically reduces the concentration levels of the organic and inorganic materials below thethreshold level (which is the level of concentration of organic and inorganic materials, whichwill not hamper the environment, living organisms etc.). Contrary to this, in Chennai most ofthe wastewater is disposed in the coast itself. The surfzone dynamic activity retains all thesewastewaters in the coastal zone itself and prevents proper dispersion into the offshore wa-ters (http://beach.com/stateofthebeach/2-indi/health quality.asp). Already the fishing com-munity has reported few types of dermatological problems due to coastal pollution in thenorth Chennai zone. It is also reported that the fish growth is reducing in the coastal waters of
Springer
Water Resour Manage
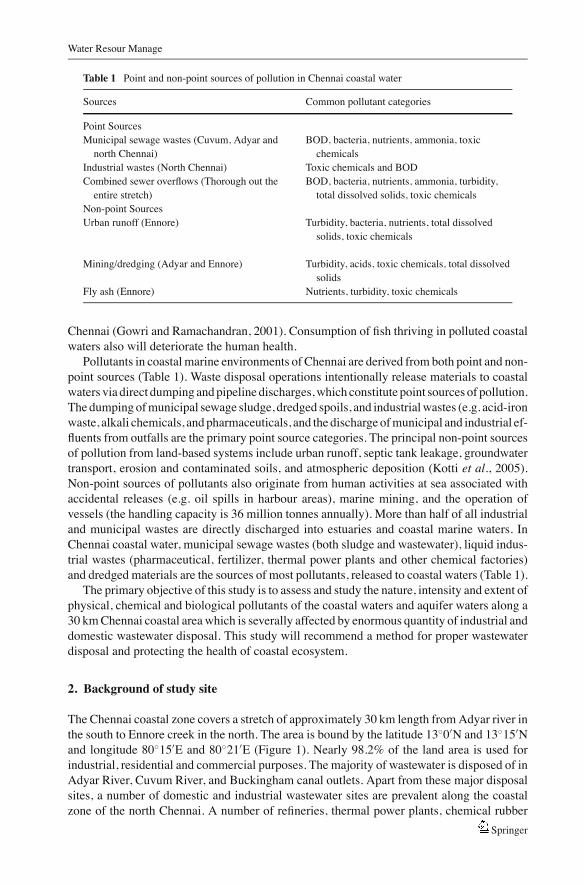
Table 1 Point and non-point sources of pollution in Chennai coastal water
Sources Common pollutant categories
Point SourcesMunicipal sewage wastes (Cuvum, Adyar and
north Chennai)BOD, bacteria, nutrients, ammonia, toxic
chemicalsIndustrial wastes (North Chennai) Toxic chemicals and BODCombined sewer overflows (Thorough out the
entire stretch)BOD, bacteria, nutrients, ammonia, turbidity,
total dissolved solids, toxic chemicalsNon-point SourcesUrban runoff (Ennore) Turbidity, bacteria, nutrients, total dissolved
solids, toxic chemicals
Mining/dredging (Adyar and Ennore) Turbidity, acids, toxic chemicals, total dissolvedsolids
Fly ash (Ennore) Nutrients, turbidity, toxic chemicals
Chennai (Gowri and Ramachandran, 2001). Consumption of fish thriving in polluted coastalwaters also will deteriorate the human health.
Pollutants in coastal marine environments of Chennai are derived from both point and non-point sources (Table 1). Waste disposal operations intentionally release materials to coastalwaters via direct dumping and pipeline discharges, which constitute point sources of pollution.The dumping of municipal sewage sludge, dredged spoils, and industrial wastes (e.g. acid-ironwaste, alkali chemicals, and pharmaceuticals, and the discharge of municipal and industrial ef-fluents from outfalls are the primary point source categories. The principal non-point sourcesof pollution from land-based systems include urban runoff, septic tank leakage, groundwatertransport, erosion and contaminated soils, and atmospheric deposition (Kotti et al., 2005).Non-point sources of pollutants also originate from human activities at sea associated withaccidental releases (e.g. oil spills in harbour areas), marine mining, and the operation ofvessels (the handling capacity is 36 million tonnes annually). More than half of all industrialand municipal wastes are directly discharged into estuaries and coastal marine waters. InChennai coastal water, municipal sewage wastes (both sludge and wastewater), liquid indus-trial wastes (pharmaceutical, fertilizer, thermal power plants and other chemical factories)and dredged materials are the sources of most pollutants, released to coastal waters (Table 1).
The primary objective of this study is to assess and study the nature, intensity and extent ofphysical, chemical and biological pollutants of the coastal waters and aquifer waters along a30 km Chennai coastal area which is severally affected by enormous quantity of industrial anddomestic wastewater disposal. This study will recommend a method for proper wastewaterdisposal and protecting the health of coastal ecosystem.
2. Background of study site
The Chennai coastal zone covers a stretch of approximately 30 km length from Adyar river inthe south to Ennore creek in the north. The area is bound by the latitude 13◦0′N and 13◦15′Nand longitude 80◦15′E and 80◦21′E (Figure 1). Nearly 98.2% of the land area is used forindustrial, residential and commercial purposes. The majority of wastewater is disposed of inAdyar River, Cuvum River, and Buckingham canal outlets. Apart from these major disposalsites, a number of domestic and industrial wastewater sites are prevalent along the coastalzone of the north Chennai. A number of refineries, thermal power plants, chemical rubber
Springer
Water Resour Manage
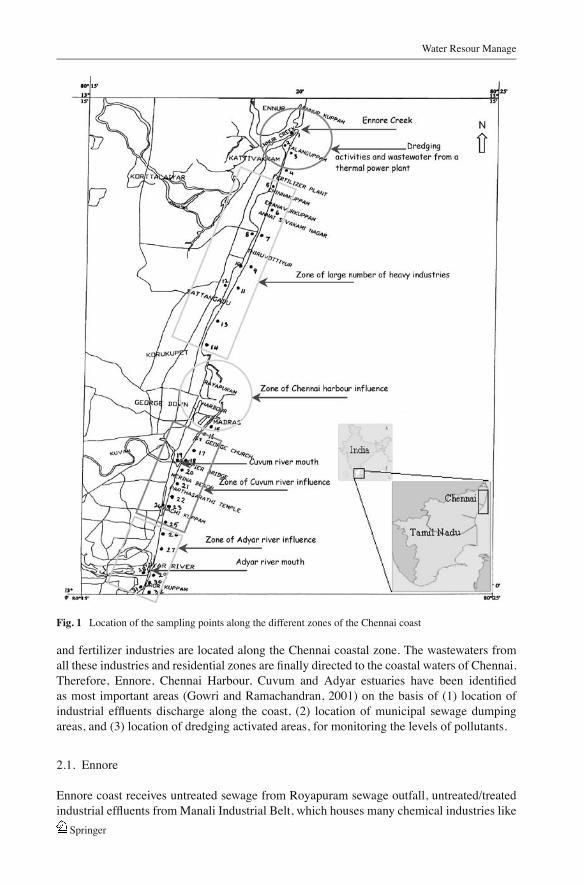
Fig. 1 Location of the sampling points along the different zones of the Chennai coast
and fertilizer industries are located along the Chennai coastal zone. The wastewaters fromall these industries and residential zones are finally directed to the coastal waters of Chennai.Therefore, Ennore, Chennai Harbour, Cuvum and Adyar estuaries have been identifiedas most important areas (Gowri and Ramachandran, 2001) on the basis of (1) location ofindustrial effluents discharge along the coast, (2) location of municipal sewage dumpingareas, and (3) location of dredging activated areas, for monitoring the levels of pollutants.
2.1. Ennore
Ennore coast receives untreated sewage from Royapuram sewage outfall, untreated/treatedindustrial effluents from Manali Industrial Belt, which houses many chemical industries like
Springer
Water Resour Manage
fertilizer, oil refineries, sugar, chemicals etc. Apart from this, it receives fly ash and thermaldischarges from the nearby Ennore Thermal Power Station. In addition to that, fishing andnavigational activities take place in the area. The dredging activities in Ennore area result inchanges in the landscape, sediment transport, and dust pollution to the coast by quarryingprocess.
2.2. Chennai harbour
Chennai Harbour can be considered as eastern gateway of south India. It handles nearly 36million tonnes per year of different commodities such as coal, iron ore, chemical manures,machineries, chemicals including acids, cement, granite blocks, furnace oil, diesel oil, veg-etable oil etc. Apart from these, there are also containers and passenger traffic in the harbour.On an average, 2500 vessels move around the harbour area.
2.3. Cuvum river
Cuvum river flows towards east direction in Chennai city. The major portion of Chennaicity’s treated/untreated sewage is channelized through this river to the sea. This river alsoserves as a conveyor of storm water from the city’s sewage drain network. The bed slope ofthe river is very mild. This, together with the formation of sand bar at the river mouth and atidal range below 1.2 m prevent the effective flushing of the river during the ebb tide. As aresult, for periods other than monsoon, the stagnant river is anoxic and very rich in organicmatter. There is periodic reversal of this trend only at the river mouth due to weak tidal effect.
2.4. Adyar river mouth
Adyar river is located south of the Cuvum River. It also flows towards the east direction. Atotal of 58 drain outlets discharge into Adyar between the stretch of Jafferkhanpet and ThiruVivekananda Nagar bridge. According to Gowri and Ramachandran (2001), about 0.775mld of industrial effluents carrying heavy metals and about 8.1 mld of domestic sewage areallowed to flow into Adyar river. The sand bar nearby Adyar river mouth also prevents tidalflushing.
3. Materials and methods
Water samples were collected from about 32 locations (24 seaside and 8 landside) on threeoccasions, 17 September, 20 October and 23 November 2002 (Figure 1). On the seaside,the water samples were collected at a depth of 2–4 m, and on the landside, the water sam-ples were collected from the boreholes. The name and number of stations along with thegeographical coordinates is given in Table 2. The water samples were analyzed for vari-ous physical, chemical, trace/toxic elements and biological parameters based on the pro-cedures described in APHA, AWWA and WPCF (1998) and other literatures collected forthis study. The physico-chemical parameters (temperature, pH, Electrical Conductivity, To-tal Dissolved Solids, Turbidity, Dissolved Oxygen, organic Nitrate, Nitrite and Phosphate),trace/toxic elements (Mn, Cr, Ni, Pb, Cu, Cd, Co) and biological parameters (BOD, COD,Chlorophyll a and Total Fecal Coliform) have been studied. Temperature, pH, electrical con-ductivity and turbidity were measured using digital thermometer, pH meter and conductivitymeter and nephelometer, respectively. DO, BOD, COD, Ca2+, Mg2+, Cl−, HCO−
3 , CO2−3
Springer
Water Resour Manage
Table 2 Name and locations of the sample stations along the Chennai coast
Station no. Name of the station Latitude Longitude
1 Ennore Creek 13◦14′051′′N 80◦19′911′′E2 Talakuppam (groundwater) 13◦13′484′′N 80◦19′704′′E3 Talakuppam 13◦13′323′′N 80◦19′704′′E4 Opposite to Urea Factory, Ennore 13◦12′800′′N 80◦19′503′′E5 ETPS (groundwater) 13◦12′203′′N 80◦19′189′′E6 Annai Sivagami Nagar 13◦12′728′′N 80◦19′169′′E7 Bharathiar Nagar 13◦11′120′′N 80◦19′029′′E8 Near Amman Temple, Bharathiar Nagar (groundwater) 13◦11′152′′N 80◦18′954′′E9 Near MRF company 13◦10′540′′N 80◦18′787′′E
10 Near MRF (groundwater) 13◦10′541′′N 80◦18′787′′E11 Near Kanni Koil, Ennore 13◦09′409′′N 80◦18′367′′E12 Near Kanni Koil, (groundwater) 13◦09′441′′N 80◦18′350′′E13 Susandherpuram 13◦08′737′′N 80◦18′077′′E14 Vannarpet 13◦08′184′′N 80◦17′897′′E15 Near Chennai Harbour 13◦08′469′′N 80◦17′523′′E16 New CISF 13◦04′469′′N 80◦17′523′′E17 Opposite to CISF (North of Cooum) 13◦08′186′′N 80◦17′911′′E18 Cuvuum River Mouth 13◦04′082′′N 80◦17′911′′E19 Temple Near Cooum river mouth (groundwater) 13◦04′146′′N 80◦17′911′′E20 Marina Beach near Anna Samathi 13◦03′791′′N 80◦17′911′′E21 Near M.G.R Samathi, Marina 13◦03′790′′N 80◦17′911′′E22 Opp. Presidency College, Marina 13◦03′358′′N 80◦17′911′′E23 Opp. to Railway station 13◦03′358′′N 80◦17′911′′E24 Opp. to Madras University Hostel (groundwater) 13◦03′249′′N 80◦16′911′′E25 Opp. Queen Maris College 13◦02′311′′N 80◦16′911′′E26 Opp. Santhome Church 13◦01′984′′N 80◦16′911′′E27 Opp. Rajiv Gandhi Nagar 13◦01′583′′N 80◦16′911′′E28 Adayar river mouth 13◦01′583′′N 80◦16′911′′E29 Near Adayar river 13◦00′760′′N 80◦16′911′′E30 Opp. Adayar Old Bungalow 13◦00′434′′N 80◦16′911′′E31 Near Besant Nagar beach (groundwater) 13◦00′370′′N 80◦16′911′′E32 Near Ashtalakshmi Temple, Besant Nagar 12◦59′391′′N 80◦16′911′′E
concentrations were determined using titrimetric methods. Nutrients, chlorophyll, sulfatelevels were determined using spectrophotometric methods, while the concentrations of tracemetals were estimated using an Atomic Absorption Spectroscopy (AAS). Determination ofcoliform bacteria was done using Most Probable Number (MPN) method (APHA, AWWAand WPCF, 1998). Special care was taken during collection and analysis of water samplesfor determining all parameters so as to maintain high accuracy.
4. Results and discussions
4.1. Physico-chemical pollutants in coastal waters
The general coastal water quality standards (swimming and aquatic life) for several parame-ters are specified in Table 3 (Moore, 1991; National Environmental Board report, 1994). Theresults of the analysis of various physical, chemical and biological parameters from the water
Springer
Water Resour Manage
Table 3 General coastal caterquality standards (swimming andaquatic life)
Parameters Standards
PH 7.8–8.3Temperature (◦C) 30Odour UnobjectionableTurbidity (NTU) 10 NTU or lessTotal Suspended Sediments (TSS) 25 mg L−1 or lessDissolved Oxygen (DO) 4 mg L−1 or moreBiochemical Oxygen Demand (BOD5) 30 mg L−1 or lessChemical Oxygen Demand COD 250 mg L−1 or lessTotal Coliform Bacteria 200 MPN / 100ml or lessNitrate 10 mg L−1 or lessNitrite 10 mg L−1 or lessTotal Nitrogen 1 mg L−1 or lessPhosphorus as Phosphate PO−3
4 0.1 mg L−1 or lessChlorophyll-a 15 mg L−1 or less
Trace/toxic metals (Maximum Limit)Cadmium 0.01 mg L−1
Lead 0.1 mg L−1
Copper 0.02 mg L−1
Nickel 0.01 mg L−1
Zinc 0.1 mg L−1
Iron 0.1 mg L−1
Manganese 0.1 mg L−1
Chromium 0.1 mg L−1
Cobalt 0.005 mg L−1
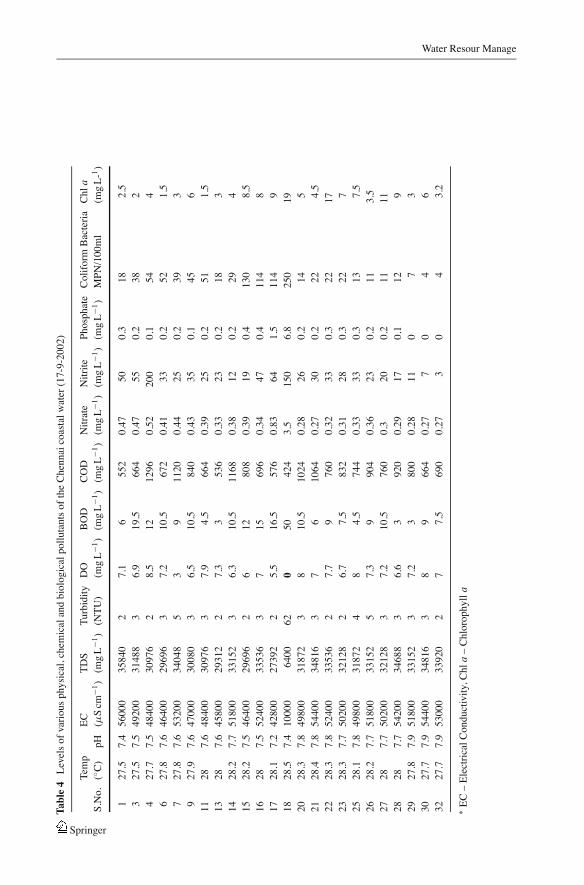
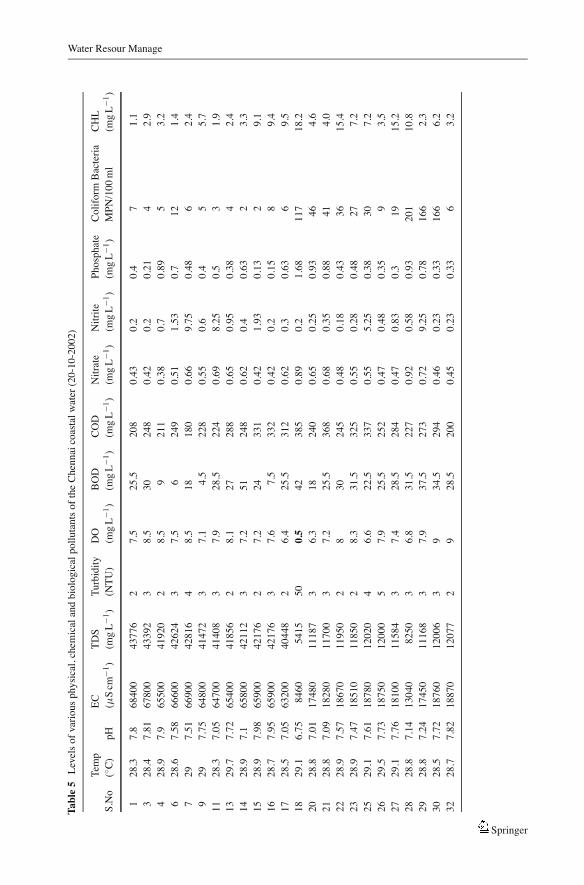
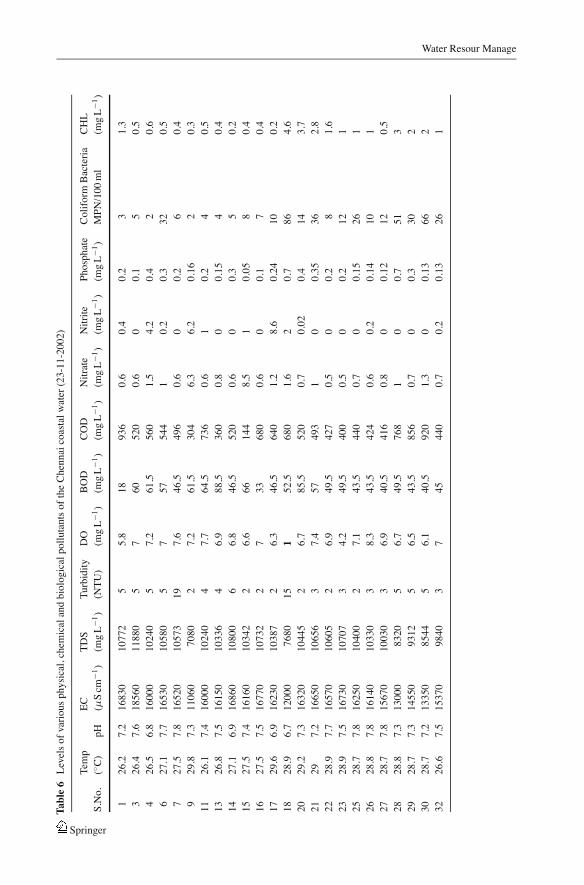
samples collected along the Chennai coast are presented in Tables 4–6. It should be observedthat several parameters are not within the permissible limit of the international standardsdescribed in Table 3. In Figure 2a, the DO concentration appears to be very low in Cuvumriver mouth (18) and Barathiyar Nagar (7) areas. The zero DO level in Cuvum river resultsmainly due to high nutrient loading and disposal of other oxygen demanding substances. Thereduction in DO concentration around Bharathiyar nagar areas is attributed to a large amountof sewage wastes that are directly disposed into the coastal water through the pipelines. Itis important to note that DO level increased during monsoonal storm prevailed in October,while it decreased before and after the storm. biochemical oxygen demand is another mea-sure of the amount of oxygen that bacteria will consume while decomposing organic matterunder aerobic conditions. From this analysis, it is observed that the high biochemical oxygendemand occurred in the Cuvum river (sample location 18) and exceeded the maximum limit(30 mg L−1) of the international standard during all three periods (Figure 2b). The watersamples analysed for November have high BOD values in most of the sample locations.Such high BOD values might result from high oxygen demanding substances disposed tocoastal waters by heavy runoff in October. Notice that there is an increasing trend in BODlevels from harbour to Cuvum river mouth areas and a decreasing trend from Cuvum riverto Marina beach areas during September. This is because the NW currents tend to push theconcentrated Cuvum river waters toward northward direction (harbour), thereby increasingBOD values in these areas. On the contrary, the change of currents in the east-west directionduring September and October resulted in the significant increase of BOD concentrationstoward the marina beach areas, and therefore decrease in BOD concentrations was foundtoward harbour areas during these periods. A similar trend can be seen in Adyar river areas.
Springer
Water Resour ManageTa
ble4
Leve
lsof
vario
usph
ysic
al,c
hem
ical
and
biol
ogic
alpo
lluta
ntso
fthe
Chen
naic
oasta
lwat
er(1
7-9-
2002
)
Tem
pEC
TDS
Turb
idity
DO
BOD
COD
Nitr
ate
Nitr
itePh
osph
ate
Colif
orm
Bact
eria
Chla
S.N
o.(◦
C)pH
(μS
cm−1
)(m
gL−1
)(N
TU)
(mgL
−1)
(mgL
−1)
(mgL
−1)
(mgL
−1)
(mgL
−1)
(mgL
−1)
MPN
/100
ml
(mgL
-1 )
127
.57.
456
000
3584
02
7.1
655
20.
4750
0.3
182.
53
27.5
7.5
4920
031
488
36.
919
.566
40.
4755
0.2
382
427
.77.
548
400
3097
62
8.5
1212
960.
5220
00.
154
46
27.8
7.6
4640
029
696
37.
210
.567
20.
4133
0.2
521.
57
27.8
7.6
5320
034
048
53
911
200.
4425
0.2
393
927
.97.
647
000
3008
03
6.5
10.5
840
0.43
350.
145
611
287.
648
400
3097
63
7.9
4.5
664
0.39
250.
251
1.5
1328
7.6
4580
029
312
27.
33
536
0.33
230.
218
314
28.2
7.7
5180
033
152
36.
310
.511
680.
3812
0.2
294
1528
.27.
546
400
2969
62
612
808
0.39
190.
413
08.
516
287.
552
400
3353
63
715
696
0.34
470.
411
48
1728
.17.
242
800
2739
22
5.5
16.5
576
0.83
641.
511
49
1828
.57.
410
000
6400
620
5042
43.
515
06.
825
019
2028
.37.
849
800
3187
23
810
.510
240.
2826
0.2
145
2128
.47.
854
400
3481
63
76
1064
0.27
300.
222
4.5
2228
.37.
852
400
3353
62
7.7
976
00.
3233
0.3
2217
2328
.37.
750
200
3212
82
6.7
7.5
832
0.31
280.
322
725
28.1
7.8
4980
031
872
48
4.5
744
0.33
330.
313
7.5
2628
.27.
751
800
3315
25
7.3
990
40.
3623
0.2
113.
527
287.
750
200
3212
83
7.2
10.5
760
0.3
200.
211
1128
287.
754
200
3468
83
6.6
392
00.
2917
0.1
129
2927
.87.
951
800
3315
23
7.2
380
00.
2811
07
330
27.7
7.9
5440
034
816
38
966
40.
277
04
632
27.7
7.9
5300
033
920
27
7.5
690
0.27
30
43.
2
∗EC
–El
ectri
calC
ondu
ctiv
ity,C
hla
–Ch
loro
phyl
la
Springer
Water Resour Manage
Tabl
e5Le
vels
ofva
rious
phys
ical
,che
mic
alan
dbi
olog
ical
pollu
tant
soft
heCh
enna
icoa
stalw
ater
(20-
10-2
002)
Tem
pEC
TDS
Turb
idity
DO
BOD
COD
Nitr
ate
Nitr
itePh
osph
ate
Colif
orm
Bact
eria
CHL
S.N
o(◦
C)pH
(μS
cm−1
)(m
gL−1
)(N
TU)
(mgL
−1)
(mgL
−1)
(mgL
−1)
(mgL
−1)
(mgL
−1)
(mgL
−1)
MPN
/100
ml
(mgL
−1)
128
.37.
868
400
4377
62
7.5
25.5
208
0.43
0.2
0.4
71.
13
28.4
7.81
6780
043
392
38.
530
248
0.42
0.2
0.21
42.
94
28.9
7.9
6550
041
920
28.
59
211
0.38
0.7
0.89
53.
26
28.6
7.58
6660
042
624
37.
56
249
0.51
1.53
0.7
121.
47
297.
5166
900
4281
64
8.5
1818
00.
669.
750.
486
2.4
929
7.75
6480
041
472
37.
14.
522
80.
550.
60.
45
5.7
1128
.37.
0564
700
4140
83
7.9
28.5
224
0.69
8.25
0.5
31.
913
29.7
7.72
6540
041
856
28.
127
288
0.65
0.95
0.38
42.
414
28.9
7.1
6580
042
112
37.
251
248
0.62
0.4
0.63
23.
315
28.9
7.98
6590
042
176
27.
224
331
0.42
1.93
0.13
29.
116
28.7
7.95
6590
042
176
37.
67.
533
20.
420.
20.
158
9.4
1728
.57.
0563
200
4044
82
6.4
25.5
312
0.62
0.3
0.63
69.
518
29.1
6.75
8460
5415
500.
542
385
0.89
0.2
1.68
117
18.2
2028
.87.
0117
480
1118
73
6.3
1824
00.
650.
250.
9346
4.6
2128
.87.
0918
280
1170
03
7.2
25.5
368
0.68
0.35
0.88
414.
022
28.9
7.57
1867
011
950
28
3024
50.
480.
180.
4336
15.4
2328
.97.
4718
510
1185
02
8.3
31.5
325
0.55
0.28
0.48
277.
225
29.1
7.61
1878
012
020
46.
622
.533
70.
555.
250.
3830
7.2
2629
.57.
7318
750
1200
05
7.9
25.5
252
0.47
0.48
0.35
93.
527
29.1
7.76
1810
011
584
37.
428
.528
40.
470.
830.
319
15.2
2828
.87.
1413
040
8250
36.
831
.522
70.
920.
580.
9320
110
.829
28.8
7.24
1745
011
168
37.
937
.527
30.
729.
250.
7816
62.
330
28.5
7.72
1876
012
006
39
34.5
294
0.46
0.23
0.33
166
6.2
3228
.77.
8218
870
1207
72
928
.520
00.
450.
230.
336
3.2
Springer
Water Resour ManageTa
ble6
Leve
lsof
vario
usph
ysic
al,c
hem
ical
and
biol
ogic
alpo
lluta
ntso
fthe
Chen
naic
oasta
lwat
er(2
3-11
-200
2)
Tem
pEC
TDS
Turb
idity
DO
BOD
COD
Nitr
ate
Nitr
itePh
osph
ate
Colif
orm
Bact
eria
CHL
S.N
o.(◦
C)pH
(μS
cm−1
)(m
gL−1
)(N
TU)
(mgL
−1)
(mgL
−1)
(mgL
−1)
(mgL
−1)
(mgL
−1)
(mgL
−1)
MPN
/100
ml
(mgL
−1)
126
.27.
216
830
1077
25
5.8
1893
60.
60.
40.
23
1.3
326
.47.
618
560
1188
05
760
520
0.6
00.
15
0.5
426
.56.
816
000
1024
05
7.2
61.5
560
1.5
4.2
0.4
20.
66
27.1
7.7
1653
010
580
57
5754
41
0.2
0.3
320.
57
27.5
7.8
1652
010
573
197.
646
.549
60.
60
0.2
60.
49
29.8
7.3
1106
070
802
7.2
61.5
304
6.3
6.2
0.16
20.
311
26.1
7.4
1600
010
240
47.
764
.573
60.
61
0.2
40.
513
26.8
7.5
1615
010
336
46.
988
.536
00.
80
0.15
40.
414
27.1
6.9
1686
010
800
66.
846
.552
00.
60
0.3
50.
215
27.5
7.4
1616
010
342
26.
666
144
8.5
10.
058
0.4
1627
.57.
516
770
1073
22
733
680
0.6
00.
17
0.4
1729
.66.
916
230
1038
72
6.3
46.5
640
1.2
8.6
0.24
100.
218
28.9
6.7
1200
076
8015
152
.568
01.
62
0.7
864.
620
29.2
7.3
1632
010
445
26.
785
.552
00.
70.
020.
414
3.7
2129
7.2
1665
010
656
37.
457
493
10
0.35
362.
822
28.9
7.7
1657
010
605
26.
949
.542
70.
50
0.2
81.
623
28.9
7.5
1673
010
707
34.
249
.540
00.
50
0.2
121
2528
.77.
816
250
1040
02
7.1
43.5
440
0.7
00.
1526
126
28.8
7.8
1614
010
330
38.
343
.542
40.
60.
20.
1410
127
28.7
7.8
1567
010
030
36.
940
.541
60.
80
0.12
120.
528
28.8
7.3
1300
083
205
6.7
49.5
768
10
0.7
513
2928
.77.
314
550
9312
56.
543
.585
60.
70
0.3
302
3028
.77.
213
350
8544
56.
140
.592
01.
30
0.13
662
3226
.67.
515
370
9840
37
4544
00.
70.
20.
1326
1
Springer
Water Resour Manage
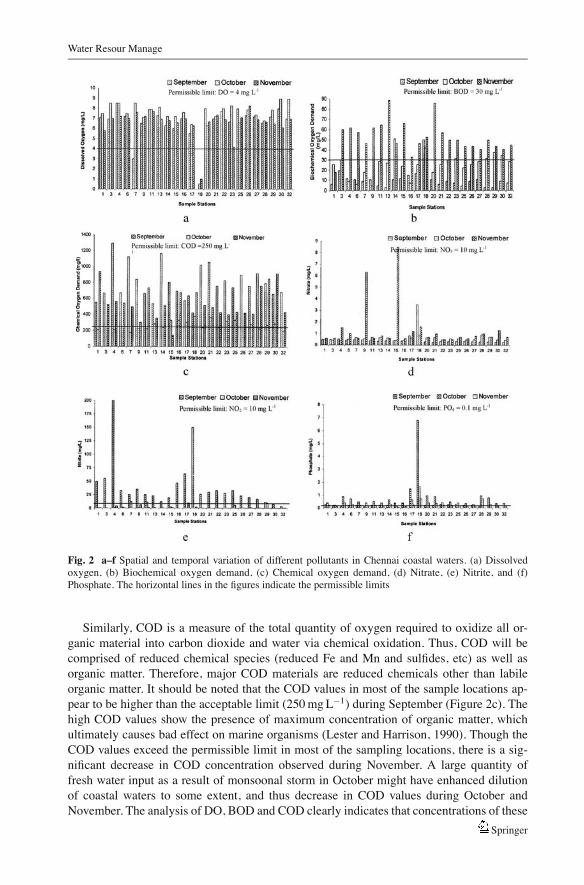
Fig. 2 a–f Spatial and temporal variation of different pollutants in Chennai coastal waters. (a) Dissolvedoxygen, (b) Biochemical oxygen demand, (c) Chemical oxygen demand, (d) Nitrate, (e) Nitrite, and (f)Phosphate. The horizontal lines in the figures indicate the permissible limits
Similarly, COD is a measure of the total quantity of oxygen required to oxidize all or-ganic material into carbon dioxide and water via chemical oxidation. Thus, COD will becomprised of reduced chemical species (reduced Fe and Mn and sulfides, etc) as well asorganic matter. Therefore, major COD materials are reduced chemicals other than labileorganic matter. It should be noted that the COD values in most of the sample locations ap-pear to be higher than the acceptable limit (250 mg L−1) during September (Figure 2c). Thehigh COD values show the presence of maximum concentration of organic matter, whichultimately causes bad effect on marine organisms (Lester and Harrison, 1990). Though theCOD values exceed the permissible limit in most of the sampling locations, there is a sig-nificant decrease in COD concentration observed during November. A large quantity offresh water input as a result of monsoonal storm in October might have enhanced dilutionof coastal waters to some extent, and thus decrease in COD values during October andNovember. The analysis of DO, BOD and COD clearly indicates that concentrations of these
Springer
Water Resour Manage
parameters are considerably higher in the Adyar, Cuvum and Bharathiyar nagar areas thatreceive large amounts of sewage wastes containing very high level of organic matter. Suchelevated concentrations of organic substances exacerbate anoxia or hypoxia by raising thebiological oxygen demand, the oxygen consumed during microbial decomposition, and thechemical oxygen demand, the oxygen consumed by oxidation of ammonium and other inor-ganic reduced components (Kennish, 1994). Owing to the shallow nature, the bottom waterhypoxia (DO < 1 mg L−1) may often persist throughout the year except winter (Novemberand December) when enormous amount of fresh water input occurs to the coastal system.Oxygen-depleted water columns impact benthic communities by producing acute changesin the distribution, abundance, and diversity of species (Meyers, 1999). Analysis of nitrateshows that its concentration is, however, below the permissible limit (10 mg L−1) in all sam-ple locations as shown in Figure 2d. In contrast, nitrite concentration is found to exceed theallowable limit in some locations from Ennore to Adyar during September. The excessiveconcentrations of nitrate and nitrite will lead to excessive aquatic plant production, which maynegatively impact coastal water environments in several ways: (1) production of toxic algae,(2) algal decay and discoloration of the water; (3) extensive growth of rooted aquatic macro-phytes will interfere with navigation and aeration; (4) dead macrophytes and phytoplanktonsettled to the bottom will stimulate microbial breakdown processes, leading to deplete dis-solved oxygen and production of toxic algae. As a result of oxygen depletion, sickness anddeath of marine organisms will take place. However, this concentration becomes decreasedin October and November (Figure 2e). A similar trend can also be observed in phosphateconcentration, which always exceeds the permissible limit (0.1 mg L−1) in the Cuvum area(Figure 2f).
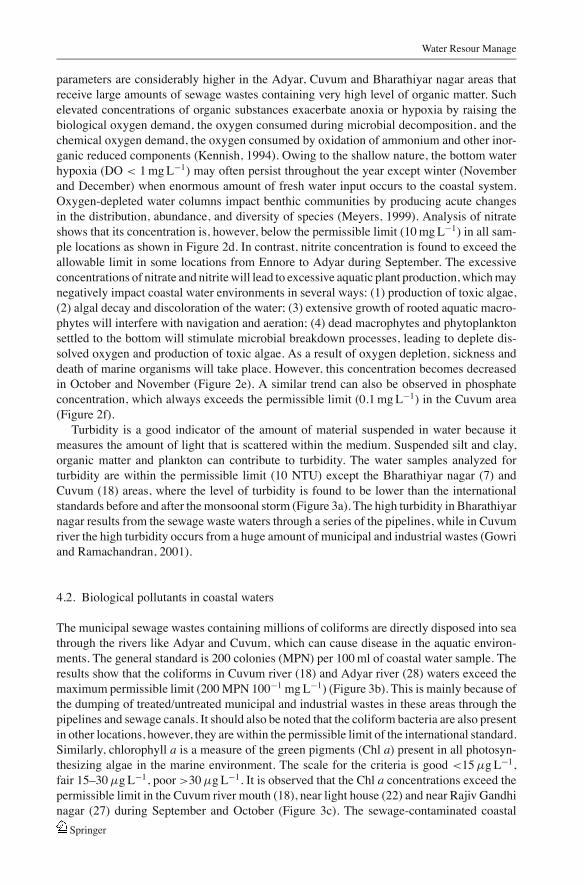
Turbidity is a good indicator of the amount of material suspended in water because itmeasures the amount of light that is scattered within the medium. Suspended silt and clay,organic matter and plankton can contribute to turbidity. The water samples analyzed forturbidity are within the permissible limit (10 NTU) except the Bharathiyar nagar (7) andCuvum (18) areas, where the level of turbidity is found to be lower than the internationalstandards before and after the monsoonal storm (Figure 3a). The high turbidity in Bharathiyarnagar results from the sewage waste waters through a series of the pipelines, while in Cuvumriver the high turbidity occurs from a huge amount of municipal and industrial wastes (Gowriand Ramachandran, 2001).
4.2. Biological pollutants in coastal waters
The municipal sewage wastes containing millions of coliforms are directly disposed into seathrough the rivers like Adyar and Cuvum, which can cause disease in the aquatic environ-ments. The general standard is 200 colonies (MPN) per 100 ml of coastal water sample. Theresults show that the coliforms in Cuvum river (18) and Adyar river (28) waters exceed themaximum permissible limit (200 MPN 100−1 mg L−1) (Figure 3b). This is mainly because ofthe dumping of treated/untreated municipal and industrial wastes in these areas through thepipelines and sewage canals. It should also be noted that the coliform bacteria are also presentin other locations, however, they are within the permissible limit of the international standard.Similarly, chlorophyll a is a measure of the green pigments (Chl a) present in all photosyn-thesizing algae in the marine environment. The scale for the criteria is good <15 μg L−1,fair 15–30 μg L−1, poor >30 μg L−1. It is observed that the Chl a concentrations exceed thepermissible limit in the Cuvum river mouth (18), near light house (22) and near Rajiv Gandhinagar (27) during September and October (Figure 3c). The sewage-contaminated coastal
Springer
Water Resour Manage
Fig. 3 a–c Spatial and temporal variation of (a) turbidity, (b) coliform bacteria, and (c) Chl a. The horizontallines in the figures indicate the permissible limits
areas exhibit higher concentrations posing significant health hazards to marine organismsand humans. Although many of these microbial pathogens survive only for hours to severaldays in seawater, they remain viable for longer periods in fish and shellfish. Individuals whoswim in such sewage-contaminated waters or consume contaminated fish and shellfish riskserious illness and other heath hazards (Kennish, 1994).
4.3. Trace and toxic metals in coastal waters
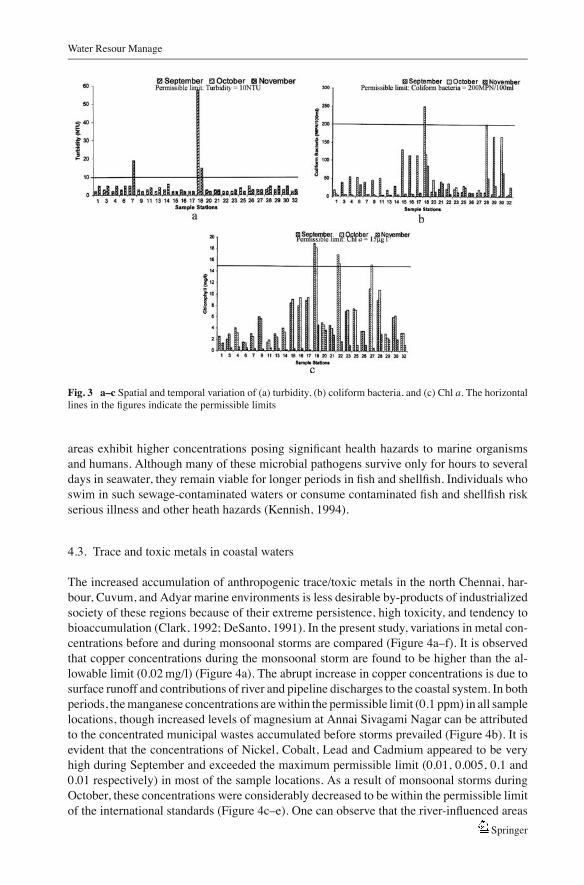
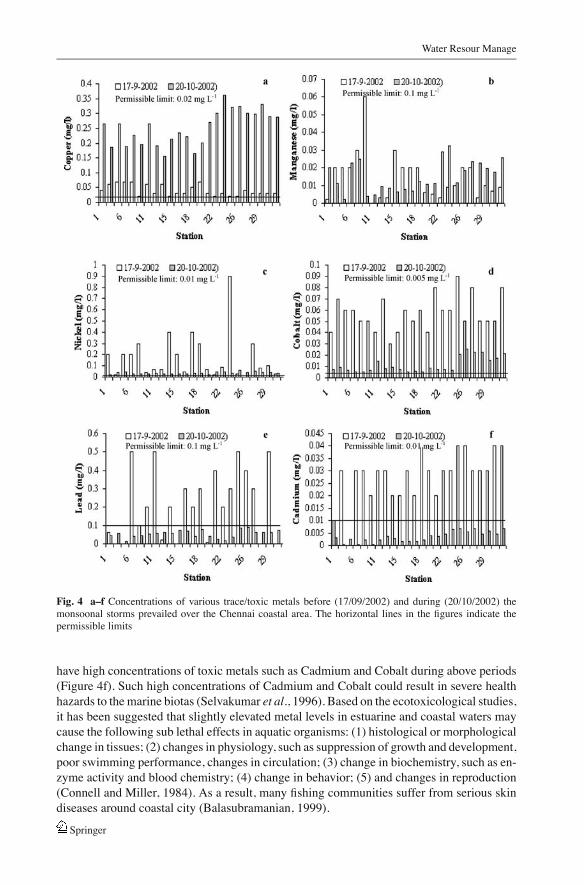
The increased accumulation of anthropogenic trace/toxic metals in the north Chennai, har-bour, Cuvum, and Adyar marine environments is less desirable by-products of industrializedsociety of these regions because of their extreme persistence, high toxicity, and tendency tobioaccumulation (Clark, 1992; DeSanto, 1991). In the present study, variations in metal con-centrations before and during monsoonal storms are compared (Figure 4a–f). It is observedthat copper concentrations during the monsoonal storm are found to be higher than the al-lowable limit (0.02 mg/l) (Figure 4a). The abrupt increase in copper concentrations is due tosurface runoff and contributions of river and pipeline discharges to the coastal system. In bothperiods, the manganese concentrations are within the permissible limit (0.1 ppm) in all samplelocations, though increased levels of magnesium at Annai Sivagami Nagar can be attributedto the concentrated municipal wastes accumulated before storms prevailed (Figure 4b). It isevident that the concentrations of Nickel, Cobalt, Lead and Cadmium appeared to be veryhigh during September and exceeded the maximum permissible limit (0.01, 0.005, 0.1 and0.01 respectively) in most of the sample locations. As a result of monsoonal storms duringOctober, these concentrations were considerably decreased to be within the permissible limitof the international standards (Figure 4c–e). One can observe that the river-influenced areas
Springer
Water Resour Manage
Fig. 4 a–f Concentrations of various trace/toxic metals before (17/09/2002) and during (20/10/2002) themonsoonal storms prevailed over the Chennai coastal area. The horizontal lines in the figures indicate thepermissible limits
have high concentrations of toxic metals such as Cadmium and Cobalt during above periods(Figure 4f). Such high concentrations of Cadmium and Cobalt could result in severe healthhazards to the marine biotas (Selvakumar et al., 1996). Based on the ecotoxicological studies,it has been suggested that slightly elevated metal levels in estuarine and coastal waters maycause the following sub lethal effects in aquatic organisms: (1) histological or morphologicalchange in tissues; (2) changes in physiology, such as suppression of growth and development,poor swimming performance, changes in circulation; (3) change in biochemistry, such as en-zyme activity and blood chemistry; (4) change in behavior; (5) and changes in reproduction(Connell and Miller, 1984). As a result, many fishing communities suffer from serious skindiseases around coastal city (Balasubramanian, 1999).
Springer
Water Resour Manage
4.4. Physico-chemical pollutants in coastal aquifer
The utilization of groundwater for domestic, industrial and other purposes has been constantlyincreasing over the world. In general, the water used for drinking purposes should be free fromcolor, turbidity, odor and microorganisms. Chemically, the water should preferably be soft,have low dissolved salts, and free from chemical and trace/toxic constituents. In coastal citieslike Chennai, over-exploitation of groundwater often results in invasion of salt water into theaquifer system. According to the Hindu (2003), the coastal parts from Injambakkam in thesouth to Ennore in the north are being severely affected by high concentration of chloride andtotal dissolved solids as a result of salt-water intrusion. Such salt-water intrusion not onlyincreases the chloride content in the groundwater, but also carries trace and toxic elementsfrom the polluted coastal waters. Rengaraj et al. (1996) pointed out that salinity concentrationdramatically increased for the past several years due to legal and illegal pumping of enormousvolume of groundwater from the beach sandy areas. At the same time, the municipal wastes,industrial effluents and other waste disposals also contribute groundwater contamination tocertain extent. In addition to this, the coastal system is often affected by high level pressureimposed by monsoonal storm during winter northeast monsoon. This leads to changes inthe salt-fresh water interface which also influence the quality of aquifer waters. To betterunderstand levels and extension of various pollutant parameters in groundwater, the presentstudy also focused to assess the levels of pollution in groundwater samples collected fromthe coastal aquifer of Chennai city.
Groundwater samples collected from 8 locations along the coastal areas of Chennai citywere analysed in the laboratory for major ions (Ca2+, Mg2+, Na+, K+, HCO−
3 , CO2−3 ,
SO2−4 , Cl−, and NO−
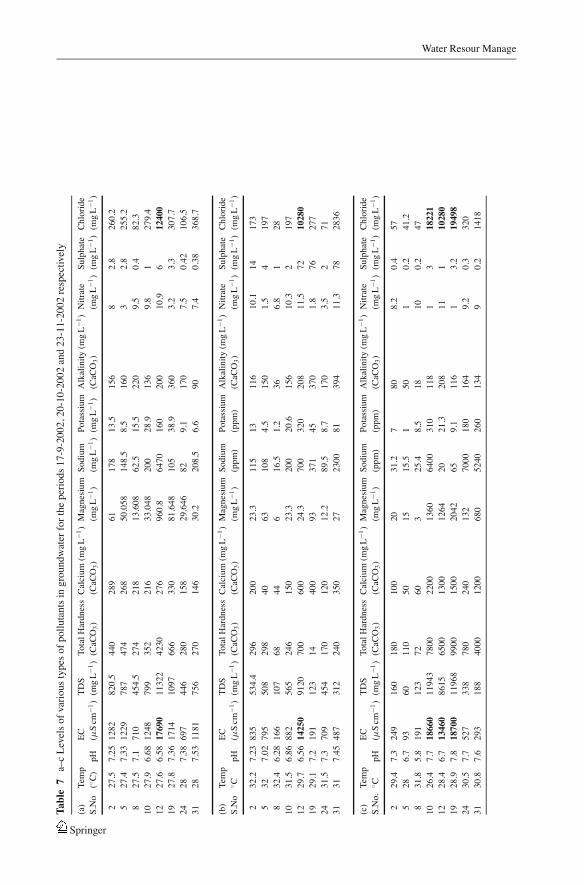
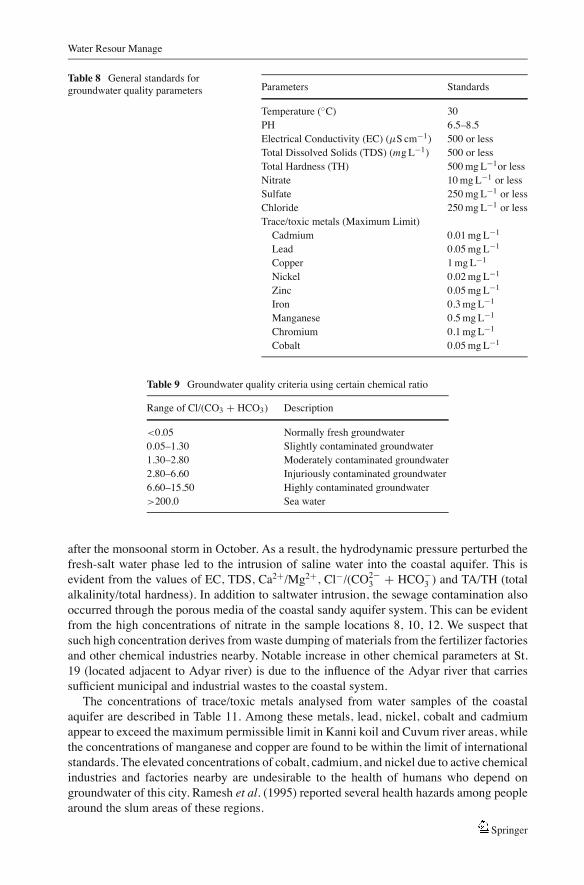
3 ), total hardness, electrical conductivity, total dissolved solids andpH (Table 7a–c). These results are then compared with the international standards (Moore,1991; National Environmental Board report, 1994) (Table 8). It is worth noting that beforemonsoonal storms prevailed over these areas, station-12 was found to be influenced by saltwater intrusion, while rest of the areas though exceeding the threshold values were consid-erably less affected by salt contamination. In October, the concentrations of several waterquality parameters appeared to be significantly low due to occurrence of large volume offresh water flow. In contrast, high concentrations of EC and chloride at locations 10 and 19imply that salt-water contamination extended to the adjacent areas of aquifer system whenhigh rate of pressure perturbed the salt-fresh water interface during a week persistence ofmonsoonal storm (Table 7c).
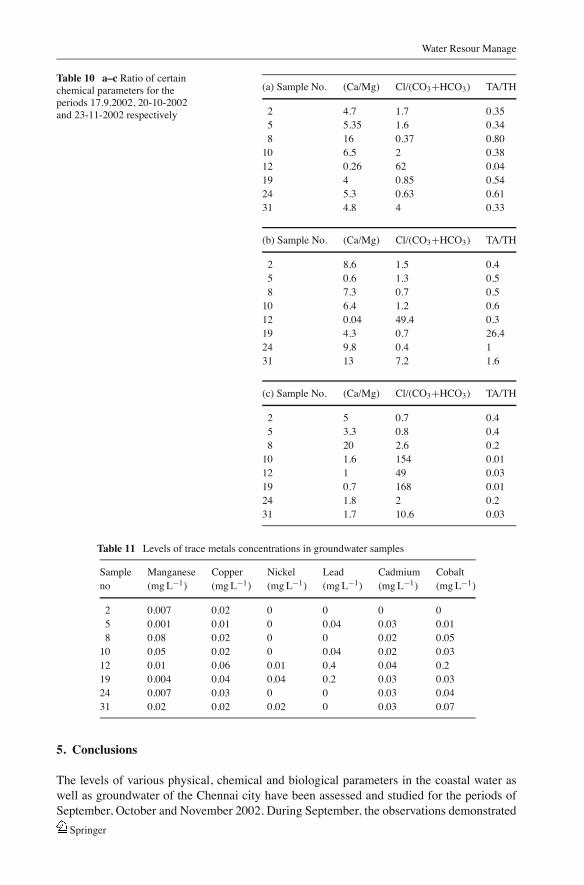
For assessing saltwater intrusion into coastal aquifer, the ratio of certain chemicalparameters such as Ca2+/Mg2+, Cl−/(CO2−
3 + HCO−3 ) and TA/TH can be used (Rengaraj
et al., 1996). According to Simpson (1946), the following scale is used for assessing thecontaminated groundwater by salt-water intrusion (Tables 9 and 10a–c). Since magnesium ispresent in seawater in much greater concentration than calcium, Ca/Mg ratio is recommendedas a parameter for determining the salt-water contamination. A low Ca/Mg ratio may also bean indicative of salt-water contamination (Ravi Prakash and Krishna Rao, 1996). If the ratiois less than 1, then the area is considered to be highly affected by salt-water intrusion. Thevery low value (0.28) indicates saltwater intrusion at sample location 12 (Near Kanni Koil).Similarly, the Cl/(CO3 + HCO3) ratio is also one of the criteria to evaluate the presence ofseawater intrusion. The high value of chloride and alkalinity ratio at location 12 indicates thatthe water may probably be affected by salt-water intrusion while the sample locations 10, 19and 31 are considered to be moderately affected by saltwater. In an overall assessment, saltwa-ter intrusion occurred in sample location 12 (near Kanni koil) as a result of overexploitationof groundwater in these areas. But it has been extended to other locations (10, 12, and 19)
Springer
Water Resour ManageTa
ble
7a–
cLe
vels
ofva
rious
type
sofp
ollu
tant
sin
grou
ndw
ater
fort
hepe
riods
17-9
-200
2,20
-10-
2002
and
23-1
1-20
02re
spec
tivel
y
(a)
Tem
pEC
TDS
Tota
lHar
dnes
sCa
lciu
m(m
gL−1
)M
agne
sium
Sodi
umPo
tass
ium
Alk
alin
ity(m
gL−1
)N
itrat
eSu
lpha
teCh
lorid
eS.
No
(◦ C)
pH(μ
Scm
−1)
(mgL
−1)
(CaC
O3)
(CaC
O3)
(mgL
−1)
(mgL
−1)
(mgL
−1)
(CaC
O3)
(mgL
−1)
(mgL
−1)
(mgL
−1)
227
.57.
2512
8282
0.5
440
289
6117
813
.515
68
2.8
260.
25
27.4
7.33
1229
787
474
268
50.0
5814
8.5
8.5
160
32.
825
5.2
827
.57.
171
045
4.5
274
218
13.6
0862
.515
.522
09.
50.
482
.310
27.9
6.68
1248
799
352
216
33.0
4820
028
.913
69.
81
279.
412
27.6
6.58
1769
011
322
4230
276
960.
864
7016
020
010
.96
1240
019
27.8
7.36
1714
1097
666
330
81.6
4810
538
.936
03.
23.
330
7.7
2428
7.38
697
446
280
158
29.6
4682
9.1
170
7.5
0.42
106.
531
287.
5311
8175
627
014
630
.220
8.5
6.6
907.
40.
3836
8.7
(b)
Tem
pEC
TDS
Tota
lHar
dnes
sCa
lciu
m(m
gL−1
)M
agne
sium
Sodi
umPo
tass
ium
Alk
alin
ity(m
gL−1
)N
itrat
eSu
lpha
teCh
lorid
eS.
No
◦ CpH
(μS
cm−1
)(m
gL−1
)(C
aCO
3)(C
aCO
3)(m
gL−1
)(p
pm)
(ppm
)(C
aCO
3)(m
gL−1
)(m
gL−1
)(m
gL−1
)
232
.27.
2383
553
4.4
296
200
23.3
115
1311
610
.114
173
532
7.02
795
508
298
4063
108
4.5
150
1.5
419
78
32.4
6.28
166
107
6844
616
.51.
236
6.8
128
1031
.56.
8688
256
524
615
023
.320
020
.615
610
.32
197
1229
.76.
5614
250
9120
700
600
24.3
700
320
208
11.5
7210
280
1929
.17.
219
112
314
400
9337
145
370
1.8
7627
724
31.5
7.3
709
454
170
120
12.2
89.5
8.7
170
3.5
271
3131
7.45
487
312
240
350
2723
0081
394
11.3
7828
36
(c)
Tem
pEC
TDS
Tota
lHar
dnes
sCa
lciu
m(m
gL−1
)M
agne
sium
Sodi
umPo
tass
ium
Alk
alin
ity(m
gL−1
)N
itrat
eSu
lpha
teCh
lorid
eS.
No.
◦ CpH
(μS
cm−1
)(m
gL−1
)(C
aCO
3)(C
aCO
3)(m
gL−1
)(p
pm)
(ppm
)(C
aCO
3)(m
gL−1
)(m
gL−1
)(m
gL−1
)
229
.47.
324
916
018
010
020
31.2
780
8.2
0.4
575
286.
793
6011
050
1515
.51
501
0.2
41.2
831
.85.
819
112
372
603
25.4
8.5
1810
0.2
4710
26.4
7.7
1866
011
943
7800
2200
1360
6400
310
118
13
1822
112
28.4
6.7
1346
086
1565
0013
0012
6420
21.3
208
111
1028
019
28.9
7.8
1870
011
968
9900
1500
2042
659.
111
61
3.2
1949
824
30.5
7.7
527
338
780
240
132
7000
180
164
9.2
0.3
320
3130
.87.
629
318
840
0012
0068
052
4026
013
49
0.2
1418
Springer
Water Resour Manage
Table 8 General standards forgroundwater quality parameters Parameters Standards
Temperature (◦C) 30PH 6.5–8.5Electrical Conductivity (EC) (μS cm−1) 500 or lessTotal Dissolved Solids (TDS) (mg L−1) 500 or lessTotal Hardness (TH) 500 mg L−1or lessNitrate 10 mg L−1 or lessSulfate 250 mg L−1 or lessChloride 250 mg L−1 or lessTrace/toxic metals (Maximum Limit)
Cadmium 0.01 mg L−1
Lead 0.05 mg L−1
Copper 1 mg L−1
Nickel 0.02 mg L−1
Zinc 0.05 mg L−1
Iron 0.3 mg L−1
Manganese 0.5 mg L−1
Chromium 0.1 mg L−1
Cobalt 0.05 mg L−1
Table 9 Groundwater quality criteria using certain chemical ratio
Range of Cl/(CO3 + HCO3) Description
<0.05 Normally fresh groundwater0.05–1.30 Slightly contaminated groundwater1.30–2.80 Moderately contaminated groundwater2.80–6.60 Injuriously contaminated groundwater6.60–15.50 Highly contaminated groundwater>200.0 Sea water
after the monsoonal storm in October. As a result, the hydrodynamic pressure perturbed thefresh-salt water phase led to the intrusion of saline water into the coastal aquifer. This isevident from the values of EC, TDS, Ca2+/Mg2+, Cl−/(CO2−
3 + HCO−3 ) and TA/TH (total
alkalinity/total hardness). In addition to saltwater intrusion, the sewage contamination alsooccurred through the porous media of the coastal sandy aquifer system. This can be evidentfrom the high concentrations of nitrate in the sample locations 8, 10, 12. We suspect thatsuch high concentration derives from waste dumping of materials from the fertilizer factoriesand other chemical industries nearby. Notable increase in other chemical parameters at St.19 (located adjacent to Adyar river) is due to the influence of the Adyar river that carriessufficient municipal and industrial wastes to the coastal system.
The concentrations of trace/toxic metals analysed from water samples of the coastalaquifer are described in Table 11. Among these metals, lead, nickel, cobalt and cadmiumappear to exceed the maximum permissible limit in Kanni koil and Cuvum river areas, whilethe concentrations of manganese and copper are found to be within the limit of internationalstandards. The elevated concentrations of cobalt, cadmium, and nickel due to active chemicalindustries and factories nearby are undesirable to the health of humans who depend ongroundwater of this city. Ramesh et al. (1995) reported several health hazards among peoplearound the slum areas of these regions.
Springer
Water Resour Manage
Table 10 a–c Ratio of certainchemical parameters for theperiods 17.9.2002, 20-10-2002and 23-11-2002 respectively
(a) Sample No. (Ca/Mg) Cl/(CO3+HCO3) TA/TH
2 4.7 1.7 0.355 5.35 1.6 0.348 16 0.37 0.80
10 6.5 2 0.3812 0.26 62 0.0419 4 0.85 0.5424 5.3 0.63 0.6131 4.8 4 0.33
(b) Sample No. (Ca/Mg) Cl/(CO3+HCO3) TA/TH
2 8.6 1.5 0.45 0.6 1.3 0.58 7.3 0.7 0.5
10 6.4 1.2 0.612 0.04 49.4 0.319 4.3 0.7 26.424 9.8 0.4 131 13 7.2 1.6
(c) Sample No. (Ca/Mg) Cl/(CO3+HCO3) TA/TH
2 5 0.7 0.45 3.3 0.8 0.48 20 2.6 0.2
10 1.6 154 0.0112 1 49 0.0319 0.7 168 0.0124 1.8 2 0.231 1.7 10.6 0.03
Table 11 Levels of trace metals concentrations in groundwater samples
Sample Manganese Copper Nickel Lead Cadmium Cobaltno (mg L−1) (mg L−1) (mg L−1) (mg L−1) (mg L−1) (mg L−1)
2 0.007 0.02 0 0 0 05 0.001 0.01 0 0.04 0.03 0.018 0.08 0.02 0 0 0.02 0.05
10 0.05 0.02 0 0.04 0.02 0.0312 0.01 0.06 0.01 0.4 0.04 0.219 0.004 0.04 0.04 0.2 0.03 0.0324 0.007 0.03 0 0 0.03 0.0431 0.02 0.02 0.02 0 0.03 0.07
5. Conclusions
The levels of various physical, chemical and biological parameters in the coastal water aswell as groundwater of the Chennai city have been assessed and studied for the periods ofSeptember, October and November 2002. During September, the observations demonstrated
Springer
Water Resour Manage
high concentrations of nutrients, low dissolved oxygen and high biochemical and chemicaloxygen demand in the coastal surface waters of north Chennai, Cuvum and Adyar rivermouth areas. The trace/toxic metal concentrations are found to be significantly higher thanthe permissible limit of international standards at several locations of the study area. As a resultof fresh water input in October, the concentrations of some of these parameters became lowin many places. Similarly, the analysis of groundwater samples showed that the intrusion ofsalt water apparently enhanced the salinity concentration in areas of Kanni koil (location 12),MRF (location 10) and Cuvum (location 19). The occurrence of saline water intrusion alsoenriched the concentrations of certain trace/toxic elements in the aquifer waters. Based on thedetailed investigation, the Kanni koil, Cuvum and Adyar are identified as highly vulnerablezones because of receiving large quantities of municipal and industrial wastes of the Chennaicity. Owing to shallow nature of these areas, disposed waste materials and pollutants arehighly persistence in the coastal waters, especially in the surf zone (Laws et al., 1999). Therole of physical mixing and transport by currents is less significant in these areas, therefore,all of pollutants remain concentrated around the surf zone due to low dispersion. Althoughseveral conventional treatment facilities are available to reduce the content of suspendedsolids, oxygen-demanding substances, dissolved inorganic compounds, and pathogens inthese areas, the treated wastes still contain high concentrations of several polluting substances.New techniques and dispersion models are thus necessary to be introduced to reduce thelevels of pollution in the coastal areas. In the recent years more importance is given forthe construction of submarine diffusers to transport and disperse such a huge quantity ofwaste materials to the deep open ocean areas. Because of the great depth and distance fromland, the open ocean areas are found to be ideal for waste dumping than coastal region. Openoceans have also considerable capacity to dilute, transport, and disperse wastes and associatedpollutants because of their large volume and free exchange of water. Hence, oceans are lessvulnerable to the impact of waste disposal than coastal waters.
Acknowledgements This research received support from the Institute for Water Studies, Public Works Depart-ment (PWD), Tharamani, Tamil Nadu, India. The authors thank the anonymous reviewers for their constructivecomments.
References
APHA, AWWA, and WPCF (1998) Standard methods for examination of water and waste water. AmericanPublic Health Organisation, Washington DC, USA
Balasubramanian T (1999) Impacts of coastal pollution. In: Proceedings of Indo-British integrated coastalzone management training short-course conducted by Institute for Ocean Management, Anna University,India
Beder S (1989) Engineering Sydney’s sewerage pollution: Public relations assisted technology. Curr Aff Bull66:27–31
Beiras R, Bellas J, Fernandez Z, Lorenzo JI, Cobelo-Garcia A (2003) Assessment of coastal marine pollutionin Galicia (NW Iberian Peninsula); metal concentrations in seawater, sediments and mussels (Mytilusgalloprovincialis) versus embryo-larval bioassays using Paracentrotus lividus and Ciana intestinalis.Mar Environ Res 56:531–553
Capuzzo JM, Burt BV, Duedall IW, Park PK, Kester DR (1985) Nearshore waste disposal. John Wiley andSons Inc. Publications, New York, USA
Clark RB (1992) Marine pollution, 3rd ed. Clarendon Press, Oxford, U.K.Connell DW, Miller GJ (1984) Chemistry and ecotoxicology of pollution. John Wiley and Sons Press, New
YorkDeSanto RS (1991) Inorganic contaminants of surface water. Springer–Verlag publications, New YorkGiridhar VV (2001) Coastal ocean pollution monitoring program. In: Proceedings of the UGC course on
Marine sciences and environment conducted by the Department of Applied Geology, University of Madras,Chennai, India
Springer
Water Resour Manage
Gowri VS, Ramachandran S (2001) Coastal pollution of Chennai city, Coastal geomorphology of India.Ramachandran S (ed) Institute of Ocean Management,, Anna University, Chennai, India
http://beach.com/stateofthebeach/2-indi/health quality.aspKennish MJ (1994) Practical handbook of marine science. 2nd ed. CRC Press, Boca Raton, USAKotti ME, Vlessidis AG, Thanasoulias NC, Evmiridis NP (2005) Assessment of river water quality in Northern
Greece. Water Res Manage 19:77–94Laws EA, Ziemann D, Schulman D (1998) Coastal water quality in Hawaii: the importance of buffer zones
and dilution. Mar Environ Res 48:1–21Lester JN, Harrison RM (1990) Pollution, causes, effects and control, 2nd ed. Royal Society of Chemistry,
Cambridge, UKMeyers A (1999) Encyclopedia of environmental pollution and cleanup. John Wiley and Sons Inc publications,
New York, USAMoore JW (1991) Inorganic contaminants of surface water: research and monitoring priorities. Springer-
Verlag, New YorkNational Environmental Board Report (1994) Enhancement and conservation of national environmental qual-
ity. Act B.E.2537, Royal Government GazetteRamesh R, Shivakumar K, Eswaramoorthy S, Purvaja R (1995) Migration and contamination of major and
trace elements in ground water of Madras city, India. Environ Geol 25:126–136Rama Devi V, Miranda WJ, Abdul Azis PK (1996) Deterioration of water quality- An overview on the pollution
problems of the Ashtamudi Estuary. Pollut Res 15:367–370Ravi Prakash S, Krishna Rao G (1996) Delineation of salt water contamination zones by chemical parameters
in Parvada Aream, Vishakapattnam, AP. J Indian Water Res Soc 2:63–38Rengaraj S, Elampooranan T, Elango L, Ramalingam V (1996) Ground water quality in suburban regions of
Madras city, India. Pollut Res 15:325–328Selvakumar S, Ajmalkhan S, Kumaraguru B (1996) Effects of heavy metal zinc in relation to salinity on the
survival and intermoult duration of Larvae of Estuarine crab Benthopanope Indica. Pollut Res 15:379–384Simpson TR (1946) Salinas barin investigation. Bulletin 52, California Division of Water Resources, Sacra-
mentoSubramanian BR (1999) Status of marine pollution of India. In: Proceeding of Indo-British integrated coastal
zone management training short-course conducted by Institute for Ocean Management, Anna University,India
The Hindu newspaper, June 05, 2003Tran KC, Euan J, Isla ML (2002) Public perception of development issues: impact of water pollution on a
small coastal community. Ocean Coastal Manage 45:405–420Williams C (1996) Combatting marine pollution from land-based activities: Australian initiatives. Ocean
Coastal Manage 33:87–112
Springer