Embed Size (px)
Citation preview

AASSSSEESSSSMMEENNTT OOFF TTHHEE PPHHAARRMMAACCEEUUTTIICCAALL SSEECCTTOORR
IINN EETTHHIIOOPPAA
OOccttoobbeerr,, 22000033
AAddddiiss AAbbaabbaa,, EEtthhiiooppiiaa
Federal Democratic Republic of Ethiopia
Ministry of Health World Health Organization

TABLE OF CONTENTS
Page
Acknowledgement v
Acronyms vii
List of Figures viii
List of Tables ix
Executive Summary x
Chapter I Introduction
1
1. Geographical and socio-demographic and data 1
2. The Health Sector 1
3. The Pharmaceutical Sector
3
Chapter II Over all context of the study 7
1. The Problem 8
2. General Objectives 8
3. Specific Objectives 8
4. Study Design and Methodology 8
4.1 Sampling Unit and Sample Size 8
4.2 Sampling Procedure 9
4.3 Survey Instruments 9
4.4 Data Collection and Co-ordination of the Survey 9
4.5 Data Management 10
4.6 Scope and Limitations of the Data
10
Chapter III Findings and interpretation of the results
11
1. Accessibility of key essential drugs 11
1.1 Availability of key essential drugs 11
ii

1.2 Stock out duration 13
1.3 Percentage of prescribed drugs dispensed to patients 14
1.4 Affordability of key essential drugs 16
2. Quality 18
2.1 Adequacy of drug storage in facilities 18
2.2 Presence of expired drugs at facility level 20
3. Rational Drug Use 22
3.1 Average number of drugs prescribed per encounter 24
3.2 Percentage of antibiotic use 24
3.3 Percentage of injections use 26
3.4 Percentage of prescribed drugs included in the EDL 26
3.5 Adequacy of labeling of drugs 26
3.6 Patient knowledge 28
3.7 Availability of STGs/ EDLs in health facilities 28
3.8 Assessment of treatment practice 30
3.8.1 Treatment of diarrhea (non-bloody, watery) in children 30
• Prevalence of ORS use 30
• Prevalence of use of antibiotic 32
• Prevalence of use of anti-diarrhea and antispasmodic drugs 32
3.8.2 Treatment of non-pneumonia ARTI 32
3.8.3 Treatment of mild/ moderate pneumonia 34
• Prevalence of use of first line antibiotics 34
• Prevalence of use of more than one antibiotic 35
4. Household Survey 36
Chapter IV Conclusion and Recommendations 40
1. Conclusion 40
2. Recommendations 41
iii

References
42
Annexes 44
Annex I National Regional States of Ethiopia 44
Annex II Six and four-tier health care delivery systems in Ethiopia 45
Annex III Distribution of Health Facilities and Households Surveyed 46
Annex IV List of Key Essential Drugs 47
Annex V Summary of national indicators 48
iv

ACKNOWLEDGMENT
The assessment of the pharmaceutical sector in Ethiopia was commissioned by the Federal Ministry of Health and conducted with the financial and technical assistance of the World Health Organization (WHO). The project was centrally coordinated by Mr Alemayehu Lemma, head of Pharmacy Administration and Supply Service (PASS) of the MOH and Mr Bekele Tefera, National Professional Officer (NPO) for Essential Drugs and Medicines policy (EDM) program of WHO Ethiopia. Miss Hadas Adugna (expert, PASS) also served as co-coordinator and field supervisor. The first draft of the study report was written by Mr Bekele Tefera, NPO/EDM of WHO Ethiopia and was reviewed by a consensus building work shop conducted on 26 August 2003 G.C. This final report, also prepared by Mr Bekele Tefera, has incorporated the comments and suggestions given by the work shop participants and the other contributors mentioned below. We would like to thank Mrs Simona Chorliet (WHO consultant) and Mr Marthin Authon (WHO consultant), who served as resource persons during the training of data collectors, supervisors and heads of Health Service and Training Departments of the six surveyed regions. We gratefully acknowledge the contribution of Mrs Helen Tatah and Mrs Diane Whitney of WHO/Geneva as well as Mr Marthin Authon for reviewing and commenting on the first draft of the report. The over all technical guidance of Mrs Diane Whitney on the report writing and the special support of Mrs Helen Tata to the study deserve special mention. Special thanks go to the following pharmacists and General Medical Practionres (GPs) who served as data collectors: Mr Tesfaye W/Kidan (Pharmacist, Tigray), Dr Atakliti Tsegaye (GP, Tigray), Dr Abebe Tefera (GP,Amhara), Mr Wosagne Muluneh (Pharmacist, Amhara), Mr Shewarega Ejersa (Pharmacist, Oromiya), Dr Nuri Shikmal (GP,Oromiya), Miss Mihiret Tilahun (SNNPR), Dr. Daniel Gemechu (GP, SNNPR), Dr Musse Kassa (GP, Beishangul –Gumuz), Mr Mathewos Haileyesus (Pharmacist, Benishangul-Gumuz), Miss Hirut Debela (Pharmacist, Addis Ababa), and Dr Mohammed Gemechu (GP, Addis Ababa). Many thanks go to the following professionals who served as supervisors in each survey region: Mrs Sofanit Mengistu ( Pharmacist, Tigray), Mr Gashaw Shiferaw (Pharmacist, Amhara), Mr Abdlumelik Ibro (Pharmacist, Oromiya), Mr mulugeta Asfaw (Pharmacist, SNNPR), Mr Haji Berisso (Pharmacist, Benishangul-Gumuz) and Mr Tamiru Yigletu (Druggist, Addis Ababa).
v

We would like to acknowledge with gratitude the contribution of all people who participated in the workshop representing the following institutions and associations: Health Service and Training Departments as well as Pharmacy Teams of all the regional health bureaus; Health Service and Training Department of the Federal Ministry of Health; PHARMID, Essential Services for Health in Ethiopia, (ESHE); School of Pharmacy (Addis Ababa university); WHO; Health, Population and Nutrition (HPN) donor group; Ethiopian Pharmacy Association; Ethiopian Medical Association and Public Health Association. Our gratitude is due to all the staff of all Public Health Care Facilities, Regional Drug Stores and Private Drug Retail Outlets surveyed for their time and effort in providing the necessary information. Lastly, we would like to extend our sincere thanks to Dr Sam Muzuki, medical officer for ICP/IMCI in the WHO country office, who proof-read the final draft report as well as to all those who assisted in one way or another to make the study a success.
vi

ACRONYMS ADR Adverse Drug Reaction ANOVA Analysis of Variance ARTI Acute Respiratory Tract Infection
Company DACA Drug Administration and Control Authority E. C. Ethiopian Calendar ECA Economic Commission for Africa EFY Ethiopian Fiscal Year EDL Essential Drugs List EDM Essential Drugs and Medicines policy ETB Ethiopian Birr FDRE Federal Democratic Republic of Ethiopia G. C. Gregorian calendar GMP Good Manufacturing Practice GDP Gross Domestic Product GNI Gross National Income HSDP Health Sector Development Program IMCI Integrated Management of Childhood Illness LIDE List of Drugs for Ethiopia Max Maximum Min Minimum MOH Ministry of Health NBE National Bank of Ethiopia NDL National Drugs List of Ethiopia NDP National Drug Policy NGO Non-Governmental Organization NHP National Health Policy ORS Oral Rehydration Salt PASS Pharmaceutical Administration and Supply Service PHARMID Pharmaceuticals and Medical Supplies Service and Wholesale Share company PHCF Public Health Care Facility PHCU Primary Health Care Unit PPD Planning and Programming Department PDRO Private Drug Retail Outlet RDS Regional Drug Stores RHB Regional Health Bureau SNNPR Southern Nations, Nationalities, Peoples Region STG Standard Treatment Guideline TGE Transitional Government of Ethiopia US$ United States Dollar WB World Bank WHO World Health Organization
vii

LIST OF FIGURES
Page Figure 1 Availability of key essential drugs in the public and private sector 12 Figure 2 Availability of key essential drug in PHCFs in six regions 12 Figure 3 Availability of key essential drugs by level of PHCFs 13 Figure 4 Key essential drugs stock out by level of PHCFs 14 Figure 5 Key essential drugs stock out in PHCFs in five regions 14 Figure 6 Extent of dispensing of prescribed drugs in PHCFs of six regions 15 Figure 7 Extent of dispensing of prescribed drugs in PHCFs by level of
PHCFs
Affordability of key essential drugs in public and private sectors
15
Figure 8 16 Figure 9 Availability of key essential drugs in PHCFs of six regions 17 Figure 10 Affordability of essential drugs by level of PHCFs 17 Figure 11 Storage condition in PHCFs in six regions 19 Figure 12 Storage condition by level of PHCFs 20 Figure 13 Magnitude of expiry of key essential drugs in PHCFs in six
regions 21
Figure 14 Magnitude of expiry of key essential drugs by level of PHCFs 21 Figure 15 Prevalence of antibiotic and injection use by level of PHCFS 25 Figure 16 Prevalence of antibiotic and injection use in PHCFs in six regions 25 Figure 17 Adequacy of labeling and patient knowledge by level of PHCFs 27 Figure 18 Adequacy of labeling and patient knowledge in PHCFS of six
regions
Availability of Standard Treatment Guidelines by level of PHCFs
27
Figure 19 29 Figure 20 Availability of Standard Treatment Guidelines in PHCFS of five
regions 29
Figure 21 Pattern of treatment of uncomplicated diarrhea in children by level of PHCFs
31
Figure 22 Pattern of treatment of uncomplicated diarrhea in children in six regions
31
Figure 23 Prevalence of antibiotic use in the treatment of non-pneumonia ARTI by level of PHCFs
33
Figure 24 Prevalence of antibiotic use in the treatment of non-pneumonia ARTI in six regions
33
Figure 25 Pattern of treatment of mild to moderate pneumonia by level PHCFs
34
Figure 26 Pattern of treatment of mild to moderate pneumonia in the six regions
35
viii
LIST OF TABLES
page Table 1 Total health budget allocation before and 10 years after the
introduction of the NDP
2
Table 2 Summary of national indicators on Access 11
Table 3 Storage condition rating 18
Table 4 Summary of national indicators on quality 19
Table 5 Summary of national indicators or rational drug use in PHCFs 23
Table 6 Age and sex distribution of respondents 36
Table 7 Disease symptoms 36
Table 8 Types of consultations 37
Table 9 Outcomes of consultations 37
Table 10 Extent of dispensing of prescribed medicines 37
Table 11 Reasons for not obtaining prescribed medicines 38
Table 12 Compliance status 38
Table 13 Sources of medicines used by the respondents 39
ix
EXCUTIVE SUMMARY
The assessment of the pharmaceutical sector in Ethiopia was conducted from November – December 2002 G.C by PASS in collaboration with the World Health Organization Country Office. The assessment was mainly based on a cross-sectional survey carried out in five national regional states (Tigray, Amahra, Oromia, SNNPR, Benishangul-Gummuz) and Addis Ababa. It involved 7 hospitals, 19 health centers, 85 health stations, 5 regional drug stores of PHARMID, 24 private pharmacies/ drug shops and 490 households. This represents respective percentage sample sizes of 11.3%, 5.5%, 4.6% 71.4% and 5.4% of the hospitals, health centers, health stations, regional drug stores and private pharmacies/drug stores found in the surveyed regions. The main objective of the study was to identify strengths and weaknesses in the pharmaceutical sector and give recommendations for improvement. Specifically, it was to see whether the target outcomes of the pharmaceutical sector (i.e. access, quality assurance and rational drug use) have been achieved and also determine whether Ethiopia has the necessary structures and mechanisms in place for improving its pharmaceutical sector. The study has shown that the necessary structures and mechanisms required for the implementation of the NDP are more or less in place and a lot of achievements have been made. However, weaknesses in the implementation of the proclamation and some elements of the NDP were noted. For example, all manufacturers except one operate without having “certificate of competence” from DACA. Only drugs imported by the private sector are subjected to registration. The drug registration process is not linked to inspection of manufacturing sites abroad. The allocated drug budget was inadequate as revealed by a low per capita government drug budget of ETB 1.6(US$ 0.18), which is much lower than the target set in HSDP I (US$ 1.25) and the WHO’s recommendation of US$ 1.00. There is no proper stock management in health facilities as revealed by absence of stock control tools such as stock card in 60 % of the surveyed health facilities. Moreover, there is no specific NDP implementation plan that sets responsibilities, budget and time line although some elements of the NDP are incorporated in HSDPI. Monitoring and evaluation of the NDP was not included as an element of the policy itself. The results of the survey have also revealed the following short comings in relation to achievement of the major out come of the implementation of the policy: Accessibility of drugs The national average for availability of key essential drugs in health facilities was 70%, 85% and 91 % for public health facilities, regional drug stores and private drug retail out lets, respectively. The figures are lower than the ideal value of 100 % and the 100 % target set in HSDP I.
x

The affordability of adult and child preparations in public heath care facilities was 135 % and 68 %, respectively. This means that approximately 1.4 days’ and 0.7 days’ salary of the lowest paid unskilled government employee is required to cover the cost of a single course of therapy of pneumonia in adult and children, respectively. On the other hand, affordability of adult and child preparations in private retail out lets was 195 % and 127 %, respectively and the same interpretation applies to this as well. From the above data, we can conclude that drugs are less available but more affordable in public health facilities than in private drug retail outlets. Average stock out durations in public health facilities and regional drug stores were 99.2 days, and 99 days, respectively. These figures are in stark contrast with the recommendation of zero stock out. Eighty-six percent of prescribed drugs are dispensed in public health facilities as compared with the ideal value of 100%. It is obvious that all the above deviations from the standard norms have a cumulative negative impact on access to essential drugs. Quality On the average, the score for storage conditions were 6 and 8 on a scale of 0-11 in public health facilities and regional drug stores, respectively. These results are equivalent to an acceptable quality of drugs. However, the significant variations between health facilities and regions indicate the need for handling individual cases separately. The national averages for presence of expired drugs in facilities were 8%, 2% and 3% in health facilities, regional drug stores and private drug retail outlets, respectively. Although the results are not alarming, the significant variation between health facilities and regions calls for precaution and further investigation. In general, it is important to note that the factors investigated here are only indirect indicators of quality. It is difficult to make conclusion about the quality of drugs in the drug supply system since variables other than those investigated here also determine the quality of drugs. Rational Drug Use
• The number of drugs prescribed per encounter was 1.9 and this is encouraging when compared with the ideal value of less than 2. However, the significant variations between health facilities and regions need careful investigation for future action.
• The percentage of antibiotic use was 58% and this is a bit high when compared with
the ideal value of less than 20% and needs improvement. • The percentage of injection use was 23% and this is an encouraging result when
compared with the accepted norm of less than 15%.
xi

• It was observed that on the average, 43% of drugs dispensed to patients in health
facilities were inadequately labeled while the accepted norm is that 100% of them should have adequate label.
• The percentage of patients who knew how to take the drugs dispensed to them was
67% as compared with an ideal value of 100%.
• Only 39% of the health facilities surveyed had Standard Treatment Guidelines (STG) or list of essential drugs for the health facility or the region.
• Oral Rehydration Salt (ORS) was used in the treatment of uncomplicated diarrhea in
children in 82% of cases as compared to an ideal value of 100%. Antibiotic and antidiarrhea/ antispasmodic drugs use was 50% and 3%, respectively, compared to the ideal value of zero percent in both cases.
• Percentage use of antibiotics in the treatment of non-pneumonia Acute Respiratory
Tract Infection (ARTI) was 61% compared to ideal value of zero percent.
• Percentage use of first line antibiotics in the treatment of mild/ moderate pneumonia was 54% compared with the recommendation of 100% use. Prevalence of use of more than one antibiotic in treating the same condition was 2% as compared to recommended value of zero percent.
Although some of the above values are close to the ideal values, most of them deviate from the ideal value and they require proper interventions as indicated in the recommendation section of this report. Household Survey The results show that the major health care providers (68%) were public heath facilities. The percentage of people who did nothing about their illness (10%) was more than those who went to the private clinics (7%). Public health facilities were the main sources of medicines (71%) followed by private pharmacies (18%) while the contribution of the informal sector as source of drugs was insignificant (< 1%). Forty-one percent of patients who could not get prescribed medicines mentioned the absence of medicine in public pharmacies as the main reason followed by lack of money (35%). The level of compliance of patients to prescriptions was 91%, partial compliance 7% and absolute non-compliance 2%. The drug expenditure to income ratio has revealed that on the average 21% of estimated family weekly income or total weekly household expense is required to cover the cost of drugs to treat a single episode of illness.
xii
Conclusion and recommendation The study has shown both strengths and weaknesses in the pharmaceutical sector, which are related to policy /proclamation implementation and achievements of the target outcomes of the sector. To improve the situation, it is necessary to implement the interventions enumerated under the “recommendations” section of this report.
xiii

Chapter I Introduction 1. Geographical and socio-demographic data Ethiopia is located in the Eastern part of Africa, which is commonly known as the horn of Africa between 3 and 15 degrees north latitude and 33 and 48 degrees East longitude. It has a surface area of 1.14 million square kilometers. With this area, Ethiopia stands as the fourth largest country in Africa. Ethiopia is bordered by the Sudan on the West, Somalia and Djibouti on the East, Eritrea on the North and Kenya on the South. The population of Ethiopia was estimated to be 67.2 million in 2001/ 2002 G.C of which 85% live in rural area. The population growth rate is estimated at 2.64% (2002 G.C). The over all dependency ratio is 102% and average household size 4.8 (2001/ 2002 G.C). The total adult literacy was 36% (46%for males and 25% for females) (1). Administratively, the Country is divided into nine National Regional States, namely, Tigray, Afar, Amhara, Oromia, Somali, Benishangul-Gumuz, Southern Nations, Nationalities and Peoples Region (SNNPR), Gambela, and Harari; and two administrative states (Addis Ababa City Administration and Dire Dawa Council). The National Regional States as well as the Administrative States are further divided into 75 Zones, 551 Woredas (districts) and around 10,000 Kebeles. There are also 2 special Zones and 10 special Woredas (Annex I). The economy is based on agriculture, and in 2002 this accounted for 52% of GDP, 85% exports and 80% of total employment. The contributions of other sectors to the GDP were industry (11%) and services (37%) (2). In 2000, GDP was US$ 6,304 million. In the same year, GNI (atlas method) was US$ 6.7 billion representing a per capita of US$ 100 while GNI (Purchasing power parity) was US$ 42 billion representing purchasing power parity per capita of US$ 660. Average annual percentage growth of GDP (1990-2000 G.C) was 4.6. (2). 2. The Health Sector
The health care delivery system is guided by a National Health Policy (NHP) which was issued in September 1993 and a Health Sector Development Program (HSDP) as of 1990 E. C. (1997/ 98 G. C.). The HSDP, which was designed for a period of 20 years with rolling five-year programs, has provided a long-term plan frame work for the heath sector. The first phase of HSDP covered the period 1990 E. C. – 1994 E. C. (1997/98 - 2001/02 G.C.). The second phase (HSDPII) was started on July 2002 G.C and it covers a three year period, 1995 – 1997 E. C. (2002/03-2004/05 G.C) in order to synchronize it with the Five-year national development plan of the government. The HSDP has eight components one of which is “Strengthening the Pharmaceutical Sector”.
1

According 2001/ 2002 G.C estimate, 60 – 80% of the health problems of the country are due to infectious and communicable diseases and nutritional problem. Health service coverage was 51.8%, infant mortality rate 113 per 1000 live births, maternal mortality rate 871/100,000 live births, under 5 mortality rate of 188 per 1000 live births and life expectancy at birth of 53.4 years for males and 55.4 years for females. In 2001/02, the health personnel to population ratio were 1:35,604 for physicians, 1:5,236 for nurses, 1:8249 for health assistants, and 1:569,661 for pharmacists and 1:84,767 for pharmacy technicians. Total government health budget in 2001/ 2002 G.C was 1053.2 million ETB (US$ 122.5 million) and of which 549.6 million ETB (US$ 63.9 million) was recurrent budget. The per capita government recurrent health budget was 8.2 ETB (US$ 0.95). (1). The over all trend of government health budget allocation shows significant increase over 1985 EFY. (1993/ 94 G.C). (Table 1).
Table 1 Total health budget allocation before and 10 years after introduction of the NDP
Recurrent health budget allocated
Per capita EFY(G.C)
Million ETB(US$)* ETB(US$)* 1985 (1992/93) 196.7 (39.3) 3.8 (0.76) 1994 (2001/2002) 549.6 (63.9) 8.18(0.95) Change (%) 179 (62.6) 115(25) Exchange rate 1US$= ETB 5 (in 1985 E.C) and ETB= 8.6 (in 1994 E.C)
Source: Health and health related indicators, PPD, MOH, 1992 E.C & 1994 E.C * Author’s conversion The Ministry of Heath is the major provider of health care followed by the private sector, Non-Governmental Organizations (NGOs) and other governmental organizations. The Federal Ministry of Heath is the central body in charge of the heath care system of the country. Each of the nine National Regional States and the two Administrative States has a Regional Heath Bureau (RHB), Zonal Heath Departments and District Health Offices. However, as a result of the recent restructuring measures, the over all organization of the health services in each region or council is the responsibility of the Regional Heath Bureau and the District Heath Offices. Eventually, the Zonal health Departments are to be phased out The actual delivery of health service is carried out by the different levels of heath care facilities, which were structured in six-tier heath care delivery system (Annex II). The community health posts are the first contact points and act as bridge between the community and conventional heath services. The heath stations were the lowest level of the conventional health care system. In this organizational structure, each higher health care facility supports and serves as a referral health unit for the one below it.
2

The first phase of the Health Sector Development Program (HSDP I) had introduced a four-tier health service delivery system with primary health care units (PHCU) at the base followed by District Hospitals, Zonal Hospitals and Specialized Hospitals up the hierarchy in that order (Annex II ). A PHCU consists of a heath center and five satellite health posts. The health stations are to be either down graded to health posts or upgraded to health centers in course of time. In 2001/ 2002 G.C, there were 155 hospitals, 412 health centers, 2,452 heath stations, 1,311 health posts and 1,235 private clinics. Hospitals are further classified into three levels: specialized hospitals (5) zonal hospitals (40) and district hospitals (34) from higher to lower levels. In regard to training facilities, there are 5 universities which train different categories of mid-level to high level health personnel and other 22 training schools which also train low-level to mid-level health workers (1). 3. The Pharmaceutical Sector Policy and regulation The pharmaceutical sector is guided by a National Drug Policy (NDP), which was developed in 1993 G.C in line with the National Health Policy (3). There is no specific NDP implementation plan that set responsibilities, budget and timeline although some elements of the NDP are incorporated in the Health Sector Development Plan of the country. The sector is regulated by the “Drug Administration and Control Proclamation No. 176/199, which was promulgated on 29 June 1999 G.C. This proclamation has superceded the former regulation called “Pharmacy Regulation No. 288/ 1964”, which formed the legal basis for official establishment of drug regulation in Ethiopia. “The Pharmacy and Laboratory Department” was the first drug regulatory body established under the Ministry of Health by the Pharmacy Regulation No. 288/ 1964. The department performed drug regulatory activities as well as the registration of pharmacy personnel. Following the passage of proclamation No 176/ 1999, the pharmacy department was transformed to an independent drug control authority named “Drug Administration and control Authority (DACA)” which became operational on September 2001 G.C. DACA inspects manufacturers, wholesalers, drug retail outlets as well as pharmacy units in health care facilities. It issues certificates of competence to private manufacturers, wholesalers and drug retail outlets while trade licenses are issued by the Ministry of Trade. DACA has different written guidelines and inspection check lists.
3

According to the above proclamation, DACA can establish its own branch offices in the regions. But, so far, no branch office is opened. Instead, the Regional Health Bureaus are delegated to undertake inspection and licensing of drug retail outlets. Proclamation No. 176/ 1999 defines the objectives, powers and duties as well as organization of DACA. Products covered by the proclamation include human and veterinary drugs, traditional medicine, pesticides, animal food additives, poisons, blood and blood products, vaccines, sera, radio active pharmaceuticals, cosmetics, sanitary items, medical instruments and Medical supplies. The proclamation has provisions for regulatory activities such as drug registration, inspection, quality control, post marketing surveillance, control of clinical trial, drug information and advertisement, packaging and labeling of products. It also states the need for obtaining license for import, manufacture, wholesale and retail activity. But, it does not include requirements for obtaining such licenses. Regulations based on the proclamation have been drafted and submitted to the council of Ministers for approval. The proclamation stipulates that any form of drug advertisement must be approved in advance by DACA. A drug information and Adverse Drug Reaction (ADR) monitoring unit has been established and ADR monitoring as well as dissemination of drug information to health professionals is recently initiated. Generic prescribing is advocated in both public and private sector but it is not obligatory. Generic substitution is also being practiced but has neither legal support nor prohibition. Drug evaluation and registration system exists. The process involves assessment of the safety, efficacy and quality of products through clinical and Pharmaco-chemical data evaluation as well as laboratory quality control. Submission of WHO-type certificate is a requirement for products to be imported. There is a written guide line indicating the above and other requirements. However, the registration process is not linked to Good Manufacturing Practice (GMP) inspection of manufacturing plants. According to article 16 of the proclamation, “no drug, whether produced locally or imported, shall be put to use unless it is duly registered by the Authority” (4). However, in practice, the registration focuses on products imported by the private sector. Locally manufactured products and those imported by the public sector are not subject to registration. Delay in the registration process is a problem often mentioned by clients. The registration system is computerized and to date 3258 products are registered. But there is no list of registered products accessible to the public domain. Quality assurance of pharmaceuticals Following the promulgation of proclamation No. 176/1999, the old established drug quality control and toxicology laboratory was structured under DACA. It undertakes Physico-Chemical tests, Pyrogen tests, sterility test and toxicological tests. In 2001 G.C, a total of
4
294 samples were received by the laboratory: 2 taken from private pharmacies, 16 for public procurement, 31 for GMP inspection and 246 for registration purpose. 213 samples were tested the same year out of which 15 have failed the test. Selection There is a “List of Drugs for Ethiopia (LIDE)", July 2002 G.C edition, and it is further classified by level of health care facility. The list consists of international non proprietary (generic) names of drugs that can be imported or locally produced and it is also the basis of drug registration (5). A National Essential Drugs list (EDL) containing 234 chemical entities was prepared in 1987 G.C. as an extract from the LIDE which was called “National Drugs List (NDL)” at the time. But, the EDL has never been revised and published since then (6). Import and distribution Import and wholesale are done by the public sector, private sector, NGO's and international organizations. The Pharmaceutical Administration and Supply Service (PASS) of the Ministry of Health and the Pharmaceutical and Medical Supply Import and Wholesale Share Company known as PHARMID (semi-governmental organization) are responsible for import and distribution to the public sector. PHARMID has eight wholesale distribution branches (2 in Addis Ababa and 6 in different regions). The public procurement is done through international and local tenders as well as by direct purchasing or negotiation. It is limited to the LIDE. Guideline on drug donation is prepared in the local language. In the private sector, the total number of importers /wholesalers has increased from only 11 in 1993 G.C to 42 in 2002 G.C. Procurement in the private sector is done by direct order to manufacturers abroad and it is also limited to the LIDE. The drug retail activity is done by the public sector, private sector, city councils, and the Red Cross society of Ethiopia. This sub-sector has also shown significant growth in number of outlets during the last decade. In 2000/ 2001 G.C, there were 311 pharmacies (run by pharmacy degree graduates), 249 drug shops (run by pharmacy diploma graduates or equivalent), and 1971 rural drug vendors (run by nurses or health assistants or pharmacy technicians). Moreover, each health care facility has its own pharmacy unit / dispensary. According to the Ministry of health, the potential coverage, defined as percentage of the population within 10 km of a health station (walking distance), is estimated at 51.2 % in 1993 E.C (2000/01 G.C). Indirectly, this shows that the percentage of the population which has geographical access to essential medicines is more than 51.2 %. (7)
5
Production In 1993 G.C, there was only one local pharmaceutical manufacturing plant and it was owned by the government. Currently, drug production activity is being under taken by 13 local pharmaceutical manufacturing plants: One government owned, eleven private (unaffiliated with multinationals) and one private (affiliated with multinationals). Three of the factories are engaged in medical supplies production, one on empty gelatin capsule production and nine on finished product formulation using imported raw materials. However, only one of them has a certificate of competence from DACA. There is no price control on pharmaceuticals. Both finished products and raw materials are subject to taxation, except anti retro viral drugs. Drug financing Sources of drug financing include government finance, private expenditure (i.e. user charges or out of pocket payments), external assistance, loan, and private health insurance. There are no updated figures on the contribution of each source although the National Health Accounts exercise in 1995/ 96 indicated that the private expenditure on drugs accounts for the largest share of the total estimated drug expenditure in the country. In 2001/ 02 G.C, the total government drug budget was about 104 million ETB (US$ 12.1 million) which is approximately 19% the recurrent government health budget and represents a per capita drug budget of ETB 1.6(US$ 0.18). This is very low as compared with the target set in HSDP I (US$ 1.25) and WHO’s recommendation of US$ 1.00 (8). According to PASS, the total drug expenditure* of the Ministry of Health in 2002 G.C. was estimated at ETB 257.9 million (USD 30 million) representing a per capita drug expenditure of ETB 3.8 (US$ 0.44). No reliable data is available on the drug expenditure of the private sector and other sectors. According to the National Bank of Ethiopia (9), the total value of import of “medical and pharmaceuticals” in 2001/02 G.C was ETB 421.3 million (US$ 49 million). However, this category includes non-drug items as well and the value for drugs alone is lower than this figure. The government owned health facilities provide free health care including drugs to poor patients upon submission of letters from local administration offices. Anti-TB drugs are also provided free of charge to all patients. Rational Drug use The Ministry of Health has prepared Standard Treatment Guidelines (STG) for six types of diseases and has distributed them to health care facilities. A national formulary based on the LIDE (2001G.C) is under preparation by DACA. * Includes: Regular MOH’s drug budget of 104 million ETB, Loan 47.7 million ETB, and donation of 106.2 million ETB.
6

The concept of essential drugs is part of the basic curricula of pharmacists and pharmacy technicians. Public education on rational use of drugs is being given by DACA through the mass media. There is no mandated continuing education program for health professionals, except that pharmacy and medical associations occasionally organize continuing education programs for their members.
7

Chapter II Over all context of the study 1. The Problem The national drug policy of Ethiopia has been in implementation over the last nine years. However, formal monitoring and evaluation of the implementation has not been undertaken in a comprehensive manner. Previous studies conducted at different times focused either on specific issues or were limited in scope and size making national and international comparison difficult. This study aims at bridging this gap. 2. General objectives To identify strengths and weakness in the pharmaceutical sector and give recommendations for future improvement 3. Specific Objectives • To assess whether Ethiopia has the necessary structures and mechanisms in place for
improving its pharmaceutical sector • To examine the processes of implementing the pharmaceutical strategies • To determine whether the target outcomes of the pharmaceutical sector (i.e. access,
rational drug use and quality assurance) have been achieved • To contribute to the international efforts to identify and examine trends of the global
forces which affect the pharmaceutical sector. 4. Study design and Methodology 4.1 Sampling unit and sample size The survey was carried out on 7 hospitals, 19 health centers, 85 health stations, 5 Regional Drug Stores (RDSs) owned by PHARMID, 12 private Pharmacies and 12 private drug shops collectively referred to as Private Drug Retail Outlets (PDROs), 5 special pharmacies and 490 house holds. This represents 11.3%, 5.5%, 4.6% 71.4%, 5.2% and 5.7% of the hospitals, health centers, health stations, regional drug stores, private pharmacies and private drug stores found in the surveyed regions in 1993 E.C(2000/2001G.C). All the hospitals, health centers and health stations are owned by the Ministry of Health. Hereafter, they are collectively referred to as Public Health care Facilities (PHCFs). These facilities were distributed in the six survey regions, namely, Tigray, Amhara, Oromia, SNNPR, Benishangul-Gumuz and Addis Ababa (the capital city). The summery of their distribution in the six survey regions is shown in annex III & IV.
8

4.2. Sampling Procedure The five survey regions were randomly selected from 9 National Regional States in the country and the capital city-Addis Ababa was included according to the recommendation of the standard procedure. The list of all PHCFs and PDROs in the survey regions was prepared and the required samples were selected using the lottery method. One RDS was taken from each survey region, except Benishangul-Gumuz region, which didn't have any RDS. Approximately 5 households were randomly selected in the vicinity of each PHCF surveyed. 4.3. Survey Instruments Data on existing infrastructure and key processes in each component of the pharmaceutical sector were collected at a national level using WHO's standard questionnaire for level I indicators (Annex VII) and the salient points of the findings are summarized in the introduction section (see ‘the pharmaceutical sector’). In order to gather systematic data on the degree of attainment of the NDP objectives: access, rational drug use and quality of drugs, a cross-sectional baseline survey was undertaken using WHO's standard survey formats for outcome (level II) indicators. A house hold survey was also carried out using a structured questionnaire. (Annex VIII). 4.4. Data collection and Co-ordination of the survey Six data collection teams were formed (i.e. one team per survey region) and each team was composed of one medical doctor and one pharmacist officially assigned by the health bureaus in the survey regions. The heads of the pharmacy teams in the health bureaus of the survey regions served as Supervisors. The over all activity was centrally coordinated by the head of the Pharmaceutical Administration and Supply Service (PASS) of the Ministry of Health and the National Professional Officer for Essential Drugs and Medicines policy(EDM) in the WHO country office. Before the survey was started, the data collectors, supervisors and heads of health service & training departments in the health bureaus of the six regions were trained for four days (8-11 October 2002 G.C) in Addis Ababa. At the end of the training, field-testing of the survey tools was done. Two consultants sent from WHO Headquarter participated in the training as facilitators. The cross-sectional baseline survey was then conducted between November- December 2002 G.C and data collected from each region (each data collection form signed by the head of the facility surveyed and bearing the seal of the facility) were assembled and sent to the centre by each regional health bureau.
9

4.5. Data Management Data collected from all the survey regions using the standard data collection forms were coded, checked for accuracy, consistency, omissions and irregularities. They were then entered into Microsoft excel 2002 and summarized using the standard summary forms. All the required statistical analysis was done using excel 2002, except Analysis of Variance (ANOA) which was done using Epi.Info version 6. 4.6. Scope and Limitation of the Data The indicators used in the survey do not measure all aspects of the pharmaceutical sector. Moreover, most of the estimates are based on a one point in time observation. Therefore, the results of the study must be understood as first-line indicators for further questioning and subsequent action (10).
10

Chapter III Findings and interpretations of the results 1. Accessibility of key essential drugs
Access to essential drugs is a prerequisite for delivery of proper health care. The data on access, which were generated during the survey, are summarized in table 2 below and discussion on each access component follows.
Table 2 Summary of National indicators on access Public Health Care Facilities (PHCFs)
Regional Drug Stores (RDSs)
Private Drug Retail outlets (PDROs)
Indicator
Mean Median
Mean Median Mean
Median
Percentage availability 69.83 (n=111)
75 85 (n=5)
83 90.96 (n=24)
92
Affordability (adult) 135% (n=76)
141 195% (n=24)
188
Affordability (Children) 67.69% (n=96)
71.5 127% (n=24)
119
Average stock out duration (days)
99.22 (n=45)
91 99 (n=3)
103
Percentage of prescribed drugs dispensed
85.48 (n=105)
94
1.1. Availability of key essential drugs
To measure the physical availability of essential drugs, 12 key essential drugs, which are used to treat the most common health problems in the country, were selected at a national level (Annex IV). In order to collect the required data on physical availability of these drugs, a prospective survey was undertaken in Public Health Care Facilities, Regional Drug Stores and private drug retail outlets using standard survey forms. The essential drugs, which were physically available in the facilities, were identified and recorded in the format. The percentage availability of key drugs was calculated using the standard formula and the following results were obtained: Table 2 above shows that the national average availability of key drugs was 70% in PHCFs (Min 0, Max 100), 85% in RDSs (Min 75, Max 92) and 91% in PDROs (Min 75, Max 100).
11

The availability in PHCFs is lower than the ideal value (100%) and the100% target set in HSDP I (11, 12). It is also lower than that of PDROs (Figure 1) with significant mean variation (P< 0.05). Average availability of key essential drugs in PHCFs in the six regions (Figure 2) varied between 65 %(Amhara region) and 90% (Tigray region)showing relatively highest availability of essential drugs in Tigray region and lowest availability in Amhara region. However, the mean variations for both adult and children products were found to be insignificant (P>0.05).
Figure 1 Availablity of key essential drugs in the public and private sectors
0102030405060708090
100
Public sector Private sector
%Availablity
Figure 2 Availablity of key essential drugs in PHCFs in six regions
0102030405060708090
100
Tigray
Amhara
Oromia
SNNPR
Benish
ang-G
um
Addis
Ababa
Nation
al
%Availablity of keyEssentail drugs
12

The three levels of PHCFs were also compared (Figure 3) and average availability was found to be 88.3%, 76.8% and 66.7% in hospitals (n=7), health centers (n=19) and Health stations (n=58), respectively. But, the mean variation was insignificant (P > 0.05). The result indicates comparatively highest availability of essential drugs in hospitals but lowest availability in health stations. Availability of the key essential drugs in the PDROs of the six regions varied between 83% (Addis Ababa) and 94.1% (Benishangul-Gumuz) with insignificant mean variation (P> 0.05).
Figure 3 Availablity of key essential drugs by level of PHCFs
0102030405060708090
100
Hospitals Health ceters Health stations
%availablity of keydrugs
1.2. Stock out duration To measure the historical availability of key essential drugs to treat common health problems, a retrospective survey was undertaken by reviewing the stock cards of the facilities covering a period of 6-12 months. The number of days for which key essential drugs were not available (when the stock was zero) within the review period were recorded in the standard survey format. The average stock out duration was then calculated at each facility level, at regional and national level using the standard formula. From table 2, the national average stock out duration in PHCFs (n=45) was 99.2 days (Min 0, Max 335). In the RDSs (n=3), it was 99 days (Min 81, Max 113.42). The above significant stock out duration compared with the objective norm of no stock out duration shows either inadequate finance and/or poor drug supply management.
13
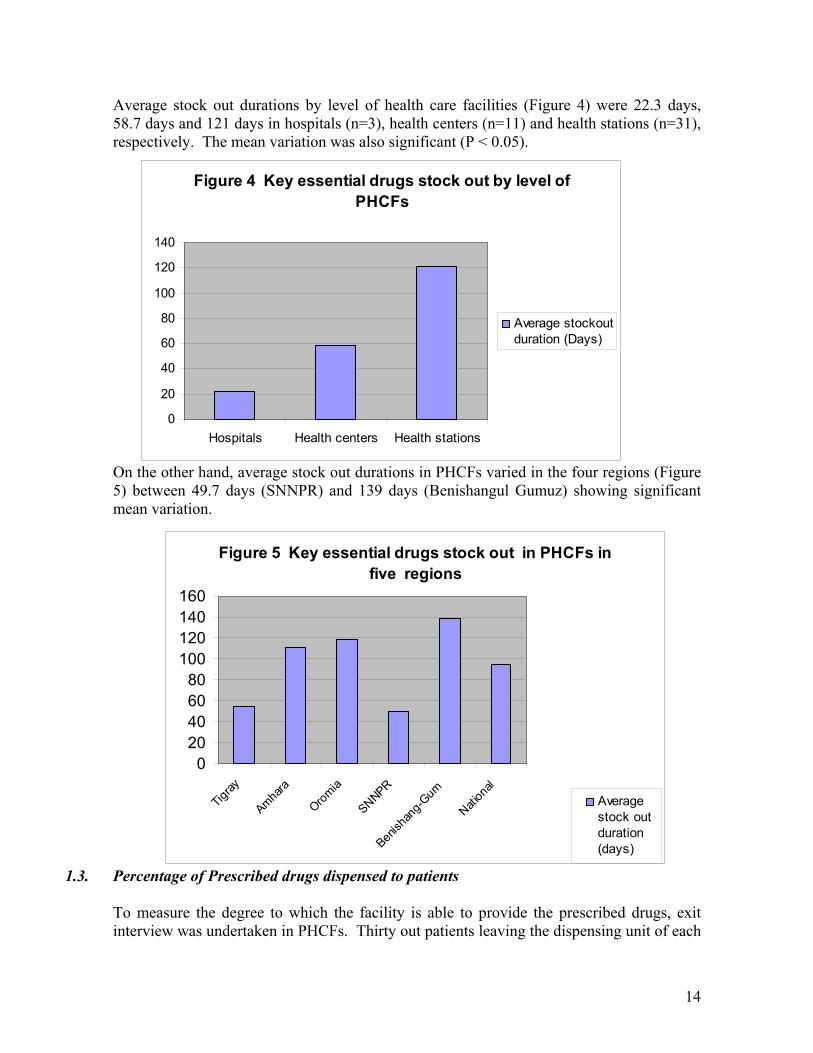
Average stock out durations by level of health care facilities (Figure 4) were 22.3 days, 58.7 days and 121 days in hospitals (n=3), health centers (n=11) and health stations (n=31), respectively. The mean variation was also significant (P < 0.05). On the other hand, average stock out durations in PHCFs varied in the four regions (Figure 5) between 49.7 days (SNNPR) and 139 days (Benishangul Gumuz) showing significant mean variation.
Figure 4 Key essential drugs stock out by level of PHCFs
0
20
40
60
80
100
120
140
Hospitals Health centers Health stations
Average stockoutduration (Days)
Figure 5 Key essential drugs stock out in PHCFs in five regions
020406080
100120140160
Tigray
Amhara
Oromia
SNNPR
Benish
ang-G
um
Nation
alAveragestock outduration(days)
1.3. Percentage of Prescribed drugs dispensed to patients To measure the degree to which the facility is able to provide the prescribed drugs, exit interview was undertaken in PHCFs. Thirty out patients leaving the dispensing unit of each
14

facility on the day of the survey were interviewed. Data collectors also checked the number of drugs dispensed to each patient out of the total prescribed drugs. Then, the percentages of drugs dispensed were calculated at facility level, regional level and national level using the standard formula. The results obtained are indicated below: Table 2 above shows that the percentage of prescribed drugs that were dispensed in PHCFs was 85.5% and when compared with an ideal value of 100%, it shows lower ability of PHCFs to provide essential drugs. However, it is not different from situations in other developing countries (12). The percentage of prescribed drugs dispensed varied in the six regions (Figure 6) between 63% (Addis Ababa) to 98.4% (Benishangul-Gumuz) showing relatively highest availability of prescribed drugs in Benishangul-Gumuz but lowest availability in Addis Ababa. The mean variation was also significant (P < 0.05). The three levels of health care facilities were also compared (Figure 7) and the figures were 82.9%, 81.3% and 86.7% in hospitals (n=7), health centers (n=19) and health stations (n=79), respectively. But the variations were not significant (P >0.05). In relative terms, health stations have shown the best ability to provide prescribed drugs while the health centers had the least ability
Figure 6 Extent of dispensing of prescribed drugs in PHCFs in six
regions
020406080
100
Tigray
Amhara
Oromia
SNNPR
Benish
ang-G
um
Addis
Ababa
Nation
al
% Prescribeddrugs dispensed
15
Figure 7 Extent of dispensing of prescribed drugs by level of PHCFs
0102030405060708090
100
Hospitals Health ceters Healthstations
% of prescribeddrugs dispensed

1.4. Affordability of key essential drugs
The purpose of this indicator is to measure affordability of basic drug treatment as an indicator of access to essential drugs. In this study, the affordability of treating moderate pneumonia (without hospitalization) in both adults and children is assessed by comparing the total cost of a full course of therapy with the lowest daily government salary (approx. 6.7 ETB or US$ 0.8). More formally, affordability is expressed as the ratio of the cost of treating moderate pneumonia to the lowest daily salary of unskilled government worker. Amoxicillin 250mg or 500 mg capsules and Cotrimoxazole (200+40) mg/5ml oral suspension were chosen as drugs of choice for pneumonia in adult and children, respectively. The treatment cost as % of the lowest daily salary of an unskilled government employee is calculated at facility level (both public and private), at regional and national level. In PHCFs, the national average for affordability of treatment cost was 135% for adults and 67.7% for children (Table 2). These figures show that approximately 1.4 days' and 0.7 days' wage of the lowest paid unskilled government worker are required to cover the cost of a single course of therapy of pneumonia in adults and children, respectively. In the PDROs, affordability for adult was 195% while for children it was 127% (Table 2). Comparison of affordability (both for adult and child) between the public sector and private sector (Figure 8) shows that treatment costs are more affordable in the public sector than the private sector. The mean variation was also insignificant (P > 0.05). Affordability for adult in PHCFs varied in the six regions (Figure 9) between 97% (Tigray) to 158% (SNNPR) while affordability for children varied between 33% (Tigray) to 99%
Figure 8 Affordablity of key essential drugs in public and private sectors
0
50
100
150
200
250
Public sector Private sector
% Affordablity for adults
% Affordablity forchildren
16

(Benishangul-Gumuz). In both cases, treatment costs are lowest in Tigray. The overall mean variation between the regions was significant (P < 0.05). When considered by level of health care facilities, affordability for adult were 133%, 143.8% and 132.2% for hospitals (n=7), health centers (n=18) and health stations (n=51), respectively. This shows that adult treatment costs are best affordable in health stations but least affordable in health centers. On the other hand, affordability for children were 84.7%, 60.9% and 68.1% in hospitals (n=6), health centers ((n=19) and health stations (n=71), respectively. It indicates that pediatric preparations are best affordable in health centers but least affordable in hospitals (Figure 10). But, the mean variations in both cases (adult & children) were not significant (P > 0.05). It is also interesting to note that in all cases, irrespective of the sector and the level of health care facilities; pediatric preparations were relatively more affordable than adult preparations.
0
20
40
60
80
100
120
140
160
Tigray Amhara Oromia SNNPR Benishang-Gum
AddisAbaba
National
Figure 9 Affordablity of key essential drugs in PHCFs in six regions
% Affordability for adults% Affordability for children
17
0
20
40
60
80
100
120
140
160
Hospitals Health ceters Healthstations
Figure 10 Affordablity of key essential drugs by level of PHCFs
% Affordablity foradults
% Affordablity forchildren

2. Quality
2.1. Adequacy of drug storage
The purpose of this indicator is to determine the status of essential drugs storage in public health care facilities and regional drug stores as one factor that affects drug quality. The following eleven conditions were taken as ideal drug storage conditions:
Availability of functional locks Cleanliness (absence of litter and dust) Absence of signs of pests Roof ceiling Availability of windows which can be opened or presence of Vents Protections from direct sunlight Freedom from moisture and absence of stocks on the floor Separation of storage and dispensing area Drugs placed/sorted in a systematic way Availability of stock record system Availability of cold storage with temperature chart.
The storage condition in both the drug store and dispensing unit/area were assessed against these criteria using a check list and rated according to the following scores:
Table 3 Storage condition rating
Storage condition Rating Equivalent rating for quality of drugs Poor 0-3 Quality may be poor Not adequate 4-5 Quality may be adequate Moderately adequate 6-7 Acceptable quality Adequate 8-10 Acceptable quality More than adequate 11 Good quality
The average scores of the two compartments were taken as the total score for over all storage condition in each facility. Regional and national scores were also calculated by aggregating the scores of the facilities. The national data thus generated are summarized below:
18

Table 4 Summary of national indicators on quality
PHCFs RDSs PDROs Indicators Mean Median Mean Median Mean
Median
Storage condition rates (on a scale of 0-11 scores)
5.98 (n=111)
6 8 (n=5)
8
Percentage of expired drugs
8.24 (n=111)
0 2 (n=3)
0 3 (n=24)
0
From Table 4 above, we can see that the overall facility storage scores for PHCFs was 6 (Min 3, Max 10) meaning a moderately adequate storage condition indicating acceptable quality of drugs. However, it was lower than the storage condition in RDSs, which had a score of 8 (min 5, Max 11) showing a relatively lower quality of drugs. Storage conditions varied in the six regions (Figure 11) between 5 (in Amhara region) to 8 (in Addis Ababa) showing significant mean variation (P <0.05). In equivalent terms, the quality of drugs range from probable adequacy in Amhara region to acceptable quality in Addis Ababa. Comparison of storage condition by level of health facilities also revealed that the scores for hospitals (n=7), health centers (n=19) and health stations (n=85) were 7.4, 7.5 and 5.5, respectively (Figure 12) showing significant mean variation (P < 0.05). It shows that quality of drugs is least in health stations but best in health centers. However, it is important to note that the quality of all drugs at all levels is “acceptable”.
Figure 11 Storage Condition in PHCFs in six regions
0123456789
1011
Tigray
Amhara
Oromia
SNNPR
Benish
ang-G
um
Addis
Ababa
Nation
al
Storage conditionscores
19

Figure 12 Storage condition by level of PHCFs
0123456789
1011
Hospitals Healthcenters
Healthstations
Storage conditionscores
2.2. Presence of expired drugs at facility level The Purpose of this indicator is to determine if expired drugs are being distributed or sold as one indicator of quality of drugs. The actual process involved checking the expiry dates of the 12 selected key essential drugs available in health facilities, regional drug stores or private retail outlets. Percentage of expired drugs was then calculated at facility level, regional level and national level. Table 4 above shows that the national percentages of expired drugs were 8.2% in PHCFs (min 0, Max 67), 2% in RDSs (Min 0, Max 8), and 3% in PDROs (Min 0, Max 25). In relative terms, the quality of drugs appears to be best in RDSs and least in PHCFs. The percentage of expired drugs varied in the six regions (Figure 13) between 3% (in Tigray) to 38% (in Benishangul-Gumuz) showing very significant mean variation (P <<0.05). This means that, in relative terms, quality of drugs is best in Tigray but least in Benishangul-Gumuz.
20

When compared by level of health facilities, percentages of expired drugs were 13.1, 9.7 and 7.5 in hospitals (n=7), health centers (n=19) and health stations (n=85), respectively (Figure 14). But the mean variation was insignificant (P>0.05). The figures show that quality of drugs is relatively best in health stations but least in hospitals.
Figure 13 Magnitude of expiry of key essental drugs in PHCFs in six regions
0
10
20
30
40
50
60
70
80
90
100
Tigray
Amhara
Oromia
SNNPR
Benish
ang-G
um
Addis
Ababa
Nation
al
%expireddrugs
Figure 13 Magnitude of expiry of key essental drugs in PHCFs in six regions
0
10
20
30
40
50
60
70
80
90
100
Tigray
Amhara
Oromia
SNNPR
Benish
ang-G
um
Addis
Ababa
Nation
al
%expireddrugs
Figure 14 Magnitude of expiry of key essential dugs by level of PHCFs
0102030405060708090
100
Hospitals Health centers Health stations
% of expired drugs
21
22
3. Rational Drug Use
To assess the drug use situation in Public Health Care Facilities, the records of 30 general outpatients seen within the last 6-12 months in each health facility were selected following a standard selection procedure and the following common drug use indicators were calculated (Table 5).

23
Table 5 Summary of national indicators on rational drug use in PHCFs
Indicators Therapy Mean MinMedian Max
Percentage of ORS use 81.87 (n=107)
90 10 100
Percentage of antibiotic use 49.63 (n=107)
50 0 100
Treatment of diarrhea (watery, non bloody) in children
Percentage of anti-diarrhea and/or antispasmodic drugs use
2.55 (n=102)
0 0 40
Treatment of Non-pneumonia ARTI Percentage of antibiotic use 60.69 (n=106)
70 0 100
Percentage of use of any one of the first line antibiotics (procaine penicillin injection, Amoxicillin, Cotrimoxazole)
54.1 (n=106)
50 0 100Treatment of mild/moderate pneumonia
Percentage of use of more than one antibiotic 2.36 (n=106)
0 0 30
Average number of drugs per encounter 1.99 (n=111)
1.97 0.8 3.33
Percentage of antibiotic(s) per encounter 58 (n=111)
57 3 100
Percentage of injection(s) per encounter 26.98 (n=111)
23 0 90
Percentage of drugs adequately labeled 42.66 (n=105)
46 0 100
Percentage of patient with adequate knowledge 67.36 (n=106)
70 0 100
Percentage availability of STG 39 (n=108)
0 0 1
Percentage availability of regional or facility EDL in the facility 1< (n=105)
0 0 1

3.1. Average number of drugs prescribed per encounter
In order to determine the prevalence of poly pharmacy, which is one measure of unnecessary prescribing, the number of drugs prescribed for each case was counted and the average number of drugs per encounter at facility level, regional level and national level calculated. In this process, a drug given in different forms (e.g. paracetamol tablet/syrup) or two names (brand/generic) of the same chemical entity, and combinations were counted as one. The national average number of drugs prescribed per encounter was approx. 2.0 (Min 0.8, Max 3) and this shows acceptable prescribing practice when compared with the ideal maximum value of 2 (12). Similar studies conducted in 1991/92 (13) and in 1997 (14) have reported 1.82 and 2.1 drugs per encounter, respectively. The current figure shows a slight decline from the former result but an improvement over the later finding. Average numbers of drugs per encounter by level of health facility were 1.7, 2 and 2 for hospitals (n=7), health centers (n=19) and health stations (n=85) showing a better prescribing behavior in hospitals as compared with health centers and health stations, which have equal standing. On the other hand, average numbers of drugs per encounter varied in the six study regions between 1.6 (Addis Ababa) and 2.3 (Benishangul Gumuz) showing significant mean variation (P<0.05).The figures show that prescribing behavior is relatively best in Addis Ababa but least in Benishangul-Gumuz.
3.2. Percentage of antibiotic use
Drugs belonging to the following categories in the 4th edition of the Lists of Drugs for Ethiopia (July 2002) were considered as antibiotic: Penicillins (AI 101), Other anti bacterials (AI 102), Topical anti infectives that are similar to the drugs in the previous two groups (DE100), and ophthalmic anti bacterials (OP300). To determine the prevalence of antibiotic prescribing (over prescribing of antibiotics is one common type of inappropriate use), the number of cases for which antibiotics were prescribed was counted and the percentage of antibiotics prescribed was calculated at facility level, regional level and national level. In this process, a case with one or more antibiotics order was counted as one. The national average for percentage of antibiotic per encounter was 58% (Min 3, Max 100) with a very wide range of 97.
24

Previous studies conducted in 1991/92 and 1997 (13, 14) have found 58.34% and 53.60%, respectively, which are similar to the current study result. By level health facility, the average percentage antibiotic use was 55.43%, 62.26% and 57.26% for hospitals (N=7), health centers (n=19) and health stations (n=85), respectively. The mean variation was insignificant (P>0.05). (Figure 15) The figures imply a relatively best prescribing behavior in hospitals but least in health centers. The average percentage antibiotic use also varied in the six regions (Figure 16) between 44.2% (Benishangul-Gumuz) to 87.7% (Addis Ababa) showing significant mean variation (P<0.05). The results indicate relatively best prescribing behavior in Benishangul-Gumuz but least in Addis Ababa.
0
20
40
60
80
100
Hospitals Health ceters Healthstations
Figure 15 Prevalence of antrbiotic and injection use by level of PHCFs
% antibiotics use% Injection use
25
Figure 16 Prevalence of antibiotic & injection use in PHCFs in six regions
0102030405060708090
100
Tigray
Amhara
Oromia
SNNPR
Benish
ang-G
um
Addis
Ababa
Nation
al
%Antibiotic use%Injection use

3.3. Percentage of injection use
To determine prevalence of injection use, the number of encounters in which one or more injections is prescribed was counted (excluding immunizations and injectable contraceptives) and the percentage use of injections calculated at facility level, regional level and national level. The national average for percentage of injections per encounter was 23% (Min 0, Max 90) with a very wide range of 90. However, it is very close to the ideal maximum value of 20% showing nearly acceptable prescribing behavior. Moreover, it shows an improvement over the result of previous studies conducted in 1991/92 (12) and 1997 (13), which reported 39.43% and 31.06% respectively. By level of health facility, the average percentages of injections per encounter were 15.9%, 17% and 30.1% in hospitals (n=7), health centers (n=19) and health stations (n=85), respectively (Figure 15). The mean variation was significant (P<0.05). From these figures, we can deduce that, in relative terms, hospitals have the best prescribing practice followed by heath centers. Average percentage of injections per encounter varied in the six regions (Figure 16 ) between 17.5% (Tigray) to 32.7% (Addis Ababa) but the mean variation was insignificant (P>0.05).The figures indicate relatively best prescribing practice in Tigray but least in Addis Ababa.
3.4. Percentage of prescribed drugs included in the EDL
Ethiopia does not have current national EDL. Therefore, it was not possible to measure the degree to which prescribing practices conform to the national EDL.
3.5. Adequacy of Labeling of drugs
A national consensus was reached that "adequate label" means a label bearing the name, strength, quantity, dosage and duration of treatment of the drug dispensed. Adequacy of labeling was assessed by checking the labels of drugs dispensed to 30 outpatients in the health facility on the day of the survey. A label would be considered adequate if it conforms to all the above requirements. The percentage of drugs adequately labeled was then calculated at facility level, regional and national level. The national average for percentage of drugs adequately labelled was 42.7% (Min 0, Max 100) with a very wide range of 100. The figure shows significant deviation from the ideal value of 100%
26

Average percentages of drugs adequately labeled by level of health facilities were 59.7%, 53% and 38.7% for hospitals (n=7) health centers (n=19) and health stations (n=79), respectively (Figure 17). However, the mean variation was not significant (P>0.05). The figures show that hospitals and health centers have better performance than the national average. The labeling practice is also least in health stations but best in hospitals. On the other hand, the average for percentage of drugs adequately labeled varied in the six regions (Figure 18) between 12.4% (Benishangul -Gummuz) and 89.3% (Addis Ababa) showing extremely significant variation (P<<<0.05). From the above, we can deduce that PHCFs in Benishangul-Gumuz have least labeling practice but best in PHCFs of Addis Ababa.
0
20
40
60
80
100
Hospitals Healthceters
Healthstations
Figure 17 Adequecy of labeling & patient knowledge by level of PHCFs
% Adequecyof labeling
% Patientknowledge
0102030405060708090
100
Tigray
Amhara
Oromia
SNNPR
Benish
ang-G
um
Addis
Ababa
Nation
al
Figure 18 Adequecy of labeling and patient knowledge in six regions
% Adeqecy oflabeling
% Patientknow ledge
27

3.6. Patient Knowledge
To assess if patients have adequate knowledge on how to take the drugs dispensed to them, 30 outpatients leaving the dispensing unit of each facility on the day of the survey were interviewed. Knowledge about the drug constitutes ability to tell dose, frequency of administration and length of therapy fully. Then, the percentage of patients who had adequate knowledge was calculated at facility level, regional level and national level. The national average for percentage of patients who had adequate knowledge about the drugs dispensed to them was 67.4% (Min 0, Max 100) and it was much lower than the expected ideal value of 100%.
By level of health facilities (Figure 17), the average percentages were 77.1%, 67.6% and 66.4% for hospitals (n=7), health centers (n=19) and health stations (n=79), respectively. But, the mean variation was insignificant (P>0.05).
3.7. Availability of STGs/EDLs in health facilities
The Ministry of Health has prepared and distributed Standard Treatment Guidelines (STGs) for six disease conditions, namely, Tuberculosis/Leprosy, Sexually Transmitted Diseases, Malaria, Acute Respiratory Tract Infection (ARTI), diarroheal diseases, and opportunistic infections related to HIV/AIDS. Out of these, availability of treatment guidelines for Malaria (adults), Tuberculosis (adults) and Integrated Management of Childhood Illness (IMCI) was selected as criteria of assessment due to report of their wider distribution. Moreover, availability of regional and facility EDL was also taken as additional criteria of assessment. A facility would be considered to have STGs and EDLs if any of the STGs or EDLs mentioned above was physically available. The survey revealed that only nearly 39% of the 108 health facilities surveyed had one or more of the STGs. It shows that majority of the health personnel are working without any standard guideline giving a way to irrational drug use.
28
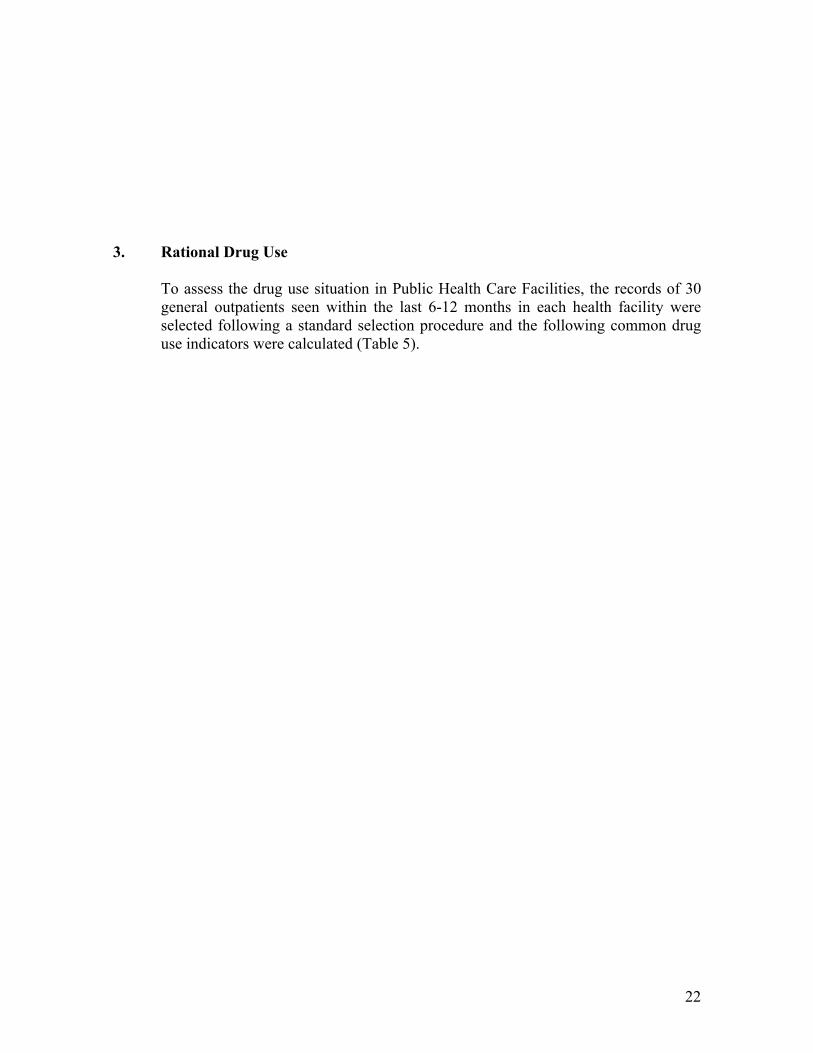
When considered by level of health facilities (Figure 19), 67% of the hospitals (n=6), 50% of the health centres (n=18) and 35% of the health stations (n=84) had at least one of the STGs showing significant percentage variation (P<0.05).
The percentage availability of STGs varied in the five regions (Figure 20) between 3% (Oromia) to 75% (Tigray) reflecting very significant percentage variation (P<0.05).
On the other had, it was learnt that only one health facilities had facility EDL out of the 108 facilities surveyed and this would have a negative impact on the selection of essential drugs in the health facilities.
Figure 19 Availablity of Standard Treatment Gidelines by level of PHCFs
0
0.1
0.2
0.3
0.4
0.5
0.6
0.7
0.8
Hospitals Health ceters Health stations
%Facilities with STG
Figure 20 Availablity Standard Treatment Guidelines in PHCFs in five regions
00.10.20.30.40.50.60.70.8
Tigray
Amhara
Oromia
SNNPR
Benish
ang-G
um
National
% Facilities with STG
29

3.8. Assessment of Treatment Practices
To measure the quality of care for common disease conditions with clear standard treatment guidelines, the utilization of STGs in health facilities was assessed by checking whether the chosen tracer diseases had been treated according to the treatment schedules recommended in the STGs. For this purpose, three disease conditions, namely, diarroheal disease in children (watery, non-bloody), non-pneumonia Acute Respiratory Tract Infection (ARTI) and mild/moderate pneumonia were chosen. The recommended treatments are: ORS for watery, non-bloody diarrhea; non - use of antibiotic for non-pneumonia ARTI and use of any of the first line antibiotics for Mild/Moderate pneumonia (Procaine Penicillin, Amoxicillin or Cotrimoxazole). The records of 30 out-patients (10 patients for each disease) treated in the facility were selected randomly from the records of the day prior to the survey; when the number of cases was insufficient, by going back one day at a time until 10 cases were found for each disease condition. The records of the thirty patients were examined to determine if the treatments complied with their respective recommendations in the STGs. Then, the percentage of cases treated according to STGs was calculated at facility level, regional level and national level.
3.8.1 Treatment of diarrhea (non-bloody, watery) in children
Prevalence of ORS use
The national average for percentage of ORS use in 107 health facilities was 81.9% (Min 10, Max 90) and it is close to the ideal value of 100%.
By level of health facilities (Figure 21), the percentages of ORS use were 68.6% for hospitals (n=7), 72.1% for health centers (n=19) and 85.3% for health stations (n=81) showing significant mean variation (P<0.05).
30

According to the above figures, health stations have shown better compliance to STG followed by health centres.
It also varied in the six regions (Figure 22) between 66% (Benishangul- Gumuz) and 85% (SNNPR) with insignificant mean variation (P>0.05).
0102030405060708090
100
Hospitals Healthcenters
Healthstations
Figure 21 Pattern of treatment of uncomplicated diarrohea by level of PHCFs
% ORS
% Antibiotics
% Antidiarrhoeal and/or% Antispasmodic
0
10
20
30
40
50
60
70
80
90
100
Tigray Amhara Oromia SNNPR Benishangul-Gumuz
AddisAbaba
National
igure 22 Pattern of treatment of un complicated diarrohea in children in six regions
F
% ORS
% Anibiotics
% Antidarrohealsand/or antispasmodics
31

Prevalence of use of antibiotic
The national average for percentage of antibiotic use in 107 health facilities was 49.6% (Min 0, Max, 100). This is a bad practice since the norm is not to use any antibiotic in watery, non-bloody diarrhea.
When seen by level of health facilities, it was 54.3% for hospitals (n=7), 71.1% for health centers (n=19) and 44.2% for health stations (n=81) showing significant mean variation (P<0.05). Even though all practices deviate significantly from the STG, in relative terms, health stations have shown better compliance followed by hospitals (Figure 21).
The percentage varied in the six regions (Figure 22) between 40% (SNNPR) to 78% (Benishangul Gumuz) with insignificant mean variation (P>0.05).
Prevalence of use of anti-diarrhea and or anti-spasmodic drugs
The national average for percentage of this mode of treatment in 102 health facilities was 2.6% (Min 0, Max 40) and this is not very far from the ideal value of zero use. By level of health facilities, the percentages were 7.1% for hospitals (n=7), 6.1% for health centers (n=18) and 1.3% for health stations (n=77) with significant mean variation (P<0.05). In relative terms, health stations have shown the best compliance followed by health centers.
Across the six regions, it varied (Figure 23) between 0% (Benishangul-Gumuz) to 23.3% (Addis Ababa). The situation in Addis Ababa needs further investigation.
3.8.2 Treatment of non-pneumonia ARTI
The national average percentage use of antibiotic in 106 health facilities was 60.7% (Min 0, Max 100) and this is a significant deviation from the STGs. By level of health facilities (Figure 23), the percentages were 55.7% for hospitals (n=7), 66.8% for health centers (n=19) and 58.9% for health stations (n=80). But the mean variation was insignificant (P>0.05).
32

The percentage varied in the six regions (Figure 24) between 33.9% (Amhara) and 80% (Benishangul-Gumuz) showing better compliance with STGs in the Amhara region and least compliance in Benishangul-Gumuz region. The mean variation was also significant (P<0.05).
Figure 23 Prevalence of of antibiotic use in the treatment of Non-Pneumonia ARTI by level of PHCFs
010
2030
4050
6070
8090
100
Hospitals Health centers Health stations
% On Antibiotics
Figure 24 Prevalence of antibiotic use in the treatment of non-pnumonia ARTI in six
regions
0102030405060708090
100
Tigray
Amhara
Oromia
SNNPR
Benish
angu
l-Gum
uz
Addis
Ababa
Nation
al
% on Antibiotics
33

3.8.3 Treatment of Mild/Moderate pneumonia
Prevalence of use of first-line antibiotics
The study has shown that the national average percentage use of any of the first line antibiotics was 54.1% (n=106) with a minimum of 0% and maximum of 100% showing a wide range of 100. The practice is unsatisfactory as compared with the recommendations in the STG.
At the level of health facilities, the percentage was 53.3% for hospitals (n=6), 57.4% for health centers (n=19) and 53.4% for health stations (n=81) with insignificant mean variation (P>0.05) (Figure 25).
The percentage varied in the six regions (Figure 26) between 28% (Amhara) and 99.1% (Oromia) showing extremely significant mean variation (P<<<0.05). In relative terms, Oromia has shown the best compliance to STG and Amhara region the least compliance.
0
20
40
60
80
100
Hospitals Healthcenters
Healthstations
Figure 25 Pattern of treatment of Mild to Moderate pneumonia by level of PHCFs
% of patients on any oneof the first line antibiotics% of patients on > 1antibiotic
34

Prevalence of use of more than one antibiotics
At the national level, the percentage of use of more than one antibiotic in the treatment of Mild/moderate pneumonia was 2.4% (n=106) with a maximum of 30% and minimum of 0%. The results show a very good overall compliance to STG and needs to be maintained, if not improved.
By level of health facilities, the percentages were 0% for hospital (n=6), 5.8% for health centers (n=19) and 1.7% for health stations (n=81) with insignificant mean variation (P<0.05).
In relative terms, hospitals have shown absolute compliance with the STG followed by health stations (Figure 25). The percentages varied in the six regions (Figure 26) between 1.5% (Oromia) and 25% (Addis Ababa). The results in Oromia are very encouraging while the situation in Addis Ababa needs further investigation
0102030405060708090
100
Tigray
Amhara
Oromia
SNNPR
Benish
angu
l-Gum
uz
Addis
Ababa
Nation
al
Figure 26 Pattern of treatment of Mild to Moderate pneumonia
% of patientson any one ofthe the 1stline antibiotics
% of patientson > oneantibiotic
35
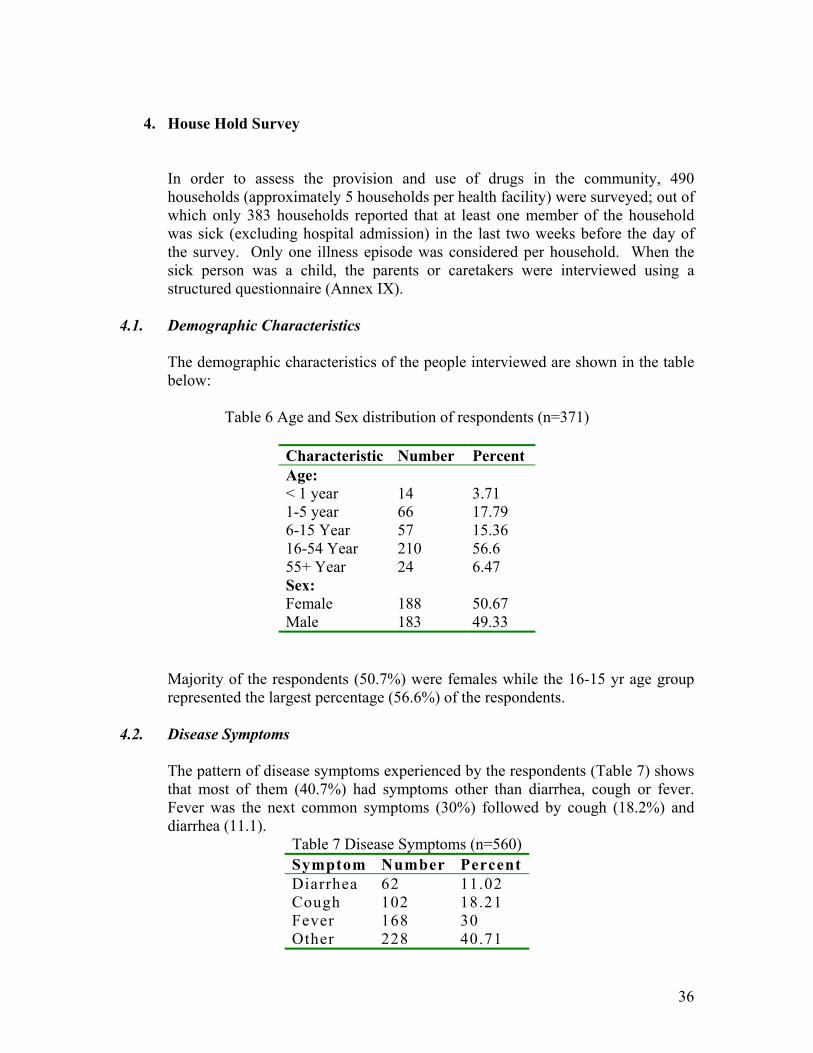
4. House Hold Survey
In order to assess the provision and use of drugs in the community, 490 households (approximately 5 households per health facility) were surveyed; out of which only 383 households reported that at least one member of the household was sick (excluding hospital admission) in the last two weeks before the day of the survey. Only one illness episode was considered per household. When the sick person was a child, the parents or caretakers were interviewed using a structured questionnaire (Annex IX).
4.1. Demographic Characteristics
The demographic characteristics of the people interviewed are shown in the table below:
Table 6 Age and Sex distribution of respondents (n=371)
Characteristic Number Percent Age: < 1 year 14 3.71 1-5 year 66 17.79 6-15 Year 57 15.36 16-54 Year 210 56.6 55+ Year 24 6.47 Sex: Female 188 50.67 Male 183 49.33
Majority of the respondents (50.7%) were females while the 16-15 yr age group represented the largest percentage (56.6%) of the respondents.
4.2. Disease Symptoms
The pattern of disease symptoms experienced by the respondents (Table 7) shows that most of them (40.7%) had symptoms other than diarrhea, cough or fever. Fever was the next common symptoms (30%) followed by cough (18.2%) and diarrhea (11.1).
Table 7 Disease Symptoms (n=560) Symptom Number PercentDiarrhea 62 11.02 Cough 102 18.21 Fever 168 30 Other 228 40.71
36

4.3. Types of Consultations
A closer look into the types of consultations, which the patients have opted for (Table 8) shows that majority of them (68.2%) had consulted public health facilities, followed by people who did nothing (10.1%) about their illness. Private health care facilities were the third sources of consultation (7.3%).
Table 8 Types of Consultations (n=368)
Type Number Percent Consulted traditional healer 11 2.99 Consulted public health clinic/hospital 251 68.21 Consulted private health clinic/hospital 27 7.34 Consulted pharmacist 2 0.54 Consulted drug seller 18 4.89 Sought advice from friend/neighbor/family 4 1.09 Bought medicine without consultation 14 3.80 Used medicine without consultation 4 1.09 Did nothing 37 10.05
4.4. Extent of Drug therapy
The outcomes of the consultations (Table 9) revealed that medicines were prescribed for majority of the respondents (98.4%).
Table 9 Outcomes of consultations (n=317)
Outcome Number Percent Medicines prescribed 312 98.42 No Medicines prescribed 5 1.58
4.5. Extent of dispensing of prescribed Medicines
Table 10 shows that all the prescribed drugs were dispensed to most of the patients with prescriptions (94.9%) indicating a very good availability of the required drugs.
Table 10 Extent of dispensing of prescribed medicines (n=315)
Variables Number Percent All prescribed medicines were dispensed 299 94.92 Some of the prescribed medicines dispensed 10 3.17 None of the prescribed medicines were dispensed 6 1.90
37

4.6. Reasons for not obtaining the prescribed Medicines
Absence of the required medicines in public pharmacies was the major reason (41.2%) for not getting the prescribed medicines followed by lack of money (35.3%) on the part of the patient (Table 11).
Table 11 Reasons for not obtaining Prescribed Medicines (n=17)
Reasons Number Percent Price was too high 0 0 Did not have enough money 6 35.29 Not able to borrow enough money 0 0 Too many medicines were prescribed 0 0 Did not believe all the medicines were needed 1 5.88 Started to feed better 0 0 No time to get all the medicines 1 5.26 Traditional healer did not have all the medicines 0 0 Public pharmacy did not have all the medicines 7 41.18 Private pharmacy did not have all the medicines 1 5.26 Drug seller did not have all the medicines 0 0 Already has some of the medicines at home 0 0 Others 1 5.88 4.7. Level of compliance to prescribed Medicines
Assessment of the level of compliance to prescribed medicines has shown that majority of the patients (90.8%) complied with the order. The percentages of partial compliance and absolute non-compliance were 7.2 % and 2 %, respectively (Table 12). The results of this study differ from the results of previous study conducted on out patients of a teaching hospital (15), which had reported compliance rate and non-compliance rate of 73.9% and 20.1%, respectively. The differences of the findings may be due to differences in the subject populations.
Table12 Compliance status (n=305)
Variables Number Percent All of the medicines taken 277 90.82 Some of the medicines taken 22 7.21 None of the medicines taken 6 1.97
38

4.8. Sources of Medicines
Analysis of sources of medicines used by the respondents (Table 13) indicates that the main sources (71.1%) were public health facilities followed by private pharmacies (17.7%). The contribution of informal sources such as local stores/market places, friends/neighbors/family, etc. was in significant (<1%). The results of this study is in stark contrast with the findings of other studies carried out in developing countries ( 16, 17), where it was reported that more than half of the medications used in the community are obtained from informal sources such as village grocery stores, and house hold stocks.
Table13 Sources of medicines used by the respondents (n=345)
Source Number Percent Traditional healer 9 2.61 Public Health centre/hospital 245 71.01 Private health centre/hospital 13 3.77 Public pharmacy 8 2.32 Private pharmacy 61 17.68 Local store/market place 3 0.87 Friends/neighbor/family 2 0.58 Medicines already owned 3 0.87 Others 1 0.29
4.9. Drug expenditure to Income ratio Further look into the drug expenditure to income ratio of 250 respondents has revealed that on the average 20.9% (Minimum 0%, Maximum 3300%), of estimated family weekly income or total weekly household expense is required to cover the cost of drugs to treat a single illness episode.
39
Chapter IV Conclusion and Recommendation
1. CONCLUSION The assessment of the pharmaceutical sector using level I and Level II core indicators has shown both strengths and weaknesses in the implementation of the National Drug policy. Some of the strengths include:
• Strong commitment of the government to the implementation of the national drug policy;
• Establishment of an independent drug regulatory authority supported by a quality control laboratory.
• Promulgation of current proclamation for control of the pharmaceutical sector • An improvement in resource allocation for regulatory and drug supply activities • Growth in the number of local pharmaceutical factories from one to thirteen and
also an increase in the number of importers, wholesalers and retail outlets. • Various training sessions and public education programs conducted by DACA,
PASS and professional associations to improve drug supply management skill of health personnel and to promote rational drug use
• Initiation of new activities such as drug information dissemination and monitoring of adverse drug reaction.
On the other hand, the policy implementation had numerous shortcomings, among which were the following: Policy & regulation
• Absence of regulations for the implementation of proclamation No. 176/1999; • Absence of specific NDP implementation plan that sets responsibilities, budget
and timeline; • Absence of monitoring and evaluation of the elements in the NDP • Double standard in the implementation of the proclamation with respect to
product registration; • Weak regulation of local manufacturers in terms of licensing • Failure to link drug registration with inspection of manufacturing sites abroad
Out comes of policy Failure to achieve some of the recommended targets for access, quality and rational drug use:
• Inadequate drug budget allocation; • In availability of STGs and current EDL at health facilities; • Poor dispensing and prescribing practices; • Low level of patient knowledge about drugs dispensed to them;
40

• Long stock-out period of essential drugs in public health care facilities; • Wide variation in storage conditions of public health care facilities, some of
them falling below acceptable level
2. RECOMMENDATIONS To improve the existing situation, the following measures are recommended:
Policy & regulation
• Proclaim current legislation for the implementation of proclamation 176/199. • Revise the NDP and national EDL in the light of current developments. • Develop NDP implementation plan that sets responsibilities, budget and time line. • Apply uniform registration requirements on both locally produced and imported
products, irrespective of the sector; • Ensure that local manufacturers comply with GMP requirements through proper
certification ; • Establish linkage between product registration and GMP inspection of manufacturers
abroad Accessibility • Increase drug budget allocation to improve availability of essential drugs • Upgrade the drug supply management skills of health personnel working at different
levels Quality • Improve storage conditions in health facilities. • Undertake post marketing quality monitoring of essential drugs Rational Drug Use • Conduct training on rational use of drugs for prescribers and dispensers • Improve the dispersing practice by allocating enough resource for dispensing inputs • Distribute STGs, EDL and other reference materials to improve prescribing practices
and drug selection in facilities • Strengthen the public education and drug information dissemination initiatives; • Establish/revitalize Drugs & Therapeutic Committees in Public Health Care facilities • Introduce audit & feed back systems on the practice of prescribers & dispensers General • Undertake further in depth study on areas where shortcomings were noted in order to
explore underlying causes and design specific interventions;
41

REFERENCES
1. FDRE (2001/ 02). Health and Health Related Indicator. Addis Ababa: Planning and
Programming Department, Ministry of Health, 1994 E. C. (2001/ 02). 2. WB (2002). World Development Report. Building Institutions for markets. World
Bank, 2002. PP. 232-241. 3. TGE (1993). National drug policy of the Transitional Government of Ethiopia.
Addis Ababa: TGE 4. FDRE (1999). Drug Administration and Control Proclamation. Addis Ababa: the
House of Representatives, Federal Democratic Republic of Ethiopia, 29 June, 1999. 5. DACA (2001). List of Drugs for Ethiopia. Addis Ababa: Drug Administration and
Control Authority, July, 2001. 6. MOH (1987): List of Essential Drugs for People’s Democratic Republic of Ethiopia.
Addis Ababa: MOH 7. FDRE (2002). Health Sector Development Program II (EFY 1995 – 1997). Addis
Ababa: Ministry of Health, June 2002. 8. WHO (1998). Health Reform and Drug Financing. Selected topics; Health economics
and drugs; DAP series No. 6. Geneva: WHO 9. NBE (2002/03). Quarterly bulletin. Fiscal year series, volume 18, N0 1. Addis
Ababa: National bank of Ethiopia, 2003. 10. WHO (1993). How to investigate drug use in health facilities. Selected drug use
indicators. Action program on Essential Drugs. Geneva: WHO. 11. FDRE (1998). Program Action Plan for Health Sector Development Program. Addis
Ababa: Ministry of Health, October 1998. 12. WHO (1996). Comparative analysis of national drug policies in 12 countries.
Geneva: WHO 13. Andualem, T., Kafil, Z. (1995). Retrospective drug use study using prescribing
indicators in 32 health facilities. Ethiopian Pharmaceutical Journal. Vol. 13, No.1995, pp. 54-61
14. Djote, M., Gebre Mariam, T. (1997). Drug Management and Planning in Ethiopia.
Addis Ababa: FDRE, PHRD Project office.
42

15. Abula, T. (2000). Patient non-compliance in the therapeutic requirements and factors of non-compliance in Gondar. Ethiopian Journal of Health development, Vol. 14, No. 1, April 2000.
16. Foster, S. (1991). Supply and use of essential drugs in Sub-Sahara Africa: Some
issues and possible solutions. Soc. Sc. Vol. 32, No. 11, 1991. PP 1201-1218. 17. Kitaw,Y.(1984). Drug hoarding and utilization in developing country. A paper Presented at the 9th annual conference of the Ethiopian Pharmaceutical Association, 9-10 November, 1988, Addis Ababa, Ethiopia.
43

Annex I National Regional States of Ethiopia
44

45
Annex II Six-tier and four-tier health care delivery systems Central/ Referral hospitals
Regional hospitals
Rural hospitals Health centers Health stations Community health posts Figure 1 Six-tier health care delivery system in Ethiopia Specialized hospitals Zonal hospital District hospital PHCU Figure 2 Future Four -tier health care delivery system

46
Annex III Distribution of Health Facilities and House Holds Surveyed
Sr. No.
Region Hospitals Health Centers (DH+ZH)
Health Stations
Private Pharmacy
Private Drug shops
Special Pharmacy
Regional Drug Store
House Holds
1. Amhara
14(1)* 77(4) 518(28) 29(2) 39(2) 1 2(1) 165
2. Oromia
19(2) 111(5) 787(31) 42(3) 94(5) - 1(1) 108
3. Tigray
12(1) 29(2) 158(9) 14(1) 10(1) 3 1(1) 62
4. SNNPR
10(1) 103(6) 299(13) 22(1) 24(1) - 1(1) 100
5. Benishangul Gumuz
2(1) 7(1) 65(3) - 2(1) - - 25
6. Addis Ababa
5(1) 20(1) 8(1) 125(5) 42(2) 1 2(1) 30
Total 62(7) 347(19) 1835(85) 232(12) 211(12) 5 7(5) 490Sample size (%) 11.3% 5.5% 4.6% 5.2% 5.7% 71.4%
* Figures in brackets show sample size
Acronyms: DH District Hospital ZH Zonal Hospital

Annex IV LIST OF KEY ESSENTIAL DRUGS
Health problem Key essential drugs
Acute Respiratory Tract infection Amoxicilin capsule or tablet Co-trimoxazole tablet Procain penicillin injection
Diarrhea Oral Rehydration Salt (ORS) Co-trimoxazole
Malaria Chloroquin tablet Sulphadoxine-Primethamine tablet
Worm infestations Mebindazole tablet
Conjunctivitis Tetracycline eye ointment
Skin disinfection Denatured alcohol
Anemia Ferrous salt + Folic Acid
Pain Paracetamol tablet
Scabies Benzyl benzoate lotion
47

Annex V Summary of National Indicators Ser. No.
INDICATORS VALUE
Public Health Care Facilities 1. Percentage availability of key essential drugs 69.83 2. Percentage of expired drugs 8.24 3. Average stock out duration (days) 99.22 4. Affordability (adult) 135 % 5. Affordability (children) 67.69 % 6. Adequacy of storage 5.98 7. Average number of drugs per encounter 1.99 8. Percentage of antibiotic per encounter 58 9. Percentage of injection per encounter 26.98 10. Percentage of prescribed drugs dispensed 85.48 11. Percentage of drugs adequately labeled 42.66 12. Percentage of patients who have adequate knowledge 67.36 13. Percentage of health facilities with STG 39% 14. Percentage of health facilities with EDL (facility or regional EDL) < 1 %
Treatment of Cases:
ORS 81.87 15. Antibiotic 49.63
Diarrhea
Antidiarrheal and/ or antispasmodic drugs 2.55 16. Acute respiratory tract infection: 17. Non-pneumonia ARTI Percentage of antibiotic use 60.09 18. Mild/ moderate pneumonia Percentage of use of first line
antibiotic 54.1
Percentage use of > one antibiotic 2.36 Private retail Outlets:
Percentage affordability (Adult) 195 Percentage affordability (Children) 127 Percentage availability of key essential drugs 90.96 Percentage of expired drugs 3
Regional Drug Stores Percentage availability of key essential drugs 85 Average stock out duration (days) 99 Storage condition rates (on a scale of 0-11 scores) 8 Percentage of expired drugs 2
48