Embed Size (px)
Citation preview

SRNL-STI-2009-00639, Rev. 1
ASSESSMENT OF THE POTENTIAL FOR HYDROGEN GENERATION DURING GROUTING OPERATIONS IN THE R-
AND P-REACTOR VESSELS
B. J. WIERSMA
Savannah River National Laboratory Materials Science and Technology Directorate
Publication Date: December, 2009 This document was prepared in conjunction with work accomplished under Contract No. DE-AC09-08SR22470 with the U. S. Department of Energy

December, 2009 SRNL-STI-2009-00639, Rev. 1
Page ii of iv
DISCLAIMER This report was prepared under an agreement with and funded by the U. S. Government. Neither the U. S. Government or its employees, nor any of its contractors, subcontractors or their employees, makes any express or implied: 1. warranty or assumes any legal liability for the accuracy, completeness, or for the use of results of such use of any information, product or process disclosed; or 2. representation that such use or results of such use would not infringe privately owned rights; or 3. endorsement or recommendation of any specifically identified commercial product, process or service. Any views and opinions of authors expressed in this work do not necessarily state or reflect those of the United States Government, or its contractors, or subcontractors.

December, 2009 SRNL-STI-2009-00639, Rev. 1
Page iii of iv
DOCUMENT: SRNS-STI-2009-00639, Rev. 1 TITLE: Assessment of the Potential for Hydrogen Generation During Grouting Operations
in the R- and P- Reactor Vessels APPROVALS
________________________ Date:__________ B. J. Wiersma, Author Materials Performance and Corrosion Technology Materials Science and Technology ________________________ Date:__________ B. Garcia-Diaz, Technical Reviewer Materials Performance and Corrosion Technology Materials Science and Technology Directorate ________________________ Date:__________ K. E. Zeigler, Manager Materials Performance and Corrosion Technology Materials Science and Technology Directorate ________________________ Date:__________ J. K. Blankenship, Customer SDD Decommisioning Engineering

December, 2009 SRNL-STI-2009-00639, Rev. 1
Page iv of iv
Table of Contents Executive Summary ...................................................................................................................... 1 Introduction................................................................................................................................... 2 Approach ....................................................................................................................................... 3 Thermal Analysis .......................................................................................................................... 6 Determination of Areal Density Ratios ....................................................................................... 6 Determination of Volumetric Flow Rate of Hydrogen………………………………………...7 Results…………………………………………………………………………………………….7 Conclusions and Recommendations…………………………………………………………...23 References .................................................................................................................................... 24 APPENDIX ................................................................................................................................ A-1
Record of Revisions
Rev. Date Description 1 December
2009 Walk-down inspections determined that there were no USH’s present in the R-reactor vessel. As a result, the surface area of aluminum exposed to the grout for this reactor vessel is less than that which was assumed in the previous revision of this document. The calculations for the R-reactor vessel were performed again based on this information. No changes were made to the calculations for the P-reactor vessel.
0 October 2009 Initial issue

December, 2009 SRNL-STI-2009-00639, Rev. 1
Page 1 of 24
Assessment of the Potential for Hydrogen Generation During Grouting Operations in the R- and P-Reactor Vessels
Executive Summary The R- and P-reactor buildings were retired from service and are now being prepared for deactivation and decommissioning (D&D). D&D activities will consist primarily of immobilizing contaminated components and structures in a grout-like formulation. Aluminum corrodes very rapidly when it comes in contact with the alkaline grout materials and as a result produces hydrogen gas. To address this potential deflagration/explosion hazard, the Materials Science and Technology Directorate (MS&T) of the Savannah River National Laboratory (SRNL) has been requested to review and evaluate existing experimental and analytical studies of this issue to determine if any process constraints on the chemistry of the fill material and the fill operation are necessary. Various options exist for the type of grout material that may be used for D&D of the reactor vessels. The grout formulation options include ceramicrete (pH 6-8), low pH portland cement + silica fume grout (pH 10.4), or Portland cement grout (pH 12.5). The assessment concluded that either ceramicrete or the silica fume grout may be used to safely grout the P-reactor vessel. The risk of accumulation of a flammable mixture of hydrogen between the grout-air interface and the top of the reactor is very low. Portland cement grout, on the other hand, for the same range of process parameters does not provide a significant margin of safety against the accumulation of flammable gas in the reactor vessel during grouting operations in the P-reactor vessel. It is recommended that this grout not be utilized for this task. The R-reactor vessel contains significantly less aluminum and thus a Portland cement grout may be considered as well. For example, if the grout fill rate is less than 1 inch/min and the grout temperature is maintained at 70 °C or less, the risk of hydrogen accumulation in the R-reactor vessel is very low for the Portland cement. Alternatively, if the grout fill rate is less than 0.5 inch/min and the grout is maintained at a temperature of 80 °C, the risk will again be very low. Although these calculations are conservative, there are some measures that may be taken to further minimize the potential for hydrogen evolution.
1. Minimize the temperature of the grout as much as practical. Lower temperatures will mean lower hydrogen generation rates. For P-reactor, grout temperatures less than 100 °C should provide an adequate safety margin for the pH 8 and pH 10.4 grout formulations. For R-reactor, grout temperatures less than 70 °C or 80 °C will provide an adequate safety margin for the Portland cement. The other grout formulations are also viable options for R-reactor.

December, 2009 SRNL-STI-2009-00639, Rev. 1
Page 2 of 24
2. Minimize the grout fill rate as much as practical. Lowering the fill rate takes advantage of passivation of the aluminum components and hence lower hydrogen generation rates. For P-reactor, fill rates that are less than 2 inches/min for the ceramicrete and the silica fume grouts will reduce the chance of significant hydrogen accumulation. For R-reactor, fill rates less than 1 inch/min will again minimize the risk of hydrogen accumulation.
3. Ventilate the building as much as practical (e.g., leave doors open) to further disperse hydrogen. The volumetric hydrogen generation rates in the P-reactor vessel, however, are low for the pH 8 and pH 10.4 grout, (i.e., less than 0.32 ft3/min).
If further walk-down inspections of the reactor vessels suggest an increase in the actual areal density of aluminum, the calculations should be re-visited. Introduction The R- and P-reactor buildings were retired from service and are now being prepared for deactivation and decommissioning. D&D activities will consist primarily of immobilizing contaminated components and structures in a grout-like formulation. This report specifically addresses the grouting of the reactor vessels along with the aluminum components that are contained with the vessel [1]. The aluminum components contained in the reactor pose a concern in that aluminum will corrode very rapidly when it comes in contact with the very alkaline grout materials, and as a result produce hydrogen gas. To address this potential deflagration/explosion hazard, the Materials Science and Technology Directorate (MS&T) of the Savannah River National Laboratory (SRNL) has been requested to review and evaluate existing experimental and analytical studies of this issue to determine if any process constraints on the chemistry of the fill material and the fill operation are necessary. Various options exist for the type of grout material that may be used for D&D of the reactor vessels. The grout formulation options include ceramicrete (pH 6-8), low pH portland cement + silica fume grout (pH 10.4), or portland cement grout (pH 12.5). As part of this task, the rate of hydrogen generation in the vessels for grouts with a pH range from 8 to 13 will be calculated. The calculations considered such factors as temperature, the rate at which the grout fills the vessel, the surface area of the components present, the surface area of the reactor vessel and the void volume of the reactor vessel. The principles utilized in calculating the hydrogen generation rate from the R- and P-reactor disassembly basins were employed [2]. The objective of these calculations was to provide input as to which grout formulation is appropriate for the operations so that the risk of hydrogen gas accumulation is minimized.

December, 2009 SRNL-STI-2009-00639, Rev. 1
Page 3 of 24
Approach Pacific Northwest National Laboratory (PNNL) performed a similar analysis for the K basins at the Hanford Site [3]. This analysis was reviewed and applied to the situation for the R- and P- reactor vessels. The process is as follows:
1) Aluminum corrodes upon exposure to the grout. 2) Hydrogen is generated as a consequence of the corrosion reaction. 3) The gas rises to the surface of the grout in the form of bubbles. 4) The bubbles will burst at the grout surface releasing H2 gas into the stagnant air
layer. This process was modeled by formulating a kinetic law for hydrogen production as a function of the grout temperature, pH, fill rate and combining it with a model for vertical turbulent diffusion of a light fluid (H2) through a heavier miscible fluid medium (air). Vertical turbulent diffusion is a process analogous to molecular diffusion. However, the diffusion coefficient is several orders of magnitude larger than the molecular diffusion coefficient for the H2/air mixture, because vertical diffusion of the lighter gas is due to buoyancy rather than molecular motion. This model has been confirmed experimentally and has been shown to be effective for predicting diffusion layers that are broader than they are tall [4]. The assumptions used in the analysis were:
- There are openings in the reactor vessel that allow hydrogen to escape the vessel. - Once the hydrogen reaches the top of the reactor vessel, there is sufficient
advection to disperse the hydrogen within the building superstructure.
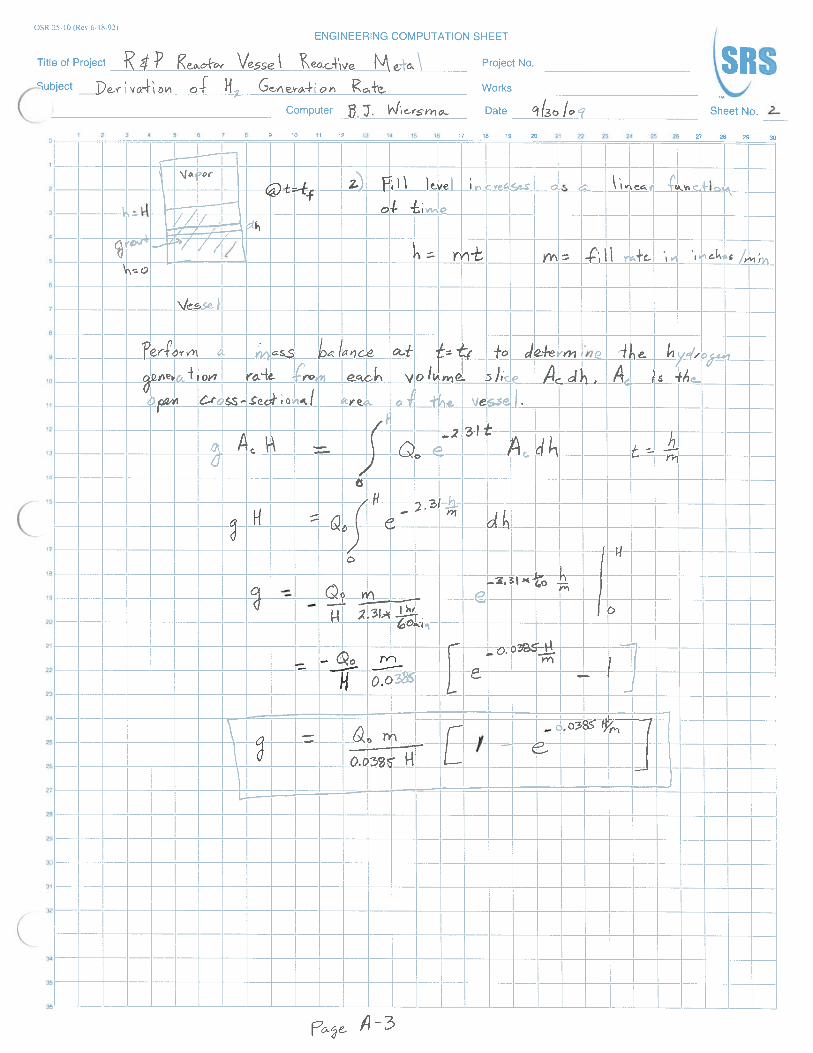
Based on these assumptions the only place that hydrogen could potentially accumulate is in the region between the grout layer and the top of the reactor vessel. The first part of the model involved developing a kinetic expression for the generation of hydrogen during the corrosion of aluminum. This kinetic expression can be represented by the following relationship: Q = f (pH, T, h) (1) Where Q is the hydrogen generation rate in cm3/cm2/min, T is the grout temperature in °K, and h is the level of the grout as a function of time t in inches. The derivation of this relationship is shown in the Appendix. The final explicit relationship was: Q = Qo * m * [1 – exp(-0.0385*H/m)] 0.0385 * H (2) where,

December, 2009 SRNL-STI-2009-00639, Rev. 1
Page 4 of 24
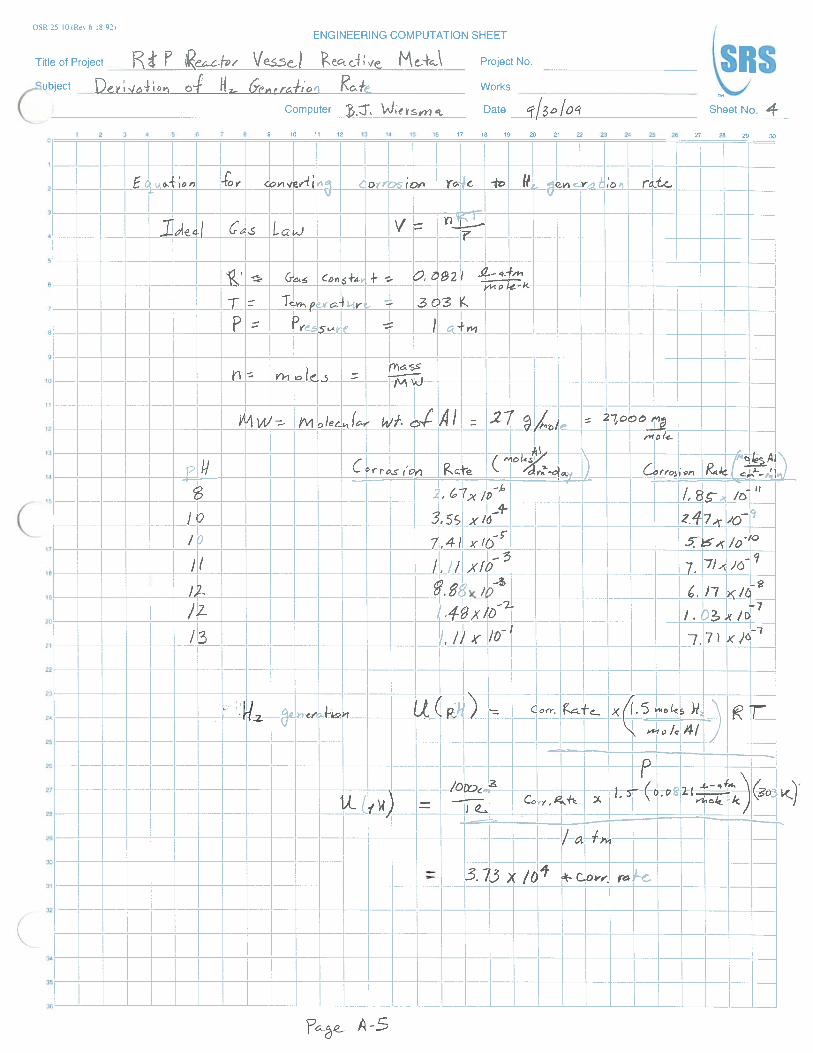
Qo = 3*10-14 * exp(2.0952*pH)*exp[-5339*(1/T-1/303)] (3) Where Qo is the hydrogen generation rate as a function of pH and temperature, m is the rate at which the grout fill level increases with time, and H is the fill level at a given time, t. Laboratory tests performed at PNNL to measure the hydrogen generation rate of a non-corroded aluminum metal coupon immersed in either grout or saturated Ca(OH)2 solution provided part of the technical basis for the parameters that go into the equation. The key results from the tests were:
- The initial hydrogen generation rate of non-corroded aluminum metal in a grout mixture at 25 °C is 0.3 cm3/min.
- The hydrogen generation rate of non-corroded aluminum metal in grout decreases to approximately 0.15 cm3/min after 2 to 3 hours of exposure to the grout mixture at 25 °C. The decrease in corrosion rate is due to the formation of a corrosion product (principally tricalcium aluminum hydroxide and hydrocalumite) layer on the surface of the aluminum metal.
- The hydrogen generation rate for aluminum metal in grout was performed at 27 °C. Extrapolation of this result to hydrogen generation rates for higher grout temperatures was made using the test results from aluminum exposed to Ca(OH)2 solution (i.e., similar to the pore solution in the grout). However, the five-fold increase in hydrogen generation rate with a 30 °C increase in the Ca(OH)2 solution temperature is consistent with literature values for hydrogen generation in grout. Matsuo et al. observed a 3 fold increase in hydrogen generation rate with a 30 °C increase in an inhibited grout mixture [5].
- Literature data was also used to obtain the corrosion rate as a function of pH [6, 7]. The corrosion rate was then converted to a hydrogen generation rate assuming that 1.5 moles of hydrogen are generated for every one mole of aluminum that corrodes.
The following conservatisms and uncertainties were considered when applying the data to the R- and P- reactor vessel situation.
- The experimentally measured hydrogen generation rate was determined on clean or non-corroded aluminum metal. The surface of the aluminum metal in the reactor vessels is corroded. The aluminum metal in the reactors has been there for many years and the surface is protected by an oxide film. In either case, the rate of hydrogen generation from corrosion would be lower than that measured for the non-corroded aluminum metal coupons in the laboratory tests.
- The hydrogen generation rate due to aluminum metal corroding in grout is based on only one relevant gas generation test. However, four tests were conducted in a Ca(OH)2 solution and the results were consistent based on chemical engineering fundamentals (i.e., mass transfer conditions in the grout are poorer than those in the Ca(OH)2 solution). Additionally, the hydrogen gas generation rate for the aluminum in grout was also comparable to other values in the literature. Matsuo

December, 2009 SRNL-STI-2009-00639, Rev. 1
Page 5 of 24
et al. measured a rate of 0.105 cm3/min for aluminum exposed to Portland cement at room temperature [8, 9].
While the last two bullets do indicate that there is uncertainty in the experimental data due to the few number of laboratory tests, it is unlikely that this is significant relative to other conservatisms in the analysis. The second part of the model involves the mass transport of the hydrogen gas from the surface of the grout to the top of the reactor. The derivation of the mass transport equation is also shown in the Appendix. The following conservatisms and uncertainties were considered when applying the model to the R- and P- reactor vessels.
1) The analysis does not account for dissipation of hydrogen between the surface of the grout and the top of the reactor due to advection. Accounting for this phenomenon would minimize the accumulation of hydrogen in this region.
2) The analysis assumed that the hydrogen bubble plume does not expand laterally from the aluminum metal source. In reality, local concentrated sources of aluminum metal will produce a bubble plume which expands laterally as it rises through the grout. Thus, the potential for a local deflagration/explosion is overestimated in this analysis.
The flux of hydrogen away from the surface is related to the superficial velocity, uo. The superficial velocity may be expressed as: uo = β2 * [g * Ho * (1 – (MH2/Mair))* XLFL
3]1/2 (4) where β is a proportionality constant, g is the acceleration of gravity, Ho is the distance between the grout-air interface and the top of the reactor, M is the molecular weight of either hydrogen or air, and X is the volume % of hydrogen in air at the lower flammability limit (LFL). In the case of hydrogen the LFL is 4% by volume. The incipient flammability condition occurs when the gas generation rate due to corrosion equals the flux of hydrogen through air. The boundary condition at the interface between the grout and air is that the hydrogen gas concentration is at the LFL. For safety class operations, with radioactive materials stored within a vessel, a criterion of 60% LFL is utilized for the evaluation [10]. The equation that describes this condition is: Q * AAl = uo * Aa (5) where AAl is the surface area of aluminum in contact with grout and Aa is the void cross-sectional area of the reactor vessel. Equation 5 can be re-arranged to give the critical areal density ratio. [AAl/Aa]c = uo/Q (6)

December, 2009 SRNL-STI-2009-00639, Rev. 1
Page 6 of 24
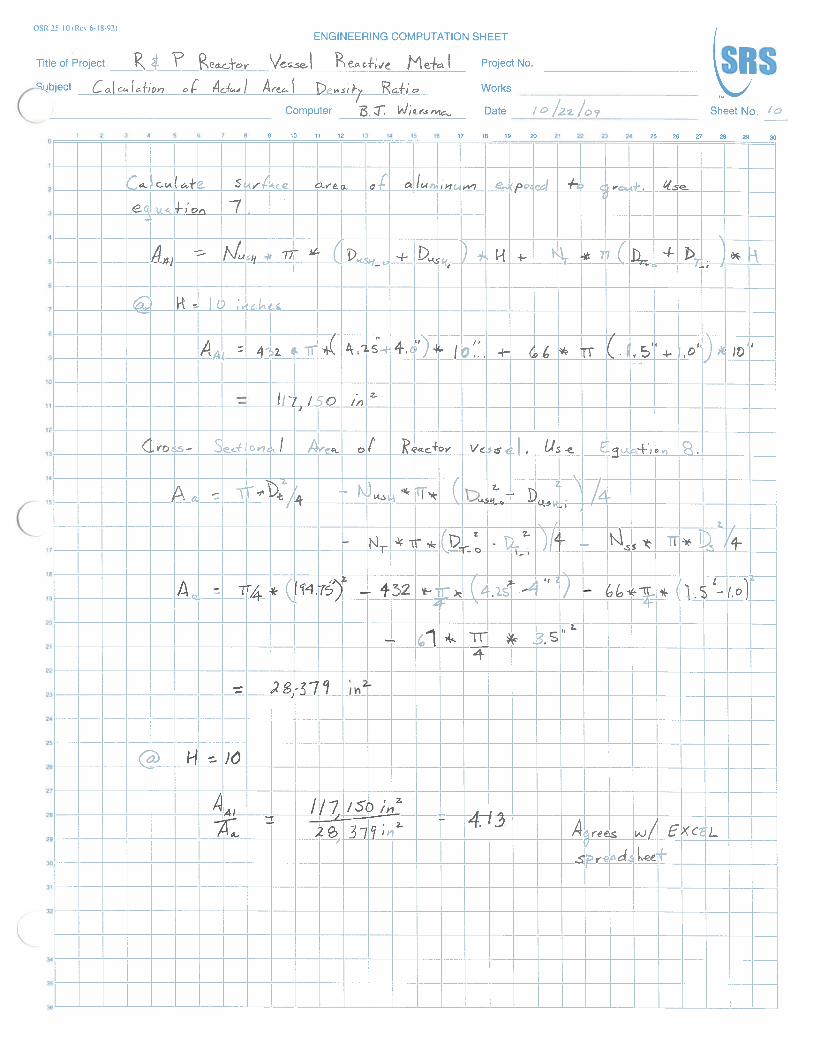
For the analysis, a plot of [AAl/Aa]c vs. H is prepared. Examples of this plot are shown in Figures 1 through 13. If the critical area density is greater than the actual areal density, there is a low probability of a flammable condition. On the other hand if it is less than the actual areal density, there is a possibility of a flammable condition developing. Thermal Analysis Calorimetry experiments are being conducted to estimate the temperature rise that will occur in the grout during these operations [11]. Maximum temperatures observed during these tests for the different grout formulations may be used for final calculations. For this assessment, case studies will be performed for grout temperatures between 50 and 100 °C to understand the effect of temperature on the hydrogen generation rate for the various grout formulations. Determination of Areal Density Ratios Actual areal density ratios are being calculated based on drawings of the vessel and components within the vessel as well as walk-downs of the R- and P-reactor facilities [12]. The predominant aluminum components present in the reactor vessels are the universal sleeve housing (USH) and thimble tubes. It will be assumed that the inner and outer surfaces of these components will be exposed to the grout. The aluminum surface area, AAl, as a function of the fill level, H, was calculated from the following relationship: AAl (h) = NUSH * π *(DUSH_o + DUSH_i) *H + NT * π *(DT_o + DT_i) *H (7) where D is the diameter, subscript USH is for the USH tubes, subscript T is for the thimble tubes, subscript o represents the exterior surface, subscript i represents the interior surface, and N is the quantity of USH or thimble tubes. The calculation did not include the surface area of the ends of the tubes. The cross-sectional area of the vessel, Aa, was calculated by subtracting the cross-sectional area of the USHs, thimble tubes, septifoils and spargers from the total tank cross-sectional area. This is represented by the following equation: Aa = π * Dt
2/4 – NUSH*π*(DUSH_o2-DUSH_i
2)/4 – NT* π*(DT_o2-DT_i
2)/4 – Nss* π*Dss2/4 (8)
where subscript a is for the cross-sectional area, subscript t is for the tank, and subscript ss is for the septifoils and the spargers. In P-reactor it is estimated that there are 432 USH tubes, 61 septifoils, and 66 thimble tubes and 6 spargers [13]. The USH tubes have outer and inner diameters, 4.25 inches and 4.00 inches, respectively. The outer and inner diameters for the thimble tubes are 1.5 inches and 1.0 inches, respectively. The septifoils and spargers were modeled as a cylinder with a diameter of 3.5 inches. Calculations of these areas are exhibited in the Appendix. In R-reactor, it was determined that there are no USH tubes present (i.e., only septifoils, thimbles and spargers are present). The lack of USH tubes means that AAl, and hence the areal density ratio, for R-reactor is less than that of P-reactor by a factor of approximately 25 (see Figures 1-13).

December, 2009 SRNL-STI-2009-00639, Rev. 1
Page 7 of 24
Determination of Volumetric Flow Rate of Hydrogen The maximum volumetric flow rate of hydrogen generated during the grouting operations was also estimated. Knowledge of this value will assist in the evaluation of whether or not there is adequate ventilation to effectively disperse the hydrogen. The volumetric flow rate, QTOT is calculated from the following equation: QTOT = Q * AAl (9) A calculation of this flow rate is exhibited in the Appendix. Results The case studies that were performed are summarized in Table 1 and the results are shown in Figures 1 through 13. Some of the key trends were:
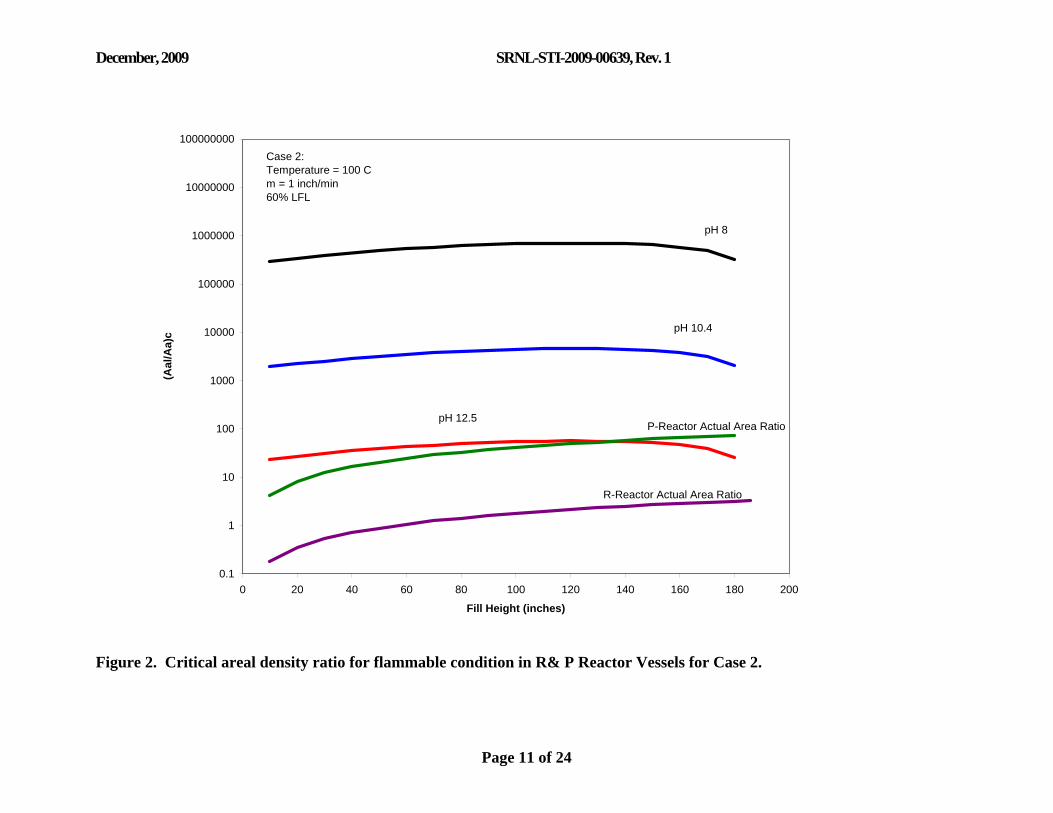
- An increase in temperature resulted in a lower critical areal density and therefore greater risk of developing a flammable condition (e.g., compare Figures 1 and 2).
- An increase in pH resulted in a lower critical areal density and therefore a greater risk of developing a flammable condition (e.g., examine any figure).
- An increase in the fill rate resulted in a lower critical areal density, although the effect was not as great as temperature or pH (see Figure 11).
- The 60% LFL criterion provides a significant margin on the risk of developing a flammable condition (e.g., compare figures 2 and 13).
- An increase in the actual areal density ratio results in a greater risk of developing a flammable condition. Thus, as shown in the figures, there is a greater risk of developing a flammable condition in the P-reactor vessel than there is in the R-reactor vessel.
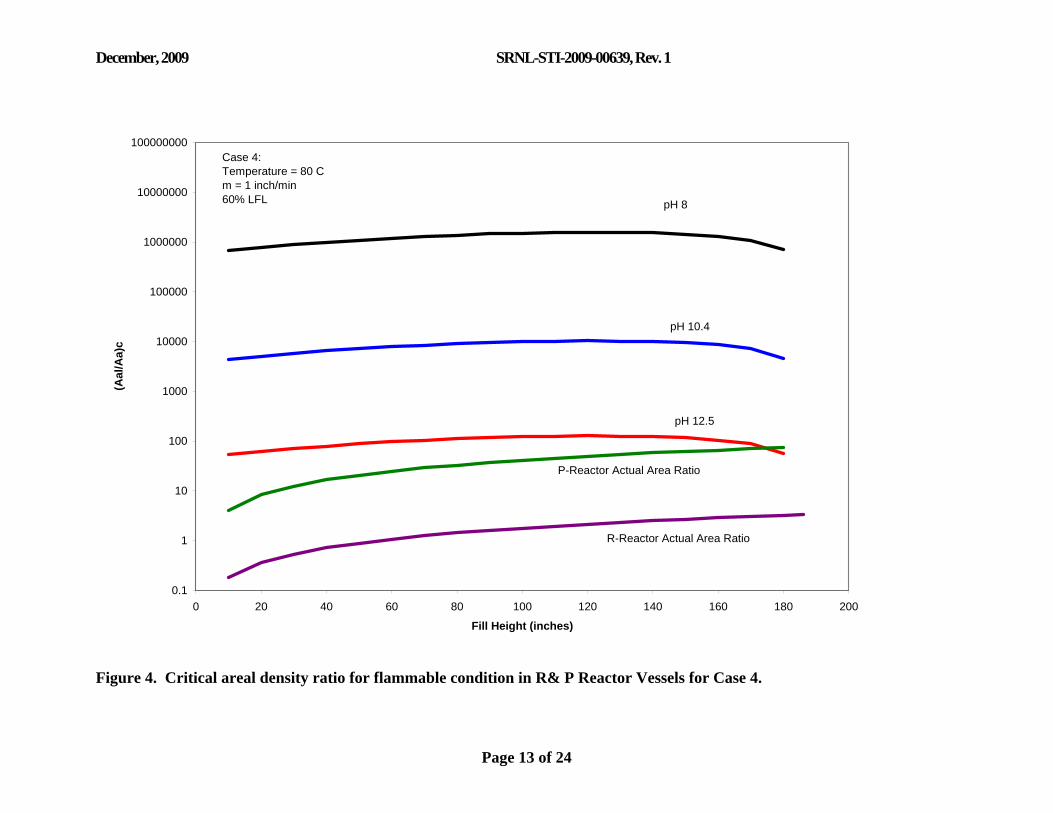
The results of the case studies for the P-reactor vessel demonstrate that two of the grout formulations, the ceramicrete and the silica fume, should not result in a flammable condition during reactor vessel grouting operations as long as they are within the parameters of the case studies. Even at 60% LFL the critical areal density ratio for the silica fume grout is at least 1 to 2 orders of magnitude greater than the actual areal density ratio, while the ratio for the ceramicrete is 3 to 4 orders of magnitude greater. At 100% LFL these margins increase further to 2 to 3 orders of magnitude for the silica fume grout and 4 to 5 orders of magnitude for the ceramicrete. The portland cement grout appears to be a viable option at low temperatures and low fill rates. However, there is less margin on the flammable condition and temperatures as low as 70 °C may result in not meeting the 60% LFL criterion. The results of the case studies for the R-reactor vessel suggest that all three grout formulations may be viable. For example, at the Case 3 conditions (i.e., 70 °C, fill rate of 1 inch/min, 60% LFL, see Figure 3) the critical areal density ratio is 1 to 2 orders of magnitude greater than the actual areal density ratio, while the ratio for the silica fume

December, 2009 SRNL-STI-2009-00639, Rev. 1
Page 8 of 24
grout is 3 to 4 orders of magnitude greater and 5 to 6 orders of magnitude greater for the ceramicrete grout. Although not shown, similar margins would be obtained at a temperature of 80 °C with a fill rate of 0.5 inch/min. Although these results are encouraging, due to the nature of the accident scenario, taking precautions that minimize the potential for a flammable condition are recommended. These measures include ensuring that the building has adequate ventilation during the grouting process, minimizing the grout temperature, and operating at a slower fill rate. In order to evaluate what would be adequate ventilation, the volumetric flow rate of hydrogen was calculated for each case for the P and R-reactor vessels. The results are summarized in Tables 2 and 3. For the P-reactor vessel, the hydrogen flow rates for the pH 8 and pH 10.4 grout are very small, less than 0.32 ft3/min (see Table 2). The flow rates for the pH 12.5 grout are higher than those for the lower pH grouts, ranging between 0.7 and 26 ft3/min, however, the rates appear to be manageable with proper ventilation. For the R-reactor vessel (see Table 3), the flow rates are a factor of approximately 25 less than the P-reactor vessel (i.e., proportional to the change in aluminum surface area). Table 1. Summary of Case Studies
Case Temperature (°C)
Fill Rate (inches/minute)
pH LFL Level (%)
1 50 1 8, 10.4, and 12.5 60 2 100 1 8, 10.4, and 12.5 60 3 70 1 8, 10.4, and 12.5 60 4 80 1 8, 10.4, and 12.5 60 5 50 0.5 8, 10.4, and 12.5 60 6 60 0.5 8, 10.4, and 12.5 60 7 70 0.5 8, 10.4, and 12.5 60 8 50 2 8, 10.4, and 12.5 60 9 60 2 8, 10.4, and 12.5 60 10 70 2 8, 10.4, and 12.5 60 11 70 2, 8, and 16 10.4 60 12 100 2 8, 10.4, and 12.5 60 13 100 1 8, 10.4, and 12.5 100

December, 2009 SRNL-STI-2009-00639, Rev. 1
Page 9 of 24
Table 2. Summary of Volumetric Flow Rates of Hydrogen for the P- Reactor Vessel Case Studies.
pH 10.4 pH 8 pH 12.5
Case Temperature (°C)Fill Rate
(inches/min)Qtot
(cu.ft./min)Qtot
(cu.ft./min)Qtot
(cu.ft./min)1 50 1 1.80E-02 1.20E-04 1.50E+002 100 1 1.60E-01 1.10E-03 1.34E+013 70 1 4.70E-02 3.10E-04 3.80E+004 80 1 7.30E-02 4.80E-04 6.00E+005 50 0.5 9.00E-03 5.90E-05 7.00E-016 60 0.5 1.50E-02 9.70E-05 1.20E+007 70 0.5 2.40E-02 1.50E-04 1.90E+008 50 2 3.50E-02 2.20E-04 2.80E+009 60 2 5.70E-02 3.80E-04 4.70E+0010 70 2 9.20E-02 6.10E-04 7.50E+0011 70 2 9.20E-02 NA NA11 70 8 2.20E-01 NA NA11 70 16 2.70E-01 NA NA12 100 2 3.20E-01 2.10E-03 2.61E+0113 100 1 1.60E-01 1.10E-03 1.34E+01
Table 3. Summary of Volumetric Flow Rates of Hydrogen for the R- Reactor Vessel Case Studies. pH 10.4 pH 8 pH 12.5
Case Temperature
(°C) Fill Rate
(inches/min) Qtot
(cu.ft./min) Qtot
(cu.ft./min)Qtot
(cu.ft./min) 1 50 1 8.00E-04 5.20E-06 6.50E-02 2 100 1 7.30E-03 4.80E-05 5.90E-01 3 70 1 2.10E-03 1.40E-05 1.70E-01 4 80 1 3.20E-03 2.10E-05 2.60E-01 5 50 0.5 4.00E-04 2.60E-06 3.20E-02 6 60 0.5 6.50E-04 4.30E-06 5.30E-02 7 70 0.5 1.00E-03 6.80E-06 8.50E-02 8 50 2 1.50E-03 1.00E-05 1.26E-01 9 60 2 2.50E-03 1.70E-05 2.10E-01
10 70 2 4.10E-03 2.70E-05 3.30E-01 11 70 2 4.00E-03 NA NA 11 70 8 9.90E-03 NA NA 11 70 16 1.20E-02 NA NA 12 100 2 1.40E-02 9.30E-05 1.16E+00 13 100 1 7.30E-03 4.80E-05 5.90E-01

December, 2009 SRNL-STI-2009-00639, Rev. 1
Page 10 of 24
0.1
1
10
100
1000
10000
100000
1000000
10000000
100000000
0 20 40 60 80 100 120 140 160 180 200
Fill Height
(Aal
/Aa)
c
P-Reactor Actual Area Ratio
pH 12.5
pH 10.4
pH 8
Case 1:Temperature = 50 Cm = 1 inch/min60% LFL
R-Reactor Actual Area Ratio
Figure 1. Critical areal density ratio for flammable condition in R& P Reactor Vessels for Case 1.
December, 2009 SRNL-STI-2009-00639, Rev. 1
Page 11 of 24
0.1
1
10
100
1000
10000
100000
1000000
10000000
100000000
0 20 40 60 80 100 120 140 160 180 200
Fill Height (inches)
(Aal
/Aa)
c
P-Reactor Actual Area RatiopH 12.5
pH 10.4
pH 8
Case 2:Temperature = 100 Cm = 1 inch/min60% LFL
R-Reactor Actual Area Ratio
Figure 2. Critical areal density ratio for flammable condition in R& P Reactor Vessels for Case 2.

December, 2009 SRNL-STI-2009-00639, Rev. 1
Page 12 of 24
0.1
1
10
100
1000
10000
100000
1000000
10000000
100000000
0 20 40 60 80 100 120 140 160 180 200
Fill Height (inches)
(Aal
/Aa)
c
P-Reactor Actual Area Ratio
pH 12.5
pH 10.4
pH 8
Case 3:Temperature = 70 Cm = 1 inch/min60% LFL
R-Reactor Actual Area Ratio
Figure 3. Critical areal density ratio for flammable condition in R& P Reactor Vessels for Case 3.
December, 2009 SRNL-STI-2009-00639, Rev. 1
Page 13 of 24
0.1
1
10
100
1000
10000
100000
1000000
10000000
100000000
0 20 40 60 80 100 120 140 160 180 200
Fill Height (inches)
(Aal
/Aa)
c
P-Reactor Actual Area Ratio
pH 12.5
pH 10.4
pH 8
Case 4:Temperature = 80 Cm = 1 inch/min60% LFL
R-Reactor Actual Area Ratio
Figure 4. Critical areal density ratio for flammable condition in R& P Reactor Vessels for Case 4.

December, 2009 SRNL-STI-2009-00639, Rev. 1
Page 14 of 24
0.1
1
10
100
1000
10000
100000
1000000
10000000
100000000
1000000000
0 20 40 60 80 100 120 140 160 180 200
Fill Height (inches)
(Aal
/Aa)
c
P-Reactor Actual Area Ratio
pH 12.5
pH 10.4
pH 8
Case 5:Temperature = 50 Cm = 0.5 inch/min60% LFL
R-Reactor Actual Area Ratio
Figure 5. Critical areal density ratio for flammable condition in R& P Reactor Vessels for Case 5.

December, 2009 SRNL-STI-2009-00639, Rev. 1
Page 15 of 24
0.1
1
10
100
1000
10000
100000
1000000
10000000
100000000
0 20 40 60 80 100 120 140 160 180 200
Fill Height (inches)
(Aal
/Aa)
c
P-Reactor Actual Area Ratio
pH 12.5
pH 10.4
pH 8Case 6:Temperature = 60 Cm = 0.5 inch/min60% LFL
R-Reactor Actual Area Ratio
Figure 6. Critical areal density ratio for flammable condition in R& P Reactor Vessels for Case 6.

December, 2009 SRNL-STI-2009-00639, Rev. 1
Page 16 of 24
0.1
1
10
100
1000
10000
100000
1000000
10000000
100000000
0 20 40 60 80 100 120 140 160 180 200
Fill Height (inches)
(Aal
/Aa)
c
P-Reactor Actual Area Ratio
pH 12.5
pH 10.4
pH 8
Case 7:Temperature = 70 Cm = 0.5 inch/min60% LFL
R-Reactor Actual Area Ratio
Figure 7. Critical areal density ratio for flammable condition in R& P Reactor Vessels for Case 7.

December, 2009 SRNL-STI-2009-00639, Rev. 1
Page 17 of 24
0.1
1
10
100
1000
10000
100000
1000000
10000000
100000000
0 20 40 60 80 100 120 140 160 180 200
Fill Height (inches)
(Aal
/Aa)
c
P-Reactor Actual Area Ratio
pH 12.5
pH 10.4
pH 8
Case 8:Temperature = 50 Cm = 2 inch/min60% LFL
R-Reactor Actual Area Ratio
Figure 8. Critical areal density ratio for flammable condition in R& P Reactor Vessels for Case 8.

December, 2009 SRNL-STI-2009-00639, Rev. 1
Page 18 of 24
0.1
1
10
100
1000
10000
100000
1000000
10000000
100000000
0 20 40 60 80 100 120 140 160 180 200
Fill Height (inches)
(Aal
/Aa)
c
P-Reactor Actual Area Ratio
pH 12.5
pH 10.4
pH 8
Case 9:Temperature = 60 Cm = 2 inch/min60% LFL
R-Reactor Actual Area Ratio
Figure 9. Critical areal density ratio for flammable condition in R& P Reactor Vessels for Case 9.

December, 2009 SRNL-STI-2009-00639, Rev. 1
Page 19 of 24
0.1
1
10
100
1000
10000
100000
1000000
10000000
100000000
0 20 40 60 80 100 120 140 160 180 200
Fill Height (inches)
(Aal
/Aa)
c
P-Reactor Actual Area Ratio
pH 12.5
pH 10.4
pH 8
Case 10:Temperature = 70 Cm = 2 inch/min60% LFL
R-Reactor Actual Area Ratio
Figure 10. Critical areal density ratio for flammable condition in R& P Reactor Vessels for Case 10.

December, 2009 SRNL-STI-2009-00639, Rev. 1
Page 20 of 24
0.1
1
10
100
1000
10000
100000
0 20 40 60 80 100 120 140 160 180 200
Fill Height (inches)
(Aal
/Aa)
c
P-Reactor Actual Area Ratio
m = 16 inches/min m = 8 inches/min
m= 2 inches/min
Case 11:Temperature = 70 CpH = 10.460% LFL
R-Reactor Actual Area Ratio
Figure 11. Critical areal density ratio for flammable condition in R& P Reactor Vessels for Case 11.

December, 2009 SRNL-STI-2009-00639, Rev. 1
Page 21 of 24
0.1
1
10
100
1000
10000
100000
1000000
10000000
0 20 40 60 80 100 120 140 160 180 200
Fill Height (inches)
(Aal
/Aa)
c
P-Reactor Actual Area Ratio
pH 12.5
pH 10.4
pH 8
Case 12:Temperature = 100 Cm = 2 inch/min60% LFL
R-Reactor Actual Area Ratio
Figure 12. Critical areal density ratio for flammable condition in R& P Reactor Vessels for Case 12.

December, 2009 SRNL-STI-2009-00639, Rev. 1
Page 22 of 24
0.1
1
10
100
1000
10000
100000
1000000
10000000
100000000
0 20 40 60 80 100 120 140 160 180 200
Fill Height (inches)
(Aal
/Aa)
c
P-Reactor Actual Area Ratio
pH 12.5
pH 10.4
pH 8
Case 13:Temperature = 100 Cm = 1 inch/min100% LFL
R-Reactor Actual Area Ratio
Figure 13. Critical areal density ratio for flammable condition in R& P Reactor Vessels for Case 13.

December, 2009 SRNL-STI-2009-00639, Rev. 1
Page 23 of 24
Conclusions and Recommendations The assessment concluded that either ceramicrete or the silica fume grout may be used to safely grout the P-reactor vessel. The risk of accumulation of a flammable mixture of hydrogen between the grout-air interface and the top of the reactor is very low. Portland cement grout, on the other hand, for the same range of process parameters does not provide a significant margin of safety against the accumulation of flammable gas in the reactor vessel during grouting operations in the P-reactor vessel. It is recommended that this grout not be utilized for this task. The R-reactor vessel contains significantly less aluminum and thus a Portland cement grout may be considered as well. For example, if the grout fill rate is less than 1 inch/min and the grout temperature is maintained at 70 °C or less, the risk of hydrogen accumulation in the R-reactor vessel is very low for the Portland cement. Alternatively, if the grout fill rate is less than 0.5 inch/min and the grout is maintained at a temperature of 80 °C, the risk will again be very low. Although these calculations are conservative, there are some measures that may be taken to further minimize the potential for hydrogen evolution.
1. Minimize the temperature of the grout as much as practical. Lower temperatures will mean lower hydrogen generation rates. For P-reactor, grout temperatures less than 100 °C should provide an adequate safety margin for the pH 8 and pH 10.4 grout formulations. For R-reactor, grout temperatures less than 70 °C or 80 °C will provide an adequate safety margin for the Portland cement. The other grout formulations are also viable options for R-reactor.
2. Minimize the grout fill rate as much as practical. Lowering the fill rate takes advantage of passivation of the aluminum components and hence lower hydrogen generation rates. For P-reactor, fill rates that are less than 2 inches/min for the ceramicrete and the silica fume grouts will reduce the chance of significant hydrogen accumulation. For R-reactor, fill rates less than 1 inch/min will again minimize the risk of hydrogen accumulation.
3. Ventilate the building as much as practical (e.g., leave doors open) to further disperse hydrogen. The volumetric hydrogen generation rates in the P-reactor vessel, however, are low for the pH 8 and pH 10.4 grout, i.e., less than 0.32 ft3/min.
If further walk-down inspections of the reactor vessels suggest an increase in the actual areal density of aluminum, the calculations should be re-visited.

December, 2009 SRNL-STI-2009-00639, Rev. 1
Page 24 of 24
References
1. B. J. Wiersma, “Reactive Metal (Al) Interactions During Grouting Operations of the R- and P-Reactor Vessels,” SRNL-RP-2009-01198,” Rev. 0, September 2009.
2. B. J. Wiersma, “Assessment of the Potential for Hydrogen Generation During Grouting Operations in R-Reactor Disassembly Basin”, SRNL-STI-20090-00278, April, 2009.
3. S. M. Short and B. M. Parker, “Potential for Generation of Flammable Mixtures of Hydrogen from Aluminum-Grout Interaction During Basin Grouting”, PNNL-15156, April 2005.
4. M. Epstein and J. P. Burelbach, “Transient Vertical Mixing by Natural Convection in a Wide Layer”, Int. J. Heat Mass Transfer, Vol. 43, pp. 321-325.
5. T. Matsuo, T. Nishi, and M. Matsuda, “LiNO3 Addition to Prevent Hydrogen Gas Generation from Cement-Solidified Aluminum Wastes”, J. Nuclear Science Technology, Vol. 32, No. 9, pp. 912-920, 1995.
6. Chatalov in Atlas of Electrochemical Equilibria in Aqueous Solutions, M. Pourbaix, NACE, Houston, TX, 1974.
7. A. B. McKee and R. H. Brown, “Resistance of Aluminum to Corrosion in Solutions Containing Various Anions and Cations”, Corrosion, Vol. 3, December, 1947, p. 595.
8. T. Matsuo, et al., “LiNO3 Effect on Corrosion Prevention of Aluminum with Complex Shapes”, J. Nuclear Science and Technology, Vol. 34, No. 8, pp. 823-828, 1997.
9. T. Matsuo, et al., “Influence of Increased Temperature from Cement Hydration on Aluminum Corrosion Prevention when LiNO3 is Added to the Cement”, Nuclear Technology, Vol. 125, pp. 332-336, March 1999.
10. B. C. Landeene, “CSTF Flammability Control Program”, WSRC-TR-2003-00087, Rev. 13, January 13, 2008.
11. H. Guerrero, “Thermo-Physical Characterization of Reactor Vessel Fill Materials for P and R Reactor In-Situ Decommissioning,” SRNL-RP-2009-01185, September 2009.
12. N. Vrettos, “P&R Reactor Void Volume and Surface Area Derivation”, SRNL-L1300-2009-00060, October 15, 2009.
13. Personal Communication from W. Epling to G. Rose, “Final As-Left Status of P Reactor Tank”, October 9, 2006.

December, 2009 SRNL-STI-2009-00639, Rev. 1
Page A-1
APPENDIX