Embed Size (px)
Citation preview

Assessment of the preference of smallholders'
farmers on the adoption of irrigation techniques
and soil conservation interventions in the Kikuletwa
Catchment of Pangani River Basin, Tanzania.
By: Magreth Fadhili Mziray
Supervisors: Prof. Pieter van der Zaag
Dr. Marloes Mul
External examiner: Dr. Abraham Mehari Haile
Smallholder System Innovations in Integrated Watershed ManagementSmallholder System Innovations in Integrated Watershed Management

Outlines
Introduction
Problem statement
Objective and Research Questions
Methodology
Data analysis
Results and discussion
Conclusion and recommendations
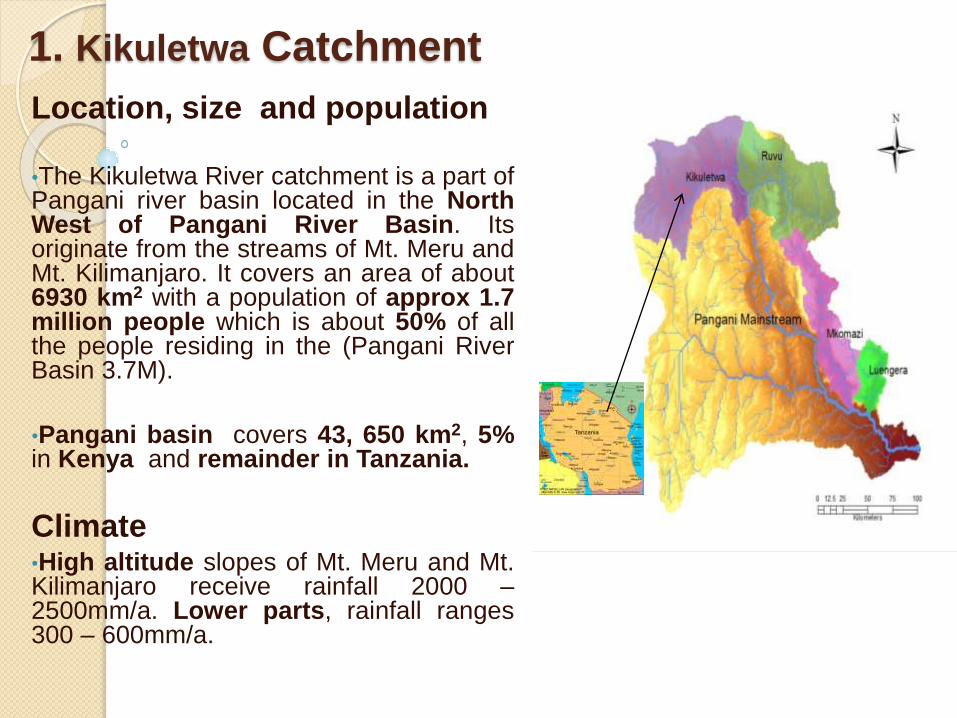
1. Kikuletwa Catchment
Location, size and population
•The Kikuletwa River catchment is a part ofPangani river basin located in the NorthWest of Pangani River Basin. Itsoriginate from the streams of Mt. Meru andMt. Kilimanjaro. It covers an area of about6930 km2 with a population of approx 1.7million people which is about 50% of allthe people residing in the (Pangani RiverBasin 3.7M).
•Pangani basin covers 43, 650 km2, 5%in Kenya and remainder in Tanzania.
Climate•High altitude slopes of Mt. Meru and Mt.Kilimanjaro receive rainfall 2000 –2500mm/a. Lower parts, rainfall ranges300 – 600mm/a.

2. Problem statement
About 80% of Pangani River Basin’s population relies on agriculture,
using traditional methods for SWC. For example, PBWO identified more
than 2000 traditional furrows within the basin, and their irrigation
efficiency among them are often as low as 15% (IUCN, 2007). About
80% of water is lost from the point of abstraction to the destination point
of which high percentage may not be recovered or reused. Yield
production is also low. This therefore, results in low soil and water
productivity. This implies also less water available for other users
especially downstream including the environment.
Many studies / research have provided SWC techniques that have
shown positive results in the water use efficiency, soil conservation and
improved in crop yields. (Kosgei et al., 2007; Kahinda et al., 2007;
Mupangwa et al., 2006; Rockström et al., 2002). However, the majority of
the farmers continue to practise these traditional practices.

3. Objective and research questions
Objective: The main objective is to assess and understand the preferencesof smallholder farmers to improved irrigation technologies and soil conservationinterventions that lead to increased soil and water productivity and environmentalsustainability in the river basin.
Research questions1. What irrigation techniques and soil conservation interventions are promoted for
improved water productivity and environmental sustainability in Pangani River Basin?
2. a) What techniques do farmers use to conserve soil and water in their farms?
b) What are the main reasons for smallholder farmers not to adopt technologies that lead to improved soil and water productivity of the entire river basin?
3. What are the preferences and the willingness of the smallholder farmers to adopt irrigation techniques and soil conservation interventions in the river basin?
4. What are the socio economic factors influence the preferences of smallholder farmer's in choosing irrigation and soil conservation interventions?

4. Methodology
Choice experiment: Choice experimentation is a technique in
which individuals choose their most preferred resource use option from a
range of alternatives with different attributes and levels by using a choice
card.
Steps.
Selection of attributes and levels for designing choice cards.
- Different visits to NGOs and government departments
- Secondary data
Designing choice cards using SPSS model
Data collection and processing
Analysis

Attributes and levels for irrigation techniques and soil
conservation interventions used for designing choice cards
Attribute Level
Irrigation type Micro drip, Micro sprinkler ,
Improved furrow
Financing level 40%,50%,80%
Provider Microfinance, NGO
Contract (years) 3,6
Attribute Level
Terracing and gully erosion Grass strip, Fanya juu, Soil and
stone bunds
Tree planting and agroforestry Mixed farming, Hedging
Subsidy 50%,80%
Provider Government, NGO
Table 1: Attributes and levels for irrigation techniques
Table 2: Attribute and levels for soil conservation interventions

Example of choice card
Attributes/
Levels Choice 1 Choice 2 Choice 3 Choice 4 Status quo
Irrigation type
Improved furrow Sprinkler Improved furrowMicro drip
Financing level 40% 50% 50% 40%
Provider Microfinance Microfinance NGOs Microfinance
Contract period
(years) 6 3 6 6
Note: 'Status quo' refers to the ‘no change’ alternative, i.e. maintaining the existing utility of the
current practice and receiving no compensation.

Data Collection
Upstream Downstream
- Weruweru ward in
Kilimanjaro and Sakila
village in Arusha
-Mbuguni ward in
Arusha region
-2 choice sets were
used - Hilly terrain
-1 choice set. Low land
suited for irrigation only
Note: Sakila village where the soil
conservation interventions data
observations were discarded because the
enumerators didn’t undertake the survey
correctly.
Map showing upstream and downstream catchment surveyed villages

Table3: Summary for locations of the interview
Ward Village Total
number/village
Number of
interview for
each village
Total Choice Card
Mbuguni
Msitu wa mbogo 1500 54
104Irrigation
measure
Kikuletwa 1000 50
Weruweru
Tella-Lyamungo 1500 47
97
Irrigation and
Soil
conservationNarum-Orori 1300 50
Total 5,300 201 201

Data analysis
NLOGIT model:
• Statistical model for distribution and interpretation of the
utility functions for the survey.
• The analysis based on the followings:
Characteristics of the smallholders farmers for upstream, downstream and
catchment level.
Preferences of smallholders farmers on irrigation technologies and soil
conservation interventions.
Principal socio economic factors.

5.Results: 5.1: Table 3: Characteristics of the surveyed smallholders farmers
Sample size 201 97 104
Whole Catchment Upstream Downstream
Age classification (%) Below 30 (years) 4.5 6.19 2.88
30-50 (years) 56.2 43.3 68.27
Above 50 (years) 39.3 50.1 28.89
Gender (%)Female 16.9 14.4 19.2
Male 83.1 85.6 80.8
Income (Tshs/Month)Mean
103,000 95,000 110,000
Minimum20,000 20,000 15,000
Maximum925,000 400,000 925,000
Family size (No) Mean5.6 5.6 5.6
Minimum1 2 1
Maximum11 11 10
Farm size (ha) Mean3.1 2.3 3.8
Minimum0.3 0.5 0.3
Maximum 50 14 50
Education (%) Literate 89.5 90.7 88.5
Illiterate 10.5 9.3 11.5
Land ownership (%) 98100 96.15

Attributes / levels Coefficient of utility function
Variables
Whole catchment Upstream Downstream
Drip -0.63 -0.87 -0.44
Sprinkler -0.30 -0.13 -0.39
Alternate Furrow (AF) 1.11 1.82 0.52
Microfinance 0.27 0.72 -0.02
NGO -0.10 0.09 -0.29
Finance -0.003 0.01 -0.01
Contract 0.19 0.05 0.33
ASC* -0.17 -0.81 0.31
Statistics
R2 (McFadden) 0.25 0.37 0.27
Log likelihood -1089 -391 -617
No. of Observations 804 388 416
Table 4: Choice model results for Irrigation technologies
*ASC is Alternative Specific Constant which represents the status quo option
5.2 : Choice model results

Table 5: Choice model results for Soil conservation interventions
Attributes / levels Coefficient of utility function
Variables
Fanya juu -0.38
Grass strip 1.11
Soil and stone bunds (SSB) -0.43
Mixed farming 0.39
Hedging -0.09
Subsidy 0.02
NGO 0.08
Government 0.22
ASC -0.30
Statistics
R2 (McFadden) 0.25
Log likelihood -464
No. of Observations 388

5.3 Socio economic factors
Table 6: Irrigation techniques and socio economic characteristics
Attributes /
levels
Coefficient of utility function
Variables Family size (No) Farm Size (Ha) Income (Tz Shillings / Month)
< = 4 > 4 < 3 >= 3 < 1 > = 1
Drip -0.70 -0.60 -0.74 -0.44 -0.65 -0.60
Sprinkler -0.14 -0.37 -0.37 -0.19 -0.41 -0.17
Alternative
Furrow 1.11 1.11 1.40 0.72 1.13 1.07
Microfinance 0.31 0.26 0.35 0.19 0.27 0.27
NGO -0.04 -1.11 -0.06 -0.11 -0.20 0.03
Finance -0.01 0.00 -0.01 0.00 0.00 -0.01
CONTRACT 0.16 0.21 0.16 0.24 0.21 0.18
ASC* -0.27 -0.14 -0.29 0.09 -0.07 -0.30
Number for
each group 63 138 123 78 115 86
Statistics R2
(McFadden) 0.24 0.27 0.20 0.21 0.27 0.24
Log likeli hood -350 -735 -627 -441 -614 -473
No. of
Observations 252 552 492 312 460 344

Table 7: Soil conservation interventions and socio economic characteristics
Attributes /
levels Coefficient of utility function
Variables Family size (No) Farm Size (Ha) Income** (Tz Shillings /
Month)
All class < 5 >= 5 < =2 > 2 < 1 >= 1
Fanya juu -0.38 -0.19 -0.48 -0.35 -0.43 -0.25 -0.42
Grass strip 1.11 0.94 1.20 1.16 1.02 1.32 0.91
Soil and stone
bunds -0.43 -0.66 -0.33 -0.61 -0.12 -0.97 0.32
Mixed farming 0.39 0.14 0.51 0.40 0.37 0.28 0.67
Hedging -0.09 -0.05 -0.12 -0.20 0.10 -0.18 0.15
Subsidy 0.02 0.02 0.02 0.02 0.02 0.02 0.02
NGO 0.08 -0.27 0.23 -0.03 0.24 -0.07 0.43
Government 0.22 0.36 0.16 0.22 0.23 0.17 0.38
ASC -0.30 -0.09 -0.40 -0.20 -0.47 -0.10 -0.81
Number for
different
groups 97 29 68 66 31 63 34
Statistics R2 (McFadden)
0.254 0.23 0.28 0.28 0.22 0.29 0.25
Log likelihood
-464.428 -143 -316 -305 -156 -285 -163
No. of
Observations 388 116 272 264 124 252 136

Challenges
The expansive areas of the survey chosen with key stakeholders.
The enumerator required training and supervision which was not
adequate because of time limitations.

6. Conclusion
Irrigation
98% of the surveyed farmers are currently implementing traditional furrow
irrigation.
The study found that the farmers willing to adopt improved irrigation
technologies that provided them with higher utility or welfare than the ones they
are currently using i.e. traditional furrow irrigation.
The alternate furrow irrigation was found to be the preferred technology for
catchment, upstream catchment as well as the downstream.
Soil conservation interventions
97 smallholders in the upstream catchment were also surveyed:
Terraces: grass strip
Agroforestry: mixed farming and hedging

Cont..Socio economic analysis of key factors:
No change on the overall preference:
However, there is a slightly improvement in the utility of sprinkler
irrigation for larger farm size and higher income classes which
resulted in a lower utility for alternate furrow irrigation. Similarly,
hedging, an agroforesty technique showed positive utility for the larger
farm sizes and higher income classes in the soil conservation
interventions.

Recommendations
Education for smallholder farmers of the Kikuletwa catchment (pilot
farms & role plays that demonstrates explicitly the benefits of Irrigation
technologies and SWC interventions to the farmers and entire basin)
More research on improving furrow irrigation systems
Limited research
It’s the preferred technology
The finding of the preferences of the smallholders' farmers should be
taken into consideration by policy makers and implementation agencies
including Government bodies on the successful uptake of interventions
in the river basin.
THANK YOU