Embed Size (px)
Citation preview
ARO p-ISSN: 2410-9355, e-ISSN: 2307-549X
8 http://dx.doi.org/10.14500/aro.10678
Assessment of the Upstream Slope Stability of Darbandikhan Rockfill Dam during Drawdown
1Department of City Planning, Technical College of Engineering, Sulaimani Polytechnic University, Sulaymaniyah, Kurdistan Region – F.R. Iraq
2Koya Technical Institute, Erbil Polytechnic University, Koya, Kurdistan Region – F.R. Iraq
Abstract—Earth and rockfill dams face a variety of loading conditions during lifetime. One of the most critical loading conditions is the rapid drawdown of water level after steady state conditions. Rapid drawdown may cause instability of upstream slope of the dam. The present work examines the stability of a rockfill dam under different drawdown rates in terms of factor of safety for the upstream slope of the dam. For this purpose, a computer software named GeoStudio 2012 SEEP/W and SLOPE/W has been used for the numerical analysis. The results showed that the drawdown rate has a significant effect on stability of rockfill dam in which increasing the drawdown rate from 1 m/day to 10 m/day decreases the stability of the dam by 33%. Based on the outcomes, for the studied case the drawdown rate (1 m/day) can be recommended.
Index Terms—Drawdown rate, Earth/Rockfill dam, Factor of safety, GeoStudio 2012, Pore water pressure
I. IntroductionMany partial or total failures of earth/rockfill dams have been recorded around the globe as a result of prompt lowering of reservoir level; the most famous case was San Luis Dam in California. The dam was among the largest earth dams in the world (height = 100 m, length = 5500 m). The dam was safe for several years during normal steady state operation. Upstream slide happened in 1981 due to fast drawdown of water to nearly mid-height of the dam (Sica, Pagano and Rotili, 2019; Alonso and Pinyol, 2009). During steady state, the water in the reservoir is at normal level, this condition helps the stabilization of upstream slope. When, it is necessary to drawdown the water quickly for emergency case or any operation reason, the upstream slope subjects one of the critical conditions that need a comprehensive study on
stability of the dam (Alonso and Pinyol, 2009; Siacara, Beck and Futai, 2020).
Rapid drawdown of water has two impacts; changing the pore water pressure of the dam materials and reducing the external hydrostatic pressure (Siacara, Beck and Futai, 2020). Reduction of water level may cause instability of the dam since the water inside the soil cannot escape from the soil as the water drawdown from the reservoir (Siacara, Beck and Futai, 2020; Pinyol, Alonso and Olivella, 2008). There are some factors which affect the stability of upstream slope under drawdown conditions such as hydraulic conductivity and mechanical properties of soil, side slope ratio, and the rate of reducing water level (Siacara, Beck and Futai, 2020; Souliyavong, et al., 2012; Fattah, Omran and Hassan, 2015; Tatewar and Pawade, 2012).
Gao, et al. (2013) prepared stability charts to find factor of safety more precisely for 3D slopes during four rapid drawdown scenarios based on the kinematic approach of limit analysis. Sica, Pagano and Rotili (2019) pointed out that specifying the maximum drawdown rate which a dam can be experienced during its life safely is very important particularly for those dams located near to the earthquake prone areas.
In this paper, two-dimensional numerical analysis to study the behavior of a high rockfill dam in Kurdistan was adopted using GeoStudio 2012 software, which has a great importance for electricity generation, water supply, irrigation, and flood control. The embankment is one of the largest dams in Kurdistan named Darbandikhan rockfill dam. One of the incentives of adopting this study is that the dam authority may be obligated to evacuate the reservoir for inspection and maintenance of the dam especially after the earthquake. Therefore, this paper presents the safe drawdown rate for Darbandikhan dam that the dam’s authority can apply.
II. Methodology and ModelingThe research is carried out to study the stability of the
upstream dam slope during drawdown and analysis of transient seepage condition to determine the pore water pressure.
Sirwan Gh. Salim 1 and Krikar M. G. Noori2
ARO-The Scientific Journal of Koya University Vol. IX, No.1 (2021), Article ID: ARO.10678, 8 pages DOI: 10.14500/aro.10678 Received 16 May 2020; Accepted: 25 January 2021 Regular research paper: Published: 01 March 2021 Corresponding author’s e-mail: [email protected] Copyright © 2021 Sirwan Gh. Salim and Krikar M.G. Noori.This is an open-access article distributed under the Creative Commons Attribution License.
ARO p-ISSN: 2410-9355, e-ISSN: 2307-549X
http://dx.doi.org/10.14500/aro.10678 9
A. Seepage Analysis TheoryThe fundamental flow laws for steady state and transient
condition based on Darcy’s law, in this regard, SEEP/W is formulated on the basis that the flow of water through both saturated and unsaturated soil follows Darcy’s equation (SEEP/W, 2012; Rulon and Freeze, 1985). The general governing differential equation for two-dimensional seepage can be expressed as:
∂∂
∂∂
+
∂∂
∂∂
+ =
∂∂x
k Hx y
k Hy
Qtx y� � � � � (1)
Where H = total head, kx = hydraulic conductivity in the x direction; ky = hydraulic conductivity in y-direction; Q = applied boundary flux; θ = volumetric water content; and t = time.
B. Slope Stability Analysis TheoryLimit equilibrium analysis methods have been applied in
solving geotechnical engineering problems for many years to evaluate the stability of embankment slopes. In this regard, applying SLOPE/W uses the theory of limit equilibrium of forces and moments, stability analysis of embankment dam can be accomplished to determine the critical failure surface and compute the values of factor of safety against failure (SLOPE/W, 2012).
The slope stability is governed by upward resisting forces and downward mobilized forces. The relative stability of slope is characterized by the term factor of safety (FOS). The factor of safety is expressed as that factor by which the shear strength of the soil must be reduced to bring the mass of soil into a state of limiting equilibrium along a selected slip surface, and defined as:
FoSSSresisting
mobilised
� �� (2)
Shear strength (resistance):
S c N u tanresisting = + −( ) ∅' ' (3)
Shear mobilized: S Wsinmobilised = � � � � � � � � (4)
where: c’ = effective cohesion, φ’ = effective angle of internal friction, N = W cos α total normal stress, and u = pore-water pressure. W = the slice weight, α = base inclination.
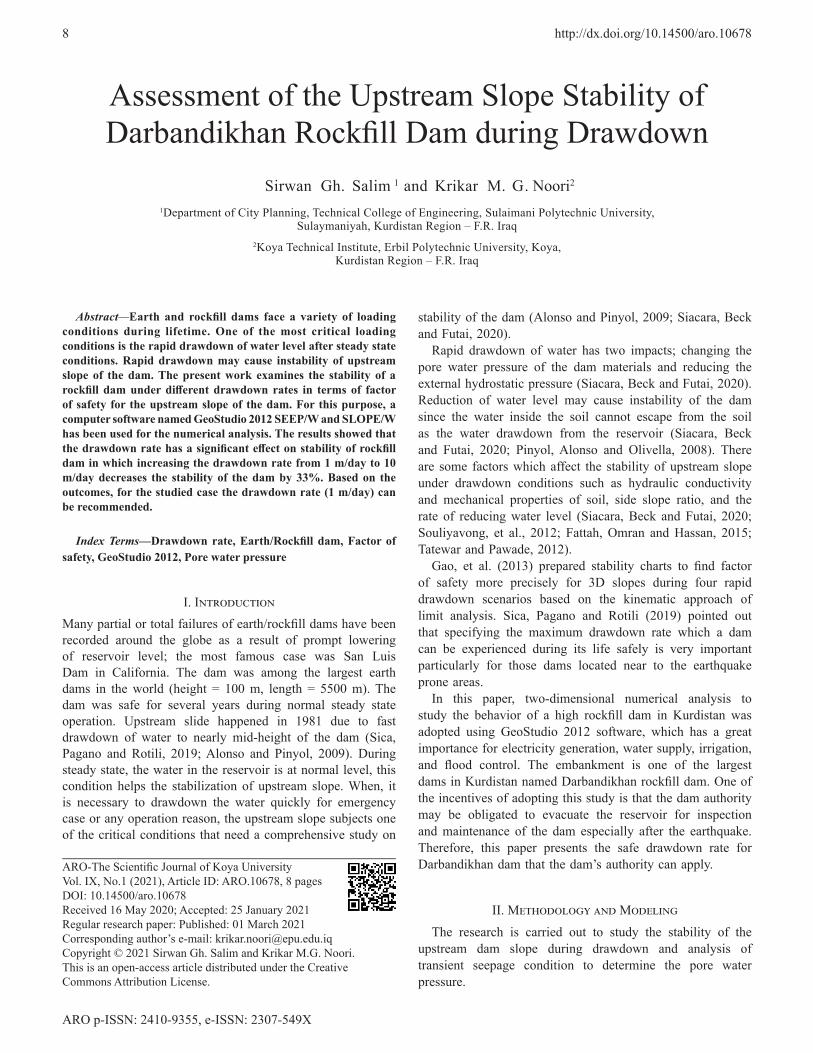
In this study, various limit equilibrium methods such as the methods of Bishop (Bishop, 1955) (Bishop and Morgenstern, 1960), Morgenstern-Price (Morgenstrern and Price, 1965), (Janbu, 1954) (Janbu, 1968), and Swedish Ordinary (or Fellenius method) (Fellenius, 1936) have been used to analyze the slope of the embankment dam during drawdown conditions. Fig. 1 illustrates all the forces acting on a circular slip surface.
Reference can be made to Fig. 1, the factor of safety with respect to moment equilibrium and horizontal force equilibrium, respectively, is:
( )' '( )
mx f e d a
c R N u R tanFoS
W N kW D A
+ −=
− + ± ±∑
∑ ∑ ∑ ∑ ∑ (5)
( )' '( cos cos )
sin cos
f
c N u tanFoS
N kW D A
+ −=
+ − ±∑∑ ∑ ∑ ∑ (6)
C. Case study: Darbandikhan Rockfill Dam Darbandikhan dam is a multi-applications embankment
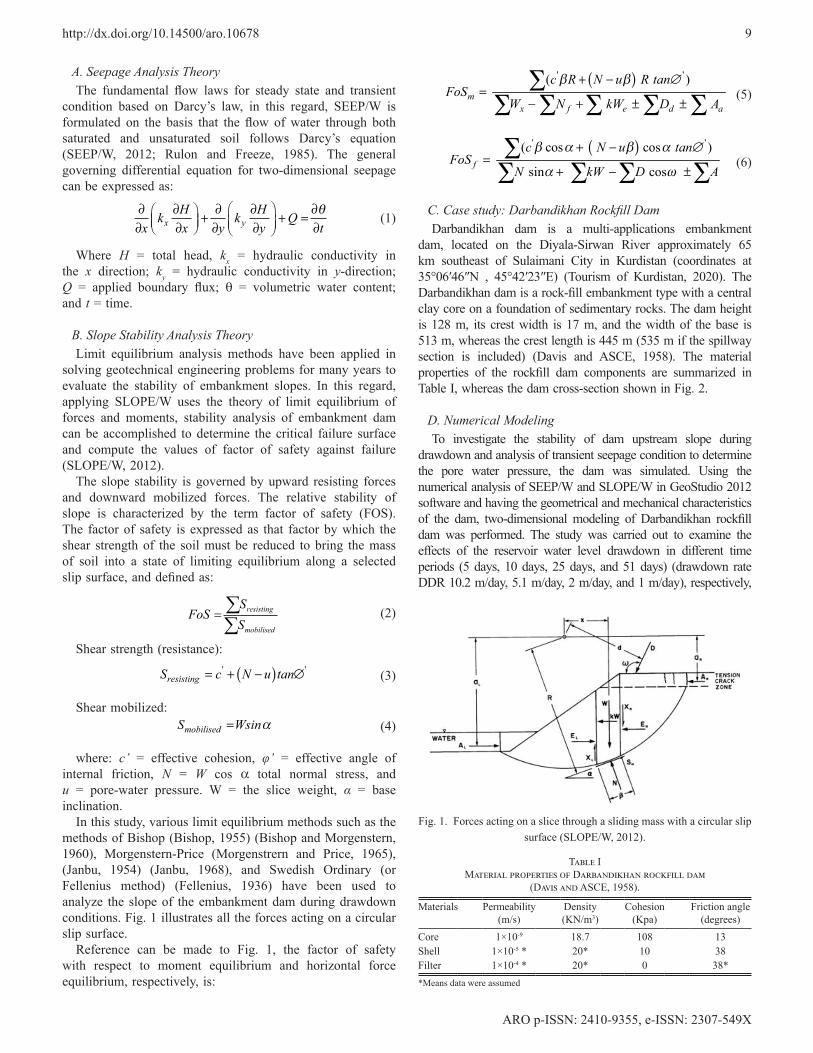
dam, located on the Diyala-Sirwan River approximately 65 km southeast of Sulaimani City in Kurdistan (coordinates at 35°06′46″N , 45°42′23″E) (Tourism of Kurdistan, 2020). The Darbandikhan dam is a rock-fill embankment type with a central clay core on a foundation of sedimentary rocks. The dam height is 128 m, its crest width is 17 m, and the width of the base is 513 m, whereas the crest length is 445 m (535 m if the spillway section is included) (Davis and ASCE, 1958). The material properties of the rockfill dam components are summarized in Table I, whereas the dam cross-section shown in Fig. 2.
D. Numerical ModelingTo investigate the stability of dam upstream slope during
drawdown and analysis of transient seepage condition to determine the pore water pressure, the dam was simulated. Using the numerical analysis of SEEP/W and SLOPE/W in GeoStudio 2012 software and having the geometrical and mechanical characteristics of the dam, two-dimensional modeling of Darbandikhan rockfill dam was performed. The study was carried out to examine the effects of the reservoir water level drawdown in different time periods (5 days, 10 days, 25 days, and 51 days) (drawdown rate DDR 10.2 m/day, 5.1 m/day, 2 m/day, and 1 m/day), respectively,
Fig. 1. Forces acting on a slice through a sliding mass with a circular slip surface (SLOPE/W, 2012).
Table IMaterial properties of Darbandikhan rockfill dam
(Davis and ASCE, 1958).
Materials Permeability (m/s)
Density (KN/m3)
Cohesion (Kpa)
Friction angle (degrees)
Core 1×10⁻⁹ 18.7 108 13Shell 1×10-5 * 20* 10 38Filter 1×10-4 * 20* 0 38**Means data were assumed
ARO p-ISSN: 2410-9355, e-ISSN: 2307-549X
10 http://dx.doi.org/10.14500/aro.10678
and to determine the factor of safety and pore water pressure on the dam upstream slope using various limit equilibrium methods such as Bishop’s method, Morgenstern-Price, Janbu, and Swedish Ordinary method. It should be mentioned that the maximum water level drawdown is almost 51 m, from normal operating level (elevation 485m) drawdown to maximum drawdown level (elevation 434 m) (Davis and ASCE, 1958).
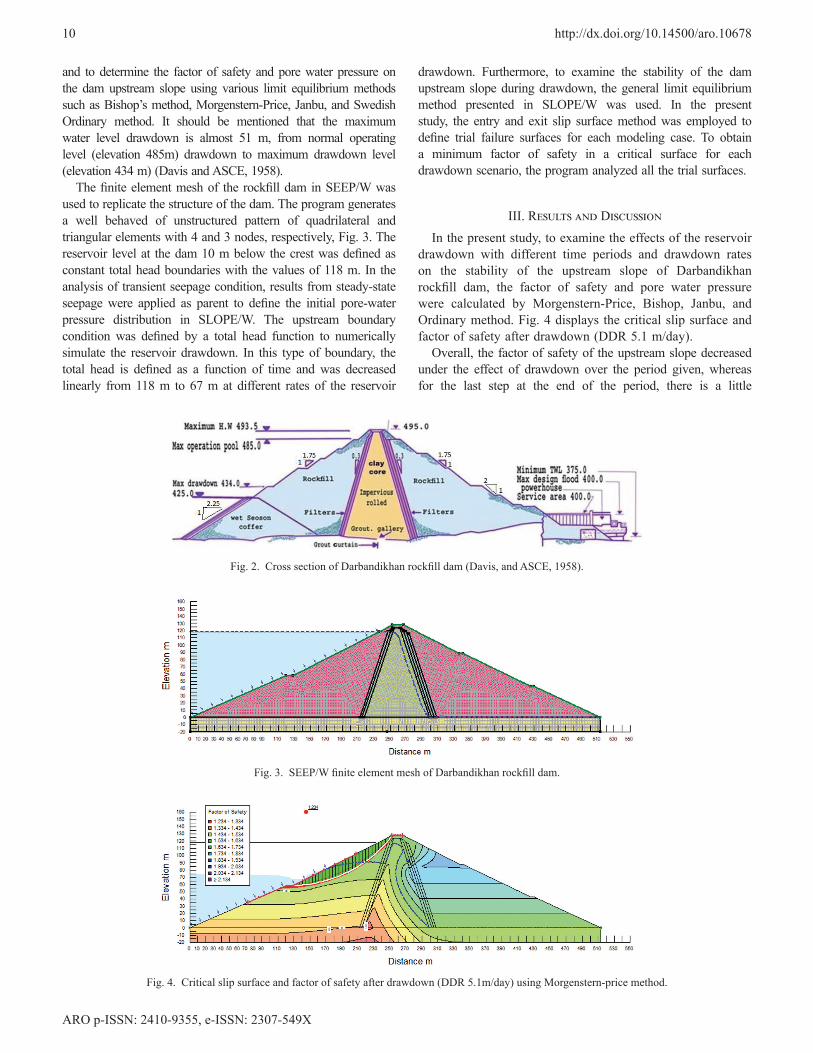
The finite element mesh of the rockfill dam in SEEP/W was used to replicate the structure of the dam. The program generates a well behaved of unstructured pattern of quadrilateral and triangular elements with 4 and 3 nodes, respectively, Fig. 3. The reservoir level at the dam 10 m below the crest was defined as constant total head boundaries with the values of 118 m. In the analysis of transient seepage condition, results from steady-state seepage were applied as parent to define the initial pore-water pressure distribution in SLOPE/W. The upstream boundary condition was defined by a total head function to numerically simulate the reservoir drawdown. In this type of boundary, the total head is defined as a function of time and was decreased linearly from 118 m to 67 m at different rates of the reservoir
drawdown. Furthermore, to examine the stability of the dam upstream slope during drawdown, the general limit equilibrium method presented in SLOPE/W was used. In the present study, the entry and exit slip surface method was employed to define trial failure surfaces for each modeling case. To obtain a minimum factor of safety in a critical surface for each drawdown scenario, the program analyzed all the trial surfaces.
III. Results and DiscussionIn the present study, to examine the effects of the reservoir
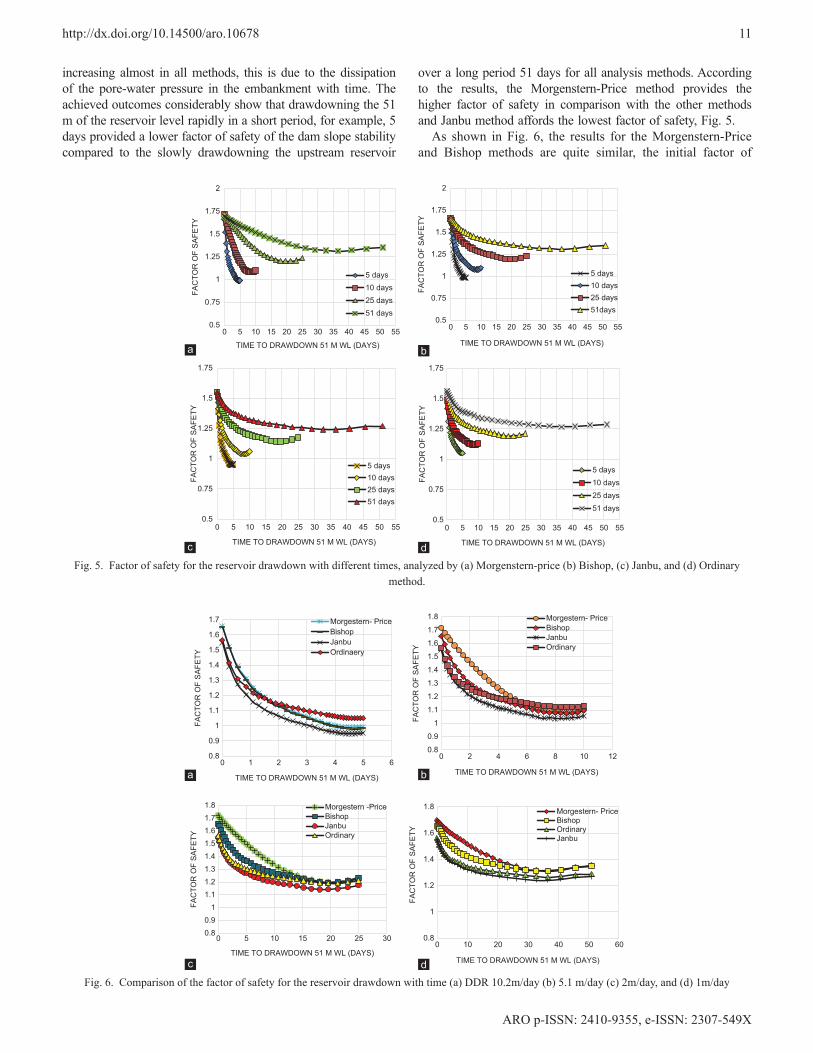
drawdown with different time periods and drawdown rates on the stability of the upstream slope of Darbandikhan rockfill dam, the factor of safety and pore water pressure were calculated by Morgenstern-Price, Bishop, Janbu, and Ordinary method. Fig. 4 displays the critical slip surface and factor of safety after drawdown (DDR 5.1 m/day).
Overall, the factor of safety of the upstream slope decreased under the effect of drawdown over the period given, whereas for the last step at the end of the period, there is a little
Fig. 2. Cross section of Darbandikhan rockfill dam (Davis, and ASCE, 1958).
Fig. 3. SEEP/W finite element mesh of Darbandikhan rockfill dam.
Fig. 4. Critical slip surface and factor of safety after drawdown (DDR 5.1m/day) using Morgenstern-price method.
ARO p-ISSN: 2410-9355, e-ISSN: 2307-549X
http://dx.doi.org/10.14500/aro.10678 11
increasing almost in all methods, this is due to the dissipation of the pore-water pressure in the embankment with time. The achieved outcomes considerably show that drawdowning the 51 m of the reservoir level rapidly in a short period, for example, 5 days provided a lower factor of safety of the dam slope stability compared to the slowly drawdowning the upstream reservoir
over a long period 51 days for all analysis methods. According to the results, the Morgenstern-Price method provides the higher factor of safety in comparison with the other methods and Janbu method affords the lowest factor of safety, Fig. 5.
As shown in Fig. 6, the results for the Morgenstern-Price and Bishop methods are quite similar, the initial factor of
0.5
0.75
1
1.25
1.5
1.75
2
0 5 10 15 20 25 30 35 40 45 50 55
FAC
TOR
OF
SAFE
TY
TIME TO DRAWDOWN 51 M WL (DAYS)
5 days10 days25 days51 days
0.5
0.75
1
1.25
1.5
1.75
2
0 5 10 15 20 25 30 35 40 45 50 55
FAC
TOR
OF
SAFE
TY
TIME TO DRAWDOWN 51 M WL (DAYS)
5 days10 days25 days51days
0.5
0.75
1
1.25
1.5
1.75
0 5 10 15 20 25 30 35 40 45 50 55
FAC
TOR
OF
SAFE
TY
TIME TO DRAWDOWN 51 M WL (DAYS)
5 days10 days25 days51 days
0.5
0.75
1
1.25
1.5
1.75
0 5 10 15 20 25 30 35 40 45 50 55
FAC
TOR
OF
SAFE
TY
TIME TO DRAWDOWN 51 M WL (DAYS)
5 days10 days25 days51 days
Fig. 5. Factor of safety for the reservoir drawdown with different times, analyzed by (a) Morgenstern-price (b) Bishop, (c) Janbu, and (d) Ordinary method.
dc
ba
0.8
0.9
1
1.1
1.2
1.3
1.4
1.5
1.6
1.7
0 1 2 3 4 5 6
FAC
TOR
OF
SAFE
TY
TIME TO DRAWDOWN 51 M WL (DAYS)
Morgestern- PriceBishopJanbuOrdinaery
0.8
0.9
1
1.1
1.2
1.3
1.4
1.5
1.6
1.7
1.8
0 2 4 6 8 10 12
FAC
TOR
OF
SAFE
TY
TIME TO DRAWDOWN 51 M WL (DAYS)
Morgestern- PriceBishopJanbuOrdinary
0.80.9
11.11.21.31.41.51.61.71.8
0 5 10 15 20 25 30
FAC
TOR
OF
SAFE
TY
TIME TO DRAWDOWN 51 M WL (DAYS)
Morgestern -PriceBishopJanbuOrdinary
0.8
1
1.2
1.4
1.6
1.8
0 10 20 30 40 50 60
FAC
TOR
OF
SAFE
TY
TIME TO DRAWDOWN 51 M WL (DAYS)
Morgestern- PriceBishopOrdinaryJanbu
Fig. 6. Comparison of the factor of safety for the reservoir drawdown with time (a) DDR 10.2m/day (b) 5.1 m/day (c) 2m/day, and (d) 1m/daydc
ba
ARO p-ISSN: 2410-9355, e-ISSN: 2307-549X
12 http://dx.doi.org/10.14500/aro.10678
safety began at around 1.7 in average and then gradually reduced after rapidly drawdowning 51 m of the water level in 5 days, reaching nearly 0.98 at the end of the period for both methods. Likewise, approximately 1.55 was the initial factor of safety for the rest of methods (Janbu and Ordinary), and then decreased steadily until reached slightly above 1 for Ordinary and somewhat below 1 for Janbu method at the last time of the period. In comparison, the slower drawdowning of the reservoir level, the higher the factor of safety of the dam upstream slope will be observed.
0.5
0.7
0.9
1.1
1.3
1.5
M O R G E S .-P R I C E
B I S H O P J A N B U O R D I N A R Y
10.2 m/day5.1 m/day2 m/day1 m/day
DDRFAC
TOR
OF
SAFE
TY
Fig. 7. Minimum value factor of safety within the critical slip surface for upstream slope with various drawdown rates for all methods.
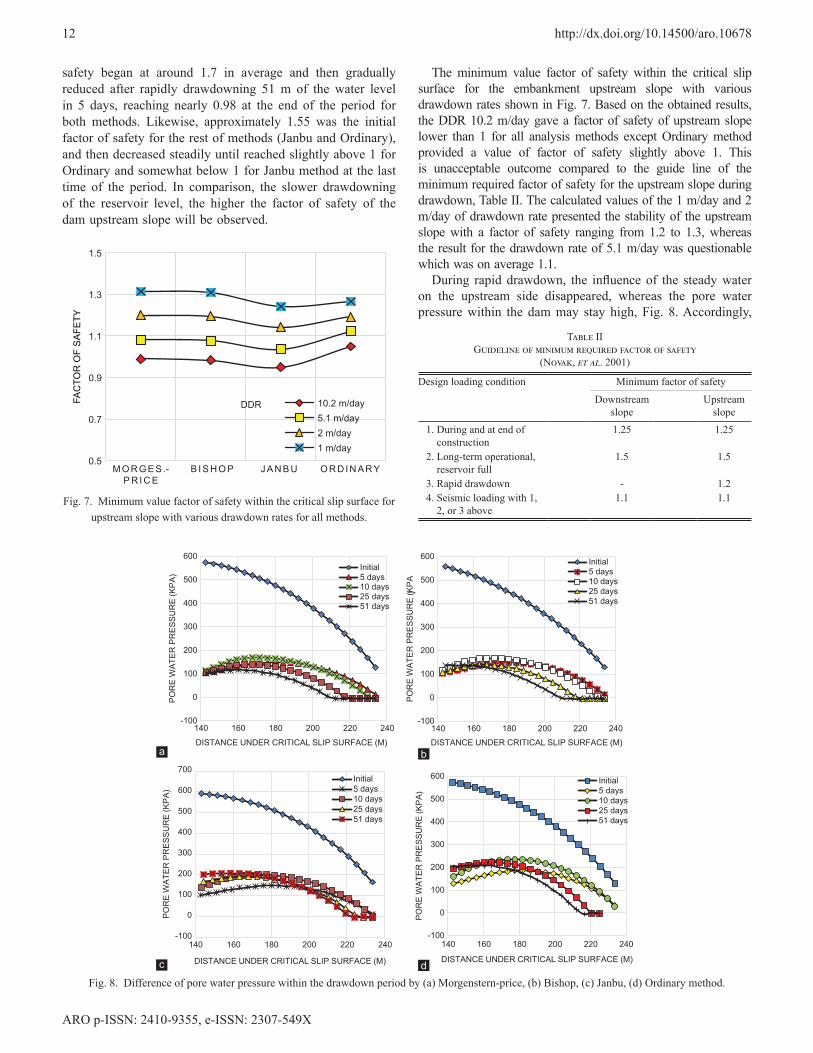
Table IIGuideline of minimum required factor of safety
(Novak, et al. 2001)
Design loading condition Minimum factor of safety
Downstream slope
Upstream slope
1. During and at end of construction
1.25 1.25
2. Long-term operational, reservoir full
1.5 1.5
3. Rapid drawdown - 1.24. Seismic loading with 1,
2, or 3 above 1.1 1.1
The minimum value factor of safety within the critical slip surface for the embankment upstream slope with various drawdown rates shown in Fig. 7. Based on the obtained results, the DDR 10.2 m/day gave a factor of safety of upstream slope lower than 1 for all analysis methods except Ordinary method provided a value of factor of safety slightly above 1. This is unacceptable outcome compared to the guide line of the minimum required factor of safety for the upstream slope during drawdown, Table II. The calculated values of the 1 m/day and 2 m/day of drawdown rate presented the stability of the upstream slope with a factor of safety ranging from 1.2 to 1.3, whereas the result for the drawdown rate of 5.1 m/day was questionable which was on average 1.1.
During rapid drawdown, the influence of the steady water on the upstream side disappeared, whereas the pore water pressure within the dam may stay high, Fig. 8. Accordingly,
-100
0
100
200
300
400
500
600
140 160 180 200 220 240
POR
E W
ATER
PR
ESSU
RE
(KPA
)
DISTANCE UNDER CRITICAL SLIP SURFACE (M)
Initial5 days10 days25 days51 days
-100
0
100
200
300
400
500
600
140 160 180 200 220 240
POR
E W
ATER
PR
ESSU
RE
(KPA
)
DISTANCE UNDER CRITICAL SLIP SURFACE (M)
Initial5 days10 days25 days51 days
-100
0
100
200
300
400
500
600
700
140 160 180 200 220 240
POR
E W
ATER
PR
ESSU
RE
(KPA
)
DISTANCE UNDER CRITICAL SLIP SURFACE (M)
Initial5 days10 days25 days51 days
-100
0
100
200
300
400
500
600
140 160 180 200 220 240
POR
E W
ATER
PR
ESSU
RE
(KPA
)
DISTANCE UNDER CRITICAL SLIP SURFACE (M)
Initial5 days10 days25 days51 days
Fig. 8. Difference of pore water pressure within the drawdown period by (a) Morgenstern-price, (b) Bishop, (c) Janbu, (d) Ordinary method.dc
ba
ARO p-ISSN: 2410-9355, e-ISSN: 2307-549X
http://dx.doi.org/10.14500/aro.10678 13
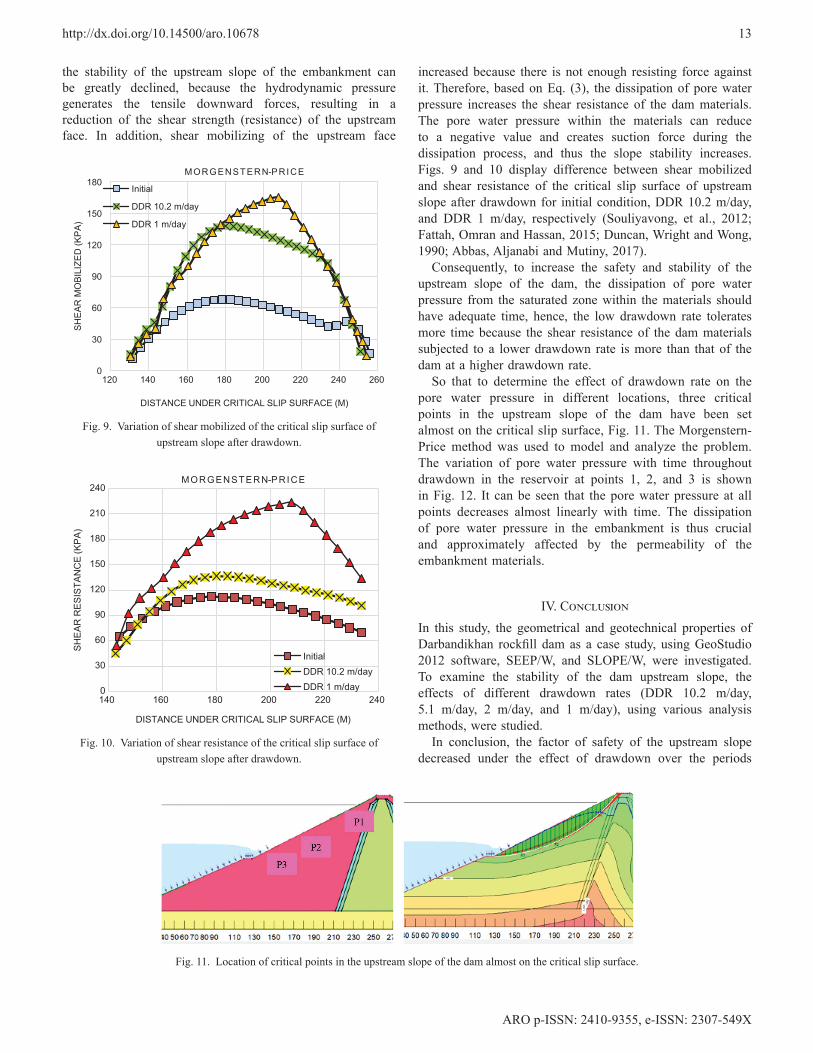
the stability of the upstream slope of the embankment can be greatly declined, because the hydrodynamic pressure generates the tensile downward forces, resulting in a reduction of the shear strength (resistance) of the upstream face. In addition, shear mobilizing of the upstream face
increased because there is not enough resisting force against it. Therefore, based on Eq. (3), the dissipation of pore water pressure increases the shear resistance of the dam materials. The pore water pressure within the materials can reduce to a negative value and creates suction force during the dissipation process, and thus the slope stability increases. Figs. 9 and 10 display difference between shear mobilized and shear resistance of the critical slip surface of upstream slope after drawdown for initial condition, DDR 10.2 m/day, and DDR 1 m/day, respectively (Souliyavong, et al., 2012; Fattah, Omran and Hassan, 2015; Duncan, Wright and Wong, 1990; Abbas, Aljanabi and Mutiny, 2017).
Consequently, to increase the safety and stability of the upstream slope of the dam, the dissipation of pore water pressure from the saturated zone within the materials should have adequate time, hence, the low drawdown rate tolerates more time because the shear resistance of the dam materials subjected to a lower drawdown rate is more than that of the dam at a higher drawdown rate.
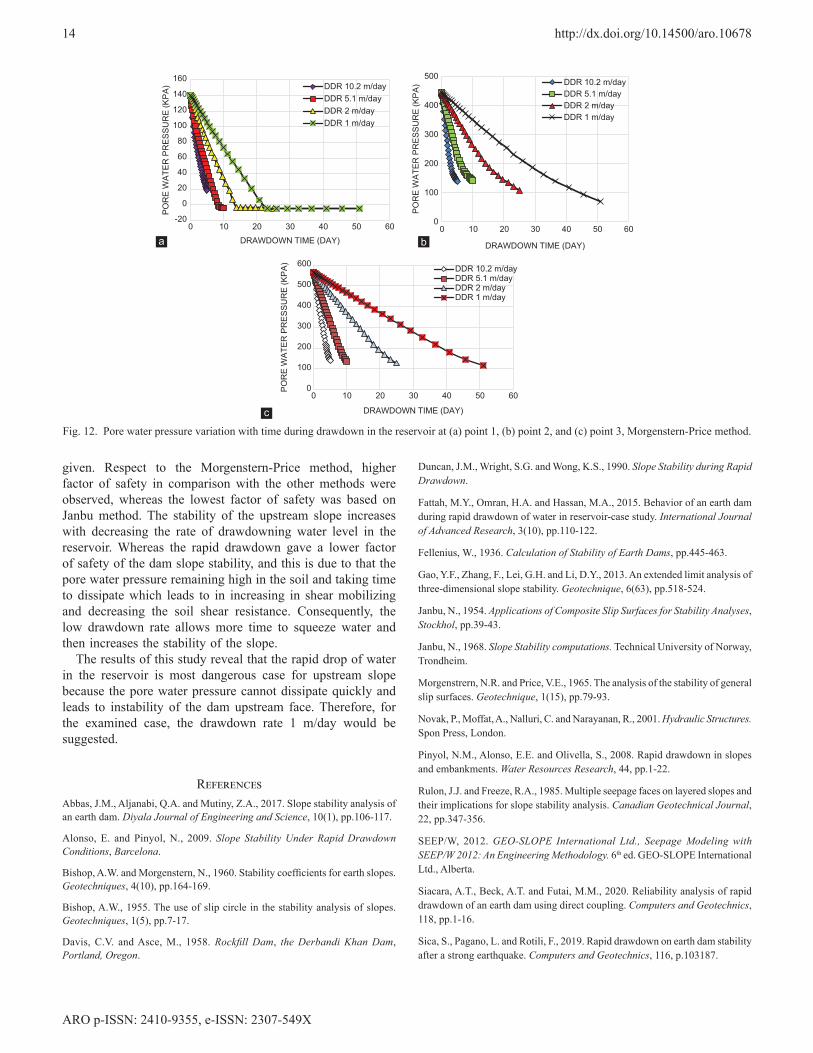
So that to determine the effect of drawdown rate on the pore water pressure in different locations, three critical points in the upstream slope of the dam have been set almost on the critical slip surface, Fig. 11. The Morgenstern-Price method was used to model and analyze the problem. The variation of pore water pressure with time throughout drawdown in the reservoir at points 1, 2, and 3 is shown in Fig. 12. It can be seen that the pore water pressure at all points decreases almost linearly with time. The dissipation of pore water pressure in the embankment is thus crucial and approximately affected by the permeability of the embankment materials.
IV. ConclusionIn this study, the geometrical and geotechnical properties of Darbandikhan rockfill dam as a case study, using GeoStudio 2012 software, SEEP/W, and SLOPE/W, were investigated. To examine the stability of the dam upstream slope, the effects of different drawdown rates (DDR 10.2 m/day, 5.1 m/day, 2 m/day, and 1 m/day), using various analysis methods, were studied.
In conclusion, the factor of safety of the upstream slope decreased under the effect of drawdown over the periods
0
30
60
90
120
150
180
120 140 160 180 200 220 240 260
SHEA
R M
OBI
LIZE
D (K
PA)
DISTANCE UNDER CRITICAL SLIP SURFACE (M)
MORGENSTERN-PRICE
Initial
DDR 10.2 m/day
DDR 1 m/day
Fig. 9. Variation of shear mobilized of the critical slip surface of upstream slope after drawdown.
0
30
60
90
120
150
180
210
240
140 160 180 200 220 240
SHEA
R R
ESIS
TAN
CE
(KPA
)
DISTANCE UNDER CRITICAL SLIP SURFACE (M)
InitialDDR 10.2 m/dayDDR 1 m/day
MORGENSTERN-PRICE
Fig. 10. Variation of shear resistance of the critical slip surface of upstream slope after drawdown.
Fig. 11. Location of critical points in the upstream slope of the dam almost on the critical slip surface.
ARO p-ISSN: 2410-9355, e-ISSN: 2307-549X
14 http://dx.doi.org/10.14500/aro.10678
given. Respect to the Morgenstern-Price method, higher factor of safety in comparison with the other methods were observed, whereas the lowest factor of safety was based on Janbu method. The stability of the upstream slope increases with decreasing the rate of drawdowning water level in the reservoir. Whereas the rapid drawdown gave a lower factor of safety of the dam slope stability, and this is due to that the pore water pressure remaining high in the soil and taking time to dissipate which leads to in increasing in shear mobilizing and decreasing the soil shear resistance. Consequently, the low drawdown rate allows more time to squeeze water and then increases the stability of the slope.
The results of this study reveal that the rapid drop of water in the reservoir is most dangerous case for upstream slope because the pore water pressure cannot dissipate quickly and leads to instability of the dam upstream face. Therefore, for the examined case, the drawdown rate 1 m/day would be suggested.
ReferencesAbbas, J.M., Aljanabi, Q.A. and Mutiny, Z.A., 2017. Slope stability analysis of an earth dam. Diyala Journal of Engineering and Science, 10(1), pp.106-117.
Alonso, E. and Pinyol, N., 2009. Slope Stability Under Rapid Drawdown Conditions, Barcelona.
Bishop, A.W. and Morgenstern, N., 1960. Stability coefficients for earth slopes. Geotechniques, 4(10), pp.164-169.
Bishop, A.W., 1955. The use of slip circle in the stability analysis of slopes. Geotechniques, 1(5), pp.7-17.
Davis, C.V. and Asce, M., 1958. Rockfill Dam, the Derbandi Khan Dam, Portland, Oregon.
Duncan, J.M., Wright, S.G. and Wong, K.S., 1990. Slope Stability during Rapid Drawdown.
Fattah, M.Y., Omran, H.A. and Hassan, M.A., 2015. Behavior of an earth dam during rapid drawdown of water in reservoir-case study. International Journal of Advanced Research, 3(10), pp.110-122.
Fellenius, W., 1936. Calculation of Stability of Earth Dams, pp.445-463.
Gao, Y.F., Zhang, F., Lei, G.H. and Li, D.Y., 2013. An extended limit analysis of three-dimensional slope stability. Geotechnique, 6(63), pp.518-524.
Janbu, N., 1954. Applications of Composite Slip Surfaces for Stability Analyses, Stockhol, pp.39-43.
Janbu, N., 1968. Slope Stability computations. Technical University of Norway, Trondheim.
Morgenstrern, N.R. and Price, V.E., 1965. The analysis of the stability of general slip surfaces. Geotechnique, 1(15), pp.79-93.
Novak, P., Moffat, A., Nalluri, C. and Narayanan, R., 2001. Hydraulic Structures. Spon Press, London.
Pinyol, N.M., Alonso, E.E. and Olivella, S., 2008. Rapid drawdown in slopes and embankments. Water Resources Research, 44, pp.1-22.
Rulon, J.J. and Freeze, R.A., 1985. Multiple seepage faces on layered slopes and their implications for slope stability analysis. Canadian Geotechnical Journal, 22, pp.347-356.
SEEP/W, 2012. GEO-SLOPE International Ltd., Seepage Modeling with SEEP/W 2012: An Engineering Methodology. 6th ed. GEO-SLOPE International Ltd., Alberta.
Siacara, A.T., Beck, A.T. and Futai, M.M., 2020. Reliability analysis of rapid drawdown of an earth dam using direct coupling. Computers and Geotechnics, 118, pp.1-16.
Sica, S., Pagano, L. and Rotili, F., 2019. Rapid drawdown on earth dam stability after a strong earthquake. Computers and Geotechnics, 116, p.103187.
-20
0
20
40
60
80
100
120
140
160
0 10 20 30 40 50 60
POR
E W
ATER
PR
ESSU
RE
(KPA
)
DRAWDOWN TIME (DAY)
DDR 10.2 m/dayDDR 5.1 m/dayDDR 2 m/dayDDR 1 m/day
0
100
200
300
400
500
0 10 20 30 40 50 60
POR
E W
ATER
PR
ESSU
RE
(KPA
)
DRAWDOWN TIME (DAY)
DDR 10.2 m/dayDDR 5.1 m/dayDDR 2 m/dayDDR 1 m/day
0
100
200
300
400
500
600
0 10 20 30 40 50 60
POR
E W
ATER
PR
ESSU
RE
(KPA
)
DRAWDOWN TIME (DAY)
DDR 10.2 m/dayDDR 5.1 m/dayDDR 2 m/dayDDR 1 m/day
Fig. 12. Pore water pressure variation with time during drawdown in the reservoir at (a) point 1, (b) point 2, and (c) point 3, Morgenstern-Price method.c
ba

ARO p-ISSN: 2410-9355, e-ISSN: 2307-549X
http://dx.doi.org/10.14500/aro.10678 15
SLOPE/W, 2012. GEO-SLOPE International Ltd., Stability Modelling with SLOPE/W 2012: An Engineering Methodology. 6th ed. GEO-SLOPE International Ltd., Alberta.
Souliyavong, T., Gallage, C., Egodawatta, P. and Maher, B., 2012. Factors Affecting the Stability Analysis of Earth Dam Slopes Subjected to Reservoir Drawdown, Kuala Lampur, pp.507-512.
Tatewar, S.P. and Pawade, L.N., 2012. Stability analysis of earth dam by geo-studio software. International Journal of Civil Engineeringand Technology, 3(1), pp.437-446.
Tourism of Kurdistan, 2020. Official Site of General Board of Tourism of Kurdistan-Iraq. Available from: http://www.bot.gov.krd/sulaimaniya-province/darbandikhan. [Last accessed on 2020 Apr 01]


![Effect of Horizontal Drains on Upstream Slope Stability ... · upstream slope and making the equipotential lines tend to become horizontal. This effect is shown in figure 5. [5] Duncan](https://img.pdfslide.net/doc/110x75/600eca95e86f657b4b16071a/effect-of-horizontal-drains-on-upstream-slope-stability-upstream-slope-and-making.jpg)