Embed Size (px)
Citation preview

25
ASSESSMENT OF THE WASH SITUATION IN NAKAWAAND KAMPALA CENTRAL DIVISIONS, KAMPALA CITY:
A Consumer Perception Survey for KampalaSlum Transformation Initiative Project.
Cit
izen
s’ R
epo
rt C
ard
Ju
ne
2016

i
ACKNOWLEDGEMENT
Sincere appreciation goes to members of the Village Health Teams (VHTs) including: Rose Ndaa, VHT – Mbuya I ward, Nakawa division; Moro John, VHT – Banda ward, Nakawa division; Kaweesi Chris, VHT – Banda ward, Nakawa division; Karamagi Chris, VHT – Bukoto ward, Nakawa division; Katana Goretti, VHT – Kamwokya II, Central division; and Kazaire Monica, VHT – Mengo ward, Central division for participating in the data collection exercise.
A special gratitude goes out to Nelson Muwereza, Hellen Kasujja, and Simon Ddembe for compilation of this report card.
Furthermore, the following Environmental Alert staff – WASH programme i.e. Vivienne Onen – Programme Officer, Angellah Katabaazi – Programme Assistant, Ronald Opio – Programme Assistant, Mr. Ambrose Bugaari - Programme Manager, and Dr. Joshua Sserufusa-Zake Kangaawo (PhD) – Executive Director are very much appreciated for their crucial role in providing the necessary support to ensure the success of this survey exercise.
Water Aid Uganda is thanked for extending the financial support through the Kampala Slum Transformation Initiative, which enabled Environmental Alert to conduct this survey.
ii
TABLE OF CONTENTS
LIST OF ACRONYMS.......................................................................................iiiFOREWORD ....................................................................................................iv
1.0 What is the citizens’ report card?.............................................................11.1 Background about the KASTI.....................................................................11.2 About Environmental Alert........................................................................1
2.0 METHODOLOGY ........................................................................................2
3.0 KEY FINDINGS AND RECCOMENDATIONS ...............................................33.1 Characteristics of the respondents..........................................................33.2 Socio-economic characteristics of the households..............................33.2.1 Characteristics of the household head................................................33.2.2 Household size.........................................................................................43.2.3 Household income and expenditure.....................................................43.2.4 Characteristics of the main house.........................................................53.3 Water Services in households...................................................................53.3.1 Access to potable water.........................................................................53.3.2 Responsiveness and interaction on issues of access to water..........73.3.4 Water quality...........................................................................................83.4 Sanitation services in households.............................................................93.4.1 Availability, access and utilization of sanitation services...................93.4.2 The characteristics of the sanitation facilities.....................................113.4.3 Major reason for construction of the sanitation facilities..................123.5 Hygiene services in households .............................................................123.6 Solid waste services in households.........................................................143.7 Knowledge about WASH in households................................................163.7.1 Knowledge about water......................................................................163.7.2 Knowledge about safe sanitation.......................................................163.7.3 Knowledge about good hygiene........................................................163.8 Characterisation of households who are most affected by poor WASH service delivery...................................................................................16
4.0 CONCLUSIONS AND RECOMMENDATIONS...........................................224.1 Conclusions.............................................................................................. 224.2 Areas that need improvement and policy implication.......................224.2.1 Policy Recommendations....................................................................234.2.2 KASTI Project specific Recommendations..........................................23

iii
LIST OF ACRONYMS
CSO Civil Society Organisation.EA Environmental Alert.KAP Knowledge Attitudes and Practices.KASTI Kampala Slum Transformation Initiative.KCCA Kampala Capital City Authority.NETWAS Network for Water and Sanitation.NWSC National Water and Sewerage Cooperation.UBOS Uganda Bureau of Statistics.VHT Village Health Team.VIP Ventilated Improved Pit Latrine.WACOCO Water Community Communication Club.WASH Water Sanitation and Hygiene.WHO World Health Organisation.

iv
FOREWORD
Environment Alert with support from Water Aid Uganda is implementing a project titled Kampala Slum Transformation Initiative (KASTI) in Nakawa and Central Divisions of Kampala with a coverage of 8 wards. In a bid to measure the level of service delivery, Environment Alert conducts periodical consumer perception surveys within specific parishes where the project operates. This helps to get feedback and perception of people when it comes to WASH service delivery by the various actors mainly Government. The survey further gives the actors pointers on the gaps around which interventions need to be focused.
This report presents findings from “Kampala Slum Transformation Initiative” (KASTI) Project consumer perception survey. The project that is funded by Comic Relief through WaterAid Uganda aims at improving school children’s access to safe water and sanitation, increase hygiene understanding amongst both the school children and the slum dwellers, promote the construction and use of public latrines, and support comunities to advocate for improved living conditions as well as build capacity of urban authorities in the two divisions to enable them respond to these needs.
The project is being implemented in 8 Wards of; Banda, Bukoto 1, Mbuya I & II of Nakawa Division and Bukesa, Mengo, Kisenyi III , Kamwokya II of Kampala Central Division. The overall objective of the survey was to establish the current status of WASH and Knowledge, Attitudes and Practices (KAP) around WASH in the slum areas of Nakawa and Kampala Central Divisions.
The Citizen Report Card will be used as an evidence based engagement tool. The specific areas covered in the survey include: access to clean and safe Water, solid waste management systems in the community, current situation of drainage systems, toilet coverage as well as access to cesspool emptying services, and level of sensitization efforts around WASH.
I take this opportunity to share with you findings from the survey that was conducted in 4 wards of Nakawa and Central Divisions under Kampala Capital City Authority.
Environment Alert is optimistic that the findings will be put to good use by the various actors within the WASH sector and brings about improved service delivery. I hope you find the reading both informative and interesting.
Dr. Joshua Zake (PhD),Executive Director, Environmental Alert.

1
1.0 What is the citizens’ report card?
The Citizen Report Card (CRC) is a simple but powerful tool to provide public agencies with systematic feedback from users of public services. By collecting feedback on the quality and adequacy of public services from actual users, the CRC provides a rigorous basis and a proactive agenda for communities, civil society organizations and local governments to engage in a dialogue with service providers to improve the delivery of public services.
The CRC addresses critical themes in the delivery of public services such as access to services, quality and reliability of services, problems encountered by users of services and responsiveness of service providers in addressing these problems, transparency in service provisions like disclosure of service quality standards and norms, and costs incurred in using a service including hidden costs such as bribes. The CRC also provides a summative satisfaction score that captures the totality of critical service-related parameters. This Citizens’ Report Card provides feedback of levels of satisfaction about WASH in terms of access, quality, quantity, cost and KAP from selected wards of Nakawa and Central Divisions.
1.1 Background about the KASTI
Environmental Alert alongside African Evangelistic Enterprise and Kampala Capital City Authority (KCCA) is implementing a WASH project titled “Kampala Slum Transformation Initiative” (KASTI). This project is funded by Comic Relief through Water Aid Uganda. The project is intended to improve school children’s access to safe water and sanitation, increase hygiene understanding amongst both the school children and the slum dwellers, promote the construction and use of public latrines, and support communities to advocate for improved living conditions as well as build capacity of urban authorities in the two divisions to enable them respond to these needs. The project is being implemented in 8 Wards of; Banda, Bukoto 1, Mbuya I & II of Nakawa Division and Bukesa, Mengo, Kisenyi III , Kamwokya II of Kampala Central Division.
1.2 About Environmental alert
Environmental Alert (EA) is a non-governmental organisation which envisions resilient and dignified communities, managing their environment and natural resources sustainably and exists to advocate for enabling environment, sustainable natural resources management and food security frameworks for targeted communities through empowerment and policy engagement.

2
2.0 METHODOLOGY
The survey adopted a cross-sectional household-based survey design using a knowledge, Attitude and Practice (KAP) survey to assess levels of access to sanitation, water and hygiene, good governance for WASH service delivery including the understanding of their rights. Data was collected using questionnaires entailing agreed on indicators to allow for their comparisons for future surveys. The survey targeted 400 households from which 399 household members were interviewed using a structured questionnaire.
The aim of the survey was to generate some key indicators on access to water and sanitation, hygiene and good governance for WASH. The questionnaire was also extended to include information on background characteristics.
The survey adopted a cross-sectional household-based survey design using a knowledge, Attitude and Practice (KAP) survey approach. Data was captured onto the questionnaires administered by a team of well trained and experienced interviewers. Data was quality was checked for completeness and consistency. Data collected was entered using Epi-data software, cleaned and analysed using statistical software called STATA. Data presentation was done using descriptive statistics and symbols to give meaning and draw conclusions.
The sample size was calculated using the formula in FANTA sampling Guide1:
D* (Z1-a +Z1-D ) x [P1 (1-P1 )+P2(1-P2 )] (P1-P2)
n = minimum size of the sample;D = design effect (assumed at the default value of 2);P1 = the value of the key indicator at baseline (or a proxy value);P2 = the planned target value of the key indicator at the end-line/ final evaluation; Za = the Z-score corresponding to the probability level desired; for 5%, Z = 1.645; Zb = the Z-score corresponding to the power level desired; for 80%, Z = 0.8416.3.0 KEY FINDINGS AND RECOMENDATIONS
n 2
=2

3
3.0 KEY FINDINGS AND RECOMENDATIONS
3.1 Characteristics of the Respondents
The respondents consisted of both landlords and tenants; with landlords contributing about 38% of the sample size and the rest (62%) being contributed to by tenants (Figure 1). By sex, 41% of the respondents were male and the rest (59%) were female. Interestingly, 62% of the respondents were household heads and the rest were not. The best knowledgeable household member was found to be the household head (with 61% of those who were not household heads being the household head’s spouse). On average, most of the respondents had lived in the sampled area for about 5 years. Therefore, given these characteristics of the respondents in this survey, the findings are appropriate, representative and reliable.
landlord
37.8
54.0
19.2 25.0
53.0 62.2
46.0
80.8 75.0
47.0
0.0
20.0
40.0
60.0
80.0
100.0
Pooled KISENYI III KAMWOKYA IIM BUYA I BANDA
Perc
enta
ge (%
)
Tenants
Figure 1: Respondent categories across wards in Nakawa and Kampala Central Division.
3.2 Socio-economic characteristics of the households
3.2.1 Characteristics of the household head
Overall, about 68% of the sampled households are male headed and the rest were otherwise (Figure 2). The mean age of the household heads was 45. Most (32%) of the household heads attained ordinary level of education, primary level (24%), advanced level (17%) and tertiary level (13%). About 59% of the household heads were married and rest were otherwise, including those who were single in widowhood. Most of the household heads participate in small scale private business (43%), 27%

4
are salaried workers and casual labourers (14%) (Figure 3).
27.3 26.0
41.4
22.0 20.0 14.0 17.0 17.2
11.0 11.0 7.3 5.0 15.2
6.0 3.0
42.9 50.0
23.2
43.0
55.0
0.5 0.0 2.0 0.0 0.0 6.8
0.0 1.0
17.0 9.0
0.0
20.0
40.0
60.0
Pooled KISENYI IIIK AMWOKYA II MBUYA IB ANDA
Pe
rce
nta
ge (
%)
salaried work causal labour not employed private business peasant farmer informal sector worker
Figure 2: Main occupation of household heads across wards in Nakawa and Kampala Central Division.
3.2.2 Household size
The mean household size was found to be 5 members, with an average of 2 children below 5 years, 2 in the age cohort of 5-14 years and 3 above 14 years. This finding is consistent with CIDI and WaterAid (2010) who also found a mean householdsize of 5. This means that the urban poor have large families and hence require more water, sanitation and hygiene services if their wellbeing is to be improved.
3.2.3 Household income and expenditure
Given the sources of income for the household heads that were discussed earlier, majority (78%) of the sampled households were found to be low income earners, earning UGX 500,000 and below per month and the rest earn above (Figure 4). Indeed, given their low earnings, large proportions (78%) of the households were found to have a daily expenditure of less than UGX20,000 and the rest spent above the mark. Given the large family size of 5 people, these resource envelopes cannot sustain high social wellbeing of the household in terms of adequately meeting WASH related costs.

5
6.5
13.5 15.8
24.6
16.3
12.5
7.5 6.0 6.0
14.0
30.0
26.0
12.0
4.0
9.1
25.3 25.3
21.2
8.1
5.1 3.0
7.0
12.0
17.0
26.0
14.0
7.0 9.0
4.0
11.0
7.0
21.0
17.0
26.0
14.0
0.0
5.0
10.0
15.0
20.0
25.0
30.0
35.0
Below 50,000 50,000 -100,000 100,001 – 200,000 200,001 – 300,000 300,001 – 500,000 500,001 -1,000,000
Above 1,000,000
Perc
enta
ge (%
)
Pooled KISENYI III KAMWOKYA II MBUYA I BANDA
Figure 3: Distribution of household income across wards in Nakawa and Kampala Central Division.
3.2.4 Characteristics of the main house
Fifty six percent (56%) of the households had only 1 room used for sleeping, 2 rooms (32%) and 3 rooms (8%). The walls of the main house for 45% had finished walls with cement and only 40% of the households were made of bricks. Eighty percent (80%) of the households had iron sheet roofing while the rest had other forms of roofing. Almost all (83%) of the sampled households had main houses that had finished floor with cement. These house characteristics are significant proxies of poverty which mean that with a large household, the WASH situation of the household is likely to be poor given limitation in space due to congestion.
3.3 Water Services in households
This consumer perception survey examined citizens’ satisfaction to water services under seven themes. These included indicators of cost, distance, quality, quantity, responsiveness of the service providers and water billing.
3.3.1 Access to potable water
Generally, 83% of the households in Nakawa and Kampala Central Divisions accessed piped water (public taps (57%) and piped source into the yard / private connection (26%)) and rest accessed other sources (Figure 5). This implies that most of these households access improved

6
water sources. However, about 11% of the households in Nakawa and Kampala Central Divisions accessed water through unimproved sources (water from spring (9%) and dug well (2%)) posing a public health concern. Interestingly, 83% of these water sources are within a radius of 1 km from the households (69% are within a radius of 0.5 kms from the households and 14% are between 0.5 km and 1 km from the households) and thus, spend an average of 17 minutes to fetch water. These findings suggest that long distance is most likely to be a hindrance for households to access water services in these two divisions.
Majority (83%) of the sampled households pay for the water they fetch while the rest don’t pay at all. Of those who paid for the water that they fetched, the largest proportion (65%) paid UGX200 and above per Jerrycan, and rest paid below UGX200 (only 8% paid below UGX100 per Jerrycan).
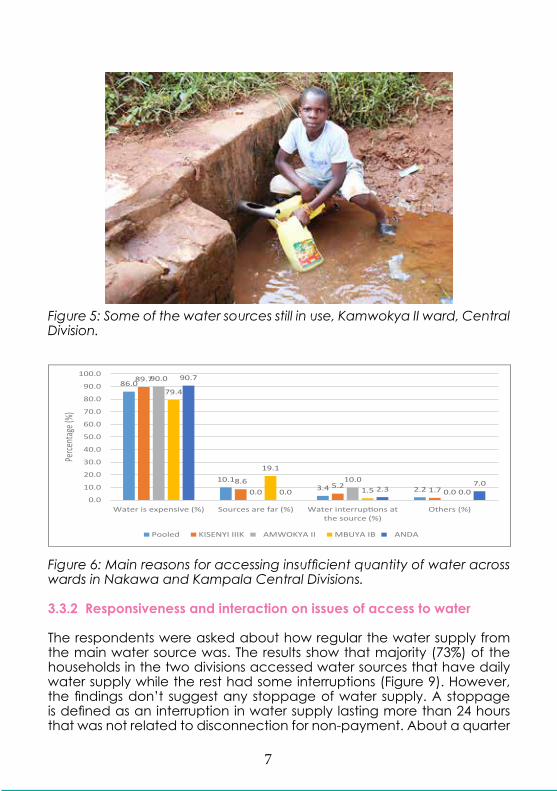
This price for water seems to be high for these peri-urban poor households. On a daily basis, most households (44%) collected 1-3 Jerrycans of water while 43% collected 4-6 Jerrycans. This finding suggests significantly that there is a discrepancy in the per capita quantity of water accessed by these peri-urban poor and large households. Indeed, it is not suprising that only almost half (53%) of the sampled households accessed sufficient quantities of water daily. However, the majority (86%) of those who did not access sufficient amounts of water attributed it on the high price for water and distance (10%), 3% on water interruptions and the rest otherwise.
83%
17%
Pipe water
Non-piped water
Figure 4: Percentage of households that accessed piped water in Nakawa and Kampala Central Divisions.
7
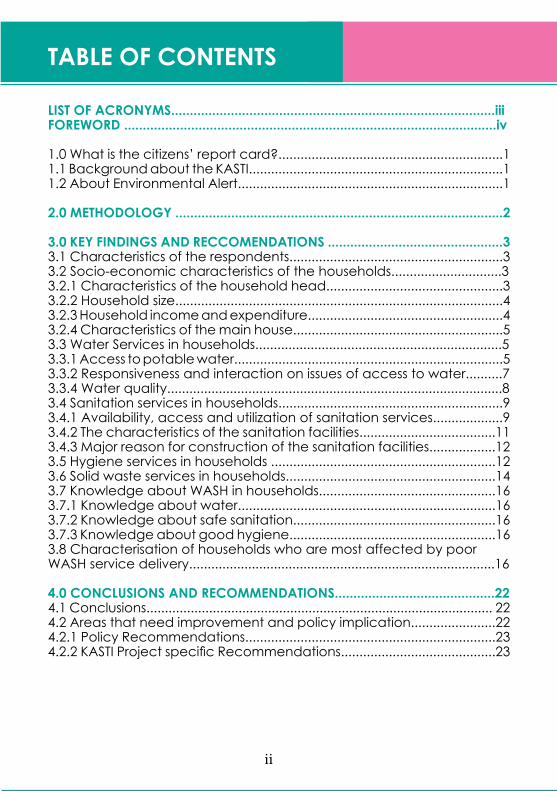
Figure 5: Some of the water sources still in use, Kamwokya II ward, Central Division.
86.0
10.1 3.4 2.2
89.7
8.6 5.2
1.7
90.0
0.0
10.0
0.0
79.4
19.1
1.5 0.0
90.7
0.0 2.3 7.0
0.0
10.0
20.0
30.0
40.0
50.0
60.0
70.0
80.0
90.0
100.0
Water is expensive (%) Sources are far (%) Water interrup ons atthe source (%)
Others (%)
Perce
ntag
e (%)
Pooled KISENYI IIIK AMWOKYA II MBUYA IB ANDA
Figure 6: Main reasons for accessing insufficient quantity of water across wards in Nakawa and Kampala Central Divisions.
3.3.2 Responsiveness and interaction on issues of access to water
The respondents were asked about how regular the water supply from the main water source was. The results show that majority (73%) of the households in the two divisions accessed water sources that have daily water supply while the rest had some interruptions (Figure 9). However, the findings don’t suggest any stoppage of water supply. A stoppage is defined as an interruption in water supply lasting more than 24 hours that was not related to disconnection for non-payment. About a quarter

8
(24%) of the respondents noted that they received notices in advance for water interruptions from their main water sources and the rest did not. Given that, three quarters have uninterrupted access to water, this finding suggests that those who access sources that have interruptions don’t receive advance notices.
The respondents were asked to express their satisfaction about water billing for the main water source used by their households. Of those who are connected to the water mains, most (67%) received their water bills monthly, once in two months (6%) and once in a while (2%), and the rest otherwise. Interestingly, 30% of these respondents noted that they are satisfied with the water billing that their households received and the rest were not. These results suggest a very low satisfaction level among the community in the two divisions. This is majorly (61%) because of overbilling (Figure 10). Again, this finding suggests that the high price of water may be a major hindrance to households’ access to water services.
73.0
97.0
46.0
80.0 67.0
2.0 1.0 3.0 2.0 0.0
19.0
2.0
42.0
3.0 3.0 6.0 0.0 9.0 15.0
30.0
0.0
20.0
40.0
60.0
80.0
100.0
120.0
Pooled KISENYI IIIK AMWOKYA II MBUYA IB ANDA
Perc
enta
ge (
%)
All day (%) Only at night (%) Less than 5 hours (%) other
Figure 7: Availability of water at source across wards in Nakawa and Kampala Central Divisions.
3.3.4 Water Quality
Water quality was assessed by looking at whether the water had any unpleasant smell, colour or taste. These would be a precursor to carrying out a water quality test on the various water sources in the respective wards and the divisions at large. For water to be of the required quality, emphasis was put on absence of smell, being colourless and tasteless. This study did not do any water quality testing.
Majority (77%) of the sampled households in two divisions accessed water that did not have any smell but the rest accessed water with a smell. Ninety seven percent (97%) of the households accessed water that was colourless while the rest accessed water with a certain colour (greenish, brownish or grey). These results suggest that most of the population in the
9
two divisions most likely access water of good quality. Basing on these findings, it is not surprising that 92% graded the water they accessed as good and the rest rated it otherwise.
3.4 Sanitation Services in households
The analysis also looked at the access to the places where the urban poor ease themselves, cost involved in accessing the toilet facilities and also management of those facilities in addition to the problems faced with accessing the service.
3.4.1 Availability, access and utilization of sanitation services
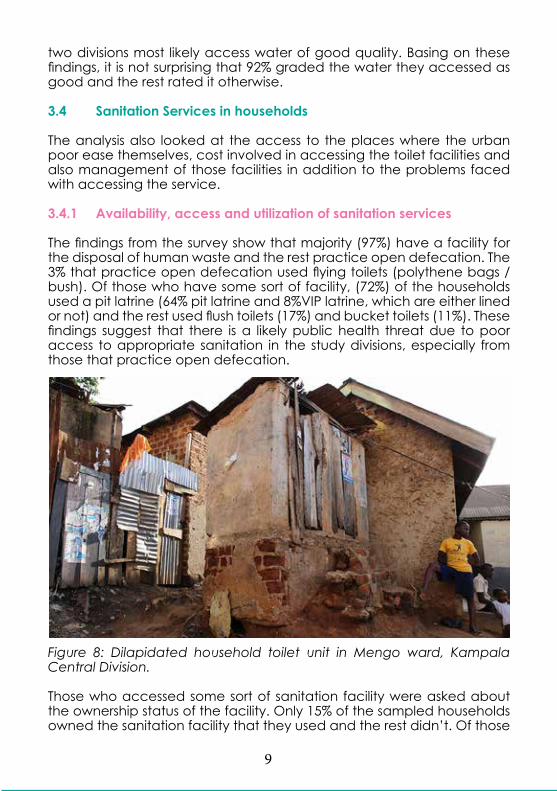
The findings from the survey show that majority (97%) have a facility for the disposal of human waste and the rest practice open defecation. The 3% that practice open defecation used flying toilets (polythene bags / bush). Of those who have some sort of facility, (72%) of the households used a pit latrine (64% pit latrine and 8%VIP latrine, which are either lined or not) and the rest used flush toilets (17%) and bucket toilets (11%). These findings suggest that there is a likely public health threat due to poor access to appropriate sanitation in the study divisions, especially from those that practice open defecation.
Figure 8: Dilapidated household toilet unit in Mengo ward, Kampala Central Division.
Those who accessed some sort of sanitation facility were asked about the ownership status of the facility. Only 15% of the sampled households owned the sanitation facility that they used and the rest didn’t. Of those

10
who did not own the sanitation facility that they used, majority (53%) of the households accessed the sanitation facility that was owned by the landlord and the rest accessed public, communal and institutional facilities (Figure 14).
This distribution of facilities is also a hindrance for majority of the urban poor to make improvements on their facilities since they don’t own land and have to rely on other people for the service. A large proportion (80%) of the households shared the sanitation facility with other households. Of those who shared, majority (45%) shared with 5 to 10 households, while 35% shared with more than 10 households. On average, these sanitation facilities have 3 stances. These findings suggest the presence of a wide inequality in access to sanitation facilities.
Interestingly, only 30% of the households that used sanitation facilities which were public or communal or owned by institutions did not pay to access these facilities, the rest paid UGX10,000 and below per month. This finding suggest that for those households that don’t own sanitation facilities or can’t access those owned by their landlord, are likely to be hindered by the cost of accessing public sanitation facilities.
97%
3%
Households accessing asanita on facility
Households prac cingopen defeca on
Figure 9: Access to sanitation services in Nakawa and Kampala Central Divisions.

11
Figure 10: Poorly maintained public Toilet in Bukesa ward, Kampala Central Division.
3.4.2 The characteristics of the Sanitation facilities
Half (50%) of the households in study divisions accessed sanitation facilities with walls made of bricks and cement and 37% with finished walls with cement. There was no household that used a sanitation facility without some form of wall. The largest proportion (78%) of households in two divisions used sanitation facilities with iron sheet roofs and finished roofing (12%). 63% of the households had sanitation facilities with finished floors with cement and only 17% had concrete slab. On average, those who used pit latrines suggest that they were about 15 feet deep at the time of the survey. About 60% of these pit latrines were constructed on loamy soils while others were constructed on clay soils (20%) and sandy soils (14%). Only 42% of the households that used pit latrines had lined facilities while the rest were not. Of those that were lined, majority (64%) were lined with bricks and cement and stone (32%).
Only a quarter (25%) of the households used sanitation facilities that had covers / lids on the drop hole while the rest didn’t. Only (18%) of the households used sanitation facilities that had squat plates or pans while the rest did not have. A large proportion (70%) of the households used a cesspool emptier and the rest used other means including draining into the channel (11%) (Figure 14). These findings suggest a high likelihood of exposure to faecal-oral related diseases. This is majorly because majority of the households didn’t line their pits; while others constructed them in water logged areas and thus are drained into the drainage channels.

12
70.0
85.0 75.0
55.0 55.0
9.0 5.0 4.0 0.0
21.0 10.0
1.0 9.0
0.0
24.0
0.0 0.0 0.0 0.0 0.0 11.0 9.0 11.0
45.0
0.0 0.0
20.0
40.0
60.0
80.0
100.0
Pooled KISENYI IIIK AMWOKYA II MBUYA IB ANDA
Perc
enta
ge (
%)
Cesspool (%) Jerrycan (%) Gulper (%) UGAVACS (%) Channel (%)
Figure 11: Means of emptying sanitation facilities across wards in Nakawa and Kampala Central Division.
3.4.3 Major reason for construction of the sanitation facilities
The most important (as mentioned by 77% of the sampled households that owned some facility) was the need to maintain cleanliness, improved health (75%) and comfort (33%).
3.5 Hygiene services in households
Practicing safe hygiene and sanitation are vital for the prevention of diarrheal diseases and infections more so amongst children. For example, Prüss-Üstün et al. (2004) observed several epidemiological studies that suggest a 14% to 48% reduction in diarrhoea morbidity and Huttly et al. (1997) shows that diarrhoea incidence reduced by a median of 35% when hand washing was practiced. In fact, hand washing with soap can prevent up to 90% of all diarrheal diseases. Therefore respondents were asked several questions about hygiene practices and also whether their children have ever suffered from any diarrheal diseases and if they were aware of any of them.
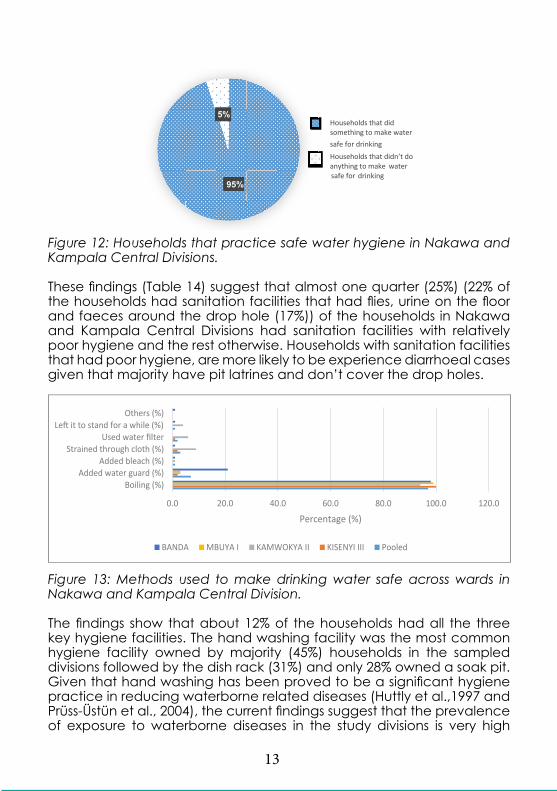
Numerous epidemiological studies (see Prüss-Üstün et al., 2004) have found a significant association between poor water quality and the prevalence of infectious diarrhoea. Table 13 presents the findings on the hygiene practices adopted by households in the dimension of water services. An overwhelming majority (95%) noted that their households engaged in practices that attempted to make drinking water safe and the rest did not (Figure 16). About 97% of those who did practiced boiling of drinking water while the rest engaged in other practices such as use of water guard (Figure 17). Very few (7%) of the sampled households were found to store their drinking water in uncovered containers. These findings suggest that about a tenth (1/10) of the population from the sampled divisions drink poor quality water.
13
r
95%
5%
something to make water
safe for drinking
Households that did
Households that didn’t do anything to make
drinking wate
safe for
Figure 12: Households that practice safe water hygiene in Nakawa and Kampala Central Divisions.
These findings (Table 14) suggest that almost one quarter (25%) (22% of the households had sanitation facilities that had flies, urine on the floor and faeces around the drop hole (17%)) of the households in Nakawa and Kampala Central Divisions had sanitation facilities with relatively poor hygiene and the rest otherwise. Households with sanitation facilities that had poor hygiene, are more likely to be experience diarrhoeal cases given that majority have pit latrines and don’t cover the drop holes.
0.0 20.0 40.0 60.0 80.0 100.0 120.0
Boiling (%)Added water guard (%)
Added bleach (%)Strained through cloth (%)
Used water lterLe t to stand for a while (%)
Others (%)
Percentage (%)
BANDA MBUYA I KAMWOKYA II KISENYI III Pooled
Figure 13: Methods used to make drinking water safe across wards in Nakawa and Kampala Central Division.
The findings show that about 12% of the households had all the three key hygiene facilities. The hand washing facility was the most common hygiene facility owned by majority (45%) households in the sampled divisions followed by the dish rack (31%) and only 28% owned a soak pit. Given that hand washing has been proved to be a significant hygiene practice in reducing waterborne related diseases (Huttly et al.,1997 and Prüss-Üstün et al., 2004), the current findings suggest that the prevalence of exposure to waterborne diseases in the study divisions is very high

14
(about 55% of the population is exposed). Despite the large proportion (99%) of households in the two divisions that had some evidence of using a hand washing facility, among those who had the facility, only 35% were practicing hand washing with soap.
The findings show that a large proportion (98%) of the respondents were aware of the water borne diseases (Figure 18). Interestingly, majority (89%) of the households were aware of typhoid, cholera (69%), diarrhoea (56%) and bilharzia (24%). These high knowledge levels may be attributed to interventions that have already been implemented by EA and other organisations as well as household experiences of these diseases.
Given the low adoption levels of hand washing especially with soap and the poor hygiene of some sanitation facilities, it was not surprising for the findings to suggest that over the last month, half (50%) of those with children below 5 years had recorded an incidence of diarrhoea amongst this cohort. A landslide 99% of these households that had diarrhoeal morbid children less than 5 years sought some form of treatment and the rest did not.
Of those who sought treatment, 57% sought it from private clinics / hospital, 16% from a public health centre / hospital and the rest used other means of treatment such as village health teams and local herbs. Majority (52%) of the households spent UGX20,000 and below to treat these children that suffered from diarrhoea and the rest spent above. Given the low household income of majority of these peri-urban poor households, this expenditure on treating the sick most likely constrains further access to better WASH services. Moreover, all these household expenses could significantly reduce with improved hygiene of household members.
98%
2%Households that areaware of waterbornediseases
Households that are notaware of waterbornediseases
Figure 14: Level of household awareness about waterborne diseases.
3.6 Solid waste services in households
The respondents were asked how their households dispose their garbage. Only 64% of the sampled households were found to have proper solid waste disposal (i.e. KCCA skips, trucks and private collectors who were assumed

15
to dump it at appropriate sites). Overall, majority (50%) of the households used KCCA trucks, skips and collectors, 16% relied on sacks, 14% relied on private collectors and rest burnt their garbage or dumped it in drainage channels (each 6%).
Despite the quite significant efforts of KCCA to manage solid waste in the divisions, there is a high likelihood that households that relied on sacks or unprofessional private collectors for solid waste disposal also empty their contents in drainage channels or any other illegal place. For those that relied on KCCA’s and private collectors’ services, only 32% paid for the service. Majority (66%) paid a pro-poor cost of below UGX1,000 for every round of garbage collection and the rest paid above UGX1,000. According to the solid waste ordinance of 2,000, all generators of the solid waste are responsible for their waste until it is collected or disposed of to its final destination, inclusive of paying for it.
This therefore, implies inefficiency in the solid waste management sector in Nakawa and Kampala Central Divisions. However, the frequency of collection of garbage from the urban poor households was irregular making many urban poor stay with the garbage for a long time in their limited spaces. This is evidenced by majority (46%) of households suggesting that urban authorities collected garbage at most within 3 days, weekly (31%) and at least every after two weeks (18%). Unfortunately, 2% of the households have never observed KCCA collecting their garbage.
The findings suggests that programmes to sensitize the poor on proper solid waste management don’t reach the poor with a small proportion (33%) of them indicating that they have ever been sensitized while the rest (67%) indicated that they have never been sensitized. When asked about awareness of any of the laws governing solid waste management in the city, more than one quarter (31%) of the respondents indicated their awareness and the rest were not aware of any such bylaws. The findings suggest that there is need for sensitization to be conducted in the division about the laws / bylaws of solid waste management amongst the community.
Figure 15: Solid waste dumped in a drainage channel in Mengo ward.

16
3.7 Knowledge about WASH in households3.7.1 Knowledge about water
Table 17 presents the findings about possession of accurate knowledge about safe water within households. This is showed by majority (94%) of the respondents who believed that definitely drinking un-boiled water can cause disease, 92% believed that definitely very clean / colourless water is not safe for drinking when not boiled, 76% believed that definitely germs cannot die when water is put in the fridge, 95% believed that definitely water can be made safe for drinking by boiling it to 100 degrees centigrade and an overwhelming 85% believed that definitely germs cannot be seen in the water using naked eyes. Therefore, just more than half (60%) of the respondents had accurate knowledge about safe water.
3.7.2 Knowledge about safe sanitation
About 94% of the respondents believed that definitely all faeces must be disposed of in the toilet/latrine, including those of children (84%). Eighty eight percent of the respondents believed that definitely the public get sick when one defecates in the open, while 89% believed that animal and baby faeces when not disposed properly can also cause disease and 76% believed that even if a fly fell on the food for a very short time, it can cause disease. Therefore, above half (63%) of the households had accurate knowledge about safe sanitation.
3.7.3 Knowledge about good hygiene
Overwhelming, 95% of the respondents strongly believed that household members should wash hands with soap every time they went to the toilet and before preparing food (96%), 97% strongly believed that all food should be eaten when hot and covered when left over, 94% believed that definitely all rubbish must be disposed of in the dust bin and burnt and 74% strongly believed that it is not good to eat fruits like mangoes, apples and sugarcanes without first washing them. Therefore, the knowledge questions among the urban poor of Nakawa and Kampala Central Divisions reveals that majority (67%) had accurate knowledge about good hygiene.
3.8 Characterisation of households who are most affected by poor WASH service delivery.
The findings show that landlord households are significantly different from those of tenants in terms of age of the household heads; total household size; main occupation of operating small private businesses; income status; number of rooms for sleeping in; source water from spring, and within 0.5 km; cost of water; average number of stances; sharing of

17
sanitation facilities; emptying sanitation facilities; access to hand wash facilities; and good knowledge about safe hygiene (p=0.05).
Landlord households were found to have older (average 48 years) household heads as compared to those of tenants, who had an average age of 42years. This finding is expected as age is directly proportional to income, thus, landlords are more likely to have more wealth than tenants. The landlord households had an average size of 6 members as compared to 4 among tenants. This finding is also expected given that landlord households are more likely to have access to income than the tenant households, thus, they can afford to have larger families than their counterparts.
More (59%) of the household heads who are landlords operate small private businesses as the main occupation as compared to tenants (33%). Large proportions (87%) of tenants were low income earners, earning below UGX500,000 per month as compared 66% landlords. Again, these findings show that landlord households have more wealth than those of tenants. The results also show that in more (96%) tenant households, people slept in less than 3 rooms as compared to 75% of the landlord households. Given the household size, this finding suggests that both landlord and tenant households are more likely to be susceptible to poor WASH services.
A larger proportion (12%) of the tenant households got their water from springs as compared to 5% landlord households. According to the water quality tests conducted in Kibuye I ward in Muwereza (2013), most spring water in peri-urban areas in Uganda is contaminated with faecal coliforms. Thus, more tenant households are exposed to pathogenic infestations than the landlord households.
Most (75%) of the tenants households sourced water within 0.5 km as compared to 61% landlord households. This finding suggests that still a sizeable number of both tenants and landlords are still accessing water from distant places. Majority (71%) of the tenant households paid UGX200 and above per Jerrycan for water, as compared to 55% landlord households. This finding suggests that the high cost of water hinders access to adequate quantities of water to a sizeable number of poor households, with more effects among the tenant households.
The households for tenants accessed sanitation facilities that had more stances (about 3) than those for landlords, which had an average of 2. About 21% of the landlord households shared sanitation facilities with less than 5 others as compared to 12% tenants. This finding is expected because some landlord households don’t have tenants while majority of tenants in slum areas stay with their landlords on the same premises. About 86% of the landlord households were found to have emptied

18
the sanitation facility that they used as compared to 76% tenants who reported that their sanitation facility was emptied. More (14%) of the tenant households reported to be using sanitation facilities which were emptied into the channel as compared to 6% landlords. This finding is expected because landlords are more likely to be knowledgeable about sanitation emptying services as well as behaviour evasively by not being open to where they emptied their sanitation facilities. Nonetheless, the findings suggest that there is still a high risk of exposure to pathogenic infestations along the faecal-water-oral route due to the poor disposal of faecal material among peri-urban households.
A larger proportion (53%) of the landlord households accessed hand washing facilities as compared to 40% of the tenants. Despite this, a lower proportion (58%) of landlord households had good knowledge about safe hygiene as compared to 73% tenants. This finding shows that there is a discrepancy between knowledge and practice of good hygiene, with a winder gap existing among the tenants. Moreover, the decision to provide a hand washing facility highly lies with the landlord.
Further analysis shows that male headed households are significantly different from those of females in terms of age, education and main occupation of the household head; total household size; access to lined pit latrines; cost of solid waste management; morbidity among children below 5 years; and good knowledge about safe hygiene (P=0.05).
The findings show that the household heads who are female were older (average 48 years) than their male counterparts who had an average age of 43. Fewer (52%) female household heads attained above primary level education as compared to 76% males. The finding of education level is expected, this is because majority of households in African culture encourage male education. The females who have low education levels, coupled with older age are more likely to be low income earners, which may constrain their access to WASH services.
Moreover, given the low education levels among female household heads, it is not surprising that only 19% were salary workers as compared to 31% males. Female headed households were found to be small (composing an average of 4 members) as compared to male headed households with 5 members. Given the economic status of these households, the size of these households suggests that WASH service delivery is wanting among both male and female headed households.
As expected, fewer (33%) female headed households accessed lined sanitation facilities as compared to male headed ones (47%). This is explained by the fact that female headed households are more likely to be low income earners than their male counterparts. A few (13%) of the female headed households paid above the pro-poor solid waste disposal

19
cost of UGX1,000 as compared to 38% males. This finding suggests that due to low income status of majority of the female headed households, they leverage their solid waste management cost by seeking cheaper options as compared to expensive options such as private collectors.
A smaller proportion (32%) of female headed households had children below 5 years who suffered from diarrhoea in the last 30 days before the survey as compared to their male counterparts (57%). This finding was not expected because male headed households are more likely to have higher disposable income to access better WASH services, coupled with better education level than their female headed counterparts. However, majority (76%) of the female headed households had good knowledge about safe hygiene than their male counterparts (63%). This finding supports the morbidity levels within the respective households. Moreover, there is a high probability that female household heads attend sensitization programs in person as compared to their male counterparts who are always represented by their spouses who have limited decision making powers over WASH.
More (88%) of the high income earners had household heads who had attained above primary level of education than low income households (only 63%). This supports the earlier finding that households with low education level are more likely to be poor. About 61% of the high income earners were landlords as compared to only 31% who were low income earners. This finding shows that some of the landlord households are likely to have a low propensity to purchase WASH services. As expected, majority of the households that use less than 3 rooms for sleeping were low income earners (93%) as compared to those who are high income earners (73%).
As expected, more (11%) of the low income households sourced their water from springs as compared to 3% who are high income earners. It is not surprising that some (10%) low income households accessed poor quality water. This finding further supports the earlier findings that show that cost is a major hindrance to accessing clean and safe water. The largest proportion (45%) of high income earners received water interruption notices as compared to 19% who are low income earners. This finding suggests that there is a likelihood that the communication channels such as radios and television used to spread water interruption notices are more easily accessible by the high income households as compared to the low income households.
On average, low income households accessed 3 stances per sanitation facility as compared to 2 among the high income households. More (22%) of the low income households shared the sanitation facility with less than 5 other households as compared to 12% of the low income households. This finding supports earlier findings which suggested that

20
low income households tend to live in congested environments with high inequality to sanitation infrastructure.
The larger proportion (5%) of the high income households paid above the pro-poor cost of garbage disposal of UGX1,000 per round as compared to 25% among the low income earners. This finding suggests that the poor receive a leverage price when disposing of garbage. About 53% of the high income households had received sensitization about solid waste management and were aware about the solid waste ordinance of 2000 as compared to 29% and 26% of the low income households that were sensitised and aware respectively. Again, this finding suggests that the methods of sensitization that are used by service providers as well as the means of creating awareness about the ordinance favour the high income class than their counterparts. Moreover, the education levels of the low income households were found to be low.
Fifty eight percent of the high income households accessed a hand washing facility as compared to 41% of the low income households. This finding suggests a high prevalence of waterborne diseases among the low income households. Indeed, 54% of the low income households had a child less than 5 years that had suffered from diarrhoea infection in the last 30 days before the survey as compared to 30% among the high income households. It is not surprising that more (86%, 74% and 81%) of the high income households have better knowledge about safe water, sanitation and hygiene respectively than their low income counterparts (54%, 61% and 64%).
About 4% of the households with poor knowledge about safe water got their water from dug well as compared to 1% of those who had good knowledge. As a conse- quence, 13% of the households that had poor knowledge about safe water accessed water of poor quality as compared to only 5% of those who had good knowledge about safe water. It is not surprising that more (16%) households of those that had poor knowledge about safe water emptied their sanitation facilities using Jerrycans as com- pared to only 4% of those who had good knowledge. Emptying sanitation facilities using Jerrycans increases the risk of exposure pathogenic infestation among the work- ers who empty the facility.
The results also show that 48% of the households with poor knowledge about safe water practiced poor solid waste management as compared to 28% of those who had good knowledge. As expected, more (64%) of the households that had poor knowledge about safe water had children under 5 who suffered from diarrhea infection in the last 30 days before the survey as compared to only 42% of those who had good knowledge. It is not surprising that households having better knowledge in safe water also have good knowledge in safe sanitation and hygiene.

21
The findings show that 77% of the households that had good knowledge in safe water also had good knowledge in safe sanitation as compared to 42% who did not have good knowledge in safe water. 88% of the households that had good knowledge about safe water had good knowledge about safe hygiene as compared to 37% who did not have good knowledge.
The findings show that there is a significant difference between households with good knowledge about safe sanitation and those that do not have in terms of the quality of water they accessed; emptying the sanitation facility using Jerrycans; good knowledge about safe water and hygiene (P=0.05). More (95%) of the households that had good knowledge about safe sanitation accessed water of good quality as compared to 86% of those who did not.
A smaller proportion (14%) of the households with poor knowledge about safe sanitation used Jerrycans to empty their sanitation facilities as compared to 6% among those who had good knowledge about safe sanitation. As expected, more (74% and 80%) of the households that had good knowledge about safe sanitation had good knowledge about safe water and hygiene respectively as compared to 37% and 46% of those with poor knowledge about safe sanitation.
The findings show that there is a significant difference between households with good knowledge about safe hygiene and those that do not have in terms of the source and quality of water they accessed; emptying the sanitation facility using Jerrycans; proper solid waste management; morbidity among children under 5 years; and good knowledge about safe water and sanitation (P=0.05). It was not expected that only those (3%) of the households that had good knowledge about safe hygiene sourced their water from dug wells. This finding may be explained by other factors such as cost which may limit such knowledgeable households to access clean and safe water. As expected, more (17%) of the households with poor knowledge about safe hygiene accessed water of poor quality as compared to 4% of those who had good knowledge. 20% of the households with poor knowledge about safe hygiene used a Jerrycan to empty their sanitation facilities as compared to 3% of those who had good knowledge. As expected more (71%) of the households with good knowledge about safe hygiene practiced proper solid waste management as compared to 51% of those who had poor knowledge.
Indeed, 60% of the households that had poor knowledge about safe hygiene had children who suffered from diarrhea in the last 30 days before the survey as compared to 45% of those who had good knowledge on the subject. A larger number (78 and 75%) of those households that had good knowledge in safe hygiene had good knowledge in both safe water and sanitation respectively as compared to only 23 and 38% of those who did not have good knowledge in safe hygiene.

22
4.0 CONCLUSIONS AND RECOMMENDATIONS
4.1 Conclusions:
Poor people in Nakawa and Kampala Central Divisions have medium levels of education, limited skills and majority involved in petty businesses and casual labour which clearly explain their low levels of income. Big household sizes living in small rented houses are synonymous with the high levels of the poverty. Hence inabilities to adequately access basic social amenities like water and good sanitary facilities;
The women are most likely to have more knowledge on the WASH issues as home care takers even in the absence of their spouses;
Majority of the poor people in Nakawa and Kampala Central Divisions who live in informal settlements are accessing water from safe water sources; Cost for water and the distance to the water source are the most significant barriers to access to safe water; and responsiveness of service providers is low.
The taste, colour and smell of water are acceptable to most respondents in the target area except a few of those who access water most likely from spring wells and dug wells; Majority of the urban poor are accessing some form of sanitation facilities. However, the quality of these facilities is very questionable; but majority don’t own them because they are tenants. This impedes decision making.
Majority of the urban poor don’t have access to hygiene facilities and don’t practice hand washing with soap during critical times this explains the high incidence of diarrhoea cases among children below 5 years;
It is very evident that majority of the populace are not aware about the solid waste related laws thus making enforcement difficult;
Majority of the peri-urban poor have acceptable levels of knowledge on good sanitation, hygiene and water. However, they have more accurate knowledge on hygiene compared to safe water and sanitation and also those who don’t have accurate knowledge (nearly 40%) are wanting.

23
4.2 Areas that need improvement and policy implication
The recommendations are structured into policy and project implementation;
4.2.1 Policy Recommendations:
The Government of Uganda, KCCA and other development partners should ensure that population control measures, life skill programs should be an integral part of many community development programs as cross cutting issues;
NWSC should extend more prepaid water meters for the urban poor to implement the propoor tariff, as well further strengthen WACOCO;
Service providers, such as NWSC should provide advance notices to community when interruptions in water supply are expected. This will help community to devise coping mechanisms in such times. KCCA and other development partners should work with the local community to establish/strengthen user management committees for the public sanitary facilities;
KCCA and NWSC should work with service providers to establish a pro-poor toilet emptying tariff for the urban poor to effectively access emptying services; and streamline emptying services as well as reign in on private operators. This should be the same with solid waste management;
KCCA should forge a friendly and easy access to communication channel through which her messages on safe sanitation practices can reach the community;
KCCA should step up enforcement on landlords who construct premises with out adequate sanitary facilities;
KCCA and other development partners should support formal solid waste reuse mechanisms, such as recycling and waste reduction.
4.2.2 KASTI Project specific Recommendations:
The KASTI project implementers should integrate both men and women into this project as they hold decision making powers in their households. More efforts should be made to ensure that most of the household heads attend the project activities;

24
The project should utilise the medium levels of education in these areas for sensitization on government policies on WASH but also ease formulation of bylaws in the areas;
Majority of the population are tenants with limited decision making powers on hygiene and sanitation intervention at household level, hence the project needs to bring on board the landlords;
The project should sensitize the community more on best practices to make water safe for domestic use as well as critical hand washing and support efforts geared towards hand washing using soap. This will also mitigate the likely health effects of poor quality water from springs and dug wells. They should also undertake community sensitization on the dangers of poor human waste management and also encourage proper waste management. The project should undertake massive mobilization and sensitizations about proper solid waste management. These awareness campaigns should be continuous to ensure that the knowledge levels are increased further and also to close the knowledge gap completely among the peri-urban poor in Nakawa and Kampala Central Divisions;
The existing community structures like VHTs should be relied on by the project and provide them with refresher trainings to continue cascading knowledge to the general community on good hygiene practices such as hand washing with soap;
The popularised and simplified solid waste ordinance of 2000 developed by Community Integrated Development Initiatives alongside KCCA should be widely disseminated to the general populace by the project; and the project should communicate the existing and new solid waste management arrangements by KCCA to all relevant stakeholders on a continuous basis.

26
Environmental Alert
@Env_Alert
Environmental Alert