Embed Size (px)
Citation preview

ASSESSMENT OF THE WELLNESS AND
AGRICULTURE FOR LIFE ADVANCEMENT
(WALA) ACTIVITY
January 2018
This publication was produced at the request of the United States Agency for International Development. It was prepared independently by David Soroko, Dr. Lawrence Mapemba, Jim Phillips, and Merrill Anne Jordan of International Business & Technical Consultants, Inc. (IBTCI).

ASSESSMENT OF THE
WELLNESS AND AGRICULTURE FOR LIFE ADVANCEMENT (WALA) ACTIVITY FINAL February 22, 2018 AID-OAA-I-15-00022/AID-612-TO-17-00001 International Business & Technical Consultants, Inc. (IBTCI) 8618 Westwood Center Drive, Suite 400 Vienna, VA 22182
DISCLAIMER The author’s views expressed in this publication do not necessarily reflect the views of the United States Agency for International Development or the United States Government. Cover – Namikoko Watershed Management Committee Members standing in Water Absorption Trench newly constructed with USAID assistance. Photo by David Soroko

TABLE OF CONTENTS Table of Contents Acronyms Executive Summary .................................................................................................................................................... 1
Major Findings ................................................................................................................................................................ 1
Introduction ..................................................................................................................................................................... 2
Assessment Purpose ..................................................................................................................................................... 2
The WALA Context .................................................................................................................................................... 2
WALA Program Description ..................................................................................................................................... 4
Research Design and Methodology ...................................................................................................................... 5
Conclusions .................................................................................................................................................................... 19
Recommendations ..................................................................................................................................................... 20
ANNEXES Annex 1. Resiliency Ranking Score Sheet ...................................................................................................... 23
Annex 2. Site Visit Reports .................................................................................................................................... 24
Annex 3. WALA Community Resilienc During 2015/16 el Niño Emergency: FGD Comments Extracted from Site Visit Reports ................................................................................................................... 106
Annex 4. Food Aid Recipients in TAs Where WALA Watershed Communities Did Note Need Food Aid .......................................................................................................................................................... 111
Annex 5. Illustrative FGD Questions ............................................................................................................. 112
Annex 6. Assessment Scope of Work ........................................................................................................... 113
TABLES Table 1. Rapid Assessment Field Visit Schedule ........................................................................................... 4
Table 2. Resiliency Ranking Score Sheet Results .......................................................................................... 7
Table 3. Watershed Sites with Irrigation Systems ...................................................................................... 8
Table 4. El Niño Impact on WALA/Non-WALA Communities: No Food Aid ........................... 15
Table 5. El Niño Impact on WALA/Non-WALA Communities: Needed Less FA Than in the Past .................................................................................................................................................................................... 16 Table 6. El Niño Impact on WALA/Non-WALA Communities: Needed Food Aid ................ 17
FIGURES
Figure 1. Frequency of WALA Interventions

ACRONYMS
ADC Area Development Committee AFOLU Agriculture, Forestry, and Other Land Use ARR Annual Results Review AS Assessment Specialist C-SAFE Consortium for Southern Africa Food Security Emergency CA Conservation Agriculture CATCH Consortium Administration and Technical Capacity Hub CCT Continuous Contour Trench CDCS Country Development Cooperation Strategy CRS Catholic Relief Services DFAP Development Food Assistance Programs FA Foreign Assistance FEF Farmer Extension Facilitator FFW Food for Work FGD Focus Group Discussions FISP Fertilizer Input Subsidy Program FY Fiscal Year GoM Government of Malawi HH Household I-LIFE Improving Livelihoods through Increasing Food Security KII Key Informant Interviews LDF Local Development Fund LOE Level of Effort LS Logistics Specialist M&E Monitoring & Evaluation MAIWD Ministry of Agriculture, Irrigation and Water Development MASAF 4 Malawi 4th Social Action Fund MCHN Maternal and Child Health and Nutrition MELS Monitoring Assessment, and Learning Support MOU Memorandum of Understanding MVAC Malawi Vulnerability Assessment Committee MYAP Multi-Year Assistance Program NGO Non-Governmental Organization NJIRA Pathways to Sustainable Food Security NRM Natural Resource Management PVO Private Voluntary Organization RRSS Resiliency Ranking Score Sheet SEG Sustainable Economic Growth SG Savings Group SOW Scope of Work TA Traditional Authority TL Team Leader UBALE United in Building and Advancing Expectations USAID United States Agency for International Development VSL Village Savings and Loan WALA Wellness and Agriculture for Life Advancement WAT Water Absorption Trench WFP World Food Program

WMC Watershed Management Committee WSC Water and Soil Conservation

1
EXECUTIVE SUMMARY This assessment explores watershed development impact on rural household food security and resiliency under an integrated five-year USAID funded Title II Multi-Year Assistance Program (MYAP) entitled Wellness and Agriculture for Life Advancement (WALA) (2009-2014) in Malawi’s southern region. The WALA program was implemented by a nine-member consortium led by Catholic Relief Services (CRS). The assessment analyzes the status of WALA’s watershed development investments; identifies the reasons for their sustainability or lack of sustainability; and determines the impact of those and other complementary WALA interventions on beneficiary household resiliency.
This report presents assessment design, methodology, analysis and key findings and recommendations. The assessment was conducted in December 2017 in southern Malawi’s eight most food insecure districts: Nsanje, Chikwawa, Thyolo, Mulanje, Zomba, Machinga, Chiradzulu and Balaka. More than 300 WALA beneficiaries participated in Focus Group Discussions (FGD) at 24 watershed development sites. The 3-4-year period between WALA’s completion and the assessment allowed the assessment team to observe evidence of watershed treatment sustainability or unsustainability. Project documents written during WALA implementation allowed for indirect validation of assessment findings.
MAJOR FINDINGS WALA’s investment in the Lingoni community in Machinga District has gained agency-wide recognition. Given the number of WALA interventions implemented at Lingoni, the one year hiatus in FFW compensated watershed development work, the expansion of irrigated area post-WALA, the extra-ordinary leadership exhibited by the Watershed Management Committee (WMC) Chairperson and Traditional Authority (TA), the relatively low productivity of FFW compensated workers, and the Lingoni-Chaone Memorandum of Understanding (MOU) in support of Lingoni River and irrigation system sustainability Lingoni could be referred to as an “outlier”. However, given the complementarity of watershed/irrigation system development and more traditional agricultural development and community capacity building interventions, and how this complementarity affected community and household resiliency during the 2015/16 El Niño, Lingoni also exemplifies WALA impact at other watershed development sites.
Effectively implemented watershed treatments slowed rainfall run-off velocity allowing more water to percolate into the soil. This reduced farm field erosion and soil loss, increased soil moisture, protected village and irrigation infrastructure, mitigated flash flooding, restored water tables and increased river flow volume and consistency. FGD respondents consistently stated that they harvest more maize per unit cultivated due to WALA introduction of Sasakawa, Conservation Agriculture (CA), irrigation and watershed treatments. Communities attributed improved maize harvests to more water available for irrigation, more production seasons (due to irrigation), improved soil structure, increased soil moisture during dry periods, more arable land, increased soil fertility, increased mixed cropping and more diverse enterprise mixes. Not all of these productivity enhancements are due to WALA interventions alone as Ministry of Agriculture, Irrigation and Water Development (MAIWD) staff also extend CA and other improved cropping techniques. However, it is the combination of farming innovations with watershed treatments that make more water available and protect fields from soil erosion and flooding that may optimize WALA community resilience.
WALA beneficiaries frequently employed group marketing to increase income from improved harvests. Households invested farm income in Village Savings and Loan (VSL) Groups. VSL loans and savings share outs were used for seed and fertilizer procurement, sustaining or multiplying WALA induced production

2
increases. VSL loans and share outs were also invested in livestock, improved housing, solar panels, school fees, small businesses, and food products that diversified diets. VSL reliance on local Private Service Providers (PSP) to train members and monitor performance promoted sustainability and may have led to VSL creation in non-WALA communities. VSL participation also introduced members to new savings and business start-up and management concepts. The combination of watershed treatments that allow increased rainy season production, irrigation that enables 2 or 3 additional harvests, the adoption of more productive farm technologies and enterprise mixes, group marketing, and VSL groups have contributed to significant short- term household resilience gains.
This resilience was shown during the 2015/16 El Niño. Nine of 24 WALA communities did not require any food aid during the El Niño. Six of these communities implemented 21 to 35 of WALA’s 37 watershed and non-watershed development interventions. An additional ten WALA communities needed less food aid than in past droughts. At these sites non-WALA communities and non-WALA households within the WALA area required food aid. Four of these sites implemented 24 to 29 of WALA’s 37 interventions. Five WALA watershed sites needed food aid during the 2015/16 El Niño.
A majority of the 24 WALA sites visited showed a lack of watershed treatment maintenance. Whether this lack of maintenance was chronic or exemplified visit timing (during peak farm labor demand) is unclear. The 2014 WALA watershed report stated that “approximately half of the visited treatments were either in good working order or clearly maintained. The other half exhibited signs of degradation (mostly partially fallen dams or silted Continuous Contour Trenches (CCTs) or a clear lack of maintenance (very few)”.1 Given the role watershed management plays in buttressing community resilience any shortfalls in sustainable treatment maintenance, or even expansion, would reduce community resiliency.
Watershed development driven benefits, though recognized by WALA communities, did not motivate widespread and consistent watershed treatment maintenance or expansion. Those cases of maintenance and expansion were either outliers (Lingoni) or most likely influenced by WALA follow on projects: United in Building and Advancing Expectations (UBALE) in Makande; Pathways to Sustainable Food Security (NJIRA) in Chikololere; Building Resilience through Productive Asset Activities in Namikoko. In several cases watershed treatments were reversed unintentionally (check dams disassembled by boys hunting rodents) or intentionally by farmers looking to gain lost land surface or restore “normal” water flows. This lack of maintenance, and treatment reversal, threatens resilience. It may make future watershed development more difficult without significant compensation. WALA follow on projects such as UBALE and NJIRA may provide communities with the time needed to fully understand and internalize watershed development value, especially if accompanied by complementary non-watershed development interventions (agricultural extension, VSL, irrigation, etc.). Lingoni WMC initiation of relations with up-river watershed communities and institution of an irrigation system membership fee may provide testable models of how sustainability can be achieved.
Finally, WALA beneficiaries frequently cited activities under WALA’s Maternal and Child Health and Nutrition (MCHN) strategic objective, including the dissemination of more nutritious ways to prepare meals, nutrition training, care groups, the value of dietary diversity, and kitchen gardens as instrumental in reducing child malnutrition and improving maternal health.
1 Watershed Development in Malawi: A study from the Wellness and Agriculture for Life Advancement (WALA) Program Final Report, July 2014.

3
INTRODUCTION ASSESSMENT PURPOSE USAID/Malawi commissioned this rapid Impact Assessment of USAID’s Wellness and Agriculture for Life Advancement (WALA) Activity under the Office of Sustainable Economic Growth’s (SEG) Monitoring, Assessment, and Learning Support (MELS) Project. The purpose of the rapid assessment was to analyze the status of WALA’s investments in watershed development and identify the reasons for their sustainability or lack of sustainability. The assessment was to address two specific questions:
To what degree are WALA watershed sites performing well on resiliency measures when compared to MVAC or non-WALA sites?
To what degree did WALA watershed activities reduce the need for food and/or other humanitarian assistance during the last drought among targeted WALA communities?
In addition, the assessment was to determine whether the Lingoni Watershed Management experience was atypical. This from the Scope of Work (SOW):
“WALA’s investment in the Lingoni community in Machinga District has gained agency-wide recognition…This assessment will seek to determine if the Lingoni site is an outlier or if this is the case for other WALA communities, by examining the thirty-two watershed development activities in nine districts. Have these communities also withstood the El Niño-effected drought as a result of the WALA intervention...can we attribute the success and resiliency of these communities to WALA’s investments in watershed activities or the impact of other community investments?”
During the December 6 – 20, 2017 period the rapid assessment team visited 24 WALA watershed development sites. Site visits entailed FGDs, KIIs, and watershed treatment and irrigation scheme observation. In all more than 300 WALA beneficiaries participated in discussions, interviews and observations. The site visit schedule is presented in Figure 1.
THE WALA CONTEXT2 Precipitation change scenarios portend acute development challenges for Malawi. Drastic precipitation reductions in southern Malawi are possible by the mid-2000s. As the southern region is the main subsistence maize growing area Malawian agriculture will be severely affected by rainfall variability. With farm plot sizes typically less than 0.25 ha southern Malawi households are highly vulnerable to food insecurity and lost farm income when rains fail completely, begin late, or don’t fall at crucial stages of maize maturation. Most households are overly reliant on maize, have low dietary diversity, and do not grow enough food for their own consumption. As these household’s must purchase food even under good rainfall their food security is extremely sensitive to food price movements. In 2013-14, as WALA was winding down, many southern Malawi households experienced weather induced crop failures in conjunction with high fertilizer and fuel prices due to Government of Malawi (GOM) economic policies. Additional hardship was caused by rainfall variation due to the 2015-16 El Niño event. Food security improved significantly following mid-2017 harvests, and the 2017/2018 Malawi Vulnerability Assessment Committee (MVAC) estimated that approximately 837,000 people will likely require food assistance in
2 Climate, Agriculture, and the Environment Training: Proving Concepts and Improving Climate Change Integration in Agriculture Sector Activities Hosted and Sponsored by USAID/DCHA Food for Peace and USAID/BFS Feed the Future

4
southern Malawi between December 2017 and March 2018, an 87 percent decrease from the same period in 2016/2017.3
While some households living near southern region Monadnocks (such as Mt. Mulanje with 1600 millimeters of annual rainfall4) may not experience drought or drastic rainfall variability they are prone to flash flooding, soil loss, and severe livelihood disruptions as large amounts of rain water rush over degraded and deforested hillsides deluging fields and communities.
The Malawian government and donors recognize the risks posed by climate change induced rainfall variability in southern Malawi. WALA is part of a broad effort to improve food security among southern Malawi’s poor and very poor households. Programs similar to WALA have been, are being, and will be implemented to improve rural family livelihoods, food security, nutrition, and resilience. It is likely that a number of WALA beneficiary households are receiving and will receive some level of support in similar areas (Maternal Child Health and Nutrition (MCHN), CA, VSL, irrigation, watershed management) in the future. This is good as the level of natural resource management and community capacity change needed to cope with climate change is unlikely to be achieved within the more standard 5-year project cycle. USAID has recognized this as illustrated by the C-SAFE, I-LIFE, WALA, UBALE, NJIRA and 2016/17 Productive Assets Activity continuum.
WALA PROGRAM DESCRIPTION5 WALA was a five-year Title II Multi-Year Assistance Program (MYAP) to prevent and mitigate food insecurity in southern Malawi. WALA targeted the most vulnerable groups comprised of food insecure female headed households farming small and marginal plots and hosting chronically ill persons (tuberculosis and HIV/AIDS) and/or orphans. Other less vulnerable population segments were included during implementation as WALA also embraced beneficiary self-selection in service targeting.
WALA was implemented in southern Malawi’s eight most food insecure districts: Nsanje, Chikwawa, Thyolo, Mulanje, Zomba, Machinga, Chiradzulu and Balaka. Nsanje, Chikwawa, Machinga and Balaka are still being covered by current Development Food Assistance Programs (DFAP). These districts were some of the worst hit in the 2015/16 El Niño. CRS/Malawi, through the Consortium Administration and Technical Capacity Hub (CATCH), led WALA’s management and implementation.
WALA’s goal was to improve the food security of 214, 974 chronically food insecure households in 39 Traditional Authorities through strategic objectives in maternal and child health and nutrition (MCHN) (SO1); agriculture, natural resource management (NRM), Irrigation and Economic Activity (SO2); and Disaster Risk Reduction (SO3).
Table 1: Rapid Assessment Field Visit Schedule Day/Date Site, District, Traditional Authority-Activity Wed, 12/6 Namikoko Watershed, Zomba, Mlumbe-FGD/ Observation,
Thurs, 12/7 Lingoni Watershed, Machinga, Chamba-FGD/Observation Malosa Watershed, Zomba, Malemia-Observation Domasi Watershed, Zomba, Malemia-Observation
3 Southern Africa – Disaster Response Fact Sheet #10, Fiscal Year (FY) 2017 September 30, 2017, USAID. 4 Journal of Climatology & Weather Forecasting, https://www.omicsonline.org/open-access/detection-of-precipitation-and-temperature-trend-patterns-for-mulanjedistrict-southern-part-of-malawi-2332-2594-1000187.php?aid=84147 5 Impact Assessment of USAID’s Wellness and Agriculture for Life Advancement (WALA) Activity Scope of Work, USAID/Malawi Sustainable Economic Growth Office, October, 2017.

5
Table 1: Rapid Assessment Field Visit Schedule Day/Date Site, District, Traditional Authority-Activity Fri, 12/8 Makande Watershed, Chikwawa, Kasisi-FGD/Observation
Sat, 12/ 9 Mbangu Watershed, Nsanje, Malemia-FGD/Observation
Mon, 12/11 Mitumbira Watershed, Mulanje, Chikumbu-FGD/Observation Nang’ombe Watershed, Mulanje , Chikumbu-FGD/Observation Khoviwa Watershed, Mulanje, Chikumbu-FGD/Observation
Tue, 12/12 Chigwirizano Watershed, Thyolo, Khwethemule-FGD/Observation
Wed, 12/13 Katunga Watershed, Zomba, Chikowi-FGD/Observation Senjere Watershed, Zomba, Chikowi-FGD/Observation Kasabola Watershed, Zomba, Chikowi-FGD/Observation
Thurs, 12/14 Majawa Watershed, Zomba, Chikowi-FGD/Observation
Fri, 12/15 Namatemba Watershed, Zomba, Mlumbe-FGD Namadidi Watershed, Zomba, Mlumbe-FGD/Observation Namilongo Watershed, Zomba, Mlumbe-FGD/Observation
Sat, 12/16 Domasi Watershed, Zomba, Malemia-FGD Malosa Watershed, Zomba, Malemia-FGD
Sun, 12/17 Jerenje Watershed, Zomba, Mlumbe-FGD/Observation Mbeluwa Watershed, Zomba, Mlumbe-FGD/Observation
Mon, 12/18 Natama Watershed, Chiladzulu, Ntchema-FGD/Observation Muluma Watershed, Chiladzulu, Ntchema-FGD/Observation Namatemba, Zomba, Mlumbe-Observation
Tues, 12/19 Chikololere Watershed, Balak, Sawali-FGD/Observation Mukuta Watershed, Balaka, Kachenga-FGD/Observation Toleza Watershed, Balaka, Sawali-FGD/Observation
RESEARCH DESIGN AND METHODOLOGY The rapid assessment team was composed of an expatriate Team Leader (TL), Malawian Assessment Specialist (AS) and a Logistics Specialist (LS). The assessment performance period was November 20, 2017 to February 28, 2018. Within this performance period the TL had a 50 day Level of Effort (LOE), the AS a 26 day LOE and the LS a 17 day LOE.6 The TL initiated the assessment approximately two weeks before arriving in Malawi with a desktop review of program documentation (CRS proposal, Annual Results Reports, mid-term and final evaluation, program briefs, USAID’s CDCS, etc.). The TL submitted a preliminary analysis to USAID prior to arrival in-country. It described the assessment’s analytical framework, provided desktop review results, and listed illustrative questions for FGDs and KIIs.
Upon arrival in country on December 5, 2017 the TL and AS met with Mission SEG and Food for Peace staff to discuss assessment implementation. This meeting decided that the assessment should maximize the number of watershed site visits with the majority of data compilation, analysis and report writing to take place after the TL’s departure from Malawi. Upon departure for the field on December 6, 2017 the TL and AS were joined by two Malawian Research Assistants/Interns.
6 The original SOW LOE was 45 days for the TL and 21 days for the AS. This was amended to increase their LOE by 5 days.

6
The SOW called for the team to examine the resilience between WALA sites and MVAC sites (non-WALA sites) that received food aid, devise methods for measuring resiliency between these sites to determine WALA project success, and determine clearly what would define Lingoni as an outlier. The team was not expected to conduct surveys to produce primary data. Instead it reviewed documents and other secondary data7 (including the CRS WALA Watershed Sites, MVAC-WFP Food Distribution 2016-17 Response and CRS WALA Irrigation Site Details ALL PVOs 23 July 2014 spreadsheets) and conducted FGDs. KIIs with WALA, GOM, donors, civil society and NGO implementer stakeholders were not held to free up time in the field for watershed site visits.
To compare WALA and non-WALA site resiliency the preliminary analysis premised that resiliency depended on the number of WALA interventions implemented per watershed development site. While WALA interventions can provide agricultural development and food security value individually, intervention integration would optimize resiliency impact. This is because watershed management increases the water and moisture available for food and cash crop production. Increased food and cash crop production (above household consumption requirements) enables group marketing for increased household income. Increased income can be used to purchase productivity enhancing inputs or invested via Village Savings and Loan (VSL) groups. VSL loan and interest proceeds enable investments in production inputs, livestock, housing, education, solar panels, and non-farm (i.e. post-harvest) small business. The capacity building inherent in these group and individual activities enhances rural household and community decision making. Increased community access to more reliable water and soil moisture, farm production, farm product sales income, investment resources (loans and interest income), diversified farm enterprises (mixed cropping) and better individual and group interaction and decision making (social capital8) increases household resilience.
7 While there was abundant WALA documentation there was only one document specifically related to WALA watershed activities, Watershed Development in Malawi: A study from the Wellness and Agriculture for Life Advancement (WALA) Program Final Report, July 2014. This study dealt with six watershed development sites representing 25% of total watershed hectarage treated. Even the mid-term and final evaluations contained little analysis of WALA’s watershed activities. 8 Social Capital is defined as the abundance of information and trust that diffuses across networks of interaction among people, and through which individuals are obligated to exchange their resources, goods, and services to deal with problems or respond to opportunities; “Patterns of Access and Use in Wetlands The Lake Chilwa Basin”, Daimon Kambewa, BASIS CRSP, October 2004
Figure 1: Frequency of WALA Interventions

7
This construct gave rise to two site-visit and FGD tools: 1) FGD question guidelines; and 2) a Resiliency Ranking Score Sheet (RRSS). The RRSS listed almost every WALA SO2 intervention (watershed treatments, producer/marketing group formation, conservation agriculture, VSLs, etc.). It included resilience enhancing behaviors plausibly tied to WALA interventions such as household investment of VSL loans or share-outs in agricultural inputs, livestock, small businesses or education. It probed sustainability aspects such as post-WALA watershed treatment maintenance and expansion or Watershed Management Committee (WMC) members extending technical expertise to non-WALA communities. RRSS use required checking the boxes of interventions during FGDs or on-site observation. Checked boxes where then compiled in a resiliency ranking spreadsheet (See Annex). A graph depicting how frequently WALA interventions were implemented in the 24 sites visited is presented in Figure 1. As shown tree planting, mixed cropping and WMC formation were universal with VSLs second.
FGD composition was a primary methodological issue. As WALA ended in 2014 implementing NGO staff were not present at watershed sites. So, CRS and Ministry of Agriculture, Irrigation and Water Development (MAIWD) staff helped to arrange on-site FGD discussions. FGDs were inevitably attended by former WMC members, sometimes accompanied by the village chief, Village Development Committee representative, a Farmer Extension Facilitator (FEF), a MAIWD extensionist, and villagers (sometimes 2 or 3, other times as many as 30). As a result, FGDs incorporated the most WALA informed community members. This could affect resiliency ranking as WMC member/FGD participants were probably most familiar with WALA activities and potential results as described by WALA staff during sensitization, mobilization and implementation. They also may not have been able to recall which activities were actually implemented and their results. During the approximate 3-hour site visit it was not possible to directly assess whether FGD identified interventions or results were actually implemented and achieved (or, in cases such as tree planting or mixed cropping, solely attributable to WALA). That being said, the desktop review made possible indirect validation of FGD findings.9
The second methodological issue was the number of site visits and FGDs (24) implemented in 13 work days over a 14 day period. Site visit schedule intensity and related travel and logistical requirements limited data and information collection and meant that FGD and observation note compilation, synthesis and analysis, and photo sorting and filing, took place virtually after TL departure from Malawi.
9 Several documents where FGDs described WALA interventions were written by CRS such as “Integration for Transformative Change: Case Studies from CRS’ Wellness and Agriculture for Life Advancement Program” and “Cultivating Change: Success Stories from the WALA and IMPACT Programs in Southern Malawi”.

8
The RRSS included boxes on watershed treatment maintenance or expansion post-WALA. Site visit observation indicated that treatment maintenance was lacking. CCTs were filled in, overgrown or poorly placed; check dams disassembled, washed away or so silted as to have disappeared; extensive reforestation or field tree planting not evident; etc. However, the assessment team could not ascertain if this was a chronic problem or simply illustrative of site visit timing (i.e. during the peak labor demand rainy/cultivation season). Some FGD participants admitted that watershed treatments were not maintained (as they awaited donor or government compensation for maintenance). Others stated that treatment maintenance would occur in the dry season.10
Is the Lingoni community’s successful irrigation scheme an outlier or is it representative of WALA impact throughout the project area?
As described in the draft “Field Manual for RIPE Small-Scale Irrigation Structures”11 developing and maintaining environmentally sustainable irrigation schemes is technically demanding and complex. The manual lists seven “Potential Environmental Impacts” (soil erosion, downstream impact, drying out of wetlands and marshes, soil degradation, etc.) and 30 “Mitigating Measures” (soil conservation structures; correct layout of irrigation conveyances; correct sustainable soil management; etc.). WALA development of effective and sustainable community and FFW beneficiary capacity to implement and maintain demanding mitigation measures would be a significant accomplishment. Concurrently boosting smallholder farmer food and livelihood security adds additional complexity. As captured in the RRSS WALA’s watershed management and irrigation scheme development addressed environmental sustainability and food and livelihood security needs referenced in Agricane’s field manual. Watershed treatments reduced soil erosion and degradation, raised the water table and encouraged natural tree regeneration. Concurrent agricultural and livelihood interventions (conservation agriculture, group marketing, VSLs) took advantage of increased soil moisture and irrigation to boost food security and livelihoods.
As shown in Table 2 Lingoni ranked first on the RRSS having implemented 35 of 37 WALA interventions. The two WALA interventions not implemented were constructing half-moon terraces (observed only at
10 These findings mirrored those described in WATERSHED DEVELOPMENT IN MALAWI: A study from the Wellness and Agriculture for Life Advancement (WALA) Program: Final Report, July 2014. 11 Field Manual for RIPE Small-Scale Irrigation Structures, Agricane, undated.

9
Namikoko) and investing VSL proceeds in solar panels (observed in 5 communities). Lingoni was one of 15 watershed development sites where farmers practiced irrigation; one of nine irrigation sites with an operable night reservoir (indicating a gravity fed system); and one of only four sites that raised fish in the night reservoir.
Table 3 (above) provides data on the 15 WALA sites with concurrent watershed and irrigation system development12. Lingoni had the largest targeted watershed area (3,394 hectares) and the second largest area treated (135 hectares). It had the ninth highest number of FFW beneficiaries (i.e. workers, 600), the third highest number of FFW compensated months worked (10, tied with Namatemba), and the second lowest number of meters of primary structures (7,855 meters). While irrigation and watershed development work was possible over a three-year period Lingoni was the only site where FFW compensated work began in 2010/11, stopped in 2011/12, and resumed in 2012/2013. Finally, Lingoni distributed the sixth highest amount of FFW oil (11,389 kgs) and beans (46,500 kgs).
Lingoni workers appear to be the fifth least productive. On average each Lingoni FFW month applied 60 workers constructing 785.5 meters of primary watershed structures, or 13.1 meters/FFW beneficiary/month. Makande had the least productive workers, at 8 meters/FFW beneficiary/month and Mitumbira the most productive at 158 meters/FFW beneficiary/month. The CRS WALA Watershed Sites spreadsheet (on which this analysis is based) only includes data on one irrigation structure, Water Ponds. So, it can be assumed (and was observed on several sites) that many FFW compensated watershed treatments were intended to protect irrigation system infrastructure and not directly affect river flow available for diversion to irrigation. In fact, most Lingoni watershed treatments observed were adjacent to or below the Lingoni River weir.13
The Agricane field manual states:
“Holding other factors constant, area brought under irrigation and number of irrigation times in a year is dependent on the availability of either surface or ground water. This indicator is thus an impact of WSC.”14
The FGD revealed that Lingoni had 10.8 hectares under irrigation when WALA ended and 30 hectares currently. FGD participants also lauded watershed management impact on raising the water table and restoring soil moisture and fertility. Food production has increased as irrigation scheme members grow maize and other crops 2 or 3 times a year. Check dams have filled-up gullies restoring arable land now under production. Finally, Lingoni is one of four WALA watershed sites where farmers raise fish, as a community in the night reservoir, and as individuals in their own ponds, for consumption and sale. These are examples of successful watershed restoration and management.
12 This table was extracted from the CRS compiled “CRS Watershed Development: 2009 to 2014. Accompanying data and information on factors that might affect each site’s watershed development such as topography, soil structure, vegetative cover, rainfall, and population were not available to the assessment team. 13 The assessment team recognizes that this superficial observation requires validation by more scientific methods. 14 WATERSHED DEVELOPMENT IN MALAWI: A study from the Wellness and Agriculture for Life Advancement (WALA) Program: Final Report, July 2014.
Photo 1. Check Dam Restored Arable

10
Another unique Lingoni experience shows community initiative post-WALA. Realizing that the irrigation scheme’s long-term success would depend on a community living upriver near the Lingoni River source the WMC chairperson (and leader of the original “Lingoni Six”) went to the Chaone village to sensitize them on watershed management. Chaone is a village of 5,400 households. Their cultivation and forest management practices were affecting Lingoni River flow volume and consistency. The Lingoni chairperson had recently been elected head of the Area Development Committee (ADC). As such he supervised use of the government’s Local Development Fund (supported by a Malawi 4th Social Action Fund (MASAF 4) World Bank loan). In 2016 the chairperson/ADC head signed an MOU with the Chaone community to ensure Lingoni River sustainability at the source. The MOU stipulated that the LDF would pay 80 Choane villagers MWK600/day for 24 days bi-annually for watershed development work. The Lingoni WMC would provide technical guidance. The upstream community constructed CCTs, WATs, and planted trees, work deemed essential in increasing river volume and maintaining the year-round flow.
In another Lingoni experience not replicated at any of the 24 WALA sites visited by the assessment team, the WALA watershed management report attributed Lingoni achievement of nearly 100 percent watershed treatment adoption to senior Traditional Authority (TA) leadership. Apparently the Chamba TA insisted that his field be treated before all other fields. The watershed management report quotes Lingoni WMC members boisterously exclaiming, “Since the TA’s field received the treatments first, nobody could refuse!” and declaring, “Unlike others, we had no problems with farmers accepting the treatments.”15
Given the number of WALA interventions implemented at Lingoni, the one-year hiatus in FFW compensated watershed development work, the expansion of irrigated area post-WALA, the extra-ordinary leadership exhibited by the WMC Chairperson and TA, the relatively low productivity of FFW compensated workers, and the Lingoni-Chaone MOU in support of Lingoni River and irrigation system sustainability (and financed with World Bank loan proceeds) Lingoni could be referred to as an “outlier”. However, as will be seen it also exemplifies WALA impact at other watershed development sites.
Makande is another WALA watershed management “outlier” with the most meters of primary structures (a massive 281,770 meters); the most FFW months worked (18 over 3 years); the most oil (41,773 kgs) and beans (170,550 kgs) distributed; and the second highest number of FFW beneficiaries (1,895). It is WALAs most intense and consistent watershed development investment. On average each Makande FFW month applied 105 workers constructing 15,653 meters of primary watershed structures or 8 meters/FFW beneficiary/month, the least productive output per worker. However, different from the other watershed sites listed in Table 3 Makande did not develop gravity fed irrigation infrastructure during WALA and instead focused entirely on watershed development.16 Makande also ranked 5th on the RRSS implementing 28 interventions and did not need food aid during the El Niño. Finally, the Makande watershed is found in one of the most isolated and agro-climatically challenging areas of southern Malawi.
15 Ibid 16 The assessment team was not shown gravity fed irrigation infrastructure. The FGD described the irrigation of 1 hectare benefitting 40 people made possible by increased water table due to watershed treatments.

11
Have WALA communities withstood the El Niño-effected drought as a result of the WALA intervention?
FGD respondents consistently stated that they harvest more maize per unit cultivated due to WALA introduction of Sasakawa17, Conservation Agriculture (CA), irrigation and watershed treatments. Communities attributed improved maize harvests to more water available for irrigation (due to increased or more permanent river flow), more production seasons (due to irrigation), improved soil structure (less top soil loss), increased soil moisture during dry periods (CCTs, CA), more arable land (check dams), increased soil fertility (due to compost, mulching, manure use, leguminous trees), increased mixed cropping and more diverse enterprise mixes (maize, dry and green; vegetables; orange fleshed sweet potato, pigeon peas, birds eye chilies, strawberries, fruit trees; indigenous forest fruits). Not all of these productivity enhancements are due to WALA interventions alone as MAIWD staff also extend CA and other improved cropping techniques (for example). However, it is the combination of farming innovations with watershed treatments that make more water available and protect fields from soil erosion and flooding that may optimize WALA community resilience.
FGD participants also stated that community members now have higher incomes (group marketing and VSLs) that they have invested in farm inputs (including irrigation technology) and livestock (including fish
farming). They have also enhanced their nutrition with new local food recipes that include soybeans, green bananas, OFSP, pigeon peas, cassava, etc.
Finally, some WALA communities did not experience adverse El Niño effects. These communities were frequently living or farming in close proximity to a Monadnock, such as Zomba Mountain. Other WALA assisted communities only needed food assistance for the most vulnerable households. Finally, several participants stated that regardless of WALA intervention impact, if there is severe drought there simply is no stopping the resulting crop failures and need for food aid.
If so, can we attribute the success and resiliency of these communities to WALA’s investments in watershed activities? Other community investments?
17Sasakawa” planting method advocated by Sasakawa Global 2000, using closer ridge spacing (75 cm apart) and single seeds (25 cm apart) instead of the traditional method of planting multiple seeds 50 cm apart along the ridges.
Photo 2. Sasakawa and mixed cropping (maize, beans, pigeon peas)
Photo 3. Contour Control Trench with Vetiver

12
WALA’s success in increasing beneficiary resiliency is ultimately dependent on small farmer maize productivity. Maize is grown by 97% of farming households and accounts for 60% of total calorie consumption. Almost all maize is grown without irrigation during the single rainy season from October to April. Rainfall amount and periodicity is highly variable. This can be particularly damaging when short dry spells occur during maize’s critical flowering and early grain filling stages. 18
Decades of intensive smallholder maize cultivation, in the absence of significant fertilizer use, have depleted soil nutrients, particularly nitrogen. National maize yields averaged 1.3 metric tons in the two decades prior to 2006 and over half of Malawi farming households operated below subsistence. Only 20% of rural households sold surplus maize due to unproductive and small farm plots. On-farm storage losses were high and most households purchased maize at much higher prices when stocks were exhausted, typically during January to March.19
To cope with food deficits, households reduced daily maize consumption, increased consumption of alternative calorie sources (such as cassava), sold assets (such as livestock), and sought employment on estates or in towns. Crop theft was common during severe food shortages, prompting farmers to harvest unripe green maize for immediate consumption. Food insecurity encouraged unsafe sexual practices leading to higher HIV/AIDS and STD incidence, teenage pregnancies, and abortions. Gender and theft-related violence increased and school attendance dropped
The May 2005, Malawi Vulnerability Assessment Committee concluded that over 4.2 million people required food aid and a major humanitarian relief operation ensued. Beginning in 2006 the government decided to subsidize smallholder agricultural input application to address this vulnerability. Subsidies were mainly provided for fertilizer and hybrid and open pollinated maize seed. By using vouchers government left maize seed selection up to the small farmers. They predominantly chose hybrid maize seed. Input subsidies continue to today under the Fertilizer Input Subsidy Program (FISP). Thus, while Malawi’s national maize crop is still extremely susceptible to
rainfall variability the more widespread use of government promoted hybrid seed and fertilizer has increased small holder maize production under most rainfall conditions. For WALAs small holder community’s watershed and irrigation interventions reduced the impact of rainfall variability, enhancing maize production achievements resulting from government’s subsidized promotion of fertilizer and hybrid maize seed.
In determining what non-watershed community investments increased WALA community resiliency to drought we should consider intervention sequencing and length. Whether FFW was available for watershed treatments for one year or three the majority of watershed sites initiated non-watershed
18 Input Subsidies to Improve Smallholder Maize Productivity in Malawi: Toward an African Green Revolution Glenn Denning, Patrick Kabambe, Pedro Sanchez, Alia Malik, Rafael Flor, Rebbie Harawa, Phelire Nkhoma, Colleen Zamba, Clement Banda, Chrispin Magombo, Michael Keating, Justine Wangila, Jeffrey Sachs Published: January 27, 2009 19 Ibid
Photo 4. Maize Cropping on Marginal Land

13
interventions in 2009 or 2010. So, while awaiting FFW watershed management investments communities were setting up VSLs, producer groups, marketing groups, care groups and learning about improved maternal health and nutrition. These interventions had the potential to improve food production (including kitchen gardens), farm income, access to credit and savings, health and resiliency.
For example, FGDs frequently sited use of VSL share outs to procure food products. Other resiliency enhancing VSL investments were buying livestock (that could be sold during droughts) and farm inputs; starting or expanding businesses; paying school fees; etc. However, the sequencing of whether VSLs came first, and then helped farmers access more productive technologies and coping strategies, or whether irrigation, group marketing, and increased farm income came first, thus allowing cash strapped females to join VSLs, must be determined case by case. While there is evidence that VSLs came first:
“Most successful women…were often members and leaders of multiple groups. The combined efforts…saving and accessing more money with SGs, then improving agricultural production in cash crops from the capacity building component, and finally learning and engaging in collective crop sales of the agribusinesses. They also referred to the value of the maternal and child health and nutrition care group training for helping them eat better and stay healthy.”20
There is also the reverse:
In addition to their watershed work, the community is also participating in VSL, health and nutrition, agribusiness, irrigation and conservation agriculture activities. “We use conservation agriculture for improved yield. Then the produce is sold and the proceeds from these sales is invested in VSL groups. Whenever it is the growing season, we also get money from VSL for farm inputs like fertilizer to use in the field…”
Finally, the “Lingoni outlier” may provide an interesting case study (again). Although WALA activity sequencing is a bit unclear, it appears that watershed treatments began in 2010/11, then stopped in 2011/12, only to begin again in 2012/13. This was the only watershed site that experienced a FFW hiatus. However, during the entirety of this period WALA’s non-watershed interventions continued. In fact, given the FFW hiatus, while the “Gang of Six” continued irrigation system development, it may have benefited the non-watershed interventions to have the community’s full attention. Then, in 2013/14, and post-WALA, when the irrigation system started functioning, the producer group, group marketing, VSL, care groups and other capacities contributed to accelerated take off. This may or may not have been the case for WALA’s impressive Lingoni results, but it may be that simplifying demands on community time and resources sets the stage for real and more sustainable take off when the time is right. (See the Majawa Site Visit report for another example of this. In 2012/13, near WALA’s end, Majawa’s 320 beneficiaries implemented only 3 months of FFW watershed development on 9 hectares. Yet FGD respondent grasp of WALA non-watershed development activities, initiated in 2009, and activity synergies, was better than other sites with more substantial watershed development interventions.)
20 Empowering women through savings groups: A study from the Wellness and Agriculture for Life Advancement (WALA) Program, July 2014 https://www.crs.org/sites/default/files/tools-research/empowering-women-through-savings-groups.pdf
“SILC/VSL’s most significant contributions were to enable women and their households to satisfy basic needs for food, shelter, education, and clothing and to buy food that previously was difficult and caused households much stress.”
From: “Empowering Women Through Savings Groups” July 2014

14
To what degree are WALA watershed sites performing well on resiliency measures when compared to MVAC or non-WALA sites?
To rigorously compare WALA community resiliency to MVAC or non-WALA sites would require with or without analysis using randomized control groups or other analytical methods to compare similar WALA and non-WALA communities. The rapid assessment team could not employ these methods. Instead the team asked FGDs to describe WALA interventions and how those interventions affected food and cash crop production. Specifically, given the question’s reference to MVAC21 and non-WALA sites, we also asked them:
1) Did they experience drought during the 2015/16 El Niño? 2) If they experienced drought, did they need food aid during the 2015/16 El Niño? 3) If they needed food aid, was it less than what they needed during the 2012 drought? 4) Did they need less food aid than non-WALA households or communities during the 2015/16 El
Niño?
As shown in Table 4, nine of 24 WALA communities did not require food aid during the 2015/16 El Niño: Lingoni, Chikololere, Chigwirizano, Katunga, Makande, Kasabola, Namatemba, Malosa and Domasi. Six of them were some of the highest RRSS ranked communities with the number of WALA interventions ranging from 35 (Lingoni) to 25 (Kasabola). Two others ranked much lower. Namatemba (21 interventions) did not require food aid but non-WALA communities within the Namatemba area did. Namatemba’s low RRSS ranking and score is due to that watershed’s relatively flat topography. In Namatemba WALA focused on irrigation system development and less on watershed treatments. In Domasi, with the lowest RRSS rank (17), their lack of food aid requirements is attributed to an irrigation system improved post-WALA with Islamic Relief support. The Chikololere response is a bit confusing, a combination of no food aid due to no drought, non-WALA communities needing food aid, and the second highest RRSS ranking and score.22 Finally, this table shows that irrigation use probably reduce WALA watershed community food aid needs.
21 The assessment team was provided a workbook entitled “PROTRACTED RELIEF AND RECOVERY OPERATION (PRRO) 200692 TARGETED FOOD DISTRIBUTIONS: 2016/2017 MVAC RESPONSE DISTRIBUTION PLAN - FEBRUARY 2017”; There was no documentation provided to show whether this plan was actualized or explanatory notes. 22 This may be due to Chikololere continuing to receive WALA like support under NJIRA. Makande is similar. During WALA little progress was made on a gravity fed irrigation system. However, it appears that under UBALE some form of irrigation was developed. See site visit reports for more details.

15
As shown in Table 5, 10 of the 24 WALA communities visited needed less food aid during the 2015/16 El Niño than in past drought emergencies: Namikoko, Namilongo, Jerenje, Senjere, Muluma, Toleza, Namadidi, Mitumbira, Khoviwa and Makuta. At six of these sites non-WALA communities also needed food aid and in Namikoko, Jerenje and Khoviwa non-WALA households within the WALA area required food aid. Namikoko, Namilongo, Makuta, Jerenje, Mitumbira, Khoviwa and Senjere had high RRSS rankings having implemented 29, 27, 26, 24, 23, 23 and 22 WALA interventions respectively.
Table 4: El Niño Impact on WALA/Non-WALA Communities: No Food Aid
Watershed Site/Status
WALA HHs did
not need FA
Non-WALA
HHs needed
FA
Reason RRSS Rank (of17)
RRSS Score (of 37)
Lingoni
No drought; 1 35
Chikololere
No drought; watershed treatments (NJIRA?);
2 30
Chigwirizano
WALA interventions; 3 29
Katunga
Irrigation, increased farm production; 4 28
Makande
Irrigation (UBALE?), watershed
treatments, VSL, agri-bus, CA, leadership:
4 28
Kasabola
Irrigation, increased farm production and
income; 7 25
Namatemba
Irrigation; 11 21
Malosa No drought; 14 17
Domasi
Post WALA Islamic
Relief irrigation support;
17 10

16
23 Due to the difficult conditions of this site visit it the reasons for Khoviwa’s food aid status during the El Nino was unclear. See the site visit report for more details.
Table 5: El Niño Impact on WALA/Non-WALA Communities: Needed Less FA Than in the Past
Watershed Site/Status
WLA HHs
needed less FA than in the past
Non-WALA
HHs (within WALA area)
needed FA
Non-WALA Communities
needed FA Reason
RRSS Rank
(of 17)
RRSS Score (of 37)
Namikoko
Irrigation; 3 29
Namilongo
Watershed treatments; 5 27
Jerenje
Irrigation; 8 24
Senjere
Increased water table,
yield and income
insufficient, no irrigation
water;
10 22
Muluma
Watershed structures
not maintained,
VSL not enough;
12 20
Toleza
Watershed structures, CA helped adopters;
13 19
Namadidi
Weir failed, no irrigation,
watershed treatments
not maintained;
145 14
Mitumbira
Sold livestock and used VSL share outs to
buy food;
9 23
Khoviwa N/A23 9 23
Mukuta
Watershed treatments;
6 26

17
Irrigation figured in three of these four sites, two positively (Namikoko and Jerenje) and one negatively (Senjere cited a lack of irrigation water). For Muluma and Namadidi a lack of watershed treatment maintenance was noted and, for Namadidi, the failure of the WALA constructed weir meant the community had no access to irrigation. Mukuta ranked high on the RRSS and implemented 26 WALA interventions. However, the Mukuta agro-climate is hot and dry so watershed treatments were not widely adopted and helped a small number of villagers. Treatment integration with VSLs was identified as helping these households improve their livelihoods and resiliency.
As shown in Table 6 (below) four of the 24 WALA watershed sites needed food aid during the 2015/15 El Niño: Mbeluwa, Mbangu, Majawa and Natama. Although enjoying a high RRSS rank and implementing 27 WALA interventions only a few Mbeluwa households benefitted from irrigation. Mbeluwa households required food aid but not as much as non-WALA households. Mbangu also had a high RRSS Rank having implemented 26 WALA interventions. While Mbangu watershed treatments reduced flooding FGD respondents said they required a lot of water to recharge the water table. Thus, Mbangu residents were not resilient during the severe El Niño dryness. In Majawa VSL members were able to purchase food but still needed food aid and in Natama the WALA supported weir failed (see Photo 5 below). After having constructed the weir and conveyance canal and excavating the night reservoir the weir’s failure discouraged the villagers who left watershed treatments unmaintained. They also were not interested in participating in other WALA interventions (VSL, CA). For a more detailed description of each watershed site’s El Niño experience see Annex 2.
Table 6: El Niño Impact on WALA/Non-WALA Communities: Needed Food Aid
Watershed Site/Status
WALA HHs
needed FA
Non-WALA
HHs needed
FA
Reason RRSS Rank
(of 17)
RRSS Score (of 35)
Mbeluwa
Limited irrigation practiced; 5 27
Mbangu
Severe drought affected all communities;
watershed treatments reduced flood risk;
6 26
Nang’gombe
VSL money used to buy food; drought tolerant
crops planted; 6 26
Majawa
VSL money used to buy food; 11 21
Natama
WALA weir failure, watershed treatments
not maintained; 16 12
In conclusion, and using FGD respondent comments on past food aid needs to show resiliency, 16 of 20 WALA watershed development sites needed no food aid during the 2015/16 El Niño (8), or needed less food aid than during previous drought induced emergencies (8). Also, these 16 WALA communities needed less food aid than non-WALA households within the WALA intervention area (4) or non-WALA communities outside the WALA intervention area (6). Lingoni’s response that there was no drought

18
during the 2015/16 El Niño may have been due to the GOM’s determination that their successful irrigation scheme obviated their need for an emergency intervention24.
Finally, as was stated earlier, a majority of the 24 WALA watershed sites visited showed a lack of treatment maintenance. Whether this lack of maintenance was chronic or exemplified visit timing (during peak farm labor demand) is unclear. The 2014 WALA watershed report stated that “approximately half of the visited treatments were either in good working order or clearly maintained. The other half exhibited signs of degradation (mostly partially fallen dams or silted CCTs) or a clear lack of maintenance (very few). The most common critical issue encountered was lack of CCT maintenance, as some trenches were nearly filled or filling with silt”25. The report assessed the status of only six WALA watershed sites, albeit with 25% of treated watershed area, and soon after WALA’s completion. In any case given the role that watershed management plays in buttressing community resilience any shortfalls in sustainable watershed treatment maintenance, or even expansion, should reduce community resiliency.26
We may get a sense of watershed treatment maintenance labor availability from reviewing statistics on FFW and WALA group membership. The WALA FY 2013 Annual Results Review reported that:
“The disaggregated data continues to show successes in engaging women in economically and nutritionally productive and resilient activities through participation in VSL, agribusiness, small scale irrigation and livestock activities. Women make up 85%, 68%, 57% and 62% of these groups respectively.” 27
That same report shows that in FY 2012 of 7,934 FFW asset recipients, 4,532 were female (57%). Assuming that these FFW asset recipients worked on watershed management interventions, and given levels of female participation in multiple WALA groups, there may be an intersect that describes why watershed treatment maintenance is neglected. Females who assisted in watershed treatment construction simply don’t have the time to now maintain those structures. Also, given that they are reaping the majority of the individual benefits through their participation in VSL, agribusiness, small scale irrigation and livestock activities (with solid evidence that they share those benefits with their families) and the fact that males are engaged in estate employment, labor migration, and their own business and social endeavors, males may not be interested in maintaining watershed treatments. As a result, there is simply not enough labor to go around. CRS formally recognized female labor issues when it stated in this same ARR: “To facilitate women’s engagement in small scale irrigation, WALA promotes the gravity systems as the preferred option as they are less labor intensive…”
24 See Annex 3 for compiled FGD comments on food aid needs during the 2015/16 El Nino and Annex 4 for number of food aid recipients in TAs where WALA watershed site FGDs said no food aid was needed. 25 WATERSHED DEVELOPMENT IN MALAWI: A study from the Wellness and Agriculture for Life Advancement (WALA) Program: Final Report, July 2014. 26 For a comprehensive discussion of Malawi’s long history of failed large and small-scale irrigation schemes, and the reasons behind those failures, see “The Politics, Development and Problems of Small Irrigation Dams in Malawi: Experiences from Mzuzu ADD”, Bryson Gwiyani, Nkhoma, 2011. https://pdfs.semanticscholar.org/6ed7/e26acc6a015deedfaef3d2e5f7f62c540207.pdf 27 Catholic Relief Services (CRS)-MALAWI, FY 2012 Annual Results Report October 1 2012 to September 30 2013, Cooperative Agreement #: AID-FFP-A-09-00001
“Women’s triple burdens of domestic chores, productive tasks, and community social tasks increased with SILC/VSL participation and their increased business ventures. Almost no women and/or men mentioned men taking on greater domestic chores to relieve their wives of their ongoing and increased work activities.”
From: “Empowering Women Through Savings Groups” July 2014

19
Finally, if in fact females that participate in WALA groups are not part of the 4,532 females who received FFW assets in 2012, and the asset receiving females came from villages not directly benefitting from watershed treatments, then we have another problem. In several instances, when explaining why watershed management treatments were not maintained, FGD respondents stated that as the treatments were not constructed by the owners of the fields where the treatments were placed the field owners did not understand their value and simply reversed or destroyed them to regain arable land or to return to previously experienced rainfall runoff patterns.
CONCLUSIONS Effectively implemented watershed treatments slowed rainfall run-off velocity allowing more water to percolate into the soil. This reduced farm field erosion and soil loss, increased soil moisture, protected village and irrigation infrastructure, mitigated flash flooding, restored water tables and increased river flow volume and permanence. Coupled with agricultural and irrigation scheme development, agribusiness/group marketing, and VSL activities watershed development increased household food production and ability to purchase food and non-food items
This dynamic increased household and community resiliency. In some cases increased maize production reduced maize prices benefitting households who traditionally produce, consume, sell and buy maize at different times of the year. WALA also increased or improved housing assets and, through group participation and decision making, household and community social capital. Consistent across assessment FGDs respondents recognized WALA interventions as contributing to these improvements. Less consistently they also recognized GOM agricultural extension and LDF contributions and those from other external agencies.
Unfortunately, these watershed development driven benefits, though recognized by WALA hosting communities, did not motivate widespread and consistent watershed treatment maintenance or expansion. Those cases of maintenance and expansion were either outliers (Lingoni) or most likely influenced to some degree by WALA follow on projects (UBALE and Makande; NJIRA in Chikololere; Building Resilience through Productive Asset Activities in Namikoko). In several cases watershed treatments were reversed unintentionally (check dams disassembled by boys hunting rodents) or reversed by farmers looking to gain lost land surface or restore more “normal” water flows. This lack of maintenance, and treatment reversal, threatens resilience and may make future watershed development more difficult without significant compensation. Alternately, WALA follow on projects such as UBALE and NJIRA may provide communities with the time necessary to fully understand and internalize watershed development value, especially if effectively accompanied by the full range of WALA interventions.
It must be noted that the two stark WALA watershed and irrigation development failures in Natama and Namadidi must be avoided in the future and the current negative impacts redressed. Natama and Namadidi ranked 14 and 15 on the RRSS implementing
Photo 5. Natama Weir Failure

20
14 and 12 WALA interventions respectively. Natama was unique during the assessment in that FGD respondents scoffed at VSL involvement and when explaining why they required food aid during the El Niño stated that “watershed treatments are only valuable when it rains”. It may be that where successful WALA interventions built the community’s social capital these two catastrophic failures, after so much hard work by motivated villagers, set back social capital development.
Finally, VSLs appear to be at the core of WALA’s development of sustainable resilience. FGDs consistently lauded how helpful nearby savings and loan capacity was in building their farms, feeding their families, improving their homes, and educating their children. VSLs within WALA watershed development sites were not only continuing to operate but were also providing the ideas and examples for VSL self-starters in surrounding communities. VSL development methods, including locally sourced PSPs, led to participant and community feelings of empowerment, confidence, and enhanced planning and problem-solving ability.
VSL benefits are researched and documented in CRS publications referred to in this report. However, there is little objective research on VSLs or savings groups in Malawi. What research that has been done found that VSL loans and share outs are predominantly invested in fertilizer for maize and business expansion28.
RECOMMENDATIONS WALA was an integrated rural development project combining public works and beneficiary capacity building toward farm-based resiliency. It confronted the same sustainability challenges faced by past agricultural development projects that combined rural road rehabilitation and maintenance with technology development and dissemination, farmer group development, agribusiness capacity building, gender and M&E. As agricultural technology dissemination and output marketing costs determined whether project results endured, financing and institutionalizing quality farm to market road maintenance was those projects’ main sustainability challenge.29
WALA’s watershed treatments were public works much like rural roads. And while beneficiary communities recognize how these public works improve living standards and economic opportunities they refuse to contribute time and labor to maintenance without compensation. This understandable hesitancy to work for free dates back to colonial and early independence and will be hard to overcome30. However, good quality watershed management is seemingly the only way southern Malawi families will have a chance at resilience given future rainfall variability.
Recommendations that might address watershed treatment sustainability. They include:
28 Journal of Development Economics: Impact of Village Savings and Loan Associations: Evidence from a cluster randomized trial; Christopher Ksoll, Helene Bie Lilleor, Jonas Heith Lonborg, Ole Dahl Rasmussen, 2016. https://www.sciencedirect.com/science/article/pii/S0304387815001352 29 See USAID “Evaluation Report: Economic Aspects of the North Shaba Rural Development Project”, May 1982; USAID “North Shaba Rural Development Project, Zaire: Final Report: Technical Assistance Contract 1977-86; April 1987; USAID “Integrated Rural Development: Making it Work; Development Alternatives Inc. July, 1980; World Bank, “Rural Road Maintenance and Improvement”, March, 1994. 30“The Politics, Development and Problems of Small Irrigation Dams in Malawi: Experiences from Mzuzu ADD”, Bryson Gwiyani, Nkhoma, 2011. https://pdfs.semanticscholar.org/6ed7/e26acc6a015deedfaef3d2e5f7f62c540207.pdf

21
1. Encourage watershed treatment ownership: Review effectiveness of targeting FFW on the most vulnerable community members when undertaking watershed development investments. From quality and sustainability perspective it may be better for field owners to decide on and implement watershed treatments on their fields.
2. Plan longer watershed treatment investments to ensure sustainability. Discourage FFW watershed development investments implemented for less than three years. Ideally continue watershed development interventions for no less than five years. The longer the implementation period the more chance beneficiary communities have to learn how to ensure technical treatment quality and maintenance.
3. Improve quality of watershed treatments: Watershed treatment failure discourages community commitment to long term maintenance. Provide a higher level of engineering oversight when implementing watershed development investments. Plan watershed treatments so that they transform the entire watershed, from the higher elevations on down. Think about whether FFW is an effective resource for supporting technically proficient watershed development.
4. Develop district, TA and GVH leadership commitment to watershed development and treatment maintenance. Invest in research to better understand the political economy of watershed and irrigation scheme development. Sponsor study tours or other forms of watershed development leadership capacity building that address WALA watershed treatment maintenance shortfalls.
5. Ensure a supportive watershed management policy environment: Test whether current government and donor policies support sustainable watershed management. If so determine how to fine tune policy implementation. If not, determine what policy reforms are necessary for sustainable watershed management.
6. Address watershed treatment maintenance labor constraints. Develop methodologies for identifying watershed management winners and losers. As with the Lingoni case determine how to compensate upstream watershed managers for sustaining river flow with fees emanating from downstream watershed management/irrigation system beneficiaries.
7. Address watershed treatment maintenance labor constraints. Study WALA and other GoM, USAID and donor watershed management interventions to identify useful farmer developed innovations. The team observed a farmer planting vetiver to slow run off and farm field gullying. A nearby female farmer planned to transplant leguminous tree “volunteer saplings” throughout her field to restore soil nitrogen31. Effective farmer developed interventions may be more attractive to watershed communities.
8. Address watershed treatment maintenance labor constraints. Think about business models that employ rural youth or vulnerable (landless or land poor) household members in long-term watershed treatment maintenance (and ancillary activities) for a fee. Experiment with “environmental service fees” where communities tangibly benefitting from distant watershed development (through increased irrigation flows or reduced flash flooding) pay for treatment site maintenance.
9. Address watershed treatment maintenance labor constraints. Develop a better understanding of how WALA type group development (WMC, producer groups, marketing groups, VSL, care groups), FFW, and sustainable watershed treatment maintenance needs affect household labor availability and allocations.
By bringing savings and borrowing capacity closer to WALA recipients VSLs appeared to have significantly enhanced the impact of watershed development, irrigation, and other livelihood enhancing interventions. VSL related recommendations include:
31 Makuta site visit report.

22
1. Support research on VSLs: There is a dearth of objective VSL or rural savings group research in Malawi (and globally). While recognizing that FGD respondents consistently lauded VSL participation we really don’t know if group member households are financially better off. For example, what expenditures or investments did VSL group members sacrifice to begin and continue saving with the VSL? Did they tap money they were saving previously, liquidate assets (including livestock, a traditional savings vehicle), or divert farm income from other uses? What were the opportunity costs of those other uses?
2. Analyze the role of FFW or other asset building interventions on VSL capitalization and sustainability: VSLs are lauded for mobilizing grass roots resources and not depending on external capital (as do microfinance institutions) for their creation or sustainability. However, there is the possibility that WALA FFW investments indirectly capitalized VSLs by freeing up beneficiary farm income previously intended for food purchases; increasing household income through FFW bean and cooking oil sales; or being used to compensate VSL group member goods or services sales. If so this may have underpinned rapid VSL expansion, including to those FFW beneficiaries that did not participate in WALA supported VSL development. What are FFW-VSL linkages, if any, and what are the implications for VSL viability, FFW program design, and future food aid-based and cash based asset building interventions?
3. Ensure that USAID funded VSL support achieves intended results. The Mbangu FGD discussion included a detailed description of PSP certification. PSP certification was intended to ensure that VSLs are properly instituted and that members are able to protect their own and the group’s interests. The assessment team was unable to determine how widespread WALA PSP certification was. During the Chigwirizano FDG we learned that the PSP was the former agribusiness service provider who simply assumed the PSP role when the previous PSP left the community. A recent International Labor Organization document identified microfinance institution exploitation of VSL groups, lack of VSL member understanding of best practice procedures and safeguards, low capacity institutional support of VSL creation and development, and uncoordinated VSL support as threatening rural household benefits from VSL participation.32
4. At the appropriate time explore whether Malawi VSL members can benefit from links with formal financial institutions. The Banking on Change partnership between Barclays, CARE International UK and Plan UK is addressing financial exclusion. It is the first partnership between a global bank and NGOs to link informal Village Savings and Loans Associations to formal banking services. Building bridges between big banking and remote village communities, it points to a model for development whereby NGOs and the private sector together improve the lives of poor people and have positive results for business. 33.
To address agricultural productivity constraints determine how to better promulgate agroforestry as part of CA. Enhance maize stalk mulch and composting with nitrogen bearing tree leaves and limbs. Enhance CA with more direct ties to livestock husbandry (pig and chicken manure). Finally, seek ways to enhance MAIWD agricultural extension capacity.
32Extracts from the Full Report: Assessment of Social Protection Programmes and Costing of Policy Options Programme Specific Report: Village Savings and Loans, International Labor Organization/Irish AID, 2016. http://www.ilo.org/wcmsp5/groups/public/---africa/---ro-addis_ababa/---ilo-lusaka/documents/publication/wcms_493921.pdf 33Banking on Change: Breaking the Barriers to Financial Inclusion; https://www.home.barclays/content/dam/barclayspublic/docs/Citizenship/banking-on-change.pdf

23
ANNEX 1: RESILIENCY RANKING SCORE SHEET Site Name:
Visit Date:
Team Member:
Water Absorption Trench
Contour Control Trench
Marker Ridge Vetiver Grass
Half Moon Terrace
Check Dam Stone Bund Irrigation Tree Planting Fruit
Tree Planting Legume
Post WALA Maintenance
Post WALA Expansion
Producer Group
Marketing Group
Village Savings Loan
Watershed Management Committee
Water Users Group
Night Reservoir
Fish in Night Reservoir
Bee Keeping
Kitchen Garden
Private Service Provider
Agribusiness Service Provider
Paravet (Com Ani Health Worker)
Teaching WSC to Other Communities
VSL Invest Livestock
VSL Invest Business
VSL Invest Inputs
VSL Invest Education
VSL Invest Solar Panel
CA: Manure CA: Minimum Tillage
SASAKAWA CA: Mulching
Mixed Cropping
Fire Break Tree Planting Indigenous

24
ANNEX 2: SITE VISIT REPORTS SITE VISIT REPORT
Introduction Prior to WALA initiation in Chigwirizano (2009) farmers of Mkusa GVH had practiced watershed management by constructing check dams and contours. Chigwirizano watershed covers 175 hectares.
WALA started working with 150 FFW beneficiaries. WVI provided the community with the number of FFW participants for the watershed treatment work. The community provided a list and WVI used an explicit criterion (poor but with available labor) to select participants. Between 70-100 villagers working on the watershed had their fields in the watershed. There were also 20-40 households that had fields in the treated watershed but that did not participate in the FFW. WALA and the community started managing the first part of the watershed by reforestation (including fruit tree grafting), constructing stone bunds, CCTs, check dams, open trenches (OTs) and planting vetiver on marker ridges. The community reported that the following year they observed that there was more water flowing in Namikango River, there was reduced water running through their village and less gullying. WALA explained that the watershed management also raised the underground water table.
The MAIWD introduced the Lead Farmer (LF) concept. The LF would provide training in different topics to “follower farmers”. WALA wanted to approach extension differently. They introduced Farmer
34 These statistics were compiled by CRS in a spreadsheet entitled “CRS WALA Watershed Sites”. Some statistics may vary from what was reported during rapid assessment FGDs and KIIs. 35 With ties there are 17 possible rankings for the 24 watershed sites visited.
Chigwirizano Watershed34 District Thyolo Traditional Authority: Khwethemule GVH Nkusa Implementing Partner World Vision International Watershed Target/Treated Hectares 480 has targeted/141 has treated FFW Months/Beneficiaries 12 months/297 beneficiaries Watershed Treatments: Years Constructed, # Months Worked, # FFW Beneficiaries
2011/12, 6 months, 150 beneficiaries; 2012/13, 6 months, 147 beneficiaries;
Total FFW Oil/Beans (kgs) 6,547 kgs oil/26,730 kgs beans Total Meters Primary Structures 97,741 meters Check Dams/Trees Planted 6,620 check dams/3,375 trees planted Resiliency Score/Rank (37 points/15 ranks)35 29 points/3 rank (tied) Rapid Assessment Visit Date December 12, 2017

25
Extension Volunteers (FEV) instead of following the LF model. This caused confusion and the FEV approach was abandoned after WALA ended. Apparently, some of the impetus for introducing FEVs were that LF’s never forced farmer followers to attend training sessions. If a certain farmer was not interested in the topic they were free to not attend. However, WALA needed farmer followers (or producer group members) training attendance to attain producer group and technology adoption targets. So, FEV’s required the farmer group members attend all training sessions, whether interested or not, forcing farmers into groups parallel with the existing extension system.
The watershed committee members showed us a field where there had been a large gulley (see photo) now spanned by a check dam. The check dam was invisible under built up silt. By installing a check dam they reclaimed a two meter wide, 100-150 meter long slice of land now planted with maize and pumpkins. The villagers explained that they used check dams before WALA was initiated, as advised by GOM extensionists, but WALA spurred them to construct more, better quality check dams. The community continues to do check dams. There is an instance where farmers are fighting over the newly arable land created by a check dammed gulley. They will resolve their land conflict through recourse with the chief.
There was a CA demonstration plot across the road from the reclaimed “gully land”. The woman who cultivated the demonstration plot said that with maize stalk mulch, rows aligned 75cms apart, and two 50 kg bags of fertilizer she harvested 14 bags of maize the first season. The following season she used the same approach to harvest 18 bags of maize. She stated that the soil was noticeably healthier. The following season with 1.5 bags of 50 kg fertilizer she harvested 22 bags. She felt that CA increased land productivity. However, she (and other villagers) are limited by the amount of mulch required (she uses maize stalks from her other maize field to mulch the CA demonstration plot; other villagers burn their maize stalks for fuel). Nonetheless other LFs are replicating the CA demonstration plot. This woman farmer stated: “We did CA before WALA, did it during WALA and now we do it after WALA”.
These farmers participated in collective marketing and turned their marketing cluster into a cooperative. They sell produce and purchase inputs in bulk. The Private Service Provider (PSP) that supported VSLs in this village did not receive training and was not certified (per the Nsanje PSP). He inherited the role when the original PSP left for South Africa. The World Bank’s Support for Nutrition Improvement Component (SNIC) project also encouraged VSL creation and operation in this village.
Based on WALA lessons observed nearby villagers are implementing watershed improvements with support from the GOM’s Malawi Floods Recovery Project (MFRP). The MFRP pays for work with fertilizer and seed. According to FGD respondents the observable longer term watershed improvement results include less silt clouding the water in the valley’s river, more river volume and year round flow, more water for irrigation, healthier soil. They said that without the treatments their top soil would have washed away. They remarked that they see this difference when comparing to neighboring fields that did not employ watershed management treatments. Farmers in the Mwanga Watershed (which is the watershed across the river) irrigate their fields with river water that is more abundant due to Chigirizano watershed treatments implemented under WALA.

26
Methodology (After driving through extensive tea estates over muddy detours we arrived at the watershed area to meet three women and Afadi Alimane, the MAIWD extensionist. Communication confusion between the extensionist and his supervisor caused the FGD not to be assembled beforehand.) A Focus Group Discussion with Watershed Management Committee member participants (5 men, 2 women) was conducted and observations made to collect detailed information. Pictures of the watershed and irrigation scheme were taken by the assessment team.
Outputs WALAs completion did not stop community members from expanding and maintaining watershed treatments, especially check dams. A good number of people still practice CA and Sasakawa and their ridge spacing is still intact. A lot of people make their own manure as compared to before WALA.
The number of VSL groups has increased in both WALA and non-WALA sites. Although the trained PSPs left the village, some active community members took up the responsibility and VSLs keep on spreading out to other communities.
Farmers now buy and sell in groups. Buying in groups has increased farm profitability as it enables farmers to buy inputs at a lower price. Some groups have progressed and formed a cooperative.
Outcomes Drought in WALA community is now less severe than it was a few years back because of the watershed treatments. This is shown by the Namikango River which started filling up and running throughout the year. The reduction in siltation was also observed by the farmers in Chigwirizano watershed.
A big difference in soil fertility has been noticed compared to past years. There has been a reduction in soil erosion, filling up of gullies, their fields look healthier with high moisture retention rate. The yield for most farmers has increased. Maria Kamangeni used to harvest seven 50kg bags in her field before she started practicing CA and Sasakawa. After she adopted the technologies she started harvesting twenty-two 50kg bags of maize. She keeps some maize for home consumption and sells the surplus thereby increasing her income.
The number of people requiring aid has reduced over time. Most of the people that required aid in
2009 no longer needed aid during the 2015/16 El Niño. This showed great improvement and most farmers attributed this success to most of the WALA interventions.
Collective marketing and VSL groups have increased income of most households. Most farmers have started businesses, built houses with iron sheets, can afford to pay school fees for their children and buy inputs.

27
There has been an improvement in the health of pregnant women and children. Eating all the six food groups as trained by WALA has greatly improved the health of under five children hence reducing cases of malnutrition.
Conclusion The WALA project has brought resiliency to the community. The community seemed to appreciate the interventions that WALA initiated that brought tangible and positive results. Much of the success and resilience of the community members can be attributed to WALA investments.
Compared to communities without WALA and years of drought before watershed treatments they have more maize from their harvests and attribute that to increased soil moisture due to CCTS and stone bunds.
They also extolled the virtues of MCHN…cooking and nutrition instructions that have had a real impact on their children’s health. Through WALA MCHN teaching they learned to mix maize flour, groundnut flour, pumpkin leaves, eggs and hot water to make porridge for their children. They also learned to make donuts with wheat flour, yeast, and cassava pieces.
Marketing groups evolved to form a cooperative that buys fertilizer and sells harvest in bulk.
Because the watershed treated stream now runs throughout the year farms in the adjacent Mwanga Watershed area can irrigate cash crops, but not the Chigwirizano community. (We did not visit Mwanga because of severe rain. Chigwirizano was located in the midst of a huge tea estate.)
Sustainability Given these positive results it would appear at that this community has a good chance of implementing sustainable watershed management. Nonetheless, the community was aware that across the river the GOM’s Flood Recovery Project was paying villagers with seed and fertilizer for watershed management work.

28
SITE VISIT REPORT
Lingoni Watershed and Irrigation Scheme36
District Machinga Traditional Authority Chamba GVH Mitawa Implementing Partner Emmanuel International Watershed Target/Treated Hectares 3394 has targeted/135 has treated Total FFW Months/Beneficiaries 10 months/600 beneficiaries Watershed Treatments: Years Constructed, #Months Worked, #FFW Beneficiaries
2010/2011, 6 months, 350 beneficiaries 2012/13, 4 months, 250 beneficiaries
Total FFW Oil/Beans (kgs) 11,389 kgs oil/46,500 kgs beans Total Meters Primary Structures 7,855 meters Check Dams/Trees Planted 240 check dams/4,500 trees planted Resiliency Score/Rank (37 points/15 ranks)37 35 points/1 rank Rapid Assessment Visit Date December 7, 2017
Introduction Lingoni watershed development started in 2010. The 35 villages of Mitawa GVH were experiencing drought, rainwater run-off, soil erosion, gully erosion and deforestation. WALA started with community sensitization introducing watershed management, irrigation, VSLs, PSPs and paravets. Watershed development started with 269 FFW beneficiaries. In 2011 the number of workers dropped to 6. At this point the community started working on an irrigation weir and water conveyance canal for which FFW was not available. WALA supported weir, 1.6 km conveyance canal and night reservoir construction with technical assistance.
It took only 6 people to bring life to the Lingoni Irrigation Scheme. When asked what motivated them to work without FFW they gave credit to their visionary leader who also pastors a community church. The pastor made them believe that all things are possible. The Watershed Organization Trust (WORT) video of Indian farmers doing similar things complimented the pastor’s efforts.
Irrigation started in 2013. By 2014, when WALA ended, there were 10.8 hectares under irrigation. When the community members started seeing the fruits of irrigation and watershed development they joined in expanding the works.
The Lingoni watershed has 500 check dams, CCTs, 5440 WATs, vetiver, stone bunds and 134 ha of forest surrounded by firebreaks38. The forest is planted with both exotic and indigenous trees. The land under irrigation has now expanded to 30 hectares. However, the potential hectarage for the scheme is 58.9 hectares. The night reservoir irrigates 3 ha of fields.
36 These statistics were compiled by CRS in a spreadsheet entitled “CRS WALA Watershed Sites”. Some statistics may vary from what was reported during rapid assessment FGDs and KIIs. 37 With ties there are 17 possible rankings for the 24 watershed sites visited. 38 The CRS WALA Watershed Sites spreadsheet lists 240 check dams, 2,750 meters of WATs and 135 has of treated watershed area (of a total 3,394 has target).

29
The six people who worked on the irrigation structures formed a committee that established a MWK1000 membership fee for community members to join the irrigation scheme. The Lingoni Irrigation Scheme now has 105 members. Almost 80 percent of the members are women. They have integrated irrigation with fish farming in the constructed night reservoir, per WALA advice. The reservoir acts as a community fish farm. A few individuals have also started constructing their own fish ponds.
After realizing that the irrigation scheme’s long-term success would depend on a community living upriver near the Lingoni River source the watershed committee chairperson (and leader of the original “Lingoni Six”) went to the Chaone village to sensitize them on the importance of watershed management. The chairperson had recently been elected head of the Area Development Committee (ADC). As ADC head
he controlled how the GOM’s Local Development Fund (supported by a Malawi 4th Social Action Fund (MASAF 4) World Bank loan) was allocated. Chaone was a village of 5400 households living and farming along the Lingoni. Their cultivation the forest management practices were affecting Lingoni River flow. In 2016 the ADC head struck a deal with this community. Chaone village members signed an MOU with Mitawa community to ensure sustainability of Lingoni River water at the source. One part of the deal was that the LDF would pay 80 Choane villagers MWK600/day for watershed
development work 24 days, two times each year. The Lingoni Watershed Management Committee provided technical guidance. The upstream community constructed CCTs, WATs, and planted trees along the river. This work was deemed essential in increasing river volume and maintaining the Lingoni River’s year-round flow.
WALA also introduced home gardens, Village Savings and Loan (VSL) groups, group marketing, bee keeping, and the whole concept of agribusiness, trained PSPs and Community Animal Health Workers (CAHW or paravets).
Methodology Key informant interviews, a focus group discussion and observations were made to collect detailed information. The committee members of watershed and irrigation scheme were present at the site. Pictures of the watershed and irrigation scheme were also taken by the assessment team.
Output As farmers have seen the watershed management benefits the number of CCTs, stone bunds, WATs, check dams and trees have increased from the time WALA project ended. The community maintains the structures established during WALA and they keep expanding watershed treatments. The community’s water table has increased. The community operates a tree and vetiver nursery and the forest has been regenerated and additional trees planted in bare parts of the forest. The government had previously returned ownership of the forest to the community for management by watershed committee. The forest is called Chikala Forest Reserve and sits on Chikala Hill. The community polices the forest to prevent grazing, burning, wood cutting and charcoal making. The WATs, CCTs, check dams, stone bunds and vetiver grass have slowed down run-off rain water, increased water infiltration and significantly reduced soil erosion. A number of deep gullies have now filled up with soil due to check dam construction. The

30
committee has handed over CCTs and check dams to land owners to manage. The committee maintains a supervisory role.
The number of farm families doing fish farming has increased. Some farmers own personal fish ponds. They also use water from the ponds to irrigate their crops.
The number of VSL groups in the community has increased in WALA and non-WALA sites. This has increased savings and access to credit within communities.
Home gardens have increased the availability of relish at household level. Several households have maintained home gardens and this has increased access to nutritious vegetables. This is made possible by irrigation. In addition, irrigated maize was being multi-cropped, planted in combination with groundnuts, cassava, sweet potatoes, beans, pumpkins and in some cases pigeon pea. This mitigates risk (in this case maize was being attacked by army worms) ensuring that if maize fails there is still something to harvest.
Outcome The increased water table has increased the farm yields for most farmers. The amount of food production has increased because irrigation scheme members can now grow maize and other food crops 2 to 3 times in a year. Droughts are no longer the talk and fear of the community. The filled-up gullies have been turned into productive land, further increasing crop production. Farmers of this community are food secure and they do not receive any food aid.
Irrigation is not just a source of food, it is also a source of income. Most household incomes have increased because of irrigation farming. Farmers sell their crop surplus. Lingoni producer and marketing groups stagger their irrigated maize planting and harvests, so that the maize does not all mature at the same time, to avoid saturating the market and maximizing marketing returns. This was easy to see….some maize appeared two months in maturity while other had just been planted. Collective and sequenced marketing helps farmers sell their produce at good prices. However, in 2016/17 season, they did not sell collectively
due to fall army worms that destroyed most of their maize. Fish farming has also increased household incomes and is very profitable. Fish farmers raise Tilapia which has high demand.
The VSLs have increased income for most families. Easy credit access has resulted in expansion of small businesses. Some farmers have built houses with iron sheets from VSL shares, bought livestock, paid school fees, and purchased farm inputs. Most farmers in the community use money from VSLs to buy farm inputs which in return increases their yield, making them food secure. The community reported that they pay an appreciation fee to the PSPs for the assistance they render to VSL groups.
Home gardens, VSL groups, irrigation and the food preparation and recipes training the community received have also improved Maternal and Child Health and Nutrition (MCHN). Families can easily get relish from their home gardens. Due to the increased incomes, most farm families can afford to buy food of different food groups thereby improving the nutrition status of household members.

31
The Lingoni watershed provides indigenous fruits and medicinal plants to the community. We observed a river crab captured by a man when we visited the dam site. In 2014, after Lingoni’s first successful irrigation season, the PVC pipe that constituted the initial link between the dam and the conveyance canal had to be dug up and reset as it was not draining or had become plugged.
Conclusion The El Niño did not affect the community since there was no drought in Mitawa. None of the farmers in the community received food aid. The only problem which they faced in their maize fields was army worms. Some farmers planted several times because of the army worms.
Much of the success and resilience of the community members can be attributed to WALA investments since most of the farmers were able to bounce back after a shock because of irrigation and VSL groups. Farmers rely on irrigation if their crops do not perform well under rain fed production and they can buy food from the money the save at the VSLs or even sell livestock they bought with irrigation and VSL money.
As seen, there is a synergy among the interventions. Watershed development, including WALA inspired upstream watershed treatments that took place post-WALA (in Chaone), will protect the successful irrigation scheme by increasing and maintaining Lingoni River volume. Irrigation is a source of income to most of the farmers. When they get something from irrigation they bank it at the VSLs and at the end of the year they get their shares and buy farm inputs and other things. Increased farm yields and home gardens are improving the community’s health.
Sustainability The initiation of a MKW1000 irrigation scheme membership fee exemplifies how irrigation users can self-finance system repairs and upgrades over the medium to long term. Given the profitability of irrigated farming it would seem that irrigation beneficiaries would not hesitate to maintain, or even increase, some form of user fee. Also, the gravity fed Lingoni system should not require a high level of capital investment. Instead maintenance and expansion would require labor that would appear readily available after the “Lingoni Six” proved the benefits that commitment and diligence to irrigation system development can provide. Perhaps the most significant sustainability challenge faced by Lingoni is maintaining Chaone villager watershed treatment expansion and maintenance. The LDF offers one source of financing for Chaone. Irrigation scheme membership fees may offer another source.

32
SITE VISIT REPORT
Makande Watershed39 District Chikwawa Traditional Authority: Kasisi GVH Chivala Implementing Partner Chikwawa Diocese Watershed Target/Treated Hectares 285 has targeted/217 has treated FFW Months/Beneficiaries 18 months/1,895 beneficiaries Watershed Treatments: Years Constructed, # Months Worked, # FFW Beneficiaries
2010/2011, 6 months, 812 beneficiaries; 2011/12, 6 months, 583 beneficiaries; 2012/13, 6 months, 500 beneficiaries;
Total FFW Oil/Beans (kgs) 41,773 kgs oil/170,550 kgs beans Total Meters Primary Structures 205,924 meters Check Dams/Trees Planted 5,861check dams/22,763 trees planted Resiliency Score/Rank (37 points/15 ranks)40 28 points/4 rank Rapid Assessment Visit Date December 8, 2017
Introduction
WALA initiated Makande watershed management in 2010. The village had experienced soil erosion, river drying, and deforestation due to charcoal production. This led to unproductive farming that failed to provide sufficient household food between harvests. WALA’s arrival came as a relief to the village. It gave villagers hope for a better life.
WALA approached the Chavala Group Village Head (GVH), which has 23 villages. Makande village was chosen as an example for other villages. WALA first sensitized local leaders about the project then the villagers. A Watershed Management Committee (WMC) was formed with a technical sub-committee to overlook project progress.
Watershed activities were carried out through FFW: twenty days of work compensated with 4 litres of cooking oil and 15 kgs of beans/worker. WMC members were actively involved in FFW targeting, questioning the value of only employing vulnerable households and insisting that the chief’s family members be involved as “…he must understand exactly what is going on in his village and, if the issues arise during the work he will be better able to resolve conflicts”. The FGD claimed that they worked for four months without pay awaiting WALA FFW deliveries
39 These statistics were compiled by CRS in a spreadsheet entitled “CRS WALA Watershed Sites”. Some statistics may vary from what was reported during rapid assessment FGDs and KIIs. 40 With ties there are 17 possible rankings for the 24 watershed sites visited.

33
“because they wanted to see the results”. In 2014, the WALA project ended. Their current expansion at another watershed feeding another river, under UBALE, is called “WALA #2”.
Throughout the project the WMC employed the Participatory Net Planning approach to organize and motivate village members and resolve issues. FGD discussants pointed out that WALA used “participatory planning” which equipped the participants for “Life After WALA”.
When asked where watershed management labor came from (given Makande’s massive watershed treatment structures) there were two answers. One woman answered that they were sitting idle without good ideas on what to do next. WALA gave them those ideas. Another man stated that labor is provided for
watershed management when not needed for farming, such as during the dry season or after the completion of rainy season farm work.
One WALA staff member handled VSL, agribusiness and producer group support as sufficient technical staff to handle these activities individually, and who would live in Makande, could not be found. He is now doing the same for UBALE. GOM extensionists would also not live in Makande. (There seemed to be a lot of investment taking place in the town including health facilities and a new church.)
Methodology There were 20 FGD participants: 10 men and 10 women. Participants were mostly WMC members. FGD respondents began by explaining their individual parts in the project. Five members of the committee accompanied the assessment team around the watershed to observe and obtain additional information. The assessment team took pictures of watershed management structures. The three person (men) technical sub-committee led the explanations.
Outputs
During WALA the watershed covered 221 hectares. Watershed treatments included Water Absorption Trenches (WAT), Continuous Contour Trenches (CCT), check dams, stone bunds, and open trenches. According to FGD respondents there were 275 CCT/stone bunds constructed covering 101,905m; 531 open trenches covering 95,195m; 3,836 check dams covering 14,791m; and 19 WATs covering 770m. After WALA ended the villagers increased the watershed by 50 hectares. They constructed eight new stone bunds covering 30,970m; 250
open trenches covering 101,125m; 1,250 check dams covering 10,690m; and, 10 WATs covering 565m. UBALE support is referred to as “WALA II”.
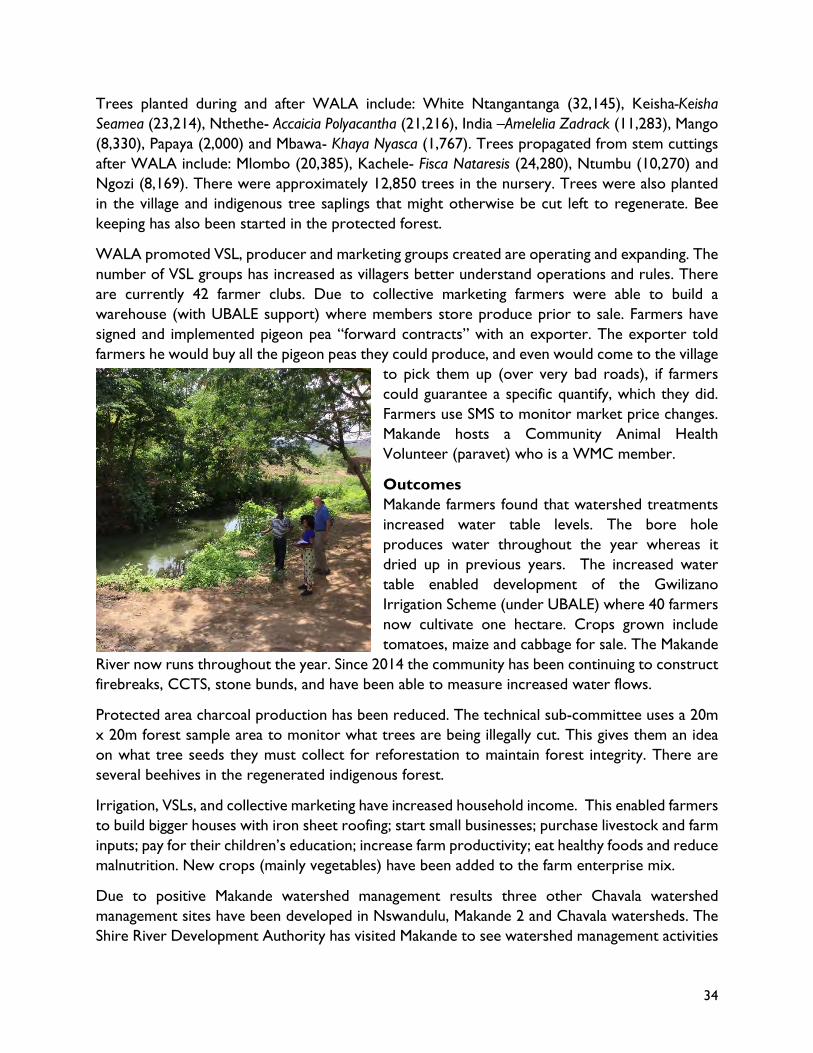
34
Trees planted during and after WALA include: White Ntangantanga (32,145), Keisha-Keisha Seamea (23,214), Nthethe- Accaicia Polyacantha (21,216), India –Amelelia Zadrack (11,283), Mango (8,330), Papaya (2,000) and Mbawa- Khaya Nyasca (1,767). Trees propagated from stem cuttings after WALA include: Mlombo (20,385), Kachele- Fisca Nataresis (24,280), Ntumbu (10,270) and Ngozi (8,169). There were approximately 12,850 trees in the nursery. Trees were also planted in the village and indigenous tree saplings that might otherwise be cut left to regenerate. Bee keeping has also been started in the protected forest.
WALA promoted VSL, producer and marketing groups created are operating and expanding. The number of VSL groups has increased as villagers better understand operations and rules. There are currently 42 farmer clubs. Due to collective marketing farmers were able to build a warehouse (with UBALE support) where members store produce prior to sale. Farmers have signed and implemented pigeon pea “forward contracts” with an exporter. The exporter told farmers he would buy all the pigeon peas they could produce, and even would come to the village
to pick them up (over very bad roads), if farmers could guarantee a specific quantify, which they did. Farmers use SMS to monitor market price changes. Makande hosts a Community Animal Health Volunteer (paravet) who is a WMC member.
Outcomes Makande farmers found that watershed treatments increased water table levels. The bore hole produces water throughout the year whereas it dried up in previous years. The increased water table enabled development of the Gwilizano Irrigation Scheme (under UBALE) where 40 farmers now cultivate one hectare. Crops grown include tomatoes, maize and cabbage for sale. The Makande
River now runs throughout the year. Since 2014 the community has been continuing to construct firebreaks, CCTS, stone bunds, and have been able to measure increased water flows.
Protected area charcoal production has been reduced. The technical sub-committee uses a 20m x 20m forest sample area to monitor what trees are being illegally cut. This gives them an idea on what tree seeds they must collect for reforestation to maintain forest integrity. There are several beehives in the regenerated indigenous forest.
Irrigation, VSLs, and collective marketing have increased household income. This enabled farmers to build bigger houses with iron sheet roofing; start small businesses; purchase livestock and farm inputs; pay for their children’s education; increase farm productivity; eat healthy foods and reduce malnutrition. New crops (mainly vegetables) have been added to the farm enterprise mix.
Due to positive Makande watershed management results three other Chavala watershed management sites have been developed in Nswandulu, Makande 2 and Chavala watersheds. The Shire River Development Authority has visited Makande to see watershed management activities

35
as have Emmanuel International and SAVE. Community members have been hired by Total Land Care to train other districts and they are about to publish a DVD they will be selling nation-wide.
There were eight FGD participants who had purchased solar panels (perhaps not a unique WALA output given other visible economic activities in Makande). They said that VSLs enabled solar panel buying as well as increased farm income due to pigeon pea sales (they had begun producing pigeon peas prior to WALA). Solar panels are used for phone charging, powering stereos, lighting.
Conclusion WALA watershed management has been a success. Makande farmers are really proud of the work and highly motivated to continue protecting and maintaining the watershed. Makande watershed is one of the most impressive watersheds and it has produced impressive results. This may be due to project implementation that lasted three years. The capacity building that Makande villagers received made increase their resilience to many shocks including the 2015/16 El Niño. Most households were able to withstand the drought without food aid due to the irrigation system that was developed post WALA; watershed management structures; and the integration of the VSLs, agribusiness trainings and some conservation agriculture technologies. To a large extent, their success can be attributed to the leadership, good relationship and collaboration among village members. The community described itself as more resilient this way: “Government does not intervene when the community asks for assistance due to weather. Instead the government responds that hurting villagers should get involved with WALA activities.”
Sustainability The Makande community and WALA experience exhibits many signs of resilience sustainability: technical competence in watershed treatment construction, strong local leadership with evident organizational capacity, local group marketing capacity and initiative, VSL capacity, and TA commitment to watershed management. However, it is not clear at this time what the UBALE impact is on what the assessment team learned and observed.

36
SITE VISIT REPORT
Namadidi Watershed and Irrigation Scheme41 District Zombe Traditional Authority: Mlumbe GVH Kaunde Implementing Partner Save the Children Watershed Target/Treated Hectares 25 has targeted/12 has treated FFW Months/Beneficiaries 9 months/283 beneficiaries Watershed Treatments: Years Constructed, # Months Worked, # FFW Beneficiaries
2011/12, 6 months, 208 beneficiaries; 2012/13, 3 months, 75 beneficiaries;
Total FFW Oil/Beans (kgs) 5,412 kgs oil/22,095 kgs beans Total Meters Primary Structures 8,670 meters Check Dams/Trees Planted 115 check dams/9,453 trees planted Resiliency Score/Rank (37 points/17 ranks)42 29 points/13 rank Rapid Assessment Visit Date December 15, 2017
Introduction
The Namadidi watershed and irrigation scheme was established in 2011 in the Lingoni River watershed. FGD participants stated that they had irrigated their fields previously but that WALA made them more organized. WALA and 220 FFW beneficiaries initiated watershed development with reforestation, constructing CCTs, WATs, swales, check dams and planting vetiver on marker ridges.
People from several communities were mobilized to work on the watershed and receive FFW. Not all workers involved in constructing watershed structures benefitted from watershed improvements. Shovels, panga knives, measuring tapes, sprayers, cement, watering canes and treadle pumps were provided by WALA during construction. The irrigation scheme could potentially cover an area of about 4.5 hectares. The watershed is 22 hectares.
When WALA came the community was irrigating a small area using watering cans. WALA suggested that the watering cans be replaced with a gravity irrigation system. The villagers were excited and 64 FFW beneficiaries undertook dam construction from March to December 2012. The dam was constructed by blocking the Lingoni River with an earthen bank. Unfortunately, the
41 These statistics were compiled by CRS in a spreadsheet entitled “CRS WALA Watershed Sites”. Some statistics may vary from what was reported during rapid assessment FGDs and KIIs. 42 With ties there are 17 possible rankings for the 24 watershed sites visited.

37
dam was destroyed by flashfloods during the 2012/13 rainy season. It was rebuilt in 2013 but failed again. After the second failure the farmers abandoned the work.
WALA also supported construction of a water conveyance canal from the dam to the irrigation scheme and the sinking of 8 boreholes. The dam’s failure caused 4 of the boreholes to fill with silt, leaving 4 boreholes in use. Seven Treadle Pumps were provided to scheme members for use while the dam filled with water. FGD participants reported that rats had damaged the Treadle Pump intake and outlet hoses. Treadle Pumps are no longer in use and farmers still irrigate a small area using watering cans.
WALA introduced better methods of farming like Sasakawa, ridge realignment, plant spacing, manure making and CA. WALA did not introduce VSLs in the community although most members of the watershed committee are in VSL groups.
Methodology Focus group discussion with Watershed Management Committee members and observations at the site were made to collect detailed information. Pictures of the watershed and irrigation scheme were taken by the assessment team.
Output Mostly all watershed structures are not maintained. Most smallholder farmers removed the check dams. However, in a few fields vetiver grass growing on contour bunds could be observed. The CCTs in the farmers’ fields were filled with soil. Several WALA supported WATs were observed on a commercial farmer’s well vegetated and large landholding adjacent to the Namadidi watershed area.
Watershed treatment construction involved farmers from other villages who did not own land in the watershed but who fit the FFW targeting criteria. So, farmers that did not participate in construction had watershed treatments implemented on their land. Perhaps as a result they destroyed the structures as they were not properly sensitized on watershed management importance. This was explained by an FGD participant: “When SAVE sensitized and mobilized households during the initial stages of WALA they did not promise that FFW would be provided in return for watershed treatment work. Thus, when SAVE returned to sign up workers the farmers who owned the fields did not volunteer. Only the vulnerable from other villages volunteered.”
Most farmers, especially those in the irrigation scheme committee, are still practicing good crop husbandry practices that they learnt during WALA project. These include planting one plant per planting station, manure making, making ridges across the slope, intercropping maize with legumes, ridge spacing of 75 cm apart and plant spacing of 25 cm apart. They reported that they have continued these practices because of the positive effect on crop yields and hence household food availability and incomes. Villagers explained that compost making requires filling a 1 m x 2

38
m x 1 m hole with cut maize stalks, wood ash, fresh grass, water, maize bran, chicken liter, and gliricidia leaves then covering with soil to create a warm environment for decomposition. With this approach the compost is be ready after one month. Another compost approach was to heap all of these ingredients on the field, without a hole, and cover them with termite mound dirt to speed heating and decomposition.
The villagers operated as a group for the irrigation scheme. Individuals who owned irrigated land would share it with irrigation scheme members. After the irrigated dry season harvest the land used by non-owners was returned to the owners for rainy season cultivation. To pay for dry season land the “renters” prepared the land for rainy season planting. All FGD participants owned land downstream from the failed dam.
One FGD respondent stated that she was a PTA member who lobbies for VSL share outs to be used in support of children’s education. Another woman bought a solar panel for 19,000kw and sells phone charging services. FGD participants stated that VSL contributions were 500 MKW/week with the length of savings before pay out varying by member. One FGD participant’s wife came out with 200,000 MKWs, including contribution and investment, for the December to December period. One woman who was trained in CA abandoned it. She explained that CA requires keeping maize stalks on the field and this exacerbates army worm infestation so she burned the stalks.
Outcomes Due to the unmaintained watershed and irrigation structures, soil and gully erosion due to rainwater runoff are still major problems. During the El Niño, most of the farmers in the community were affected and reported that they required food aid. However, farmers who followed good agricultural practices were able to harvest some maize during El Niño.
Conclusion Based on the discussion and observation the community is not resilient. Due to dam/irrigation system failure and unmaintained watershed treatments most community members are still vulnerable to adverse weather. To an extent their continued use of improved farming practices will reduce this vulnerability.
Sustainability WALA’s Namadidi intervention cannot be described as resulting in sustainable resilience.

39
SITE VISIT REPORT
Introduction Kambwiri village and surrounding farmers faced frequent drought, soil erosion, gully erosion, and the drying up of the stream used for irrigation and borehole. When WALA introduced watershed management in 2009 the community members welcomed the intervention. The community reported that WALA came to their community and suggested an intervention that would improve their land productivity and result in more water in their irrigation system. WALA and the community started watershed development with reforestation and constructing stone bunds, half-moon terraces (shown here), check dams and marker ridges planted with vetiver grass.
The community reported that the year following these treatments they observed more water in their stream for irrigation, reduced water running through their village and less gullying. The community’s borehole had more water and did not run dry. They now understood why WALA explained that watershed management could recharge the underground water table. They were motivated to expand their watershed treatment structures.
Irrigation was not a new idea for Kambwiri and nearby village households. What was new was how WALA helped the farmers organize. In 2010 improved villager organization resulted in
43 These statistics were compiled by CRS in a spreadsheet entitled “CRS WALA Watershed Sites”. Some statistics may vary from what was reported during rapid assessment FGDs and KIIs. 44 With ties there are 17 possible rankings for the 24 watershed sites visited.
Namikoko Watershed and Irrigation Scheme43 District Zombe Traditional Authority: Mlumbe GVH Kaunde Implementing Partner Save the Children Watershed Target/Treated Hectares 212 has targeted/32 has treated FFW Months/Beneficiaries 5 months/1905 beneficiaries Watershed Treatments: Years Constructed, # Months Worked, # FFW Beneficiaries
2011/12, 1 month, 1720 beneficiaries; 2012/13, 4 months, 185 beneficiaries;
Total FFW Oil/Beans (kgs) 9,038 kgs oil/36,900 kgs beans Check Dams/Trees Planted 974 check dams/7,315 trees planted Total Meters Primary Structures 64,230 meters Resiliency Score/Rank (37 points/17 ranks)44 29 points/3 rank tied) Rapid Assessment Visit Date December 6, 2017

40
creation of the Namikoko Irrigation Scheme. The scheme is run by 55 members (41 female and 14 male) and located in three villages. It covers 9 hectares. For the scheme, and in addition to the watershed management treatments, WALA supported construction of a water receiving/distribution box, conveyance canals and a night reservoir.
Part of the irrigation scheme land belongs to a non-WALA beneficiary. Scheme members rent this land for winter (dry season) cropping and return it to the owner for rainy F
Focus Group Discussions (FGD) and observations were made to collect detailed information. Namiko watershed management and irrigation scheme committee members participated. Pictures of the watershed and irrigation scheme were taken by the assessment team.
Outputs Namikoko watershed currently has CCTs, WATs, half-moon terraces, marker ridges, check dams, vetiver grass and indigenous and exotic trees. Since WALA left in 2014, the community has expanded watershed treatments and maintained old structures with support from USAID’s 2016/17 Productive Assets Activities. The community banned marginal land farming when expanding the watershed.
WALA helped the community initiate VSL groups. Now several VSL groups are present in the community and in surrounding non-WALA sites. WALA trained PSPs who train VSL groups. The PSPs help members calculate VSL financial payouts at year’s end. The PSPs are given money by the groups they help as a token of appreciation. WALA also assisted the community in initiating farming as a business and collective marketing.
The community reported to have sustained the activities that were started under WALA with an approach they named the 3Cs: Coordination, Collaboration and Co-location.
Outcomes The Namikoko Irrigation Scheme’s objective is to achieve food security and poverty alleviation through irrigation. Scheme members appeared very motivated by WALA interventions.
Farm income has increased due to the irrigation scheme. Beneficiaries have constructed houses with burnt bricks and iron sheets from the money realized from irrigated farming. Other households have purchased livestock, solar panels and payed their children’s school fees, something they couldn’t afford before WALA.
Irrigation scheme members produce more maize and harvest increased yields. They said they are more food secure and needed less food aid during the El Niño drought than in the past. The El

41
Niño did not have much impact on the community compared to non-WALA communities. However, a few vulnerable people in the community received aid. Irrigation allowed two or three harvests and made most farmers resilient to the drought.
Some farmers invest money they earn from irrigation in VSL groups and VSLs have increased the income of most households in Kambwiri village. Beatrice Chinthenga, a single mother, built a house with iron sheet roofing with VSL loans and payouts. She reported that before joining a VSL life was very difficult. She had nowhere to borrow money. She was not able to buy farm inputs and was living in a grass thatched house. Things turned around for her when she joined the VSL group. She now has access to credit and has started and operates a small-scale business with VSL loans. She also uses VSL proceeds to buy farm inputs. In 2017, she banked MKW20,000 in the VSL and received MKW50,000 in shares at year’s end. Often, when banking MK20,000 members receive from MK50,000 to MK70,000 in shares after one year.
Conclusion The WALA project has increased this community’s resiliency. The community appreciated WALA interventions that brought tangible and positive results. Namikoko Irrigation Scheme members were able to improve their households’ livelihoods and food security because of the irrigation scheme and VSL groups.
Sustainability Whether Namikoko watershed treatments will be maintained, or even expanded, was impossible for the rapid assessment team to ascertain given that the community is receiving assistance from USAID’s 2016/17 Productive Assets Activity in support of similar activities. The fact that WMC members talked about “Coordination, Collaboration and Co-Location” as crucial to their continued commitment to WALA inspired activities is a step in the sustainability direction. Nonetheless, whether WALA interventions have led to sustainable behavior change can only be determined if the affected communities are forced to rely on their own capacities over time.
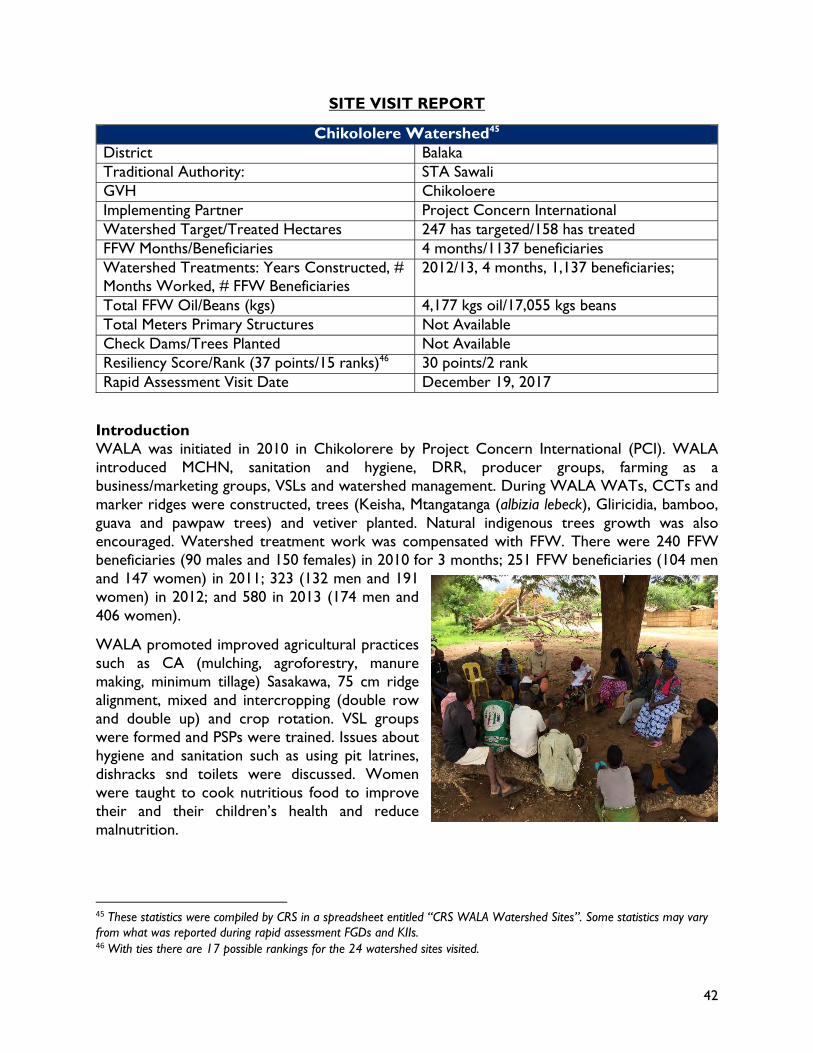
42
SITE VISIT REPORT
Chikololere Watershed45 District Balaka Traditional Authority: STA Sawali GVH Chikoloere Implementing Partner Project Concern International Watershed Target/Treated Hectares 247 has targeted/158 has treated FFW Months/Beneficiaries 4 months/1137 beneficiaries Watershed Treatments: Years Constructed, # Months Worked, # FFW Beneficiaries
2012/13, 4 months, 1,137 beneficiaries;
Total FFW Oil/Beans (kgs) 4,177 kgs oil/17,055 kgs beans Total Meters Primary Structures Not Available Check Dams/Trees Planted Not Available Resiliency Score/Rank (37 points/15 ranks)46 30 points/2 rank Rapid Assessment Visit Date December 19, 2017
Introduction WALA was initiated in 2010 in Chikolorere by Project Concern International (PCI). WALA introduced MCHN, sanitation and hygiene, DRR, producer groups, farming as a business/marketing groups, VSLs and watershed management. During WALA WATs, CCTs and marker ridges were constructed, trees (Keisha, Mtangatanga (albizia lebeck), Gliricidia, bamboo, guava and pawpaw trees) and vetiver planted. Natural indigenous trees growth was also encouraged. Watershed treatment work was compensated with FFW. There were 240 FFW beneficiaries (90 males and 150 females) in 2010 for 3 months; 251 FFW beneficiaries (104 men and 147 women) in 2011; 323 (132 men and 191 women) in 2012; and 580 in 2013 (174 men and 406 women).
WALA promoted improved agricultural practices such as CA (mulching, agroforestry, manure making, minimum tillage) Sasakawa, 75 cm ridge alignment, mixed and intercropping (double row and double up) and crop rotation. VSL groups were formed and PSPs were trained. Issues about hygiene and sanitation such as using pit latrines, dishracks snd toilets were discussed. Women were taught to cook nutritious food to improve their and their children’s health and reduce malnutrition.
45 These statistics were compiled by CRS in a spreadsheet entitled “CRS WALA Watershed Sites”. Some statistics may vary from what was reported during rapid assessment FGDs and KIIs. 46 With ties there are 17 possible rankings for the 24 watershed sites visited.

43
The watershed area covered by WALA before it came to an end in 2014 is 247 hectares. UBALE began shortly after WALA ended.
Methodology The Chikololere watershed visit was conducted by the assessment team with assistance from CRS who provided FGD organization, translation, and technical support. There were 20 FGD respondents (12 men and 8 women). They were WMC members. Several WMC members accompanied the assessment team to the watershed to observe, answer additional questions and take photos. USAID logoed project vehicles drove in and out of the FGD area during discussions. FGD respondents stated that the USAID project IMPACT and UBALE were being implemented in this area. The villagers displayed and explained impressive vinyl maps of the village, watershed and disasters or hazards.
Outputs Chikololere WALA beneficiaries have maintained and/or expanded most watershed treatments (WATs, CCTs, vertiver grass). FGD respondents stated that CCTS induced forest regeneration and increased the water table resulting in more water for household use and irrigation. Villagers increased the treated watershed area by 10 hectares after WALA. The participants showed us a nice laid out tree, vetiver and bamboo nursery.
There has been an increase in the number of farmers practicing CA and agroforestry. Some farmers have been hesitant to adopt CA because of bushfires and termites. FGD respondents stated that the production of their main cash crop, cotton, had increased due to 75 cm ridge realignment. They also use box ridges, an improved legume/cotton/cereal crop rotation and intercrop cowpeas and pigeon peas.
Chikololere farmers have taught communities in other GVHs. FFW workers came from other villages and upon returning to their home village implemented things they had observed in WALA villages. So far two non-WALA watersheds have been established with help from Chikololere
farmers. These two watersheds are Kadyalunda, covering 50 hectares, and Nsamanyada, covering 150 hectares.
There are now more than 100 VSL groups in this GVH’s six villages. VSLs have spread to other communities as well. VSL loans and share outs are used for school fees, livestock, clothing, paying farm labor, house improvements and small businesses. VSLs have increased participant access to credit and savings services.
Collective marketing is still practiced. Crops sold collectively include tomatoes, cowpeas and pigeon

44
peas. Farmers are able to find markets but even with group marketing complained of low prices.
Outcomes Balaka is flat and dry. FGD respondents stated that watershed treatments captured substantial amounts of rainwater and increased soil moisture. Combined with conservation agriculture, box ridges, Sasakawa and ridge alignment participating farmers obtained improved yields on land they had farmed for years.
As a result of an increased water table community boreholes supply households for a longer period than prior to the watershed treatments. The water table increase has also resulted in more river water available for irrigation.
The increase in yield has enable farmers to sell some of their produce and increase their income. Due to this most farmers don’t sell food or livestock to acquire money for other needs. They feel they are more food secure. Some of the extra farm income is saved in VSLs.
Women groups formed under the MCHN component were taught to cook nutritious food and this has led to the reduction of malnutrition.
FGD respondents said that they withstood the 2015/16 El Nino without food aid and are more resilient now than they were during previous droughts. They stated that CCTs, ridge alignment, vetiver grass, and agroforestry increased food production even during the El Nino event. They claimed they are better off than non-WALA communities and the difference between them is indisputable.
Conclusion Chikololere villagers are determined and dedicated to maintaining and expanding their watershed. They obviously appreciated how USAID projects can positively affect their and their children’s lives. It was raining heavily when we visited the watershed treatments that included check dams and CCTS. Also, we observe a newly dug WAT near the road but within a densely vegetated “regenerated forest”. Not having seen this area during WALA implementation one might ask why a WAT was constructed here, along with accompanying stone bunds, when the topography is relative flat and there is such an abundance of grasses, shrubs and trees. The issue of treatment placement notwithstanding it was impossible for the rapid assessment team to distinguish between WALA, IMPACT and UBALE achievements and results.

45
SITE VISIT REPORT
Domasi Watershed Scheme47 District Zombe Traditional Authority: Malemia GVH Mtogolo Implementing Partner Emmanuel International Watershed Target/Treated Hectares 566 has targeted/43 has treated FFW Months/Beneficiaries 8 months/500 beneficiaries Watershed Treatments: Years Constructed, # Months Worked, # FFW Beneficiaries
2011/12, 4 months, 250 beneficiaries; 2012/13, 4 months, 250 beneficiaries;
Total FFW Oil/Beans (kgs) 5,412 kgs oil/22,095 kgs beans Total Meters Primary Structures 43,700 meters Check Dams/Trees Planted 649 check dams/6,500 trees planted Resiliency Score/Rank (37 points/15 ranks)48 10 points/17 rank Rapid Assessment Visit Date December 7 & 16 2017 (split FGD &
observation)
Introduction WALA watershed development was initiated in Domasi in 2012 with 500 FFW beneficiaries from 3 GVHs: Minama, Mtwiche and Mtogolo. Beneficiaries were from child headed and female-headed families and other vulnerable groups (orphans, PLHIV). Beneficiaries earned 4 litres of cooking oil and 15 kilograms of beans for 20 days of work. Work continued for six months each year for two years. Watershed development included check dams, stone bunds, CCTs, and fruit tree planting. Not all the FFW recipients had fields in the watershed. The owners of the fields that were treated were registered and worked on the treatments. In 2014, when WALA stopped watershed development operations, Islamic Relief entered the area and helped the community to construct dams and fish ponds. Three dams were constructed for irrigation with the help of Islamic relief and the Local Development Fund (funded by the World Bank’s MASAF4).
Methodology The assessment team visited the Domasi watershed and met with the FGD on two separate days. One WMC (and VDC) member was available on the first visit when the assessment team observed and photographed watershed treatments. The FGD took place in a nearby school several days later with different participants. FGD respondents had difficulty remembering WALA and the year it started. One said 2014, another 2002, another 2012. This group worked for 4 months in 2011/12 and 2012/13 according to the CRS watershed spreadsheet. Although the
47 These statistics were compiled by CRS in a spreadsheet entitled “CRS WALA Watershed Sites”. Some statistics may vary from what was reported during rapid assessment FGDs and KIIs. 48 With ties there are 17 possible rankings for the 24 watershed sites visited.

46
watershed is under one GVH, many of the 500 FFW beneficiaries came from two other GVHs. There were seven (2 men and 5 women) FGD respondents, all WMC members, including the Vice-Chairwoman and the Chairman. When the group eventually saw pictures of stone bunds, CCTS and check dams from our initial visit they began remembering and smiling.
Outputs
During the first day’s visit we were led by a group of women to a series of check dams. The dams had caused soil to build up in what had been eroded gullies in a farmer’s field. The check dams were not maintained (i.e. increased in height as the gully filled with soil) and water accumulated behind and ran over them when it rained. This led the farmer to open the dam to allow the water to run through freely and without gullying his field.
Domasi watershed structures were check dams and CCTs. There were also a few stone bunds. The CCTs were not being maintained and were filled with sediment and grasses
(not vetiver). Some CCTs were barely visible. The check dams were leading to the regeneration of the watershed. Nonetheless, the velocity of rainwater run-off was digging out the rocks of one check dam. This would eventually lead to its failure.
A WMC/VDC member we interviewed said that the watershed development interventions were mainly intended to protect villages further down the watershed from flash flooding. While he lauded watershed development for reducing field erosion, regenerating forest cover, and increasing arable land, he had never visited the village below. He did describe four villagers from the community below who had come to Domasi to see why their fields were no longer being flooded. Most watershed treatments were not being maintained. Some structures, such as check dams, were either reversed or modified.
After WALA ended, the community planted around 2,800 trees along the riverbanks and around their homes.
Outcomes Check dams led to a small increase in arable land. Watershed treatments also contribute to a reduction in sol loss. There used to be high levels of soil erosion into Lake Chirwa caused by flash flooding prior to WALA watershed treatments. There was also an increase in soil moisture. The CCTs, check dams and stone bunds helped percolate water into the soil therefore raising the water table. This has increased crop yields.
Domasi watershed beneficiaries claimed that they were not affected severely by the 2015/6 El Nino drought in comparison to the 2012 drought. They are more resilient because of the watershed management interventions. Although the rains were erratic most households were able to produce enough food. While it could be argued that their resilience emanates from the post-WALA irrigation and fish pond project through Islamic Relief WALA watershed development interventions that were alleged to have reduced flash flooding in the community

47
below contributed water to the irrigation scheme. They also increased the resilience of the valley community.
Conclusions Check dams led to the recapture of arable land but concurrently flooded farm fields due to lack of maintenance. This led the farmer to modify or remove them. Watershed treatments benefits accrued to a distant village in the watershed below. This this illustrates the problem of indirect benefits and raises the question of how you can tax those who receive benefits to compensate those who work to maintain the watershed treatments or sacrifice arable land to check dams, CCTs and stone bunds.

48
SITE VISIT REPORT
Jerenje Watershed and Irrigation Scheme49 District Zombe Traditional Authority: Mlumbe GVH Sikamu Implementing Partner Save the Children Watershed Target/Treated Hectares 25 has targeted/ 12 has treated FFW Months/Beneficiaries 9 Months/990 Beneficiaries Watershed Treatments: Years Constructed, # Months Worked, # FFW Beneficiaries
2011/12, 3 months, 680 beneficiaries; 2012/13, 6 months, 310 beneficiaries;
Total FFW Oil/Beans (kgs) 14,329 kgs oil/58,500 kgs beans Total Meters Primary Structures 68,084 meters Check Dams/Trees Planted 2015 check dams/3,085 trees planted Resiliency Score/Rank (37 points/17 ranks)50 24 points/8 rank Rapid Assessment Visit Date December 17, 2017
Introduction Jerenje watershed and irrigation scheme development started in 2010. SAVE first identified technically appropriate sites in conjunction with district officials. They then held a small group meeting before discussing WALA with the entire community. SAVE explained that WALA would support Jerenje villager watershed and irrigation system development to reduce hunger. This was WALA’s first watershed development site where mistakes were made and corrected with ORT technical assistance.51
Initially a small group began gathering rocks and clearing the night reservoir site. SAVE told the group that additional workers were required and began recruiting from surrounding villages. Work began without compensation but as work expanded villagers received FFW. During the first year irrigation and watershed development employed 600 workers from 24 villages. In 2012/2013 FFW beneficiary numbers dropped to 400 in the second month, 350 in the third month and 200 in the fourth month.52
Watershed development began when the night reservoir was completed. Eventually WALA would support weir construction. While Jerenje households practiced irrigation prior to WALA, WALA better organized the farmers. FGD respondents stated that the season following watershed development initiation they observed more water in the stream, less rainfall running through their village, and less field gullying and soil erosion.
49 These statistics were compiled by CRS in a spreadsheet entitled “CRS WALA Watershed Sites”. Some statistics may vary from what was reported during rapid assessment FGDs and KIIs. 50 With ties there are 17 possible rankings for the 24 watershed sites visited. 51 Personal communication from former WALA Irrigation Technical Coordinator. 52 Figures provided by the WMC Secretary.

49
The irrigation system’s source river originates in the Zombe Mountain and had never run dry. A weir and concrete water conveyance canals were constructed in 2011. However, the dam (night reservoir) was unable to hold the river water due to huge rain runoff volumes. This forced the villagers to divert water into the canal and straight to the fields, bypassing the night reservoir. Most Jerenje watershed treatments were on a different watershed than the irrigation scheme. While they still helped with farming they did not affect, or protect, the irrigation scheme.
The Jerenje Irrigation Scheme has 38 members. They irrigate about 3 hectares but estimate that the potential irrigation area is 15 hectares. The cold dry season agro-climate slows maize maturation and this increases the risk that irrigation water isn’t available at crucial production phases. To address this, SAVE suggested potato production but did not provide seeds. Farmers bought seeds and potatoes have done well. SAVE also introduced strawberry production and while the area under strawberries is small they are doing well. Farmers also grow carrots and leafy vegetables under irrigation.
Concurrent with watershed development WALA introduced VSLs, PSPs, and improved farming practices. VSL provided saving accounts, something FGD participants said they never practiced before. FGD respondents stated that they didn’t save at banks because banks take service fees and other “taxes”. “With VSL we save our own money and lend it without fees.”
Methodology
The Jerenje watershed visit was conducted by the assessment team with assistance from CRS who provided FGD organization, translation, and technical support. There were 10 FGD respondent (4 men and 6 women), all WMC members. WMC members accompanied the visitors to the watershed site where additional information was obtained and photos taken. Discussions were enhanced with FEF contributions and a very organized WMC secretary.
Output According to the WMC Secretary Watershed development included reforestation (in fields and along
the river bank), CCTs (1278 covering 1400 meters), check dams (175 covering 1500 meters), and vetiver planting on contour marker ridges (148 ridges with 700 meters of vetiver). All measurements were done with a 30-meter tape.
Most WALA assisted farmers still practice improved crop husbandry practices. These include Sasakawa, manure making, mulching, making ridges across the slope, maize/legume intercropping,
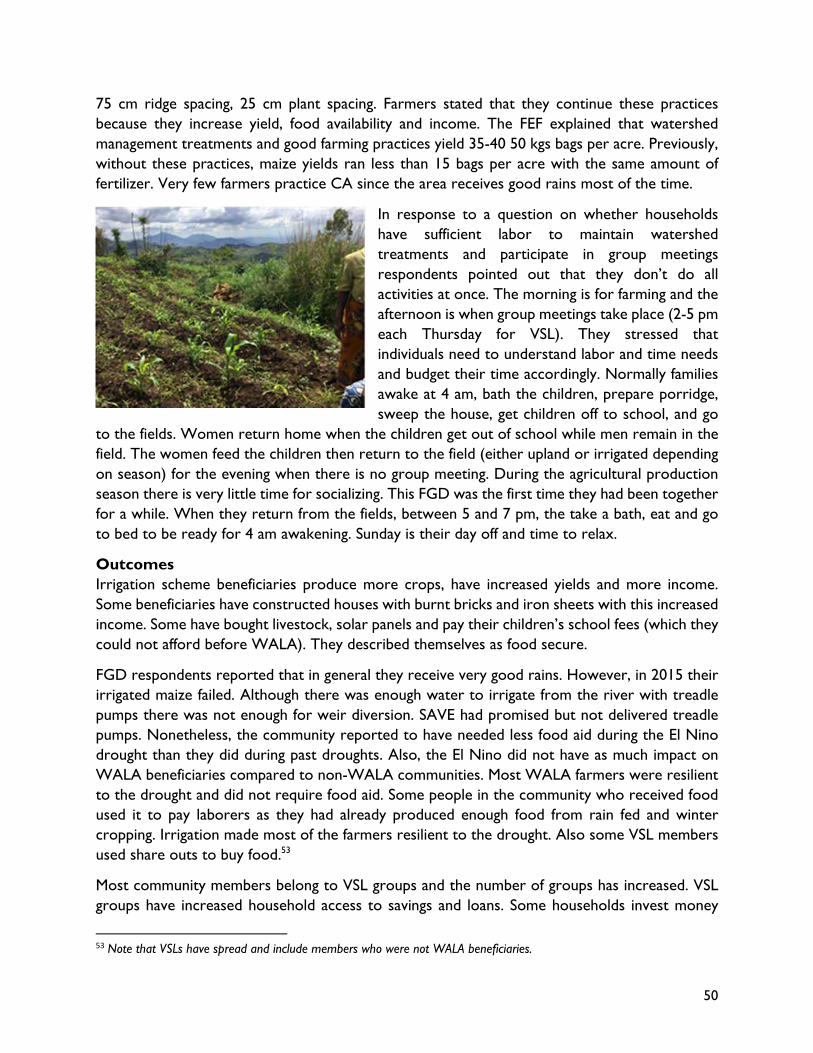
50
75 cm ridge spacing, 25 cm plant spacing. Farmers stated that they continue these practices because they increase yield, food availability and income. The FEF explained that watershed management treatments and good farming practices yield 35-40 50 kgs bags per acre. Previously, without these practices, maize yields ran less than 15 bags per acre with the same amount of fertilizer. Very few farmers practice CA since the area receives good rains most of the time.
In response to a question on whether households have sufficient labor to maintain watershed treatments and participate in group meetings respondents pointed out that they don’t do all activities at once. The morning is for farming and the afternoon is when group meetings take place (2-5 pm each Thursday for VSL). They stressed that individuals need to understand labor and time needs and budget their time accordingly. Normally families awake at 4 am, bath the children, prepare porridge, sweep the house, get children off to school, and go
to the fields. Women return home when the children get out of school while men remain in the field. The women feed the children then return to the field (either upland or irrigated depending on season) for the evening when there is no group meeting. During the agricultural production season there is very little time for socializing. This FGD was the first time they had been together for a while. When they return from the fields, between 5 and 7 pm, the take a bath, eat and go to bed to be ready for 4 am awakening. Sunday is their day off and time to relax.
Outcomes Irrigation scheme beneficiaries produce more crops, have increased yields and more income. Some beneficiaries have constructed houses with burnt bricks and iron sheets with this increased income. Some have bought livestock, solar panels and pay their children’s school fees (which they could not afford before WALA). They described themselves as food secure.
FGD respondents reported that in general they receive very good rains. However, in 2015 their irrigated maize failed. Although there was enough water to irrigate from the river with treadle pumps there was not enough for weir diversion. SAVE had promised but not delivered treadle pumps. Nonetheless, the community reported to have needed less food aid during the El Nino drought than they did during past droughts. Also, the El Nino did not have as much impact on WALA beneficiaries compared to non-WALA communities. Most WALA farmers were resilient to the drought and did not require food aid. Some people in the community who received food used it to pay laborers as they had already produced enough food from rain fed and winter cropping. Irrigation made most of the farmers resilient to the drought. Also some VSL members used share outs to buy food.53
Most community members belong to VSL groups and the number of groups has increased. VSL groups have increased household access to savings and loans. Some households invest money
53 Note that VSLs have spread and include members who were not WALA beneficiaries.

51
earned from irrigated farming in their VSL. The community has one PSP who trains new VSL groups and helps in calculating share outs. Due to VSL participation some members now have houses with burnt bricks and iron sheets while others have bought livestock and solar panels, started small businesses and manage to pay their children’s school fees.
Most watershed structures were not maintained. Most CCTs were filled with soil, others were partially maintained. Stone bunds and check dams were also not maintained though still functioning. Vetiver was observed in the fields. Watershed treatment construction involved workers from other villages who did not own land in the watershed. Treatments were implemented on fields without field owner participation. Thus, farmers who were not part of the watershed development did not maintain the structures even though they were sensitized on treatment importance by the chiefs. After FFW ended individual farmers, who had not received watershed treatments, approached FEF and asked for assistance laying out treatments (marker ridges, check dams).
The night reservoir remains dry and some canals are not used as the night reservoir’s water outlet valve became inoperable two years ago. This has inhibited irrigated area expansion.
Conclusion The WALA watershed development, irrigation and improved farming interventions have increased this community’s resilience. Farmers appreciated the increased irrigation capacity, more productive crop husbandry methods, and VSL benefits. They enjoy more diversified farm enterprise mixes and now produce potatoes during the winter cropping season. However, irrigation area expansion is stymied by an
inoperable outlet valve on the night reservoir that the villagers have inexplicably failed to replace. Also, watershed treatments, for the most part, have not been maintained. To the extent that treatments aren’t maintained, and the night reservoir is not repaired, this community’s resiliency gains are at risk.

52
SITE VISIT REPORT
Kasabola Watershed and Irrigation Scheme54 District Zombe Traditional Authority: Chikowi GVH Mbebesha Implementing Partner Save the Children Watershed Target/Treated Hectares 34 has targeted/7 has treated FFW Months/Beneficiaries 9 months/830 beneficiaries Watershed Treatments/Irrigation Scheme: Years Constructed, # Months Worked, # FFW Beneficiaries
2010/11, 4 months, 180 beneficiaries 2011/12, 1 month, 300 beneficiaries; 2012/13, 4 months, 350 beneficiaries;
Total FFW Oil/Beans (kgs) 8,891 kgs oil/36,300 kgs beans Total Meters Primary Structures 15,093 meters Check Dams/Trees Planted 115 check dams/10,668 trees planted Resiliency Score/Rank (37 points/15 ranks)55 25 points/7 rank Rapid Assessment Visit Date December 13, 2017
Introduction Kasabola Watershed and Irrigation Scheme Development started in 2011. With FFW support the community started with reforestation and constructing check dams, WATs, CCTs and contour bunds. One season after watershed treatment construction community members saw that the water table had increased; rain water running through the villages had decreased; soil erosion was reduced; and, agricultural production had increased.
Kasabola village farmers irrigated their fields as individuals prior to WALA. WALA organized the farmers. This organization gave rise to the Kasabola Irrigation Scheme. With WALA support the community constructed a dam (water pond/night reservoir), canals and weir. They diverted water from the stream through the canals to the dam and then the fields. The dam is also used for fish farming. The scheme started with 5 irrigated hectares but has expanded to 15 hectares.
FGD respondents stated that the watershed was degraded with no trees prior to WALA. It did contain grass and shrubs. Around 2007 the government declared the watershed above the spring box/irrigation box a protected forest. WALA implemented stone bunds in this forest. While walking through the “protected forest” we found a maize field where farmers had constructed well designed CCTs and check dams. The check dams had reclaimed substantial areas of arable
54 These statistics were compiled by CRS in a spreadsheet entitled “CRS WALA Watershed Sites”. Some statistics may vary from what was reported during rapid assessment FGDs and KIIs. 55 With ties there are 17 possible rankings for the 24 watershed sites visited.

53
and now planted soil. These treatments were not maintained. Watershed regeneration was remarkable with grass, several different species of indigenous trees, and a full flowing stream.
WALA introduced conservation agriculture, Sasakawa, ridge alignment and MHCN care groups. WALA did not introduce VSL groups in Kasabola as a “control”. Save the Children wanted to see if VSLs would spread to Kasabola without direct intervention. Nonetheless, VSLs were introduced by Emmanuel International with predominantly female participation.
Methodology The Kasabola watershed visit was conducted by the assessment team with assistance from CRS who provided FGD organization, facilitation, translation, and technical support. There were 18 FGD respondents (4 men and 14 women), mostly WMC and irrigation scheme members. WMC and irrigation scheme members accompanied the visitors to the watershed site where additional information was obtained and photos taken. At the end of the site visit the chief served the assessment team nsima, sardines, green bean leaves and eggs.
Output Some watershed treatments were maintained, some partially maintained and some not maintained. Treatment structures were mostly on marginal lands. Most CCTs were filled with soil. While most check dams had deteriorated some were still intact. The watershed was not extended after WALA ended. Without FFW community members were not motivated and focused more on the irrigation scheme than the watershed. The unmaintained and partially maintained watershed structures still reduced rainfall runoff velocity allowing filtration into the soil and increasing the water table.
The dam completely dried up towards the end of October 2017. The fish and most irrigated crops died. A few farmers near the stream irrigated their fields with watering cans and enjoyed small harvests.
Most Kasabola farmers practice good crop husbandry including manure making, planting ridges across the slope, maize/legume intercrop, 75 cm ridge spacing, and 25 cm plant spacing (Sasakawa). During the 2017/18 cropping season no farmers practiced CA.
Outcomes Kasabola community members noticed an increased water table after one season of watershed
treatments. WALA supported community irrigation system development and expansion. The irrigation scheme has expanded from 5 to 15 hectares. This indicates increased irrigation water access and thus successful water and soil conservation interventions. Irrigation scheme farm family incomes have increased. Scheme members produce more crops, have higher yields, and described themselves as food secure. Kasabola farmers have adopted Sasakawa and soil building technologies. The watershed that feeds the irrigation scheme has been regenerated due to government and WALA interventions.

54
The community reported that they were not affected by the 2015/16 EL NINO drought. However, their dam dried up mid-way into the 2017 winter cropping season.
Conclusion The WALA project has increased Kasabola community resiliency in the short to medium term. More water is available for rainy and dry season agricultural production and, in combination with improved crop husbandry, this has increased agricultural production. However, this resiliency is threatened by insufficient watershed treatment maintenance.

55
SITE VISIT REPORT
Katunga Watershed and Irrigation Scheme56 District Zombe Traditional Authority: Chikowi GVH Katunga Implementing Partner Save the Children Watershed Target/Treated Hectares 15 has targeted/14 has treated FFW Months/Beneficiaries 6 months/635 beneficiaries Watershed Treatments: Years Constructed, # Months Worked, # FFW Beneficiaries
2010/2011, 3 months, 250 beneficiaries; 2011/12, 1 months, 185 beneficiaries; 2012/13, 2 months, 200 beneficiaries;
Total FFW Oil/Beans (kgs) 4,905 kgs oil/20,025 kgs beans Total Meters Primary Structures 1,067 meters Resiliency Score/Rank (37 points/15 ranks)57 28 points/4 rank Rapid Assessment Visit Date December 13, 2017
Introduction
As the SAVE Director was with I-LIFE he decided to use his WALA FFW allotment in several relatively small watershed management activities linked to irrigation58. The first SAVE site was a water pond initiated with GOM resources for fish production prior to WALA initiation. The fish pond/eventual night reservoir was not finished as GOM resources ran out. When SAVE arrived they offered to help complete the fish pond but explained to the villagers that it would have more impact if the pond was also used for irrigation and complemented with watershed development. The community agreed as they were familiar with irrigation. SAVE mobilized Agricane to design the irrigation system and teamed WALA extentionists with GOM agronomists.
In 2011 WALA and the community started watershed development with reforestation, constructing check dams, digging CCTs and WATs, and planting vetiver along canals and around the dam. The community reported that the following year they observed increased soil moisture in their rain fed fields and more water in the pond (dam). There was also reduced rain water run off passing through their villages and less gullying. Check dams had reclaimed arable land and farm yields had increased.
WALA introduced home gardens, livestock production (unfortunately the chickens died), VSL groups, group marketing/farming as a business, improved crop husbandry (Sasakawa), ridge alignment, CA, PSPS and paravets.
56 These statistics were compiled by CRS in a spreadsheet entitled “CRS WALA Watershed Sites”. Some statistics may vary from what was reported during rapid assessment FGDs and KIIs. 57 With ties there are 17 possible rankings for the 24 watershed sites visited. 58 Personal communication with the former CRS WALA Irrigation Technical Quality Coordinator.

56
Katunga farmers share irrigated land. The larger landholders provide land to farmers with less land so that the overall scheme produces more. All market-oriented farm output is marketed collectively. With irrigation farmers grow a variety of crops, from tomatoes and maize to taro and sugar cane, with banana, papaya and mango trees, and peanuts, cowpeas, pigeon peas, amaranth and leafy vegetables intercropped here and there.
Methodology The Katunga watershed visit was conducted by the assessment team with assistance from CRS who provided FGD organization, translation, and technical support. There were 9 FGD respondents (4 men and 5 women). They were WMC and irrigation scheme members. WMC and irrigation scheme members accompanied the visitors to the watershed site where additional information was obtained and photos taken.
Output The Katunga Irrigation Scheme consists of 26 members, 13 men and 13 women, from 4 villages; Chibade, Katunga, Aliseni and Namkwenya. These farmers irrigate maize, peas, beans, tomatoes, onions, irish potatoes and orange fleshed sweet potatoes. Since WALA left, the area under irrigation has increased from 5 to 6 hectares. The dam never runs dry and is also used for fish farming.
Katunga’s watershed had well-constructed WATs, check dams and CCTs although they were in need of maintenance. Altogether the treatments represented 1,067 meters of development. The villagers also constructed a weir.
Most farmers still practice good crop husbandry including Sasakawa, manure making, making ridges across the slope, maize/legume intercrop, 75 cm ridge spacing and 25 cm plant spacing. FGD respondents stated that they continue these practices due to their positive effect on crop yields, household food availability and incomes. Very few farmers practice CA as the area receives good rains most of the time.

57
Outcomes Farm income has increased for households in the irrigation scheme. Scheme members have constructed houses with burnt bricks and iron sheets purchased with money realized from irrigation. Others have used their increased income to buy livestock and pay school fees (that they were unable to do before WALA). Irrigation scheme members produce more crops and their yields have increased, they reported to be food secure. The community reported that they were not affected by the EL NINO drought.
The number of VSL groups has increased and most community members belong to a VSL group. This has increased their savings and access to loans. The community has 2 PSPs who train new VSL groups and help in calculating share outs. Some VSL members have constructed houses with burnt bricks and iron sheets from their VSL share outs. Others have bought livestock and paid school fees.
Almost all of the watershed structures were not maintained. Most CCTs were filled with soil and most check dams unmaintained. Vetiver was observed in the fields and around the dam. Watershed treatment construction involved workers from other villages who did not own land in the watershed. So, as Katunga farmers were not part of watershed development, yet owned fields where treatments were implemented and arable land sacrificed, they did not maintain the structures. However, the dam that is tied to the watershed is still used for irrigation and fish farming.
Conclusion WALA watershed and irrigation system development,
agricultural extension and VSL interventions have increased this community’s resilience. FGD respondents reported increased rain fed and irrigated crop production, increased farm income from more output and collective marketing, and more access to financial resources through VSL participation. They have improved housing, bigger livestock herds, and children who attend school more regularly. The WALA project has brought resilience to the community and the community appreciated the tangible and positive results due to WALA interventions. The community members are now food secure and did not require food aid compared to non-WALA sites. However, watershed development treatments are not maintained and this risks the sustainability of these achievements.

58
SITE VISIT REPORT
Khoviwa Watershed Scheme59 District Mulanje Traditional Authority: Chikumbu GVH Khoviwa Implementing Partner Africare Watershed Target/Treated Hectares 106 has targeted/31 has treated FFW Months/Beneficiaries 5 months/200 beneficiaries Watershed Treatments: Years Constructed, # Months Worked, # FFW Beneficiaries
2011/12, 2 months, 75 beneficiaries; 2012/13, 3 months, 125 beneficiaries;
Total FFW Oil/Beans (kgs) 1,929 kgs oil/7,875 kgs beans Total Meters Primary Structures 8,670 meters Check Dams/Trees Planted 2,105 check dams/9,200 trees planted Resiliency Score/Rank (37 points/15 ranks)60 23 points/9 rank (tied) Rapid Assessment Visit Date December 11, 2017
Introduction Families of Khoviwa GVH were challenged by prolonged dry spells, soil erosion, gully formation and flush floods. WALA sensitized the community on the importance of a watershed development. This sensitization resulted in the initiation of Khoviwa watershed development in 2010. Watershed management and technical committees were established each consisting of 10 members. Watershed treatments included CCTs, swalles, stone bunds, marker ridges, fish ponds, check dams, and vetiver and tree planting. Watershed treatment construction began with 300 FFW beneficiaries. FFW beneficiaries received 4 liters of cooking oil and 15 kgs of beans. Most beneficiaries were women. The watershed covers 60 hectares of land. While FFW was identified as an important incentive community member emphasized that reducing flash flooding provided the main incentive for watershed development work.
KII respondents attested that prior to implementing WALA watershed management treatments flooding was much worse in their village. They also showed us a fish pond that was constructed with WALA support but that hadn’t been maintained. It was actually one of the series of descending ponds, all grassed over and not being used. The community has one vetiver and tree nursery
WALA introduced CA (pit planting and mulching), kitchen gardens, ridge alignment, seed spacing, manure application, group farming as a business, VSLs, PSPs, Paravets and health and nutrition care groups..
Methodology The Khovia watershed visit was conducted by the assessment team with assistance from CRS who provided FGD organization, translation, and technical support. This third visit of the day took place in a rain downpour. It was evident how much water can fall, and not be absorbed, while watching
59 These statistics were compiled by CRS in a spreadsheet entitled “CRS WALA Watershed Sites” after WALA had ended. They reflect data contributions from WALA consortium members based on their records. Some statistics may vary from what was reported during rapid assessment FGDs and KIIs. 60With ties there are 17 possible rankings for the 24 watershed sites visited.

59
runoff pour down the street in front of the well-constructed house where we sat as the sun set. Due to the rain we were unable to observe watershed treatments or take pictures. We interviewed VDC and WMC members.
Output When the WALA project ended, the number of community members working on the watershed dropped. The end of FFW discouraged most community members. Maintenance of the structures depends on the owner of the field. Most check dams were not maintained, some had been destroyed by running water, especially those constructed with small stones. Nonetheless, some community members still maintain watershed treatments in their fields.
The community members still continue indigenous and exotic tree planting. Trees are planted on the Nkhunguni Mountain, in fields and around homes.
The area under CA has increased. Kitchen gardens are mainly established during the dry season because farm plot size. Most farmers prefer growing vegetables together with other crops during the rainy season.
The number of farmers doing ridge alignment, seed spacing, and manure application has increased. These technologies are attractive due to small land holding size.
The number of VSLs has increased. Most community members belong to a VSL. This has increased community member access to savings and loans. The community has 2 PSPs who train new VSL groups and help in calculating share outs.
Most households’ nutrition status has improved due to home gardens and the different recipes for preparing food for children and pregnant women.
Outcomes The watershed development, CA, ridge alignment seed spacing and manure application resulted in increased water and moisture availability in the fields, land reclamation, increased soil fertility, increased arable land, reduced run off and reduced soil erosion. This in return resulted in increased yield of rain fed crops thereby making most community members food secure.
Community members have experimented with group marketing but have not continued.
VSLs have increased access to finance for most community members. Households now live in improved houses with iron sheet roofing, own livestock, run small businesses, and pay school fees with VSL loans and share outs.
While the El Nino did affect the community WALA beneficiaries needed less food aid than non-WALA beneficiaries. Also, KII respondents stated that the community required much less food aid that what they required in 2012.
Conclusion Much of Khoviwa GVH community success and resilience can be attributed to WALA investments. Watershed treatments have improved agricultural production conditions. Improved agricultural technologies have increased yields under most agro-ecological conditions. As most of the farmers are in VSLs and own livestock they have increased access to financial resources to buy food in case of a shock. Nonetheless, watershed treatments have not been maintained threatening the sustainability of these resiliency gains.

60
SITE VISIT REPORT
Majawa Watershed and Irrigation Scheme61 District Zombe Traditional Authority: Chikowi GVH Mbebesha Implementing Partner Save the Children Watershed Target/Treated Hectares 65 has targeted/9 has treated FFW Months/Beneficiaries 3 months/320 beneficiaries Watershed Treatments: Years Constructed, # Months Worked, # FFW Beneficiaries
2012/13, 3 months, 320 beneficiaries;
Total FFW Oil/Beans (kgs) 3,527 kgs oil/14,400 kgs beans Total Meters Primary Structures 21,007 Check Dams/Trees Planted 931 check dams/3,421 trees planted Resiliency Score/Rank (37 points/15 ranks)62 21 points/11 rank (tied) Rapid Assessment Visit Date December 14, 2017
Introduction Majawa households struggled with severe soil loss, gully erosion and high numbers of malnourished children. In 2009 WALA conducted a participatory rural appraisal to identify and initiate activities and solicit volunteers. At that point several committees were formed: a 15-member producer group; an 18-member Disaster Risk Reduction (DRR) Group; a 12-member MCHN care group; and other groups. The producer group’s lead farmers (LF) were responsible for mobilizing marketing groups. Support groups were created for people living with HIV (PLHIV). A watershed management committee was not formed at this time as those activities did not begin until 2012.
WALA started implementing MCHN and agricultural interventions prior to watershed development. MCHN care groups focused on children 0-5 years, pregnant and lactating mothers and children. Women were taught to prepare different kinds of nutritious meals for themselves and their children. As a male FGD respondent pointed out: “Just as good farm land needs good inputs, we needed to protect pregnant women from malaria (including taking malaria prevention drugs), attend ante natal care clinics before 3 months of pregnancy, afterbirth breastfeeding and child nutrition. If a child’s growth was slow we were taught how to use local foods in a way that stimulated growth. We were also trained in identifying malnutrition with growth monitoring (weigh child and record weight). We also
61 These statistics were compiled by CRS in a spreadsheet entitled “CRS WALA Watershed Sites”. Some statistics may vary from what was reported during rapid assessment FGDs and KIIs. 62 With ties there are 17 possible rankings for the 24 watershed sites visited.

61
promoted inoculations. We asked pregnant women to deliver their babies in a health facility. The headwoman actually passed a law requiring this.” FGD respondents identified the use of green bananas in place of nsima as an important dietary innovation, especially during drought. The community’s significant reduction of malnourished children was attributed to these trainings.
There were also PLHIV support groups. WALA trained “expert clients” (individuals who best understood HIV) to communicate HIV information and assist patients. Patients were targeted with “special food” to boost their immunity. WALA also taught the community to specifically care for orphans and vulnerable children, something they had never thought of previously. WALA distributed food to chronically ill community members. These individuals were given identification cards along with vegetable oil, beans, and corn/soy blend.
Community members were also taught how to make energy saving stoves and fireless cookers to reduce deforestation. DRR groups encouraged planting of trees along river banks and drought tolerant crops.
FFW supported watershed development came last. Watershed development treatments included reforestation, constructing stone bunds, check dams and CCTs. The year that watershed development began Majawa received heavy rains which washed away most structures. As a result, field owners did not see watershed structure benefits and do not maintain them today.
Community members tried to develop an irrigation scheme but it did not last because WALA did not give them treadle pumps and irrigating with water cans was too much work. Collective marketing only worked for one season. They sold nandolo and birds eye chilies collectively but some farmers were not happy with the prices hence they abandoned collective marketing.
WALA also introduced CA, Sasakawa, ridge alignment, home gardens and VSL groups. A LF remarked that at first WALA was difficult to understand. Over time he was able to grasp the ideas and pass technologies to others. WALA changed his capacity to think through problems, such as how to enhance soil fertility with leguminous trees (“fertility trees”).
Methodology The Majawa watershed visit was conducted by the assessment team with assistance from CRS who provided FGD organization, translation, and technical support. There were 5 FGD respondents (3 men and 2 women). The FGD began with 5 participants (3 female, 2 male) but grew over time with villagers coming and going. FGD discussants were lead farmer/producer group members. Two were also health promoters and one was a watershed management committee member. The village headwoman participated as did a district MOA extension coordinator. The FGD was set up by an “informal coordinator” who also accompanied the assessment team to the Namadidi and Namilongo watershed sites. This individual appeared to have a leadership/facilitator role with each of these communities. Pictures of the watershed and irrigation scheme were taken by the assessment team.

62
Output Almost all the watershed structures were not maintained and some completely destroyed. As a LF respondent commented: “Watershed management came towards the end of WALA but all other activities began at the beginning.” The village headwoman stated that the watershed was
completely degraded with no trees and no grass and that they had created watershed structures to control water flow (CCT, check dams, stone bunds). She stated that they had worked hand in hand with MOA extension staff who would best now the area covered as they had recorded it with GPS. The year of the treatments there was heavy rain. CCTs were full and stone bunds held back so much water that they overflowed and washed away, hurting farmer fields and giving them a bad impression of watershed management.
Only a few functioning check dams were observed while others had started creating new gullies due to lack of maintenance. The LF “coordinator” (who worked with WALA communities in Namadidi and Namilongo) stated that Majawa’s watershed management weakness was due to late introduction and inadequate opportunity for the community to correct mistakes.
The community sustained other activities such as producer groups, PLHIV support groups, MCHN care groups and VSL groups. The number of VSL groups has increased with members investing VSL proceeds predominantly in home improvements. Although the community was promised treadle pumps for irrigation they were never delivered.
Most Majawa farmers still practice good crop husbandry including manure making, mulching, minimum tillage, planting ridges across the slope, maize/legume intercropping, double up63, 75 cm ridge spacing and 25 cm plant spacing. Yield has increased for farmers who follow good crop husbandry practices. One farmer reported harvesting twelve 50kg-bags before adopting good crop husbandry but now harvesting fifty 50kg-bags of maize after adopting Sasakawa, 75cm ridge spacing and 25 cm plant spacing.
The MOA promoted planting beans with maize to diversify risks and put nitrogen in the soil. There was some confusion as to whether Sasakawa allowed intercropping (the MOA extensionist said it did). While some FGD respondents stated that they didn’t intercrop they did plant pigeon peas on field borders and along paths and intercrop groundnuts with beans. However, only a few farmers still practice CA because of the tendency of mice hunting villagers to set mulched fields on fire.
WALA promoted the currently function and expanding VSLs. They trained beneficiaries in “farming as a business”. FGD respondents stated that they now think about selling when they plant crops. LFs mobilized marketing groups and these groups formed marketing clusters. WALA did not establish buyer-marketing group links. Instead they told farmers to establish those links 63 https://africa-rising.net/2017/05/18/double-up-legume-technologies-in-conservation-agriculture-show-potential-for-scale-up-in-zambia/

63
and observed and photographed group sales when they occurred. Group participants were surprised when buyers actually came to the village as this hadn’t happened before. Marketing groups also procured inputs in bulk. One FGD respondent said that farmers are still marketing in groups. Another stated that the practice had stopped. This respondent stated that WALA had promoted birds eye chilies for production and group marketing and that early adopters had made money but late adopters received prices that were too low. This discouraged them from group marketing. WALA also introduced a popular pigeon pea variety. LFs stated that they wished WALA had done this before introducing birds eye chilies.
An FGD respondent described a WALA introduced fireless cooker that saved firewood. He stated that he would cook rice for three minutes over fire then put the rice in a container made of leaves and bamboo to hold in heat. After 20 minutes the rice is cooked. The village headwoman described how to make soy milk that tastes like coffee while other FGD respondents described orange juice and potato snack recipes for children and a soy snack that when fried “tastes like meatball”. How to grow and prepare orange fleshed sweet potatoes was also promoted. Finally, smokeless cooking stoves were introduced that produced heat more efficiently and could reduce deforestation. Home gardens production of pumpkin and amaranth was introduced as was hand washing after toilet use. As the village headwoman commented: “While the project has ended we
retained knowledge and skills. Handouts are good but they are not good forever.”
Outcomes A LF stated that “The most important impact was that we had a new way of thinking about our problems.” Nine of 25 farmers adopted CA. Stated reasons for non-adoption was that “SAVE left”; human nature (i.e. it takes time to convince people); and, CA was something new. Maize stalks for mulch were burned by boys hunting mice or due to jealousy. This also discouraged CA. Nonetheless, for those still practicing CA, the positive difference and results are
easy to see.
A female LF described how she made compost combining fire ash, maize bran, ant hill or banana plantation soil with 10 kgs of fertilizer to make 50 kgs fertilizer;
A LF said that MOA extension is understaffed. WALA mainly increased access to technologies the GOM knows but did not have capacity to extend. Farmers were taught how to measure their field to estimate fertilizer needs. They can now produce 25 bags/acre. WALA helped LFs make more rational farming decisions. They taught farmers to observe the better farmers to identify their own farming problems and seek information. The village headwoman pointed out that farmers know that as they don’t have knowledge to fight fall army worms they should call upon extension staff.
The health status of most people in the community has improved. The number of malnourished children in the community has dropped significantly.
The EL NINO drought severely affected the community. Most farm household used VSL group money to buy food and a good number of households required food aid.

64
Village headwoman: “Although the project has ended we still have knowledge and skills. Child health has improved and malnutrition has ended.”
Conclusion WALA’s impact in Majawa was reflected during this FGD by respondent understanding of intervention linkages and their enhanced decision-making capacity. As one FGD/LF respondent stated: “WALA activities made sense over time. We didn’t have money to buy the fish that WALA was encouraging as an ingredient in their recipes but over time, with better yields, group marketing and VSLs, we gained the money to buy the things that WALA was promoting. That was the beauty of WALA!”
Nonetheless, without sustained watershed treatment maintenance and an irrigation system this community is still vulnerable to adverse weather and rainfall variability (field destroying flooding and drought). While VSL savings may provide some resilience to shocks loans and share outs risk being insufficient during a serious or prolonged drought.

65
SITE VISIT REPORT
Makuta Watershed Site64 District Balaka Traditional Authority: STA Kachenga GVH Pyoli Implementing Partner Project Concern International Watershed Target/Treated Hectares 124 has targeted/124 has treated FFW Months/Beneficiaries 4 months/592 beneficiaries Watershed Treatments: Years Constructed, # Months Worked, # FFW Beneficiaries
2012/13, 4 months, 592 beneficiaries;
Total FFW Oil/Beans (kgs) 2,175 kgs oil/8,880 kgs beans Total Meters Primary Structures Not Available Check Dams/Trees Planted Not Available Resiliency Score/Rank (37 points/15 ranks)65 26 points/6 rank (tied) Rapid Assessment Visit Date December 19, 2017
Introduction WALA initiated activities in Makuta in 2010 to address food insecurity caused by rainfall variability and drought. The watershed encompasses 7 villages and covers approximately 120 hectares. Watershed development began in 2011. Watershed treatments included fruit and leguminous tree planting, vetiver planting, CCTs and marker ridges. Watershed treatment construction workers earned 4 litters of cooking oil and 15 kgs of beans for 20 days of work. The FFW was for 5 months in 2011: June - August with 128 beneficiaries and September – October with 150 beneficiaries. WALA also promoted improved rainfed agricultural technologies such as 75 cm ridge alignment, Sasakawa, CA mulching and manure application, and mixed cropping. VSL groups, MCHN groups, producer groups and marketing groups were also introduced.
WALA also introduced VSL, producer, marketing and MCHN care groups. PSPs, agribusiness service providers and paravets were also trained. NJIRA, a similar project with PCI as implementer, began operations in the area in 2014.
Methodology The Makuta watershed visit was conducted by the assessment team with assistance from CRS who provided FGD organization, translation, and technical support. There were 15 FGD respondents (5 men and 10 women) including WMC members, three village headpersons and a group village headperson. Five WMC members accompanied the visitors to the watershed site
64 These statistics were compiled by CRS in a spreadsheet entitled “CRS WALA Watershed Sites”. Some statistics may vary from what was reported during rapid assessment FGDs and KIIs. 65With ties there are 17 possible rankings for the 24 watershed sites visited.

66
where additional information was obtained and photos taken. The Makuta FGD took place in a well-constructed community center. The center’s walls were covered by maps and project implementation charts. USAID project motorcycles were parked outside with NGO logos on them. There was ample evidence of the NJIRA’s influence. It is understandable that there would be confusion between WALA and NJIRA activities and accomplishments.
Outputs Committees and groups established under WALA, such as WMC, producer, marketing and DRR, are still in existence and working under NJIRA. Maintenance and expansion of watershed treatments such as CCTs and check dams is done by individual land owners. There are many people maintaining watershed treatments established under WALA and NJIRA. Nontheless Makuta is in a hot, dry and flat area and there were few watershed treatments.
VSL groups are operating and expanding. Each village has more than 20 VSL groups supported by two PSPs. The number of farmers practicing CA has increased.
There as a LF demo plot showing CA (mulching), Sasakawa, and maize/legume intercrop. The plants were unhealthy. The LF explained that the plot had been planted late. Down the road from the demo plot a farmer (from WALA) had newly mulched his Sasakawa maize. He had also recently dug CCTs. A nearby female farmer, where vetiver has been planted in a field gulley to slow rainfall run off velocity, stated she did not use VA due to termites. Her maize was nitrogen deficient. She stated that she intended on transplanting leguminous tree “volunteers”, that are apparently providing maize with nitrogen near the tree where they were sprouting, throughout her field.
Outcomes FGD respondents described how farm production has increased. One farmer explained that due to CA, hybrid maize, fertilizer and watershed management he can now produce 52 bags/acre, up from the 12 bags/acre he received prior to WALA (and NJIRA). Watershed management treatments have increased soil moisture content and reduced rainfall runoff and soil erosion. Farmers have higher incomes from selling surplus maize production.
VSL groups are very popular and useful. Group members are able to pay school fees, buy livestock, farm inputs, clothes, build better houses with iron sheets roofing and start businesses.
The MCHN cooking lessons helped to reduce malnutrition and diversify staples away from sole reliance on Nsima.
The effect of 2015/16 El Nino was less than during previous droughts because farmers who adopted watershed treatments were able to harvest and provide

67
for their families. WALA beneficiaries were better off than non-WALA communities. NJIRA was being implemented during the El Nino event.
Conclusion
Balaka is a flat and dry district. Thus, there were few watershed treatments applied to harvest water in the sites observed. Those that were applied were described as helping beneficiaries harvest more maize. The integration with other activities such as ridge alignment, CA and VSL has helped farmers improve their livelihoods and mitigate shocks. Nonetheless, it was hard to distinguish WALA activities and impacts from NJIRA activities and impacts.

68
SITE VISIT REPORT
Malosa Watershed Scheme66
District Zomba Traditional Authority Malemia GVH Minama Implementing Partner Emmanuel International Watershed Target/Treated Hectares 3,702 has targeted/77 has treated Total FFW Months/Beneficiaries 8 months/400 beneficiaries Watershed Treatments: Years Constructed, #Months Worked, #FFW Beneficiaries
2011/12, 4 months, 250 beneficiaries; 2012/13, 4 months, 150 beneficiaries
Total FFW Oil/Beans (kgs) 5,878 kgs oil/24,000 kgs beans Total Meters Primary Structures 48,056 meters Check Dams/Trees Planted 2,160/6,700 Resiliency Score/Rank (37 points/15 ranks)67 17 points/14 rank Rapid Assessment Visit Date December 7 and 16, 2017
Introduction WALA initiated Malosa watershed development activities in 2013 to address severe watershed deforestation and gullying. Stone bunds, check dams and CCTs were constructed and indigenous and fruit trees and vetiver grass planted. WALA beneficiaries received 4 litres of cooking oil and 15 kgs of beans for 20 days of watershed development work. Farmers from 20 villages were involved in the FFW.
Non-watershed development activities (irrigation, producer groups, VSLs, etc.) were not introduced by WALA. The existing Malosa irrigation scheme was introduced in 2002. The GOM’s EU funded Rural Infrastructure Development Project introduced farming as a business and VSLs were copied from other villages trained by the GOM Department of Forestry. WALA did introduce Sasakawa, manure, mulching and mixed cropping and introduced MCHN care groups and kitchen gardens where women were taught how to grow and prepare nutritious food.
A female FGD respondent described how CCTs “stopped the water from running, forced it to walk, then stop and sink into the soil”. Another referred to how watershed degradation increased Lake Chilwa silting that reduced water quality and fish yield. FGD respondents stated
66 These statistics were compiled by CRS in a spreadsheet entitled “CRS WALA Watershed Sites”. Some statistics may vary from what was reported during rapid assessment FGDs and KIIs. 67 With ties there are 17 possible rankings for the 24 watershed sites visited.

69
that they were told that by controlling watershed run off they could contribute to saving Lake Chilwa from “death”.
Methodology There were two Malosa watershed visits. The first, on 12/6, observed and photographed watershed treatments and solicited verbal input from two young male villagers. They stated that the primary benefit of WALA was the FFW.
The second on 12/16 was the FGD with 16 WSC members (though the group grew to 20 members, 13 women and 7 men, before discussions were completed). The assessment team was accompanied by the District Agricultural Extension Coordinator and the CRS team. This second visit began with the assessment team showing photos of watershed treatments taken during the earlier visit.
Outputs
Watershed treatments were of inferior quality as WALA was introduced towards the end of the project and there was inadequate time to correct errors. Check dams were ill designed but still effective in capturing soil. Stone bunds and CCTs were not maintained. There was no evidence of treatment expansion.
There was evidence of successful reforestation. Each village has a protected forest that is managed by a village forest committee. Trees such as Nyowe, Mtangatanga, Keisha, Mthethe, M’bawa and mango were planted and the protected forests regenerated.
FGD respondents said there was no WALA VSL in this watershed site. However, they implemented VSL ideas they had learned from a nearby village that received GOM Department of Forestry support. Several FGD respondents described VSL participation. A male member mentioned that VSL’s are forcing people to develop relations and become closer. As VSL groups meet weekly group members are getting to know each other better as the group’s cohesion grows.
There was also no WALA irrigation intervention in this village. However, the community’s fields are irrigated during the dry season due to an earlier irrigation development project. The irrigation scheme was introduced before WALA initiated its activities.
Villagers were familiar with WALA MCHN interventions.
Outcomes Soil erosion has been reduced due to forest regeneration and watershed treatments. Gully formation has been slowed and gullies filled with soil.

70
Irrigation system water levels have increased due to CCTs and reforestation. The nearby Lifani and Nampingo Rivers, which used to dry up after the rainy season, now flow continuously. Community boreholes supply water throughout the year. Previously the water table was low and access to water minimal due to deforestation. With improved water flow to the irrigation scheme villagers now grow 2-3 crops per year.
MCHN care groups have improved the nutrition of pregnant women and children and reduced malnutrition.
Since the irrigation scheme was developed in 2002 villagers haven’t experienced hunger. Even during the El Nino they didn’t require food aid. There may have been one or two villagers who struggled but in general the village was food secure. The size of the irrigation scheme is expanding. “As the external agencies are encouraging us to see farming as a business anything we grow under irrigation is for sale. We may eat some of it but it is predominantly for sale: onions, tomatoes, green corn, amarynth, pumpkins, etc.” Again, irrigation began prior to WALA implementation but WALA watershed treatments, especially reforestation, in conjunction with community forest protection, seem to have improved irrigation scheme capacity.
The female WMC secretary stated that watershed treatments were being maintained but that only a small part of the watershed was treated as treatments came near the end of WALA. The WMC tried to maintain the check dams but the Water Department removed them to install domestic water supply pipes.
Malosa watershed beneficiaries have not adopted many WALA technologies that would improve their resilience. However, they seem to have “cobbled together’ complementary technologies (crop husbandry, irrigation system, protected forests, VSLs) that mirror the WALA package. WMC members claimed that they were not affected by the 2015/16 El Nino. The current problem that these farmers are facing is the introduction of pests like fall army worms.
Conclusion Malosa is an interesting real-world example of what is probably taking place in most, if not all, WALA watershed communities. Donor and government activities and interventions overlap and synergized to increase short term community resiliency. The trick will always be to achieve intervention sustainability without external support, while it may be unrealistic to expect hard pressed villagers to allocate their labor to public goods without compensation. Malosa beneficiaries appear resilient in the short term and, perhaps, due to the multi-source nature of their supported capacity improvements have a greater chance of medium to long term resiliency.

71
SITE VISIT REPORT
Mbangu Watershed and Irrigation Scheme68
District Nsange Traditional Authority Malemia GVH Mbangu Implementing Partner Total Land Care Watershed Target/Treated Hectares 150 has targeted/27 has treated Total FFW Months/Beneficiaries 4 months/1,600 beneficiaries Watershed Treatments: Years Constructed, #Months Worked, #FFW Beneficiaries
2012/13, 4 months, 1,600 beneficiaries
Total FFW Oil/Beans (kgs) 25,513 kgs oil/96,000 kgs beans Total Meters Primary Structures 46,961 meters Check Dams/Trees Planted 144 check dams/14,150 trees planted Resiliency Score/Rank (37 points/15 ranks)69 26 points/6 rank (tied) Rapid Assessment Visit Date December 9, 2017
Introduction WALA initiated activities in 2010 when TLC approached the District Commissioners Office. Issues identified during planning discussion included drought/dry spells, floods and cholera incidence. In 2010 trainings in CA, MCHN, DRR/VCPC, sanitation and hygiene, VSLS, producer groups/lead farmers and farming as a business/group marketing took place. In 2010/2011 CA (mulching, manure), mixed cropping, MCHN, VSLs, marketing clubs/clusters and DRR interventions began. Irrigation was discussed at this time and the village provided with treadle pumps. For VCPC/DRR villagers identified and planned how to address risks: drought/dry spells, flash floods, cholera. In 2012 WALA held meetings to discuss water and soil conservation and natural resource management. GOM extension staff helped the community select a WMC. According to the agricultural extensionist the project started in 2009 when WALA approached the District Council to introduce and discuss potential activities. During that meeting several potential sites where watershed development might be useful were presented. District staff had previously conducted PRAs with community members and identified drought, floods, and cholera outbreaks as problems. The VDC/ADC regularly collect issues from farmers, writing reports and making them available to project implementers. As this community was “first in-line” they were selected to receive the discussed interventions. In response to the question on how WALA entered the community an FGD respondent stated: “In this community we have frequent visitors. They ask us about our issues. That information is compiled and archived by the District Commission.”
68 These statistics were compiled by CRS in a spreadsheet entitled “CRS WALA Watershed Sites”. Some statistics may vary from what was reported during rapid assessment FGDs and KIIs. 69 With ties there are 17 possible rankings for the 24 watershed sites visited.

72
In April 2013 the WMC and other villagers received training in watershed treatment construction and proceeded to dig swales, CCTS, WATs and construct check dams and plant vetiver. When digging swales they planted vetiver grass on ridges to establish nurseries. Neem and Gliricidia trees were planted to protect the soil, restore fertility, and along the Chimwala River to control river flow.
Watershed treatment construction began with 400 FFW workers who received 4 litres of cooking oil and 15 kilograms of beans after 20 days of work. In September 2013 the WMC reviewed pace of work and decided to increased FFW beneficiaries to 800 and again in November to 1600, including FFW beneficiaries from other villages (as these villages did not benefit directly from watershed development they stopped working on treatments when FFW stopped). Workers were provided tools, hammers, picks, wheelbarrows and line levels to establish contour lines. 28 watershed hectares were treated.
In 2014 WALA ended and handed activities over to the village headperson and district government. Not all interventions had been completed but FGD respondents felt they had acquired the skills to continue the work. Villagers treated 11 hectares after WALA completion. UBALE (a CRS project) started shortly after WALA ended and some of the WALA watershed management expansion is supported by UBALE.
Methodology The Mbangu watershed visit was conducted by the assessment team with assistance from CRS who provided FGD organization, facilitation, translation, and technical support. Ten WMC members (5 men and 5 women) participated. Four WMC members accompanied the visitors to the watershed site where additional information was obtained and photos taken. The PSP for VSL joined the FGD discussion in progress as did the WMC Chairperson. A GOM agricultural extensionist was present during the FGD and site visit. The CRS Country Director participated as an observer in this visit.
Outputs Flash flood hazards were diminished as structures slowed rain water runoff and protected houses. FGD respondents stated that watershed treatments immediately resulted in less water flowing through their villages and homes during severe rain. Flooding from Shire River overflow and drain off from mountains had always prevented this village from being rich. After initiation of WSC there seemed to be hope. Mbangu villagers visited the Namakande watershed site as part of their capacity building. Some watershed treatment structures were not maintained and some reversed.
Wells downstream from WALA activities seem to have more water. Villagers know this by measuring the water level against the brick lines of the wells. The linkage between WSC and downstream irrigation discharge was trained into them.

73
After WALA FGD respondents noticed that soils were more stable (i.e. rainwater did not wash away soil) and vegetable production increased. With irrigation farmers grow cabbage, Chinese cabbage, eggplants, okra, onions, pepper, bananas, papaya, tomato, and amaranth. All crops had been planted previously but planting frequency (i.e. more rotations) increased after WALA. Papaya are planted around homesteads and irrigated areas as fruit trees require protection against animals.
The marketing groups established during WALA were maintained and are still collectively producing and marketing sesame. In fact, several marketing groups have come together to create marketing clusters. Groups or clusters sell sesame to a broker who then sells to the buyer, Transglobal. Selling collectively yields a better price. Group members are also able to standardize their quantity units (i.e. bag size/weight) and demand higher prices for bulk sales. Marketing information is more available and prices are consistent from one marketing group member to the next.
VSLs began in 2010. Groups really started growing in 2011 after villagers observed the benefits earned by first formed VSL members. Also, VSL start-up was staggered as training took place and overall technical competency grew. VSL groups have increased from the 5 that were formed during WALA to more than 30 now. PSPs certified under WALA are still working and helping VSL groups. Villagers prefer to save in VSLs to avoid transport costs to distant bank branches and the transaction costs of formal banking. Formal banks also make it harder for depositors to access their money than VSLs. VSL share outs have been invested in goats, chickens, roofing sheets, solar panels, school fees and businesses. Payouts and loans can get has high as MK100,000. FGD respondents stated that with the income they receive from irrigation loan repayment is not a problem. VSL group liability also means struggling members are “brought along” to repay loans. Men have started forming their own VSLs.
Activities that didn’t exist before WALA were watershed management/water harvesting, MCHN, lead farmers, collective marketing/marketing club clusters, CA. Ranked in order or importance by FGD respondents: 1) VSL; 2) conservation agriculture; 3) water harvesting; 4) MCHN.
The PSP joined the FGD upon request. She was a Community Agent who passed an examination to receive PSP certification. The examination included a test of PSP trained VSL members and their understanding of VSL procedures and requirements, especially how to calculate interest and share outs. If the VSL members did not show understanding, or the CA did not pass the written exam, she/he was trained further. If eventually the CA could not pass the written exam then s/he was told becoming a PSP was not possible.
The VSL approach is to sensitize community leaders about VSLs and if those leaders feel it is a plausible activity they convoke community members. After the VSL members are selected from

74
those who respond to the leader’s invitations, they are trained. The first training is on the value of, and how to, save. After one month of training in savings, the VSL members begin to contribute to their individual savings accounts Then the concept of interest and lending are taught. Once those concepts are well understood the VSL begins making loans and receiving repayments. Then the idea of payouts (share outs) is taught. And so on. At the end of the year payouts occur. Then the second VSL cycle begins. The length of the cycle is determined by the VSL members. The PSP provides the VSL training for free but WALA encouraged VSL members to provide some form of gratuity to the PSP. There were two PSPs in Mbangu serving 14 and 16 VSLs respectively.
FGD respondents stated that the FFW oil and beans improved infant and parent health and were much valued.
Female FGD member pointed to neem and gliricidia trees in nearby fields. In managing the protected government forests community members were trained to identify indigenous tree species and obtain and protect seed so they could reforest with seedlings. Trees were also planted around homesteads. She stated that she learned that WSC best begins at the top of the watershed then works down.
The Tshivale River was near the town center so villagers planted trees along its banks. As part of participatory planning they decided they should use river water for irrigation. This support did not materialize before WALA ended but now the GOM is supporting irrigation development (night reservoir digging and canal construction).
Outcomes Due to the watershed treatments soil erosion has decreased. The flooding of villages and homes has been reduced as treatments slow rain water runoff. Watershed structures have improved rainwater harvesting and the percolation of water into the soil increasing the water table and the water level in wells and in the river. .
Watershed development has helped farmers to increase their yields. However, since the coverage of the watershed is small they haven’t been able to benefit as much as if the watershed covered a large area. Households that combine rain-fed farming and downstream irrigations are more food secure than those that rely solely on rainfed farming.
Farmer family income (access to finance) has increased due to VSL participation. Beneficiaries are able to supplement food with FSL financed food purchases when they don’t have enough. They are now able to pay for their children’s education, purchase livestock, build better houses, etc.
FGD respondents said that food security issues have changed. Specific households may still require food aid assistance but not as many. So any food aid delivered is targeted to those households that need assistance. The 2015/16 El Nino was very severe. Everybody was badly affected. There had previously been floods in 2014/15. Then a severe dry spell that even stopped

75
the irrigation. The 2015/16 El Nino drought followed upon this. In 2016/17 there was some improvement.
With reference to climate change, the FGD discussant stated that the watershed concept relies on harvesting rain to go into the water table. If there is drought there isn’t much watershed management can do. Thus, they are thinking of making their irrigation bore holes deeper.
Capacity building included leadership training that, to the FGD discussants, included the ability to recognize and access skills held by other villagers. They would still like communities to request their expertise and watershed development skills but they don’t force themselves on others who are not interested.
Conclusions Mbangu watershed development beneficiaries are more resilient to floods than they are to drought. Watershed management structures have reduced flooding and increased rain fed and irrigated farming yields. Farm households are better able to produce what they need for consumption and sale. Farming integration with other activities such as VSL has helped the farmers in improving their livelihoods and mitigating shocks. However, the experience of the 2015/16 El Nino showed that most families that have benefited from watershed management were still vulnerable and required assistance. Due to the dry spell, the technologies die not yield the intended results as they require a lot of water to recharge the water table. While there is a positive difference between WALA communities and non-WALA communities during floods (i.e. WALA communities were less affected) it was found that there was not much difference between WALA and non-WALA communities during the 2015/16 El Nino.

76
SITE VISIT REPORT
Mbeluwa Watershed and Irrigation Scheme70
District Zomba Traditional Authority Mlumbe GVH Mbeluwa Implementing Partner Save the Children Watershed Target/Treated Hectares 300 has targeted/102 has treated Total FFW Months/Beneficiaries 14 months/1200 beneficiaries Watershed Treatments: Years Constructed, #Months Worked, #FFW Beneficiaries
2010/2011, 5 months, 350 beneficiaries 2011/12, 6 months, 400 beneficiaries 2012/13, 3 months, 450 beneficiaries
Total FFW Oil/Beans (kgs) 20,207 kgs oil/82,500 kgs beans Total Meters Primary Structures 13,890 meters Check Dams/Trees Planted 224 check dams/13,560 trees planted Resiliency Score/Rank (37 points/15 ranks)71 27 points/5 rank (tied) Rapid Assessment Visit Date December 17, 2017
Introduction WALA was initiated in 2009. Mbeluwa watershed development began in 2010. The watershed covers an area of about 115 hectares. Watershed development activities included reforestation (fruit and leguminous trees), vetiver planting, check dams, CCTs, stone bunds, “infiltration pits” and marker ridges. Treatment construction was done under FFW. Each FFW beneficiary received 4 litres of cooking oil and 15kg of beans for 20 days of work.
WALA supported irrigation system development including a night reservoir, weir and concrete conveyance canals. Irrigation was not a new to the community but how WALA organized scheme members to plan, coordinate and accomplish scheme expansion was new. The irrigation scheme
covers an area of about 6 hectares. The canal is about 150 meters from the weir to the night reservoir. After survey and design in 2009 150 FFW beneficiaries constructed the night reservoir and the canals beginning in 2010. Maize, beans, strawberries, peas, tomatoes and leafy vegetables are grown under irrigation during winter cropping.
70 These statistics were compiled by CRS in a spreadsheet entitled “CRS WALA Watershed Sites”. Some statistics may vary from what was reported during rapid assessment FGDs and KIIs. 71 With ties there are 17 possible rankings for the 24 watershed sites visited.

77
WALA introduced VSL groups, PSP, MCHN care groups, kitchen gardens, DRR groups and improved crop husbandry practices such Sasakawa, ridge alignment, agroforestry, CA, mulching, mixed cropping and manure making.
Methodology The Mbeluwa watershed visit was conducted by the assessment team with assistance from CRS who provided FGD organization, translation, and technical support. There were 11 FGD respondents (5 men and 6 women) from the WMC and VDC and a headperson representative. Women hardly participated in the FGD. WMC members accompanied the visitors to the watershed site where additional information was obtained and photos taken.
Output Most watershed structures were still intact. Some CCTs in the fields were not maintained by field owners. Some check dams were broken and some stone bunds needed maintenance. Nonetheless, most of the CCTS and stone bunds were in good shape, check dams had reclaimed farm land, and tree planting is a continuous and very common community practice. One FGD respondent stated that other communities have visited watershed sites to learn about treatments.
The watershed does not directly feed into the stream used for irrigation. Watershed development was intended to protect irrigation scheme infrastructure.72 The area under irrigation has not increased post-WALA.
The number of farmers practicing CA (i.e. mulching, pit planting) has decreased. Most farmers burn their crop residues due to a belief that it fights fall army worm infestation. Only the FEF is doing CA. There was a “message” going around the community, allegedly from MOA, that farmers should burn their maize stalks. A good number of farmers still apply manure in their fields and have reduced their ridge spacing to 75cm. Most farmers have adopted Sasakawa.
The number of VSL groups have increased in WALA and non-WALA sites. Kitchen gardens cultivation has also
increased. Most women still make use of the skills gained from MCHN care groups.
A women FGD respondent explained how WALA introduced VSLs and clearly explained how irrigated farm production and sales and VSL savings and loans were linked and resulted in higher household income.
72 Personal communication from CRS representative.

78
Outcomes Watershed structures reduced the speed of rainfall runoff which in turn increased the water table. Most wells have high water levels. Women used to wake up as early as 3am to fetch clean water. This is not the case at present. Soil erosion has been controlled and soil fertility restored. The increased water table and good crop husbandly practices increased crop yields.
Income for farming families in the irrigation scheme has increased. They use the money obtained through irrigation to buy farm inputs and other things. Some of the money is invested in VSL groups.
VSL groups have increased member financial resource access. Members are now able to pay for their children’s education and buy livestock, farm inputs, clothes, food and household needs. Some have built houses with iron sheets and installed electricity using loans and share outs. Other VSL members have started businesses. There is one PSP in the community and each group pays him MK300/month.
There was a lively debate comparing the importance of VSLs and irrigation. A woman FGD respondent described how she bought iron roofing the 1st year she participated in VSL, purchased burned bricks the 2nd year of participation; then hired a mason/carpenter for house construction the 3rd year. She is now saving to install electricity. She also has a kitchen garden (although upon observation the garden was under the same crops as her fields, perhaps with the exception of a few sunflowers, and was not fenced).
Malnutrition cases have decreased in the community. Most under 5 children and lactating mothers are healthy. This was attributed to WALA project.
The 2015/16 El Nino did not have much impact on the community compared to non-WALA communities. Some FGD respondents said they were more resilient to drought due to improved farming practices and irrigation. Other FGD respondents stated that while they felt the famine in 2001 in subsequent years they didn’t really experience famine, even during the 2015/16 El Nino.
Conclusion The community is still not entirely food secure. Most farm families are still vulnerable. Irrigation is only done by a few community members. Though the EL NINO did not have much impact on the WALA beneficiaries in the community, most non-WALA community members did not harvest enough food and still required food aid.

79
SITE VISIT REPORT
Mitumbira Watershed Scheme73 District Mulanje Traditional Authority: Chikumbu GVH Mitumbira Implementing Partner Africare Watershed Target/Treated Hectares 128 has targeted/80 has treated FFW Months/Beneficiaries 5 months/200 beneficiaries Watershed Treatments: Years Constructed, # Months Worked, # FFW Beneficiaries
2011/12, 2 months, 75 beneficiaries; 2012/13, 3 months, 125 beneficiaries;
Total FFW Oil/Beans (kgs) 1,929 kgs oil/7,875 kgs beans Total Meters Primary Structures 31,628 meters Check Dams/Trees Planted 728 check dams/16,000 trees planted Resiliency Score/Rank (37 points/17 ranks)74 23 points/9 rank (tied) Rapid Assessment Visit Date December 11, 2017
Introduction The Mitumbira community was experiencing food insecurity due to droughts, soil erosion and gullying. Then WALA came in with the watershed management idea. WALA started by sensitizing the community before they established the watershed in 2010. WALA then trained LFs to lead watershed management. Watershed management and technical committees were created each composed of 10 elected members. Watershed development workers were compensated with FFW. One hundred FFW beneficiaries, mostly women, worked on the watershed. Watershed treatments included check dams, CCTs, stone bunds, vetiver and tree planting. FGD participants stated that during WALA they constructed 1,462 check dams and 4,767 CCTs.
Most community members devoted their time working on watershed development to obtain the 4 litres of cooking oil and 15 kg of beans they received. After WALA left the number of watershed development workers dropped significantly. Nonetheless, some community members still continued watershed development activities after WALA Women are the most actively involved community members and dominate WALA activities in general.
WALA introduced CA, dams, VSLs, PSPs and Paravets (Community Animal Health Care Workers). Through MCHN care groups pregnant women and breastfeeding mothers were taught to prepare
73 These statistics were compiled by CRS in a spreadsheet entitled “CRS WALA Watershed Sites”. Some statistics may vary from what was reported during rapid assessment FGDs and KIIs. 74 With ties there are 17 possible rankings for the 24 watershed sites visited.

80
nutritious food with local ingredients. They still apply those cooking methods today. MCHN training improved greatly improved maternal and child health in the Mitumbira community.
Methodology The Mitumbira watershed visit was conducted by the assessment team with assistance from CRS who provided FGD organization, translation, and technical support. The FGD comprised of male and female WMC members. The assessment team was accompanied by an MOA extensionist. Pictures of the site were taken.
A group of women Watershed Management Committee members accompanied the assessment team to their fields. There was little to see in terms of WALA structures as treatments had been implemented on another distant part of the watershed. On our way to the fields we passed a group of men who told the women in Nyanga “Tell them we are poor.” On our return from the fields we saw why the men were so boisterous…. a nearby traditional alcohol still operated by a woman. There were also partially burnt Chibuku containers in a nearby fire pit. When we passed these men again they cried “African beer” and “Food for Work” in English.
We returned to the village and sat with these women, and two male WMC members, and discussed various issues. When asked, one FGD respondent declared that the MCHN interventions were the most beneficial.
When we eventually did see the Mitumbira watershed treatments structures (after the Nangombe site visit) the Mitumbira women did not accompany us. The treatments were very far from their village. We observed treatment structures from the top of the watershed, adjacent to a Cellphone Repeating Tower (and the best views of Mt. Mulanje). There were stone bunds, check dams and CCTs visible, with vetiver planted along the bunds. The watershed sloped gradually away from us into the valley so it was difficult to see distant treatments. The most striking aspect of this observation was the old woman cultivating maize
in between large rocks and boulders at the top of the mountain. The maize seemed to inexplicably grow in a few inches of dry soil. On our return down the hill we met a man carrying a 50 kgs fertilizer bag on his bike up the road towards where the woman was cultivating. At this point the soil is simply a medium to hold fertilizer in that difficult to farm plot.
Outputs After WALA ended some community members continued
working on the watershed. They increased the number of check dams from 1462 to 1534 and planted trees. Unfortunately, most of trees planted during WALA died. The watershed treatment maintenance depended on the field owner. Most check dams and CCTS were not maintained. This is resulting in the formation of new gullies.
The women pointed to three distant fish ponds constructed during WALA implementation. They described these ponds as not functioning as intended due to neglect. Two of the three ponds dried up without a fish harvest while the third was destroyed during a recent heavy rain (either the dam broke or they pond silted up to overflow).

81
Most community members belong to a VSLs and the number of VSLs has grown. Community members appreciated the ability to save and access loans and have invested loan and share out proceeds in livestock, farm inputs, education and small businesses. The community has one still active PSP who trains new VSL groups and helps in calculating share outs.
Outcomes Watershed development has benefited the community in several ways. The stone bunds and marker ridges have greatly reduced the speed of running water. As a result, soil erosion has decreased. Check dams have reclaimed arable land. Land which was previously not productive due to gullying is now being cultivated by some farmers. The water harvested by stone bunds and CCTs percolates into the soil increasing the water table. This has helped some beneficiaries continue producing maize during rainy season dry spells. This means increased maize harvests. However, fall army worms have severely affected most maize plots in the watershed.
VSLs have increased most households access to finance. Some VSLs members who previously lived in damp grass thatched houses now have houses with iron sheet roofs. Other VSL members started small businesses (e.g. selling mandazi). Some members pay their children’s school fees (which they were unable to do before WALA), others bought livestock, farm inputs and food with loans and share outs.
Very few farmers still practice CA. The find the soil too rocky for CA and minimum tillage. Others stopped CA when termites attacked their fields with maize stalk mulch. When possible, most farmers still apply manure in their fields.
Food aid was needed by the community during the 2012 and 2015/16 droughts. However, during the El Nino the community needed less food compared to 2012. Though they did not harvest much, some farmers still harvested a little maize. WALA interventions helped to a degree. There is a synergy between VSLs, livestock production and food production. Some farmers sold their livestock and some used money from VSL groups to buy food during the El Nino.
Conclusion To a large degree, and as described by FGD respondents, Mitumbira watershed development has benefited the community. Check dams and stone bunds have reduced soil and gully erosion by slowing the velocity of rain run-off. VSLs have increased household access to savings and loans they didn’t enjoy prior to WALA. The investment of these resources in improved housing, livestock, farm inputs and education has increased their ability to withstand weather caused shocks. However, perhaps due to the distant location of the majority of watershed treatments, the treatments are not being maintained. In addition, three fish/irrigation ponds constructed during WALA are not functioning and most community members attest to having only worked on watershed treatments to receive FFW compensation. Finally, CA and other forms of improved crop husbandry did not take hold and army work infestation was a significant problem.
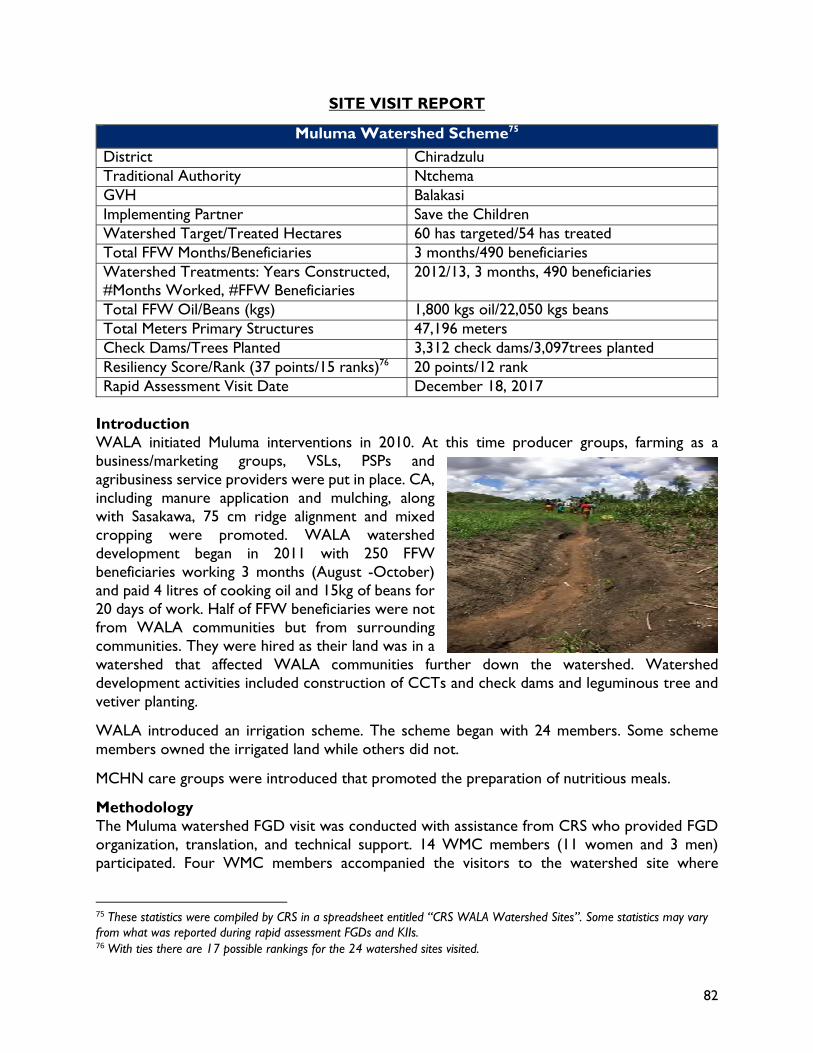
82
SITE VISIT REPORT
Muluma Watershed Scheme75
District Chiradzulu Traditional Authority Ntchema GVH Balakasi Implementing Partner Save the Children Watershed Target/Treated Hectares 60 has targeted/54 has treated Total FFW Months/Beneficiaries 3 months/490 beneficiaries Watershed Treatments: Years Constructed, #Months Worked, #FFW Beneficiaries
2012/13, 3 months, 490 beneficiaries
Total FFW Oil/Beans (kgs) 1,800 kgs oil/22,050 kgs beans Total Meters Primary Structures 47,196 meters Check Dams/Trees Planted 3,312 check dams/3,097trees planted Resiliency Score/Rank (37 points/15 ranks)76 20 points/12 rank Rapid Assessment Visit Date December 18, 2017
Introduction WALA initiated Muluma interventions in 2010. At this time producer groups, farming as a business/marketing groups, VSLs, PSPs and agribusiness service providers were put in place. CA, including manure application and mulching, along with Sasakawa, 75 cm ridge alignment and mixed cropping were promoted. WALA watershed development began in 2011 with 250 FFW beneficiaries working 3 months (August -October) and paid 4 litres of cooking oil and 15kg of beans for 20 days of work. Half of FFW beneficiaries were not from WALA communities but from surrounding communities. They were hired as their land was in a watershed that affected WALA communities further down the watershed. Watershed development activities included construction of CCTs and check dams and leguminous tree and vetiver planting.
WALA introduced an irrigation scheme. The scheme began with 24 members. Some scheme members owned the irrigated land while others did not.
MCHN care groups were introduced that promoted the preparation of nutritious meals.
Methodology The Muluma watershed FGD visit was conducted with assistance from CRS who provided FGD organization, translation, and technical support. 14 WMC members (11 women and 3 men) participated. Four WMC members accompanied the visitors to the watershed site where
75 These statistics were compiled by CRS in a spreadsheet entitled “CRS WALA Watershed Sites”. Some statistics may vary from what was reported during rapid assessment FGDs and KIIs. 76 With ties there are 17 possible rankings for the 24 watershed sites visited.

83
additional information was obtained and photos taken. A GOM agricultural extensionist, who had recently been assigned to the area, was present during the FGD and site visit. The FGD was not organized in advance and respondents appeared a bit frustrated with the visit and having to travel to the watershed treatment sites far from their village (i.e. further up the watershed).
Outputs There was no maintenance or expansion of watershed treatments. In fact, few treatments were evident. Most land owners reversed treatments that had been constructed on their fields. Some check dam stones were removed from gullies and used to create field boundaries. This happened after WALA ended. A male FGD respondent who accompanied the assessment team to the
watershed site stated that “there were CCTS all over” but not one was visible. He stated that after CCT construction there was more water in the irrigation scheme for two years. Now that the CCTS have filled up (or been filled up) they are having no discernible effect. Gullies where check dams had been placed and removed were evident and seemingly more severely eroded.
Field owners were not motivated to maintain treatment structures without compensation. Structures constructed uphill to harvest water that would affect downhill water availability were in non-WALA villages (including an area that
was under a different chief). After WALA ended the land owners took back their land and reversed the structures.
There are only a few farmers still practicing good agricultural practices such as CA and Sasakawa. There was little evidence that farmers practiced 75 cm ridge alignment.
VSL groups created during WALA and are still functioning. The number of VSL groups has increased. There are two PSPs working with the groups.
There are only 14 irrigation scheme members, down from the 24 members that initiated the scheme. As the water level is low they use treadle pumps to irrigate 2 acres. The maize they produce is marketed collectively. During El Nino there was inadequate water in the river for irrigation.
There was a large untended irrigated farming area in a dambo directly adjacent to the fields where watershed treatments had been constructed and reversed. The FGD respondent who accompanied the assessment team knew little about this irrigated field. Tomatoes, maize and tobacco were being grown but the field was heavily infested with weeds. The gullies where check dams had been reversed flowed into this dambo. There was also a small stream running through it.

84
This watershed development site was flat and very dry with sweet potatoes showing signs of dehydration and failing. The only trees in the area were on the horizon where graveyards were located. When asked about the trees the GOM extensionist replied: “Only the dead plant trees in Malawi.”
Outcomes During and after WALA watershed treatments recharged the river for two years. As a result of unmaintained treatments river flow has decreased as has the amount of land used for irrigated farming. Farmers that do irrigate are able to produce two crops per year. Most of the irrigated crops are for sale. Thus, irrigated farmers have higher incomes from selling maize or other cash crops.
VSLs have improved household access to finance. VSL members are now able to buy livestock, farm inputs, clothes, pay school fees and construct improved housing. VSL membership has motivated individuals to open businesses that enable loan repayment and a profit.
The nutritious meal cooking lessons taught through MCHN care groups have helped reduce malnutrition.
Even though CCTs helped raise the river’s water level, as the treatments were located in fields owned by farmers who were not irrigation scheme members they not realize any benefits, and were reversed. These non-irrigation scheme members also did not benefit from other WALA interventions.
The best-looking plot in the area was planted by a female WMC member. It was a CA demonstration plot with compost, indigenous leguminous trees and cassava planted along the marker ridge tops. It was sponsored by the GOM Farmer Field School being implemented in the area.
FGD respondents stated that the entire village needed food aid during El Nino.
Conclusion Muluma watershed structures managed to harvest water for the irrigation scheme but due to a lack of maintenance the water table has dropped, river flow decreased, and irrigated area reduced. Irrigation is now done by only a few households implying that the number of households that are more food secure is small. VSLs are a success in this community and have spread out to other communities. However, it would appear that VSLs are not enough to make this former WALA community resilient as irrigated farming income that might generate money for savings, and eventual VSL lending, was limited to very few households. This was shown during the 2015/16 El Nino. Most people were unable able to stand on their own without food aid whether they were WALA or non-WALA communities.
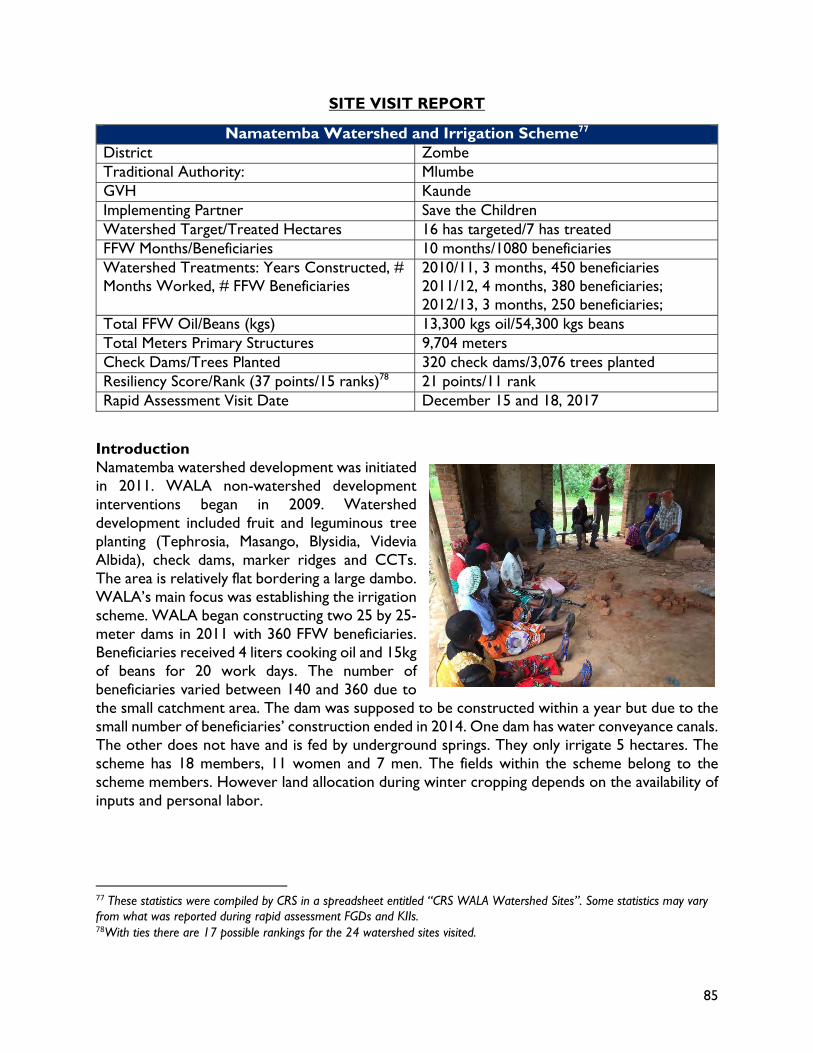
85
SITE VISIT REPORT
Namatemba Watershed and Irrigation Scheme77 District Zombe Traditional Authority: Mlumbe GVH Kaunde Implementing Partner Save the Children Watershed Target/Treated Hectares 16 has targeted/7 has treated FFW Months/Beneficiaries 10 months/1080 beneficiaries Watershed Treatments: Years Constructed, # Months Worked, # FFW Beneficiaries
2010/11, 3 months, 450 beneficiaries 2011/12, 4 months, 380 beneficiaries; 2012/13, 3 months, 250 beneficiaries;
Total FFW Oil/Beans (kgs) 13,300 kgs oil/54,300 kgs beans Total Meters Primary Structures 9,704 meters Check Dams/Trees Planted 320 check dams/3,076 trees planted Resiliency Score/Rank (37 points/15 ranks)78 21 points/11 rank Rapid Assessment Visit Date December 15 and 18, 2017
Introduction Namatemba watershed development was initiated in 2011. WALA non-watershed development interventions began in 2009. Watershed development included fruit and leguminous tree planting (Tephrosia, Masango, Blysidia, Videvia Albida), check dams, marker ridges and CCTs. The area is relatively flat bordering a large dambo. WALA’s main focus was establishing the irrigation scheme. WALA began constructing two 25 by 25-meter dams in 2011 with 360 FFW beneficiaries. Beneficiaries received 4 liters cooking oil and 15kg of beans for 20 work days. The number of beneficiaries varied between 140 and 360 due to the small catchment area. The dam was supposed to be constructed within a year but due to the small number of beneficiaries’ construction ended in 2014. One dam has water conveyance canals. The other does not have and is fed by underground springs. They only irrigate 5 hectares. The scheme has 18 members, 11 women and 7 men. The fields within the scheme belong to the scheme members. However land allocation during winter cropping depends on the availability of inputs and personal labor.
77 These statistics were compiled by CRS in a spreadsheet entitled “CRS WALA Watershed Sites”. Some statistics may vary from what was reported during rapid assessment FGDs and KIIs. 78With ties there are 17 possible rankings for the 24 watershed sites visited.

86
Scheme members grow cash crops like Irish potato, beans, tomatoes, onions, maize and leafy vegetables. They limit their irrigated area to conserve dam water as they also produce fish in the ponds.
WALA introduced improved farming practices like ridge alignment, Sasakawa, CA; mulching, mixed cropping and manure making. It introduced VSL, farming as a business, and MCHN activities.
Methodology The Namatemba watershed and irrigation scheme visit was conducted by the assessment team with assistance from CRS who provided FGD organization, translation, and technical support. There were 10 FGD respondents (3 men and 7 women). They were WMC and irrigation scheme members. The site visit and FGD were done on separate days due to a funeral in the village. The FGD was dominated by one man. The women usually sat quietly with expressionless faces (perhaps due to death in the village of the headman’s family member), except when talking about VSLs, and whether they were more important than irrigation. That was a lively discussion. Five WMC members accompanied the visitors to the watershed and irrigation site where additional information was obtained and photos taken.
Output Although the field treatments were barely visible (we saw some evidence of marker ridges, CCTs, vetiver, disassembled check dams) the night reservoir and irrigation ponds were impressive and in operating condition. As it was the rainy season the irrigation area was not being cultivated and seemed to be about 4-5 hectares. Almost all the watershed treatments were not maintained. Most field owners reclaimed their land and reversed the structures. Some farmers planted cassava on marker ridges. Scheme members did not see the need for treatment maintenance as their dams usually have water throughout the year. A bore hole with cloudy water where the women draw their household water was photographed. Scheme women complained that the water used to clear immediately after WALA’s watershed treatments. When asked why they didn’t maintain the treatments to improve the water quality the women stated that they are awaiting FFW.
All farmers dropped CA due to high soil moisture content and termites. Several farmers reduced their ridge spacing to 75cm and still apply manure.
The number of VSL groups has increased in both WALA and non-WALA sites. Most women still make use of the skills gained from MCHN care groups and many households have kitchen gardens.

87
Outcomes Farmers noted that their crop production had increased post-WALA. Some attributed improved yield due to increased plant population due to reduced ridge and plant spacing. Irrigation scheme member production increased greatly. In addition to irrigation scheme members other non-scheme members grow crops under irrigation with water from their own dams. This has greatly increased community food availability. Farmers growing crops under irrigation had more food than those relying on rain fed farming during the 2015/16 El Nino cropping season. Some community members who harvested something during EL NINO shared their food with the needy.
VSL groups have increased savings and loan access in the community. Some households are now able to pay for their children’s education, run small businesses, buy livestock, farm inputs, solar panel, farming land, clothes, food and other household needs. Some have built houses with iron sheets and installed electricity using the money obtained from VSL groups. (A company called Powered by Nature sold most VSL members solar power panels for stereos, lights, phone chargers.) There is one PSP in the community and each group pays him MK1000/month.
Malnutrition cases have reduced in the community. Most under 5 children and lactating mothers are healthy. This was attributed to WALA.
The El Nino did not have much impact on the community compared to non-WALA communities. Some farmers were resilient to the drought.
Conclusion The community has been able to attain low levels of resilience. While lack of watershed treatment maintenance may risk this resilience over time the dambo area is significant and draws moisture from watersheds located far from this community. VSL’s have increased member purchasing power significantly. In conjunction with improved housing and solar panels the quality of life impact could be significant.

88
SITE VISIT REPORT
Namilongo Watershed and Irrigation Scheme79
District Zomba Traditional Authority GVH Mkanda Implementing Partner Save the Children Watershed Target/Treated Hectares 120 has targeted/45 has treated Total FFW Months/Beneficiaries 4 months/270 beneficiaries Watershed Treatments: Years Constructed, #Months Worked, #FFW Beneficiaries
2011/2012, 2 months, 150 beneficiaries 2012/13, 2 months, 120 beneficiaries
Total FFW Oil/Beans (kgs) 1,984 kgs oil/8,100 kgs beans Total Meters Primary Structures 27,088 meters Check Dams/Trees Planted 4,952 check dams/13,605 trees planted Resiliency Score/Rank (37 points/15 ranks)80 27 points/5 rank (tied) Rapid Assessment Visit Date December 15, 2017
Introduction Namilongo watershed development began in 2011. The irrigation scheme had already been established at that time. Nonetheless, WALA helped irrigation scheme members organize to improve scheme infrastructure and address other issues.
Namilongo community members were experiencing severe soil erosion, especially farmers whose fields were on hilly land. WALA mainly targeted irrigation scheme when organizing for watershed development. With WALA support 72 scheme members, from 3 villages (Peter Mtenga, Robertson) initiated watershed development with fruit and leguminous tree and vetiver planting and constructing marker ridges, stone bunds, check dams, CCTs and WATs. During watershed development workers were given 7 hoes, 6 picks, 1 axe and 2 wheel barrows.
The irrigation scheme covers an area of about 8 hectares. It consists of 125 members, 110 women and 15 men. Before WALA some of the plots within the scheme lay fallow during winter cropping. After WALA organized the farmers they decided that all the scheme land should be cultivated whether by the owner or, by another farmer on behalf of the owner. In addition, some scheme members own more land than other scheme members. As an example of unity and a sense of common purpose scheme leaders decided that all land should allocated to scheme members
79 These statistics were compiled by CRS in a spreadsheet entitled “CRS WALA Watershed Sites”. Some statistics may vary from what was reported during rapid assessment FGDs and KIIs. 80 With ties there are 17 possible rankings for the 24 watershed sites visited.

89
equally. The chief from the village where the scheme is located has a plot within the scheme but is not a scheme member.
Towards project end WALA and scheme members decided to expand the irrigated area. WALA bought the pipes for the expansion but did not assist in their installation due to limited time. The pipes are still uninstalled.
Each member of the scheme pays a membership fee of MK500. After selling their irrigated crops, each member pays MK1000 into the scheme account.
WALA introduced group marketing with a committee that controls the scheme’s sale of food crops. The scheme sells crops, especially green maize, plot by plot. If the market is too flooded and prices very low they leave most of the maize in the field to dry and use it for own consumption.
WALA also introduced CA (mulching, minimum till, manure), Sasakawa, mixed cropping, 75 cm
ridge alignment, VSL groups, PSPs, agribusiness service providers, paravets and MCHN care groups in the community.
Methodology The Namilongo watershed visit was conducted by the assessment team with assistance from CRS who provided FGD organization, translation, and technical support. There were 8 FGD respondents (4 men and 4 women). They were WMC members and drawn from three villages. WMC members accompanied the visitors to the watershed site where additional information was obtained and photos taken.
Output Irrigation scheme members have maintained and expanded watershed treatments. Since WALA’s complete WATS that were 300 meters long have been lengthened to 563 meters; CCTs that were 1,200 meters long have been expanded to 2015 meters. The number of marker ridges, check dams and stone bunds have also increased. The community members took ownership of watershed development after WALA and maintained and expanded treatments with no external compensation. They were motivated by the benefits of watershed development that they had observed. The watershed structures slowed rain runoff increasing infiltration and significantly reducing soil erosion. The
watershed committee has 6 members who monitor watershed structures. If there is need to maintain, they call up on all the scheme members.

90
Since WALA left in 2014, the number of scheme members has increased from 72 to 125. The irrigated area has also expanded. Maize, tomatoes, onions and leafy vegetables are the crops grown under Namilongo irrigation scheme.
The number of VSL groups has increased in both WALA and non-WALA sites. VSL loans and share outs are used by members to purchase livestock, farm inputs, and pay for children’s education and start businesses. VSLs have increased community member access to loans and savings services. Women still apply the skilled they acquired through MCHN care groups in their homes.
Outcomes The increased water table and good crop husbandry practices have increased rainfall farming yields. The amount of food production in the community has increased because scheme members grow maize and other food crops twice a year. After harvesting irrigated crops scheme members give the FEV and community chiefs little “tokens of appreciation”.
Irrigation scheme members have increased farm income. With this increased income some beneficiaries have constructed houses with burnt bricks and iron sheets. Others have bought livestock and farm inputs and manage to pay school fees for their children. They were unable to make similar expenditures before WALA. As a scheme, beneficiaries managed to buy 9 treadle pumps from the annual contributions which every scheme member makes after crop sales.
The 2015/16 EL NINO affected the community. The stream dried out. Farmers close to the stream dug wells in the streambed and continued irrigating their fields. Most farmers were resilient to the
drought and did not require food aid. The El Nino affected non-WALA communities more severely than WALA communities.
VSLs have increased the purchasing power of most households in the community. Some scheme members keep some money obtained through irrigation at the VSLs. The VSLs in turn lend that money out, increasing money velocity. VSL members receive share outs of their savings and interest towards the end of the year. Some farmers have built houses with iron sheets from VSLs share outs, bought livestock, pay school fees, and buy farm inputs. Most farmers in the community use money from VSLs to buy farm inputs which in return increases their yield, making them more food secure. The community reported that they give a little something to the PSP for the assistance they render to VSL groups. However, it is not mandatory.
The health status of the community members especially under five children, pregnant and lactating mothers has improved. Due to the increased incomes, most farm families can afford to buy food of different food groups thereby improving the nutrition status of household members.

91
Conclusion Most of the community members have attained higher levels of resilience. Much of the resilience was attributed to WALA interventions. Most of the community members were able to bounce back during EL NINO because of the irrigation scheme and VSL groups established by WALA.

92
SITE VISIT REPORT
Nang’ombe Watershed Scheme81 District Mulanje Traditional Authority: Chikumbu GVH Mitumbira Implementing Partner Africare Watershed Target/Treated Hectares 297 has targeted/122 has treated FFW Months/Beneficiaries 7 months/571 beneficiaries Watershed Treatments: Years Constructed, # Months Worked, # FFW Beneficiaries
2010/2011, 1 month, 300 beneficiaries; 2011/12, 3 months, 146 beneficiaries; 2012/13, 3 months, 125 beneficiaries;
Total FFW Oil/Beans (kgs) 4,089 kgs oil/16,695 kgs beans Total Meters Primary Structures 18,249 meters Check Dams/Trees Planted 1095 check dams/22,820 trees planted Resiliency Score/Rank (37 points/15 ranks)82 36 points/6 rank (tied) Rapid Assessment Visit Date December 11, 2017
Introduction WALA watershed development in Nang’ombe was initiated in 2010. Prior to initiation community members’ experienced prolonged dry spells, soil erosion, gully formation and flash flooding. Ten-member WMC and technical committees were established to help design and organize the work. Watershed development interventions included stone bunds, CCTS, check dams, indigenous, leguminous and fruit tree planting and nursery and vetiver planting and nursery. Watershed development started with 135 FFW beneficiaries. The number increased as work expanded. FFW beneficiaries received 4 liters cooking oil and 15 kg beans for 20 days of work. Most beneficiaries were women.
FGD respondents pointed out that WALA watershed treatment construction was the first time they worked with others of their community or nearby communities. This may be a form of social capital building as communities learn how to organize members and realize what is possible when working in groups on relatively strenuous tasks.
WALA introduced producer and marketing groups, Sasakawa, CA (minimum till, pit planting, manure, mulching), ridge alignment, seed spacing, mixed cropping, VSLs, PSPs, Paravets and disaster response groups, kitchen gardens, and MHCN care groups.
81 These statistics were compiled by CRS in a spreadsheet entitled “CRS WALA Watershed Sites”. Some statistics may vary from what was reported during rapid assessment FGDs and KIIs. 82 With ties there are 17 possible rankings for the 24 watershed sites visited.

93
Methodology The Nang’ombe watershed visit was conducted by the assessment team with assistance from CRS who provided FGD organization, translation, and technical support. A FGD with WMC members was conducted. Observations were done on site and photos of watershed treatments taken. A female MOA extensionist accompanied the assessment team but was new to the area. This lively FGD took place near the road in front of a school. There was an equal balance between male and female participants, though one man dominated the discussion. Nonetheless, the women freely commented on what he was saying and there was much laughter and good humor.
Output There was much evidence that CCTs and check dams were not being maintained. There were pumpkins planted in the bottom of one unmaintained CCT. The accompanying CRS representative pointed out that not all farmers appreciate giving up hectarage to WSC structures and that CCTs are sometimes filled in once the project ends. Nonetheless these villagers seemed to value the long-term presence of watershed treatments in their fields. Check dams seemed poorly constructed and farmers complained that young boys moved check dam rocks looking for
rats. This then diverts the water that is supposed to be checked around the dam and down the slope to form another gulley.
When WALA FFW ended the number of community members working on the watershed dropped. Nonetheless some community members did maintain the treatments in their fields. Community members also continue planting indigenous and exotic trees along the Nang’ombe and Nkhongoni rivers, in the Nkhongoni mountain, in maize fields and around the primary school, and their homes.
The vetiver grass planted on the CCTs and along the field edges was being cut for goat feed and repairing the thatch rooves of latrines and kitchens. Farmers had planted cassava as field boundaries and to keep pedestrians on the path. In the midst of the watershed was a fallow field. When asked why this was uncultivated a FGD respondent stated that the field was going to be planted with sweet potato during the dry season. (This reinforced how hard it is to evaluate small farmer behavior. Watershed management structures may appear unmaintained at the time of the visit because weeds grow quickly and soil shifts with the rains but farmers during the rainy/growing season use their labor for more urgent priorities. Not knowing labor availability and watershed maintenance labor opportunity costs (i.e. own field husbandry or hiring labor out) makes it risky to judge WALA impact sustainability simply on a quick observation that the treatments appeared unmaintained.)
The area under CA (mulching) has diminished due to termites allegedly attracted by the maize stalk mulch. Kitchen gardens are mainly established during the dry season. Ridge alignment and seed spacing seem to have increased maize production and are much appreciated innovations.

94
Marketing groups were established during WALA but no longer exist. Group marketing in 2012 helped the farmers obtain higher prices than when they sold individually. In 2013 traders arrived late and as farmers had other needs to attend to they sold their produce to venders. An FGD respondent stated that the challenge with group marketing is that when one or two group members don’t adhere to the agreement the effort is wasted.
The number of VSLs has increased. Most community members belong to VSLs. Community members have increased their savings and access to loans and have been able to invest loan and share out proceeds in livestock, farm inputs, school fees, solar panels and other items. The community has PSPs who train new VSL groups and help in calculating share outs.
Most household’s nutrition status has improved due to kitchen gardens and the different recipes for preparing food for children and pregnant women they learned in MCHN groups. DRR used to encourage farmers to plant drought tolerant crops but no longer function.
Outcomes The watershed development, CA, ridge alignment, seed spacing and manure application resulted in increased water and moisture availability, land reclamation, increased soil fertility, and reduced run off and soil erosion. This in return resulted in increased rain fed crop yields.
Watershed treatments are not being maintained though there were some instances where they were maintained. Tree planting seems to be a sustainable watershed management activity that has continued post-WALA.
Group marketing had a beneficial impact one year but then groups dissolved when traders arrived late and members sold their produce to vendors the following year.
VSLs have increased access to financial resources for most households. Most household’s nutrition status improved due to kitchen gardens and the different recipes for preparing food for children and pregnant women.
The 2015/16 El Nino affected the community. Some WALA beneficiary members received food aid but not as many as in non-WALA communities. Although the drought was severe, a few farmers did harvest maize but not enough to make them food secure. Some VSL members used share outs to purchase food. Most farmers incorporate drought tolerant crops in their crop production, as previously recommended by DRR groups, to mitigate the effects of dry spells.
Conclusion Watershed treatments are not maintained although community members seemed to appreciate the impact they had on agricultural production. WALA interventions, including VSL groups, reduced the 2015/2016 El Nino impact to a certain extent. Marketing groups that would help farmers obtain higher prices for their output have not continued post-WALA. Ridge alignment

95
and seed spacing seem to have increased maize production during non-drought rainy seasons. The community is still not food secure and cannot be referred to as resilient.

96
SITE VISIT REPORT
Natama Watershed and Irrigation Scheme83 District Chiladzulu Traditional Authority: Ntchema GVH Nyimbiri Implementing Partner Save the Children Watershed Target/Treated Hectares 35 has targeted/24 has treated FFW Months/Beneficiaries 6 months/450 beneficiaries Watershed Treatments: Years Constructed, # Months Worked, # FFW Beneficiaries
2011/12, 4 months, 280 beneficiaries; 2012/13, 2 months, 170 beneficiaries;
Total FFW Oil/Beans (kgs) 5,364 kgs oil/64,316 kgs beans Total Meters Primary Structures 45,091 meters Check Dams/Trees Planted 5,376 check dams/3,651 trees planted Resiliency Score/Rank (37 points/15 ranks) 12 points/16 rank Rapid Assessment Visit Date December 18, 2017
Introduction WALA initiated activities in Natama in 2010. WALA introduced MCHN, sanitation and hygiene, DRR, farming as a business, and VSL groups. FFW supported watershed management interventions began in 2011. Watershed treatments were constructed by 270 FFW beneficiaries from two villages over eight months. Workers received 4ltrs of cooking oil and 15kg of beans for 20 days of work. Watershed activities included fruit and leguminous tree and vetiver planting, CCT, and check dam construction. WALA also assisted the community in constructing a gravity fed irrigation system with a weir, conveyance canals and night reservoir. Agricultural interventions included mixed cropping and manure making.
WALA did not introduce the irrigation scheme. Farmers previously irrigated with watering canes. WALA introduced the idea of a gravity fed system. The irrigated site covered 10 hectares of land during WALA, with 50 members. Farmers produced and sold tomatoes, onion, potatoes, maize and cabbage using irrigation. An irrigation committee was formed.
Methodology The Natame watershed visit was conducted by the assessment team with assistance from CRS who provided FGD organization, translation, and technical support. There were 20 FGD respondents (5 men and 15 women) the VDC Chairperson and an MOA extensionist. The FGD
83 These statistics were compiled by CRS in a spreadsheet entitled “CRS WALA Watershed Sites”. Some statistics may vary from what was reported during rapid assessment FGDs and KIIs.

97
was delayed as participants attended an earlier local government activity. Five WMC and irrigation scheme members accompanied the visitors to the watershed and irrigation site where additional information was obtained and photos taken.
Outputs The irrigation scheme expanded after WALA, increasing by 7 hectares. Scheme membership also increased from 50 to 110 members. However, a year later the weir failed as the dam was anchored to the river bank, instead of rock, making it less stable. Due to this the gravity fed system didn’t work rendering the night reservoir useless as well.
During the FGD, and prior to observing the site, respondents informed the assessment team that the irrigation scheme weir had failed, that there was no gravity irrigation for the scheme, and that the watershed treatments were not being maintained.
Some trees planted during WALA were evident (Keisha, Gliricidia and Nkundi).
A few people still practicing good agricultural practices such as mixed cropping and mulching. There was little evidence that farmers practice ridge alignment.
Most CCTs and check dams were not maintained. Most check dams were washed away by running water. Maintenance of the watershed structures is done by individual farmers on their
land and not as a group or committee.
The villagers had dug out a large night reservoir that was empty. It could only be filled if the weir directed water into the conveyance canals.
Some VSL groups created during WALA are still being maintained but most of them dissolved. Most villagers found them unprofitable.
Outcomes There were no watershed treatments on the up-river side of the weir. Treatments were situated below the weir. In the watershed there were several check dams in a watercourse. They had retained soil where maize and a mango tree were growing. Check dams that were completely “filled” were diverting water onto the edges of adjacent fields. These fields were gullying. The gully where the check dams were located was more a permanent water course than a rain water course. During team discussion it became apparent that these check dams would eventually create the same gullying problems they had previously solved. CCTs and/or WATS were needed further up the watershed to slow rain runoff, allow percolation into the hillside, and reduce the amount and velocity of water running through this and other gullies.
The watershed treatments increased soil moisture and reduced runoff when they were functional and maintained. This led to increased yields. High moisture content also indicated an increase in

98
the water table. This recharged boreholes and the river so that water for irrigation and other uses was more available. Due to lack of maintenance the river and boreholes now dry up for a few months.
A young male FGD respondent stated that watershed treatments did not improve agricultural production during El Nino as “they only work when it is raining and there was no rain” during El Nino.
The weir that would have directed river water into conveyance structures, night reservoir and irrigation canals was not anchored to rock. Three years after WALA’s end the dam lay broken in large pieces in the river. Its role at this point is to provide a dangerous bridge.
Before weir failure irrigation enabled two farming seasons. Farmers produced enough crop for consumption and sale. Now farmers are producing tomatoes with water cans and a rented motorized pump. The five treadle pumps that SAVE provided were inoperable. Low production coupled with poor prices had led many farmers to earn insufficient profits. There is no group marketing. There are 50 or more farmers now cultivating with irrigation. 17 are previous members of the scheme while others rent the motorized pump individually. Farmers do not market collectively. The 17 buy their seeds and fertilizer and then the money they have left over they pool to rent the pump.
The MCHN cooking helped in reducing malnutrition cases.
Conclusion Farmers from Natama watershed and irrigation scheme are not fully motivated to work for themselves without FFW. The lack of maintenance is attributed to these farmers not reaching a level of knowledge and understanding that they are responsible for their own success. After the weir failed people lost hope and appreciation for the value of working together. During the E l Nino in 2015/16, they reported that the structures that were constructed during WALA were of no use and there was no difference between them and non-WALA communities in the amount of food aid they required. This community is not resilient.
Perhaps the most telling FGD interaction occurred in the post site visit/thankyou and goodbye wrap up meeting. A woman asked the assessment team if we were satisfied with what we had seen, if we understood what the FGD had previously described. In turn we asked if the woman was satisfied with the WALA work. “Kwambiri, Kwambiri, Kwambiri!” she stated emphatically. When we queried why she was satisfied when the irrigation system was not functioning she stated “Because now the government must come back and help us.” A downpour began and the discussion ended.

99
SITE VISIT REPORT
Introduction Senjere watershed development began towards the end of WALA in 2013. WALA began with the construction of stone bunds, check dams and vetiver planting. WALA planned on constructing a dam for the existing irrigation scheme but the idea did not materialize due to the limited time. WALA provided the group with treadle pumps but they were not in use as it was the rainy season. Watershed development reduced flash flooding.
Senjere Irrigation Scheme has 44 members, mostly women. The scheme was established by the EU. The source of irrigation water is the Senjere River. Scheme members block the river which runs from the mountain during winter cropping. They irrigate approximately 1.5 acres. At the beginning of winter cropping, the water flow rate is fast but it decreases with time. The river occasionally dries up. WALA gave the irrigation scheme treadle pumps. The scheme members also borrow land (dimba) during winter cropping to increase the irrigated area. They irrigate using water canes and from wells. Scheme members collectively produce and sell maize, beans, Irish potatoes and tomatoes. They sell the produce collectively.
WALA also introduced VSL groups, care groups and support groups.
84 These statistics were compiled by CRS in a spreadsheet entitled “CRS WALA Watershed Sites”. Some statistics may vary from what was reported during rapid assessment FGDs and KIIs.
Senjere Watershed and Irrigation Scheme84 District Zombe Traditional Authority: Chikowi GVH Mbembesha Implementing Partner Save the Children Watershed Target/Treated Hectares 64 targeted/19 treated FFW Months/Beneficiaries 4 months/220 beneficiaries Watershed Treatments: Years Constructed, # Months Worked, # FFW Beneficiaries
2011/12, 3 months, 140 beneficiaries 2012/13, 1 month, 80 beneficiaries
Total FFW Oil/Beans (kgs) 1,837 kgs oil/7,500 kgs beans Total Meters Primary Structures 29,057 meters Check Dams/Trees Planted 555 meters check dams/1,279 trees Resiliency Score/Rank (37 points/15 ranks) 22 points/10 rank Rapid Assessment Visit Date December 13, 2017

100
Methodology The Senjere watershed visit was conducted by the assessment team with assistance from CRS who provided FGD organization, translation, and technical support. There were 22 FGD respondents (4 men and 18 women). They were WMC and irrigation scheme members. WMC and irrigation scheme members accompanied the visitors to the watershed site where additional information was obtained and photos taken.
Output This site visit was dominated by a seemingly cohesive women’s group. Watershed treatments were located far from the irrigation site but fed into the river that supplied the scheme. The villagers had unsuccessfully tried to dam the river, upstream from the village, with EU funding.
Most observed watershed structures were not maintained. WMC members stated that field owners are responsible for treatment maintenance. Some unmaintained check dams have begun creating new gullies. Trees were planted in the fields and homestead of community members. There were four villages working on the watershed but only one village was a direct beneficiary of watershed development. The community members focus predominantly on the irrigation scheme.
The number of VSL groups has increased in the community. The PSP is given some money as a token of appreciation.
Most households still apply skills they learned by participating in MCHN care groups and PLHIV support groups.
Outcomes Watershed treatments increased the water table and improved irrigated farming yields. Scheme member incomes have increased slightly as irrigated areas are small due to insufficient water. The community could not withstand the EL NINO effects. Most of the community members required food aid.
The women took us to their irrigation site that was basically a field of tomatoes, taken over by weeds. They filled their aprons with tomatoes and took them back to the village where they were collected. The
explained that they don’t spend time maintaining the tomato field as they have other rainy season work. They will would return to the irrigated field during the dry season.
VSL groups have made borrowing and saving money easier. This has increased income for most households. Some farmers sustain their small-scale businesses with VSL loans. Others have built

101
houses with iron sheets, purchased livestock and farm inputs. They were unable to make these investments prior to WALA.
The health status of most households has improved due to training on how to prepare nutritious food.
Conclusion The community is still vulnerable to adverse weather changes. Watershed treatments are not being maintained and irrigated area is small due to several failed attempts at harvesting river water. The community’s resilience level is very low despite the irrigation scheme and the VSL groups.

102
SITE VISIT REPORT
Toleza Watershed Site85 District Balaka Traditional Authority: STA Sawali GVH Toleza Implementing Partner Project Concern International Watershed Target/Treated Hectares 110 has targeted/107 has treated FFW Months/Beneficiaries 4 months/592 beneficiaries Watershed Treatments: Years Constructed, # Months Worked, # FFW Beneficiaries
2012/13, 4 months, 592 beneficiaries;
Total FFW Oil/Beans (kgs) 2175 kgs oil/8,880 kgs beans Total Meters Primary Structures Not Available Check Dams/Trees Planted Not Available Resiliency Score/Rank (37 points/15 ranks) 19 points/13 rank Rapid Assessment Visit Date December 19, 2017
Introduction
WALA was initiated in Toleza in September 2010. FFW supported watershed development began in May 2011 for 4 months. The watershed covers 7 villages. After twenty days of work FFW beneficiaries earned 4 litres of cooking oil and 15kg of beans. Watershed treatments included tree planting and CCT construction to harvest rainfall and reduce soil erosion. FGD respondents stated that roads were also constructed in the community under FFW (there may have been some confusion with the area’s current project, NJIRA)
WALA promoted agricultural methods included ridge alignment, Sasakawa, CA, mulching and manure making. VSLs were created and supported by three PSPs. WALA provided training in livestock management to paravets and bee keeping. WALA also supported fish pond development. Fish ponds provided water for the 55 member Titukuke Irrigation Scheme.
Methodology The Toleza watershed visit was conducted by the assessment team with assistance from CRS who provided FGD organization, translation, and technical support. There were 42 FGD respondents (14 men and 28 women). They were WMC and VDC members. Five WMC and members accompanied the visitors to the watershed site where additional information was
85 These statistics were compiled by CRS in a spreadsheet entitled “CRS WALA Watershed Sites”. Some statistics may vary from what was reported during rapid assessment FGDs and KIIs.

103
obtained and photos taken. The village headwoman welcomed the assessment team, and specifically the Team Leader, in English asking “What good things have you brought us?”
Outputs The few CCTs established during WALA are not maintained. An FGD respondent stated that WALA was constructing “random” CCTs in farmer fields until farmers stopped them. FGD respondents also reported that Toleza was a dry area where farmers cultivated sorghum, cassava and sweet potato when it is dry and plant rice in dambos when it rained. CCTs were unmaintained, on seemingly flat land, about 30 meters apart. It appeared that WALA treatments were being redone and expanded under NJIRA.
There were large expanses of fallow land owned by absentee landlords. One field had produced pigeon peas the previous year and was fallow.
One large landholder had four fish ponds he said were constructed with WALA support. They frequently dry up due to the low water table. It isn’t clear how these four fish ponds benefit the broader Toleza community.
VSL groups created during WALA are still functioning and expanding. Members stated that they purchased livestock with loans and share outs. Three FGD participants accessed paravet services (though it seemed these were developed under NJIRA, not WALA). The number of VSL groups has increased with PSP support.
MCHN care groups were taught to cook nutritious foods such as soy snacks and maintain kitchen gardens.
Marketing groups sold cowpeas and pigeon peas but were dissolved when traders “tricked” the farmers into selling individually.
A demonstration plot to show Sasakawa and CA benefits was being continued under NJIRA. The demonstration plot was planted late and poorly done. The demonstration plot needed signs to show what was being demonstrated and other improvements.
Outcomes To see the irrigation site and fish ponds the assessment team traveled far from the village to an individual farm where the landholder, when asked how much land he had, stated that it was as far as the eye could see. He showed us his fish pond, which was one in a string of interconnected ponds, all filled with grass. He said they were owned by other villagers. There was an empty pig sty nearby. He said he fed the fish pig manure. There was no evidence of active fish farming. This farmer also had Moringa trees and a large sweet potato field. Why, or if, WALA had helped this farmer with his fishponds was unclear.

104
While FGD respondents stated that they appreciated watershed development impact on increased soil moisture, replenished water table, and higher agricultural yields they did not maintain the structures. As a result, the effects have dissipated. The irrigation system has failed and farmers have returned to low productivity rainfed farming.
Most farmers have little
produce to sell. When they do sell they receive low prices. Even though VSL groups have increased FGD respondents explained that they gain little from them as a result of the low farm income. Households have little money to save and, as a result, VSLs have little money to lend. A small number of respondents said VSLs enabled them to buy bicycles, livestock, clothes and hire labour.
During the 2015/16 El Nino households needed external assistance. However, FGD respondents stated that the aid needed was not as intensive as it had been during other dry periods. This they attributed to watershed treatments and improved farming techniques.
Conclusion WALA beneficiaries observed the benefits of watershed development but failed to maintain the treatments once FFW ended. This situation may be attributed to a lack of capacity building and this community’s apparent high dependency syndrome. Some interventions like VSLs were adopted but there is little sustainability. This was a difficult watershed site to assess given the presence of the follow on project NJIRA and the assessment teams inability to distinguish between WALA and NJIRA impact.

105
ANNEX 3: WALA COMMUNITY RESILIENCY DURING 2015/16 EL NIÑO EMERGENCY: FGD COMMENTS EXTRACTED FROM SITE VISIT REPORTS
WALA Community Resiliency During 2015/16 El Nino Emergency: FGD
Comments Extracted from Site Visit Reports
Chigwirizano
The number of people requiring aid has reduced over time. Most of the people that required aid in 2009 no longer needed aid during the 2015/16 El Nino. This showed great improvement and most farmers attributed this success to WALA interventions.
Chikololero
They were able to withstand the 2015/16 El Nino and are much more resilient now than they were years back. They are more determined and dedicated and are still expanding and maintaining their watershed. They claimed they are better off than non-WALA communities and the difference between them is indisputable.
Domasi
Domasi watershed beneficiaries claimed that they were not affected severely by the 2015 drought in relation to the 2012 drought. They are more resilient now because of the watershed management. The rains were erratic but most of them were able to produce enough. Even though it can be argued that their resilience emanates from the coming in of another project (Islamic Relief).
Jerenje
The community reported to have needed less food aid during the El Nino drought effects than they used to in the past. The El Nino did not have much impact on the community compared to non-WALA communities. Most farmers were resilient to the drought and did not require food aid. However, some people in the community still received food aid. Some farmers used the maize they received to pay casual laborers since they had already acquired enough food from the rain fed and winter cropping. Irrigation made most of the farmers resilient to the drought.
Kasabola
Income for farming families in the irrigation scheme have increased. Beneficiaries of the irrigation scheme produce more crops and their yields have increased, they reported to be food secure. The community reported that they were not affected by the EL NINO drought. However, their dam dried up mid-way into winter cropping.
Katunga Beneficiaries of the irrigation scheme produce more crops and their yields have increased, they reported to be food secure. The community reported that they were not affected by the EL NINO drought
Khoviwa
While the El Nino did affect the community WALA beneficiaries needed less food aid than non-WALA beneficiaries. Also, KII respondents stated that the community required much less food aid that what they required in 2012.

106
WALA Community Resiliency During 2015/16 El Nino Emergency: FGD Comments Extracted from Site Visit Reports
Lingoni
The El Nino did not affect the community since there was no drought in Mitawa. None of the farmers in the community received food aid. The only problem which they faced in their maize fields was army worms. Some farmers planted several times because of the army worms.
Majawa The EL NINO drought did affect the community greatly. Most of the farm families were using money from VSL groups to buy food for their families and a good number of the community members required food aid.
Makande
The capacity building that they got throughout the project has made it more resilient to many shocks including the El Nino that took place in 2015/16 farming season. Most households were able to withstand due to the Irrigation system that was developed, the watershed management structure that were developed and also the integration of the Village Savings and loans, agribusiness trainings and some of the conservation agriculture technologies. To a large extent, their success can be attributed to the leadership, good relationship and collaboration among village members.
Mukuta
Balaka is flat and dry hence there were few watershed treatments to harvest water. The few watershed treatments undertaken helped some of the Mukuta watershed beneficiaries to be more resilient to droughts. The integration with other activities such as VSL has helped farmers in improving their livelihoods and mitigating other shocks. The effect of El Nino that occurred in 2015/2016 was less than in past years because most of the families in this area (who adopted the watershed treatments) were able to harvest and provide for their families. The beneficiaries of WALA were better off than non-WALA communities because the WALA communities are more resilient.
Malosa
Malosa watershed beneficiaries have not adopted many technologies that would elevate resilience to drought. Technologies such as conservation agriculture and village saving and loans are not practiced by many farmers in this watershed. However, the beneficiaries claimed that they were not affected by the El Nino that took place in 2015/16. The current problem that these farmers are facing is the introduction of pests like fall army worms.

107
WALA Community Resiliency During 2015/16 El Nino Emergency: FGD Comments Extracted from Site Visit Reports
Mbangu
Mbangu watershed beneficiaries in Nsanje are more resilient to floods than to drought. Structures under the watershed has managed to reduce the floods and people are able to cultivate and harvest as much as they can and sell. The integration with other activities such as VSL has helped the farmers in improving their livelihoods and mitigate other shocks. However, the experience of El Nino that occurred in 2015/2016 showed that most families under the watershed management were still vulnerable and still required assistance. Due to the dry spell, the technologies were not able to function as intended because they require a lot of water to recharge the water table. Therefore, there is a positive difference between WALA communities and non-WALA communities during floods because the WALA communities are more resilient. It was found that there was not much difference between WALA and non-WALA communities during the El Nino that occurred.
Mbeluwa
The community is still not food secure. Most farm families are still vulnerable. Irrigation is only done by a few villagers. Though the EL NINO did not have much impact on the community, most community members did not harvest enough food and still required food aid but not as much as non-WALA communities.
Mitumbira
Food aid was needed by the community during the 2012 and 2015/16 droughts. However, during the El Nino the community needed less food compared to 2012. Though they did not harvest much, some farmers still harvested a little maize. WALA interventions helped to a degree. There is a synergy between VSLs, livestock production and food production. Some farmers sold their livestock and some used money from VSL groups to buy food during the El Nino.
Muluma
Muluma watershed structures managed to harvest water for the community but due to the lack of maintenance the water table dropped. Irrigation is also done by a few number of people implying that the number of household food secure is small. VSLs are a success in this community and has spread out to other communities. However, VSLs are not enough to make this WALA community resilient. This was also shown during the El Nino that occurred in 2015/2016. More people were not able to stand on their own as they required food aid the same as other non-WALA communities.
Namadidi
Due to the unmaintained watershed and irrigation structures, soil and gully erosion due to runoff water are still major problems. During the El Nino, most of the farmers in the community were affected. Most of the farmers reported that they required food aid. However, farmers who follow good agricultural practices were able to harvest a little something during El Nino.

108
WALA Community Resiliency During 2015/16 El Nino Emergency: FGD Comments Extracted from Site Visit Reports
Namatemba
Farmers growing crops under irrigation had more food than those relying on rain fed farming during 2015/16 cropping season. Some community members who harvested something during EL NINO shared the little they had with the needy. The El Nino did not have much impact on the community compared to non-WALA communities.
Namikoko
The community reported to have needed less food aid during the El Nino drought effects than they used to in the past. The El Nino did not have much impact on the community compared to non-WALA communities. Most farmers were resilient to the drought and did not require food. However, a few vulnerable people in the community received aid. Irrigation made most of the farmers resilient to the drought.
Namilongo
The EL NINO did affect the community. The stream dried out that year. Farmers close to the stream dug up wells in stream and they continued irrigating their fields. A few farmers managed to harvest a little something. The El Nino did not have much impact on the community compared to non-WALA communities. Most farmers were resilient to the drought and did not require food aid.
Nan’gombe
The 2015/16 El Nino affected the community. Some WALA beneficiaries received food aid but not as many as in non-WALA communities. Although the drought was severe, a few farmers did harvest maize but not enough to make them food secure. Some VSL members used share outs to purchase food. Most farmers incorporate drought tolerant crops in their crop production, as previously recommended by DRR groups, to mitigate the effects of dry spells. WALA interventions, including VSL groups, reduced the 2015/2016 El Nino impact to a certain extent.
Natama
Farmers from Natama watershed and irrigation scheme are not fully motivated to work for themselves without support (FFW). The lack of maintenance is attributed to these farmers not reaching a level of knowledge and understanding that they have to be responsible for their own success. After the weir was damaged, people lost hope and there wasn’t any initiative taken by anyone to rebuild without support. During the E l Nino in 2015/16, they reported that the structures that were constructed during WALA were of no use and there was no difference between them and non-WALA communities. With this, it shows that this community is not resilient to drought and they are prone to suffer if any disaster occurred.
Senjere
Increased water table increased yield for most farmers. Income for the scheme members has also increased although to a small degree since they only irrigate a few acres due to insufficient water availability in the stream. The community could not withstand the EL NINO effects. Most of the community members required food aid.

109
WALA Community Resiliency During 2015/16 El Nino Emergency: FGD Comments Extracted from Site Visit Reports
Toleza
Beneficiaries in Toleza watershed saw the benefits of the treatments but once the FFW program ended, people also stopped maintaining and also expanding. This situation can be attributed to lack of watershed capacity building and the high dependency syndrome that the people in this watershed have. Some interventions like VSLs were successfully adopted but there is little sustainability on these interventions together with the watershed. Based on the El Nino that took place in 2015/16 farming season, most farmers claimed that they were not able to stand on their own hence needed external assistance but the aid needed was not as intensive as it has been during other dry periods. This is attributed to the watershed structures, CA and other interventions for those that adopted them.

110
ANNEX 4: FOOD AID RECIPIENTS IN TAS WHERE WALA WATERSHED COMMUNITIES DID NOT NEED FOOD AID
86 Extracted from “Protracted Relief And Recovery Operation (PRRO) 200692 Targeted Food Distributions: 2016/2017 MVAC RESPONSE DISTRIBUTION PLAN - FEBRUARY 2017
Food Aid Recipients in WALA Watersheds Not Needing Food Aid 2015/16 El Nino86
Watershed TA Number of Food Aid Recipients
Malosa/Domasi Malemia 28,698
Lingoni Chamba 12,523
Namatemba Mlumbe 60,443
Katunga/Kasabola Chikowi 64,893
Chigwirizano Kwethemule 15,605
Makande Kasisi N/A
Chikololere Sawali 15614

111
ANNEX 5: ILLUSTRATIVE FGD QUESTIONS 1. What do you remember about the WALA project that you feel is important? 2. Why was that activity important? 3. How did it come about...how did it begin and what did the activity entail? Who
participated in the activity and why did they participate? 4. What were the activity’s benefits? What were the costs? 5. Did WALA introduce new ideas? What were they and were they useful? Are the ideas
still useful today? (CA, PSPs, ASP, Paravets, irrigation, group marketing, VSL, watershed management, disaster response groups)
6. Has the area under irrigation increased/decreased/stayed the same since June 2014? Why? (Water availability, investments in irrigation technology, more market demand/better price for irrigated crops)
7. What crops are irrigated? Are they for consumption or for sale? If for sale, how are they marketed (group marketing, fixed price contract, outgrower scheme). If sold are they more or less profitable than in 2014?
8. Has the area under Conservation Agriculture increased/decreased/stayed the same since 2014?
9. Does your household/community have more or less own production maize to consume than in 2014? Why or why not?
10. Does your household/community have more or less own produced non-maize food crops to consume than in 2014? Why?
11. Does your household have more or less farm income than in 2014? Why or why not? 12. Did your household require food assistance in 2016? If so, why? If not, why not? 13. If you required food assistance in 2016 was it more or less than you required in 2012?
Why? 14. Is your household/community better able to cope with drought/flooding now than in the
past? Why or why not? 15. How has watershed development (or soil and water conservation) affected your farm
production? 16. Have you adopted conservation agriculture? Why or why not? If yes, what affect has it
had in your farm production? Labor needs? Production costs? Harvests? 17. How much time each month do you devote to constructing watershed management
structures? To maintaining watershed management structures? 18. Why do you devote time to constructing/maintaining watershed management structures? 19. Have non-WALA beneficiaries begun using WSC on their fields? Why or why not? 20. How many people are Watershed Management Committee members? Marketing
club/group members? VSL/SILC members? Producer group members?

112
ANNEX 6: ASSESSMENT SCOPE OF WORK
Impact Assessment of USAID’s Wellness and Agriculture for Life Advancement (WALA)
Activity
United States Agency for International Development (USAID)/Malawi, Office of Sustainable Economic Growth (EG)
October 2017
POINT OF CONTACT
Emanual Ngulube Activity Manager, WALA Project
Office of Sustainable Economic Growth USAID/Malawi
Carter Hemphill
COR, Monitoring, Assessment, and Learning Support (MELS) Project Office of Sustainable Economic Growth
USAID/Malawi Tel: 265 (0) 177-2455, Ext 5124 E-mail: [email protected]
Project Information
Project Name Wellness and Agriculture for Life Advancement (WALA) Multi-Year Assistance Program
Award Number AID-FFP-A-09-00001-01
Original Project Dates July 1, 2009 - June 30, 2014
Original Funding $80,700,000
Implementing Partner(s)
WALA Consortium - Catholic Relief Services (CRS) consortium leader with ACDI/VOCA, Africare, Emmanuel International, Project Concern International, the Salvation Army, Save the Children, and World Vision

113
TABLE OF CONTENTS I. Background 114
II. Assessment Purpose 115
III. Assessment Questions 116
IV. Assessment Methodology 116
V. Deliverables 117
VI. Assessment Team Composition 118
VII. Existing Sources of Information 119
VIII. Level of Effort (LOE) of Study Team by Task Deliverables 120
IX. Scheduling and Logistics 121
ANNEX 1. Conflict of Interest Form Template 121
114
I. Background
WALA is the successor of another Title II development assistance program entitled: “Improving Livelihoods through Increasing Food Security” (I-LIFE) that was implemented from October 2005 – June 2009, led by CRS and CARE. A number of successful interventions and approaches that were piloted and refined under I-LIFE – including Village Savings and Loans (VSL) (though with the Private Sector Providers (PSP) approach; see below), the Care Group approach (see Annex 9), and the interventions associated with irrigation – were incorporated into the WALA design. While carrying over the successful interventions, WALA shifted the geographic focus to the eight southernmost districts not covered by I-LIFE, where food insecurity was estimated as most acute.87
Five of the WALA Private Voluntary Organizations (PVOs) were already members of the I-LIFE Consortium and thus provided necessary institutional memory.88
While WALA has integrated lessons learned from I-LIFE, its roots can be traced back further to the program implemented in Malawi (and neighboring countries) by the Consortium for Southern Africa Food Security Emergency (C-SAFE). C-SAFE responded to the immediate food security crisis with targeted food assistance to vulnerable groups, including households affected by HIV/AIDS. Transitional interventions focused on Food for Assets programming to build productive assets at the household and community level. The C-SAFE membership included World Vision International (WVI), Catholic Relief Services, CARE, and ADRA International. C-SAFE was also funded by USAID Food for Peace (FFP). Program Description. WALA was a five-year Title II Multi-Year Assistance Program (MYAP) funded by USAID to prevent and mitigate food insecurity in southern Malawi. WALA targeted the most vulnerable communities and households, ensuring holistic provision of services to the selected groups. In the original design, targeted groups were comprised of households that have small and marginal farms, are female-headed, host chronically ill persons (tuberculosis and HIV/AIDS), and are food insecure, and/or host orphans.
WALA was implemented in the eight most food insecure districts of southern Malawi: Nsanje, Chikwawa, Thyolo, Mulanje, Zomba, Machinga, Chiradzulu and Balaka. The four districts Nsanje, Chikwawa, Machinga and Balaka covered by WALA are still being covered by the current DFAPS. They were also some of the worst hit in the last response. CRS/Malawi, through the Consortium Administration and Technical Capacity Hub (CATCH), led the management and implementation of the program.
WALA interventions fell under three primary Strategic Objectives (SO):
● SO1 – Maternal and Child Nutrition (MCHN) – improve MCHN status of vulnerable households
● SO2 – Agriculture Natural Resource Management Irrigation and Economic Activity – improve the livelihood status of smallholder households
87 One of the eight districts (Thyolo) was covered by I-LIFE WVI. However, the WALA program is located in different areas (Traditional Authorities). 88 CRS, Save the Children, EI, Africare and WVI.

115
● SO3 – Disaster Risk Reduction – Improve communities ability to withstand shocks and stresses
Program Goal. The goal of WALA was to improve the food security of 214, 974 chronically food insecure households in 39 Traditional Authorities in eight districts in southern Malawi by 2014 through strategic objectives in maternal and child health and nutrition (MCHN) (SO1); agriculture, natural resource management (NRM), Irrigation and Economic Activity (SO2); and Disaster Risk Reduction (SO3).
Catholic Relief Services (CRS) began implementing the Wellness and Agriculture for Life Advancement (WALA) program in July 2009. This five-year USAID-funded PL480 Title II program funded through Food for Peace (FFP) and implemented in the eight most food insecure districts in the south of Malawi ended in June 2014. WALA was implemented by a consortium of nine Private Voluntary Organizations (PVOs) led by CRS Malawi as the grant holder. The seven implementing PVOs were Africare, Chikwawa Diocese, Emmanuel International (EI), Project Concern International (PCI), Save the Children, Total Land Care (TLC), 3 and World Vision International (WVI). Another partner, ACDI-VOCA, provided technical support on agribusiness.
Figure 1: Map of WALA program areas
II. Assessment Purpose
WALA has the appearance of a very successful project that helped to improve resilience for rural Malawians. USAID defines sustainable resilience as the ability of households and/or communities to mitigate, adapt and recover from shocks and stresses in a manner that reduces chronic vulnerability and facilitates inclusive economic growth.
WALA’s investment in the Lingoni community in Machinga District has gained agency-wide

116
recognition because of its successful irrigation scheme. This assessment will seek to determine if the Lingoni site is an outlier or if this is the case for other WALA communities, by examining the thirty-two watershed development activities in nine districts. Have these communities also withstood the El Nino-effected drought as a result of the WALA intervention? Likewise, if there are other similar successes, can we attribute the success and resiliency of these communities to WALA’s investments in watershed activities or the impact of other community investments? The purpose of the rapid assessment is to assess the status of WALA’s investments in watershed development and to identify the reasons for their sustainability or lack of sustainability.
The recent unprecedented humanitarian crisis poses an important test for measuring a community’s degree of resiliency. The Assessment team will determine the effectiveness with a desk study followed by a rapid field assessment to validate information gathered in the desk study. The team will need to examine the humanitarian response caseloads in these WALA watershed sites and link with the MVAC intervention data. Such a study will help advocate for continued USG resources in Malawi in light of Malawi’s recent removal from the list of FTF target countries.
III. Assessment Questions
The following specific questions should be addressed:
● To what degree are WALA watershed sites performing well on resiliency measures when compared to MVAC or non-WALA sites?
● To what degree did WALA watershed activities reduce the need for food and/or other humanitarian assistance during the last drought among targeted WALA communities?
IV. Assessment Methodology
The team will review documents to come up with a list of sites to visit. The team will use qualitative methods of observation and interviews, combined with the desk review to examine resilience between WALA sites and MVAC sites (non-WALA sites) that received food aid. The team will devise methods for measuring resiliency between these sites to determine the success of the WALA project, and determine clearly what would define Lingoni as an outlier. Since this is a rapid assessment it is not expected that the team will conduct surveys to produce primary data but will work with project and other secondary sources. The methods utilized for this assessment are as follows:
Document Review. Assessment team members will review documents throughout the Assessment process including program reports and relevant studies to understand the resiliency measures of WALA communities.
Observation. Since this is a rapid assessment the team is not expected to visit all of the WALA sites or watershed management sites (of which there were 22). Rather, a handful of sites will be selected as a result of the document review.
Key Informant Interviews (KIIs). The team will conduct one-on-one interviews with a variety of stakeholders including the most relevant GOM ministries and agencies, local government authorities, private partners and community leaders, NGO’s who participated in the WALA

117
implementation, bi- and multilateral development partners.
Focus Group Discussions (FGDs). FGDs (small group of 6 to 10 people) can be used to lead open discussion through a skilled moderator to gather semi-structured qualitative data around a community’s resilience. The pre-selected participants will discuss issues and concerns based on a list of key themes drawn up by the moderator. These sessions will encourage free flowing discussion about the activity.
All the methodological strengths and weaknesses should be explicitly described in the Assessment report. Prior to the start of the Assessment, the Assessment team shall meet with the SEG office to present the overall approach for the field work and the anticipated results.
V. Deliverables
All deliverables are internal to USAID, MELS and the Assessment Team unless otherwise instructed by USAID. Assessment deliverables include:
Assessment Team Kickoff Meeting. Essential in organizing the team’s efforts. During the meeting, the team should review and discuss the SOW in its entirety, clarify team members’ role and responsibilities, work plan, develop data collection methods, review and clarify any logistical and administrative procedures for the assignment and instruments and to prepare for the in-brief with USAID/Malawi.
In-brief Meeting with USAID/Malawi. Within two working days of international team members’ arrival in Malawi.
Inception. At the in-brief meeting, the Assessment team will provide SEG office with the Work Plan, Assessment Design Matrix, and proposed Data Collection Instruments (e.g., interview guides). See more detail below.
Work Plan. The Contractor will prepare a detailed work plan that includes task timeline, methodology outlining approach to be used in answering each Assessment question, team responsibility, document review, key informant and stakeholder meetings, site visits, survey implementation, travel time, debriefings (for USAID, implementing partner and, if decided, the GOM), draft and final report writing. The work plan will include a data analysis plan. The work plan will be submitted to the MELS and WALA Activity Manager at USAID/Malawi for approval no later than the fifth day the Assessment team arrives in Malawi.
Assessment Design Matrix. A table that lists the Assessment questions and the corresponding information sought, information sources, data collection methods, data analysis methods, and limitations. The matrix should be finalized and shared with USAID/Malawi before Assessment field work starts. It should also be included as an annex in the Assessment report.
Data Collection Instruments. Development and submission of interview guides and questions to USAID/Malawi during the design phase and after the Assessment is completed.
Debriefing with USAID. The Assessment team will present the preliminary findings to USAID/Malawi through a presentation/discussion before the team’s departure from country. The debriefing will include a discussion of achievements and issues as well as any preliminary recommendations. The team will consider USAID comments and incorporate

118
them in the Draft Assessment Report. Draft Assessment Report. A draft report on the findings and recommendations should be
submitted to USAID/Malawi and MELS 10 working days after departure of international team members from Malawi. It is recommended that the report be kept to approximately 20 pages. The purpose of this report will be to summarize the findings with a thoughtful analysis of the documents examined and the field work conducted.
The final report should at a minimum meet the following criteria to ensure the quality of the report:
▪ The Assessment report should represent a thoughtful, well-researched and well organized effort to objectively evaluate what worked in the project, what did not and why?
▪ Assessment report shall address the Assessment questions included in the scope of work.
▪ The Assessment report should include the scope of work as an annex.
▪ Assessment methodology shall be explained in detail and all tools used in conducting the Assessment such as questionnaires, checklists and discussion guides will be included in an Annex in the final report.
▪ Limitations to the Assessment shall be disclosed in the report, with particular attention to the limitations associated with the Assessment methodology (selection bias, recall bias, etc.).
▪ Assessment findings should be presented as analyzed facts, evidence and data and not based on anecdotes, hearsay or the compilation of people’s opinions. Findings should be specific, concise and supported by strong quantitative or qualitative evidence.
▪ Sources of information need to be properly identified and listed in an annex.
The format of the final Assessment report should strike a balance between depth and length. The report will include a table of contents, table of figures (as appropriate), acronyms, executive summary, introduction, purpose of the Assessment, research design and methodology, findings, conclusions, lessons learned and recommendations. Where appropriate, the Assessment should utilize tables and graphs to link with data and other relevant information. The report should not exceed 20 pages if possible, excluding annexes.
All quantitative data, if gathered, should be (1) provided in an electronic file in easily readable format; (2) organized and fully documented for use by those not fully familiar with the project or the Assessment; (3) owned by USAID and made available to the public barring rare exceptions. A thumb drive with all the data should be provided to the MELS COR and MELS Project Director.
The final report will be edited and formatted by the Contractor and provided to USAID/Malawi 5 working days after the Mission has reviewed the content and approved the final revised version of the report.
VI. Assessment Team Composition
The team will include one international expert and one local consultant supported by a logistics specialist note taker. The former should be a specialist with the following areas of expertise: project

119
Evaluations, assessments, humanitarian aid and international development. The local consultant should have a background in project evaluation and international development.
Team Leader/Assessment Expert (International). This expert will serve as Team Leader and will provide overall leadership for the team. S/he will finalize the Assessment design, coordinate activities, arrange periodic meetings, and coordinate the process of assembling the final findings and recommendations into a high quality document. S/he will lead the preparation and presentation of the key Assessment findings and recommendations to the USAID / Malawi team and other major partners.
The TL should have the following attributes/qualifications and experience:
● S/he should have a postgraduate degree in an appropriate field, with at least 10 years of international experience leading Assessment teams, ideally for agricultural implementation projects, economics, and other food security related projects. Relevant experience in Malawi or Eastern/Southern Africa preferred.
● S/he should have extensive experience in conducting quantitative and qualitative Assessments.
● The Team Leader/EE must be familiar with USAID regulations and systems including performance monitoring, gender policies and guidance, project management, budgeting and financial analysis, and reporting.
● Experience in international donor development program management and overseeing multiple program areas simultaneously is preferred.
● Should be experienced in preparing documents that are objective, evidence-based, and well organized.
● Excellent oral and written skills in English are required. Senior Humanitarian Specialist (Malawian): The local Assessment Specialist will assist with logistics, participate in team meetings, key informant interviews, group meetings, site visits, and draft the sections of the report relevant to his/her expertise and role in the team. S/he also will participate in presenting the report to USAID or other stakeholders and be responsible for addressing pertinent comments provided by USAID/Malawi or other stakeholders.
The local Assessment Specialist should:
● Have a postgraduate degree in monitoring and Assessment, international development, forestry, natural resources, environment, or a related field.
● Be a Malawi national with at least 4 years of field experience in Assessment preferably with some sectoral experience in Evaluation of USAID Development activities.
● Should understand and speak the local language.
Logistics Specialist (Local). The local Logistics Specialist will be responsible for providing program logistics support, arranging appointments and maintaining the schedule, providing interpretation and translation, and assisting with the preparation of project reports, as needed. S/he will serve as the note taker during team meetings and interviews.
VII. Existing Sources of Information The Assessment team should consult a broad range of background documents apart from project

120
documents provided by USAID /Malawi. These should include, reports from WALA, survey data, GIS data, relevant third party reports. USAID, US-OFDA, WFP, Government of Malawi (Ministry of Agriculture, DoDMA), MELS, and the WALA project will provide the assessment team with a package of briefing materials, including:
● The agreement for WALA activity; ● M&E plan for WALA; ● Project quarterly and annual reports, work plans and management reviews
developed as part of routine monitoring; ● MVAC data from WFP ● Training reports; ● DQA reports; ● USAID/Malawi Country Development Cooperation Strategy 2014-19
(Public version); ● USAID Malawi DO:2 PMP; ● Performance Indicator Tracking Table (PITT); ● M&E tools; ● Training & Beneficiary database. ● WALA Evaluation Report
Conflict of Interest. All Assessment team members will provide a signed statement attesting to a lack of conflict of interest, or describing an existing conflict of interest relative to the project being evaluated. USAID will provide the conflict of interest forms. See Annex 1 for the Template.
VIII. Level of Effort (LOE) of Study Team by Task Deliverables
Below is an estimate of the Assessment level of effort (LOE). Level of Efforts of Team Members by Task Deliverables
Task/Deliverable
Duration / LOE in Days
Team Leade
r
Assessment
Specialist
Logistics
Specialist
Review background documents and home-based preparation work 12 1 1

121
Develop analytical framework & provide USAID with preliminary analysis
2 0 0
Develop key questions for field work 2 0 0 Travel to Malawi 2 0 0 Field Work in WALA ZOI 14 14 14 Discussion, analysis, and preliminary draft Assessment report in country including discussion with USAID
5 5 1
Travel to the U.S. 2 0 0 Finalize assessment report 6 1 0 Total Estimated LOE 45 21 17
IX. Scheduling and Logistics
Funding and Logistical Support. USAID/Malawi’s MELS project will be responsible for all off-shore and in-country administrative and logistical support, including identification and fielding appropriate local staff. They will take care of arranging and scheduling meetings, international and local travel, hotel bookings, working/office spaces, computers, printing, and photocopying. The Logistics Specialist will arrange field visits, local travel, hotel, and appointments with stakeholders and provide translation services. Scheduling (see attached table). Work is to be carried out over a period of approximately 6 weeks. At this point in time, we anticipate that the Assessment would begin on/about November 15th, with work in the USA on a desk study of WALA. After the desk study the team will travel to Malawi to perform follow up fieldwork to observe WALA sites and interview stakeholders. A six-day work week (Monday-Saturday) is authorized for the Assessment team while in Malawi, however, no overtime or premium pay is authorized. Team mobilization will include: travel approval; airline tickets; visa; lodging; work facility and vehicle transport arrangements; dates for meetings with USAID/Malawi SEG staff and key contacts; in-country travel agenda; and accommodations.

122
ANNEX 1. Conflict of Interest Form Template
Name
Title
Organization
Assessment Position? Team Leader ☐Team member Assessment Award Number (contract or other instrument)
USAID Project(s) Evaluated (Include project name(s), implementer name(s) and award number(s), if applicable)
I have real or potential conflicts of interest to disclose.
Yes ☐No
If yes answered above, I disclose the following facts: Real or potential conflicts of interest may include, but are not limited to: ● Close family member who is an employee of the USAID operating unit managing the project(s) being evaluated or the implementing
organization(s) whose project(s) are being evaluated. ● Financial interest that is direct, or is significant though indirect, in the implementing organization(s) whose projects are being
evaluated or in the outcome of the Assessment. ● Current or previous direct or significant though indirect experience with the project(s) being evaluated, including involvement in the
project design or previous iterations of the project. ● Current or previous work experience or seeking employment with the USAID operating unit managing the Assessment or the
implementing organization(s) whose project(s) are being evaluated. ● Current or previous work experience with an organization that may be seen as an industry competitor with the implementing
organization(s) whose project(s) are being evaluated. ● Preconceived ideas toward individuals, groups, organizations, or objectives of the particular projects and organizations being
evaluated that could bias the Assessment.
I certify (1) that I have completed this disclosure form fully and to the best of my ability and (2) that I will update this disclosure form promptly if relevant circumstances change. If I gain access to proprietary information of other companies, then I agree to protect their information from unauthorized use or disclosure for as long as it remains proprietary and refrain from using the information for any purpose other than that for which it was furnished.
Signature
Date