Embed Size (px)
Citation preview
PHILIPPINE ENGINEERING JOURNALPEJ 2005; Vol. 26 No. 2:1–12
Assessment of Traffic Inputs to Pavement Design andRehabilitation
Jose Regin F. Regidor∗, Romeo A. Damaso II and April Rose V. Bilugan
Department of Civil EngineeringUniversity of the Philippines Diliman
Quezon City 1101 PHILIPPINES
ABSTRACT
Traffic and the consequent loads that vehicles transfer to the roads are major factors consideredin pavement design. Heavy vehicles, particularly trucks that carry the largest loads cause the mostdamage to pavements. In the design process, axle loads attributed to heavy vehicles are derived and thetotal equivalent standard loads are estimated over a design period. The total loads are then utilizedin coming up with the appropriate design that takes into account pavement type and thickness,among others. This paper analyzes the traffic inputs to pavement design through assessment ofactual highway sections along the Pan-Philippine Highway also known as the Doa Remedios TrinidadHighway. Original design loads due to previous projections of traffic is compared to present loadsand new projections of future traffic loads. As such, pavement performance level could be gaugedand the adequacy of current pavement types and thickness can be determined. Recommendationsare formulated and proposed in relation to the importance of accurate traffic inputs in pavementdesign, especially the development of heavy vehicle factors that allow for a more accurate estimationof equivalent axle loads as well as implications to economic design of pavements.Key Words: traffic inputs, axle loads, pavement design
1. INTRODUCTION
1.1. Background of the Study
The two basic functions of roads are to guide the driver and to support the load that passesthrough it. These roads have their own service lives, which is the span of time that theparticular road section will render its service based on the two main functions as definedfrom the engineering point of view. It is a common situation in the Philippines that by ocularinspection alone, certain roads may be judged as non-serviceable even before the expiration ofservice lives. The load directly affects the condition of the road and is the primary reason forits deterioration; therefore an analysis of the present load that passes a road is almost alwaysnecessary at any point in its service life. In consequence, a basic pavement management systemrequires proper identification and measurement of the signs of road deterioration. Having a
∗Correspondence to: Department of Civil Engineering, University of the Philippines Diliman, Quezon City 1101PHILIPPINES. email:[email protected]
Received May 24, 2006Copyright c© 2005 Philippine Engineering Journal Revised October 17, 2007
Accepted November 6, 2007
2 J. R. F. REGIDOR, R. A. DAMASO II AND A. R. V. BILUGAN
pavement management system (PMS) is good practice, which includes techniques that mayprovide guidance for the prioritization and extent of maintenance that may be employed forthe road under study.
1.2. Statement of the Problem
Highway pavement design requires traffic inputs, particularly loads derived from the volumeand mixture of heavy vehicles that would be using the road [14]. In the design of Philippineroads, these traffic inputs are not given much importance, with highway engineers often usingunsuitable data for heavy vehicle counts and load factors. Such has resulted in poor pavementdesign or, in the other extreme, over-designed highways.
1.3. Objectives
The primary aim of the study is to evaluate traffic inputs to pavement design and rehabilitation.Secondary is the assessment of the performance of the given road section within its servicelife. In the process of realizing these objectives, the following tasks are to be undertaken:
a. Obtain the traffic and load characteristics of typical national highway sections;b. Evaluate the design and current loads applied on the road based on traffic parameters;c. Recommend directions for road pavement design, maintenance or rehabilitation.
1.4. Significance of the Study
The need to identify defects and deterioration in highway structures ranges from safety reasonsto the calculation of load capacity to the establishment of pavement management systems. Inthe Philippines and other developing countries, an analysis of critical road networks, links thatare candidates for rehabilitation, is necessary primarily due to the lack of funds. Prioritizationand timing of maintenance are the main ideas of this management system. However, it dealswith the different weights assigned for different types of road distress, and it is in partsubjective, depending on the judgment of officials in charge of the inspection of a particularroad segment [11].
In this study, the effect of traffic inputs leading to pavement distress is of mainconcern. Also, from the study conducted, an analysis on the viability of the proposedmaintenance/rehabilitation of the road will be initialized. The road’s future performance willalso be obtainable using methods that are employed in similar studies and that are generallyaccepted in the traffic-engineering field. If reconstruction is necessary in the future, the datawill be of help in planning and most especially in the design of the road.
In relation to pavement management systems, the study gives the current load carried bythe pavement which may be correlated to the type of distress and presents material such asgrowth rates, that may be necessary in the prediction of the future loads and hence, futuredistress.
1.5. Scope and Limitations
According to a JICA Feasibility Study [8], the two most considered gauges of pavementcondition are roughness and pavement distress. Pavement distress in this context refers tothe defects on the road, which may be brought about by several factors. There are several
Copyright c© 2005 Philippine Engineering Journal Phil. Engg. J. 2005; 26:1–12
TRAFFIC INPUTS TO PAVEMENT DESIGN AND REHABILITATION 3
factors that contribute to road distress. Some of the major elements contributing to highwaywear and tear include climate, economic development plans, and for the most part, the typeand amount of load that pass through it. For the purposes of the study, the effect of trafficinputs (i.e., translated to dynamic loads) to pavement distress is of main concern.
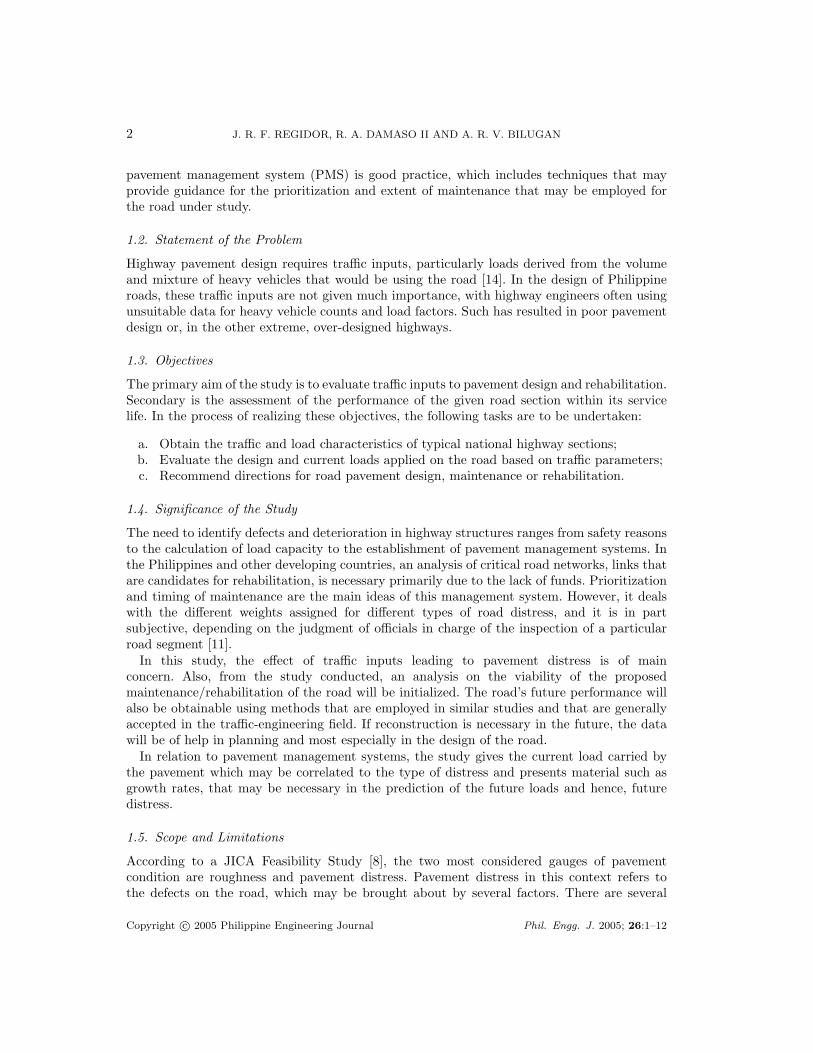
The study area includes two sections of the Pan-Philippine Highway in Luzon. The firstsection is located in Pulilan, Bulacan near its border with the town of Baliuag. Note that atthis portion of the Pan-Philippine Highway, it is also known as the Doa Remedios TrinidadHighway or DRT Highway. Figure 1 shows a map of Bulacan where Pulilan is located. Thegeneral design of the road section, the volume counts, and the traffic growth rates used fortraffic projection were obtained from the JICA Publication of 1987 [8]. Recent data on trafficvolumes were taken from the DOTC Inter-Regional Passenger and Freight Flow Surveys [9]conducted in 2004.
(Source: E-Z Map, 2003)
Figure 1. Map of Bulacan
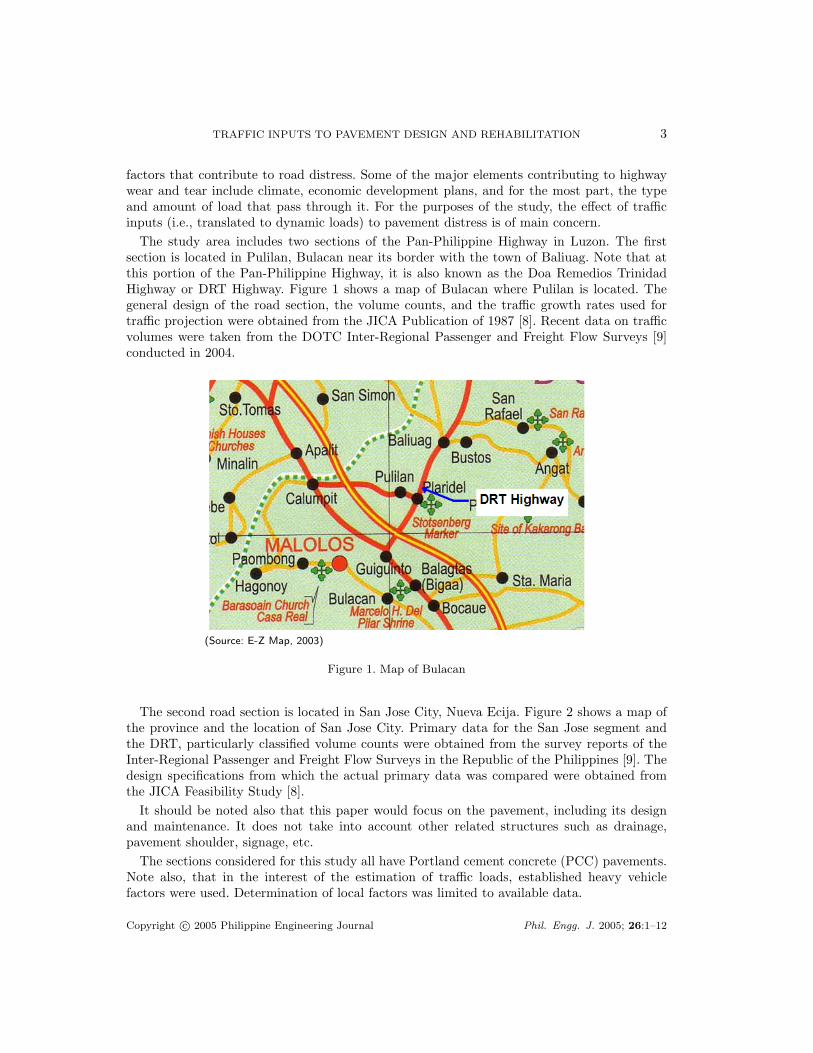
The second road section is located in San Jose City, Nueva Ecija. Figure 2 shows a map ofthe province and the location of San Jose City. Primary data for the San Jose segment andthe DRT, particularly classified volume counts were obtained from the survey reports of theInter-Regional Passenger and Freight Flow Surveys in the Republic of the Philippines [9]. Thedesign specifications from which the actual primary data was compared were obtained fromthe JICA Feasibility Study [8].
It should be noted also that this paper would focus on the pavement, including its designand maintenance. It does not take into account other related structures such as drainage,pavement shoulder, signage, etc.
The sections considered for this study all have Portland cement concrete (PCC) pavements.Note also, that in the interest of the estimation of traffic loads, established heavy vehiclefactors were used. Determination of local factors was limited to available data.
Copyright c© 2005 Philippine Engineering Journal Phil. Engg. J. 2005; 26:1–12
4 J. R. F. REGIDOR, R. A. DAMASO II AND A. R. V. BILUGAN
Figure 2. Map of Nueva Ecija
2. CONCEPTUAL FRAMEWORK
The main intent of the analysis is to assess traffic inputs in determining the need for roadmaintenance or rehabilitation. The study attempts to relate the results to the type and level ofrehabilitation or maintenance is recommended, based on the concepts of the idealized pavementmanagement systems.
The conceptual framework illustrated in Figure 3 shows the comparison of road pavementdesign (projected) loads with estimated loads determined from actual traffic inputs. Whetherrehabilitation is necessary or not can be decided from the assessment of road performancebased on the differences between projected and actual loads.
A better measure to determine road serviceability is based on distress or the physicalanalysis of the road’s overall state. Distress would be a function of parameters includingtraffic characteristics along the highway. Traffic using or that is projected to pass througha particular road comprise the load used in the design of pavements. Heavy vehicle factors(i.e., truck factors) are utilized to convert the volumes under different heavy vehicle classesinto equivalent standard axle loads of 8.2 metric tons.
3. METHODOLOGY
3.1. Characterization of Road Sections
Two road sections were considered in the study. These are the Doa Remedios Trinidad (DRT)Highway segment in Pulilan, Bulacan, and the Pan-Philippine Highway segment at San JoseCity, Nueva Ecija. For the DRT road segment, previous data on classified volume counts were
Copyright c© 2005 Philippine Engineering Journal Phil. Engg. J. 2005; 26:1–12

TRAFFIC INPUTS TO PAVEMENT DESIGN AND REHABILITATION 5
Figure 3. Conceptual Framework
obtained from the DPWH Compilation of Average Annual Daily Traffic (AADT) of 1998 [3].These were the last counts made by the DPWH in Pulilan and are shown in Table I.
Type of Vehicle 1998 volume
Mini bus 65Big bus 1,226Rigid truck 2,621Articulated truck 108(Source: DPWH [3])
Table I. Previous 24-hr Volume Counts for Pulilan
For the section at San Jose City, Nueva Ecija, data came from the Feasibility Studyconducted by JICA [8]. There were no available counts from the DPWH AADT compilation.Traffic growth rates that were used for the projection of previous data to 2004 came fromthe same publication. Table II shows vehicle count data for San Jose while Table III containstraffic growth rates established in the JICA study.
Type of Vehicle 1987 VolumeBus 233Truck 1,055(Source: JICA [8])
Table II. Previous 24-hr Volume Counts for San Jose
Recent vehicle counts were sourced from the JICA passenger and freight flow study [9]conducted in 2004. 24-hour counts utilizing an expanded vehicle classification allowed for amore detailed treatment of heavy vehicles. These counts are shown in the Table IV.
Copyright c© 2005 Philippine Engineering Journal Phil. Engg. J. 2005; 26:1–12
6 J. R. F. REGIDOR, R. A. DAMASO II AND A. R. V. BILUGAN
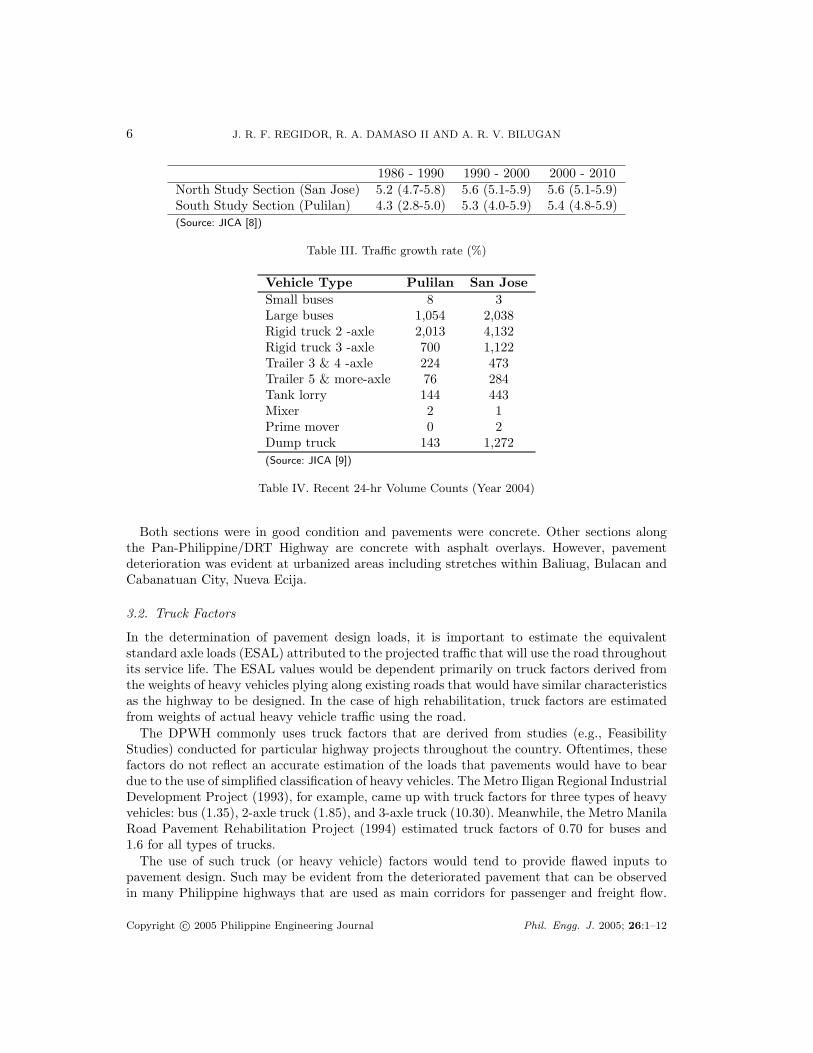
1986 - 1990 1990 - 2000 2000 - 2010North Study Section (San Jose) 5.2 (4.7-5.8) 5.6 (5.1-5.9) 5.6 (5.1-5.9)South Study Section (Pulilan) 4.3 (2.8-5.0) 5.3 (4.0-5.9) 5.4 (4.8-5.9)(Source: JICA [8])
Table III. Traffic growth rate (%)
Vehicle Type Pulilan San JoseSmall buses 8 3Large buses 1,054 2,038Rigid truck 2 -axle 2,013 4,132Rigid truck 3 -axle 700 1,122Trailer 3 & 4 -axle 224 473Trailer 5 & more-axle 76 284Tank lorry 144 443Mixer 2 1Prime mover 0 2Dump truck 143 1,272(Source: JICA [9])
Table IV. Recent 24-hr Volume Counts (Year 2004)
Both sections were in good condition and pavements were concrete. Other sections alongthe Pan-Philippine/DRT Highway are concrete with asphalt overlays. However, pavementdeterioration was evident at urbanized areas including stretches within Baliuag, Bulacan andCabanatuan City, Nueva Ecija.
3.2. Truck Factors
In the determination of pavement design loads, it is important to estimate the equivalentstandard axle loads (ESAL) attributed to the projected traffic that will use the road throughoutits service life. The ESAL values would be dependent primarily on truck factors derived fromthe weights of heavy vehicles plying along existing roads that would have similar characteristicsas the highway to be designed. In the case of high rehabilitation, truck factors are estimatedfrom weights of actual heavy vehicle traffic using the road.
The DPWH commonly uses truck factors that are derived from studies (e.g., FeasibilityStudies) conducted for particular highway projects throughout the country. Oftentimes, thesefactors do not reflect an accurate estimation of the loads that pavements would have to beardue to the use of simplified classification of heavy vehicles. The Metro Iligan Regional IndustrialDevelopment Project (1993), for example, came up with truck factors for three types of heavyvehicles: bus (1.35), 2-axle truck (1.85), and 3-axle truck (10.30). Meanwhile, the Metro ManilaRoad Pavement Rehabilitation Project (1994) estimated truck factors of 0.70 for buses and1.6 for all types of trucks.
The use of such truck (or heavy vehicle) factors would tend to provide flawed inputs topavement design. Such may be evident from the deteriorated pavement that can be observedin many Philippine highways that are used as main corridors for passenger and freight flow.
Copyright c© 2005 Philippine Engineering Journal Phil. Engg. J. 2005; 26:1–12
TRAFFIC INPUTS TO PAVEMENT DESIGN AND REHABILITATION 7
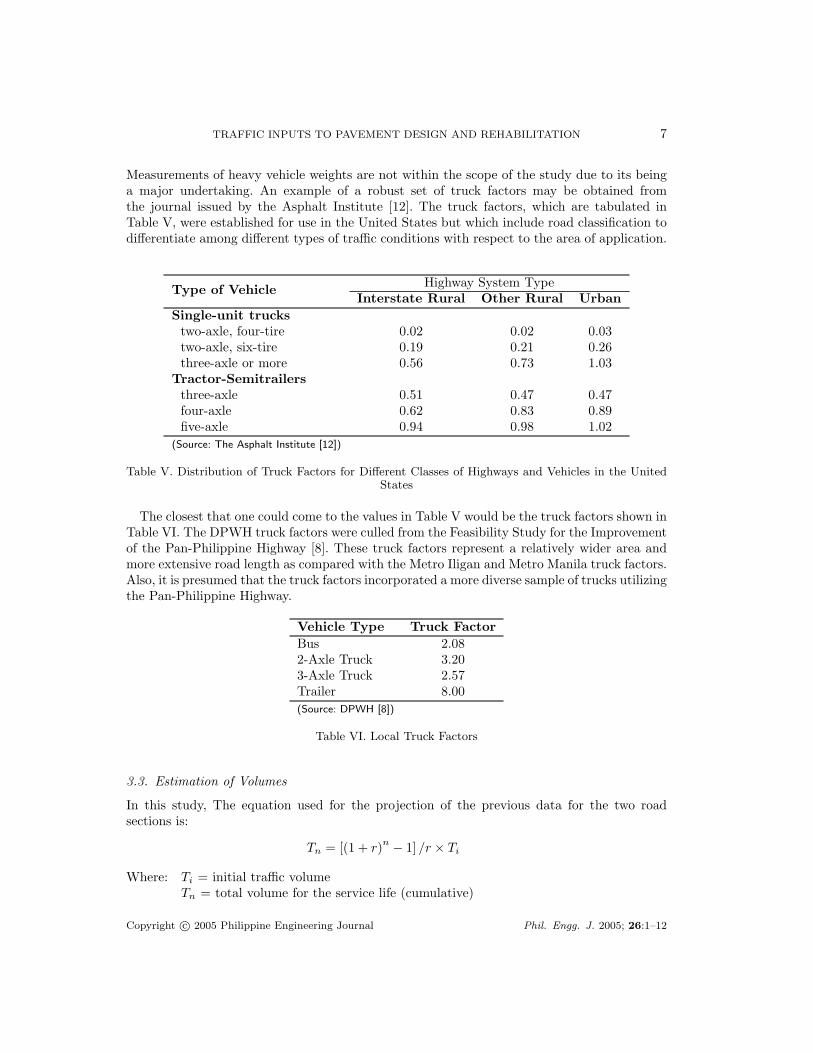
Measurements of heavy vehicle weights are not within the scope of the study due to its beinga major undertaking. An example of a robust set of truck factors may be obtained fromthe journal issued by the Asphalt Institute [12]. The truck factors, which are tabulated inTable V, were established for use in the United States but which include road classification todifferentiate among different types of traffic conditions with respect to the area of application.
Highway System TypeType of VehicleInterstate Rural Other Rural Urban
Single-unit truckstwo-axle, four-tire 0.02 0.02 0.03two-axle, six-tire 0.19 0.21 0.26three-axle or more 0.56 0.73 1.03
Tractor-Semitrailersthree-axle 0.51 0.47 0.47four-axle 0.62 0.83 0.89five-axle 0.94 0.98 1.02
(Source: The Asphalt Institute [12])
Table V. Distribution of Truck Factors for Different Classes of Highways and Vehicles in the UnitedStates
The closest that one could come to the values in Table V would be the truck factors shown inTable VI. The DPWH truck factors were culled from the Feasibility Study for the Improvementof the Pan-Philippine Highway [8]. These truck factors represent a relatively wider area andmore extensive road length as compared with the Metro Iligan and Metro Manila truck factors.Also, it is presumed that the truck factors incorporated a more diverse sample of trucks utilizingthe Pan-Philippine Highway.
Vehicle Type Truck FactorBus 2.082-Axle Truck 3.203-Axle Truck 2.57Trailer 8.00(Source: DPWH [8])
Table VI. Local Truck Factors
3.3. Estimation of Volumes
In this study, The equation used for the projection of the previous data for the two roadsections is:
Tn = [(1 + r)n − 1] /r × Ti
Where: Ti = initial traffic volumeTn = total volume for the service life (cumulative)
Copyright c© 2005 Philippine Engineering Journal Phil. Engg. J. 2005; 26:1–12
8 J. R. F. REGIDOR, R. A. DAMASO II AND A. R. V. BILUGAN
r = the traffic growth raten = service life of the structure
The projected volume could then be obtained from the equation:
Projected volume Cumulative volume Cumulative volumein year n
=in year n
−in year (n-1)
4. RESULTS AND DISCUSSION
4.1. Traffic Assessment
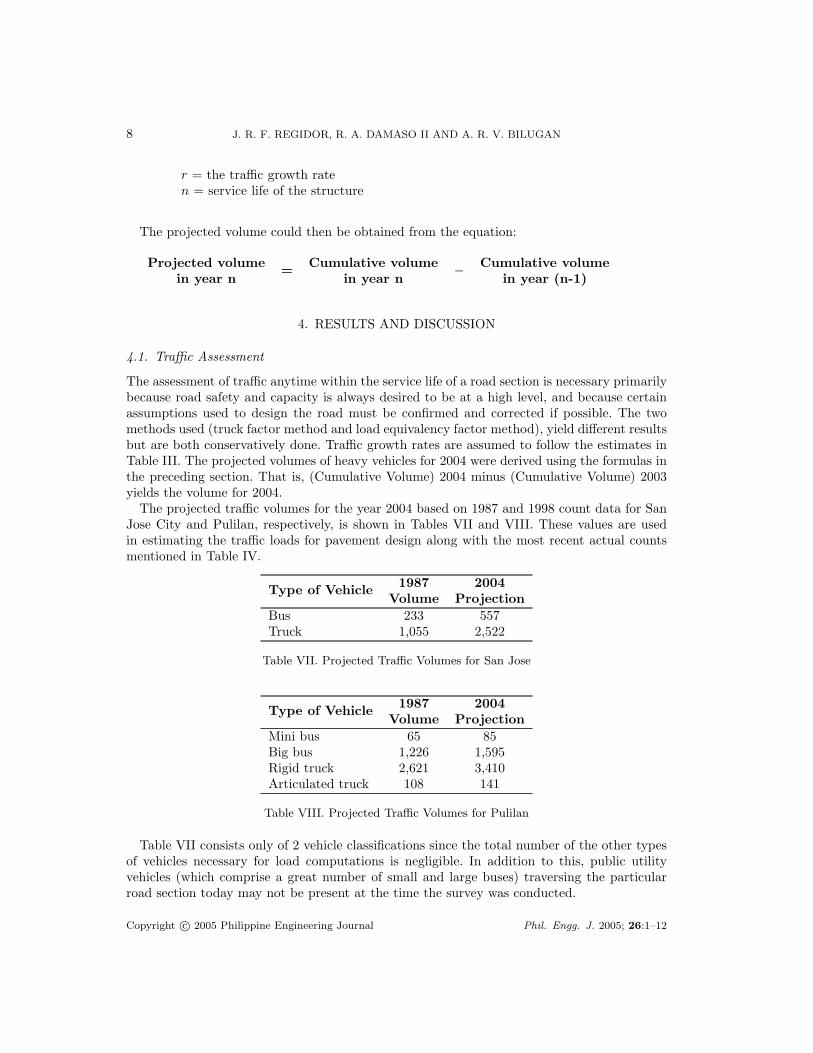
The assessment of traffic anytime within the service life of a road section is necessary primarilybecause road safety and capacity is always desired to be at a high level, and because certainassumptions used to design the road must be confirmed and corrected if possible. The twomethods used (truck factor method and load equivalency factor method), yield different resultsbut are both conservatively done. Traffic growth rates are assumed to follow the estimates inTable III. The projected volumes of heavy vehicles for 2004 were derived using the formulas inthe preceding section. That is, (Cumulative Volume) 2004 minus (Cumulative Volume) 2003yields the volume for 2004.
The projected traffic volumes for the year 2004 based on 1987 and 1998 count data for SanJose City and Pulilan, respectively, is shown in Tables VII and VIII. These values are usedin estimating the traffic loads for pavement design along with the most recent actual countsmentioned in Table IV.
1987 2004Type of VehicleVolume Projection
Bus 233 557Truck 1,055 2,522
Table VII. Projected Traffic Volumes for San Jose
1987 2004Type of VehicleVolume Projection
Mini bus 65 85Big bus 1,226 1,595Rigid truck 2,621 3,410Articulated truck 108 141
Table VIII. Projected Traffic Volumes for Pulilan
Table VII consists only of 2 vehicle classifications since the total number of the other typesof vehicles necessary for load computations is negligible. In addition to this, public utilityvehicles (which comprise a great number of small and large buses) traversing the particularroad section today may not be present at the time the survey was conducted.
Copyright c© 2005 Philippine Engineering Journal Phil. Engg. J. 2005; 26:1–12
TRAFFIC INPUTS TO PAVEMENT DESIGN AND REHABILITATION 9
The 2004 projected volume of buses in San Jose is 557 and the DPWH truck factor fromTable VI is 1.48.
ESAL = Number of vehicles × truck factor
= 5572.08 = 1, 158.56 ∼= 1, 159
The daily ESAL is computed as the summation of all ESAL values from the different heavyvehicle classifications. Thus, for the case of San Jose, the daily ESAL is computed below.
Daily ESAL =∑
(ESAL per type of vehicle)= 1, 159 + 6, 482 = 7, 641
Also, the yearly ESAL is computed as follows.
Yearly ESAL = 365× daily ESAL
= 365× 7, 641 = 2, 788, 965
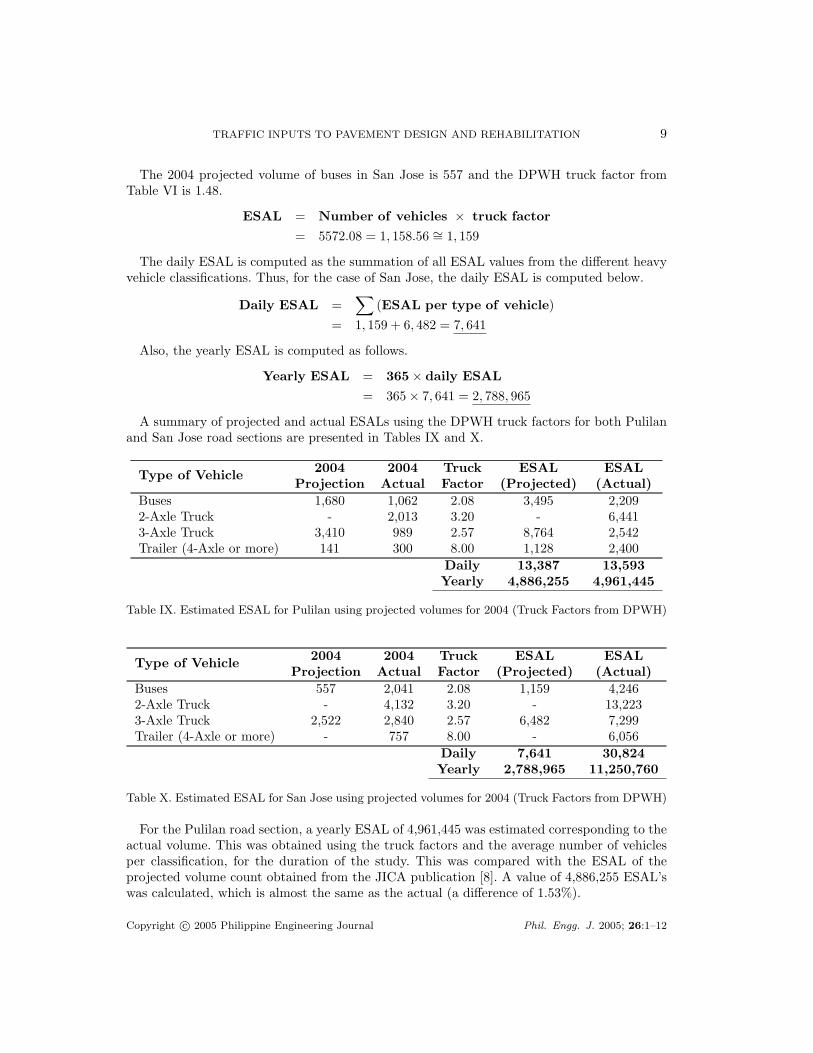
A summary of projected and actual ESALs using the DPWH truck factors for both Pulilanand San Jose road sections are presented in Tables IX and X.
2004 2004 Truck ESAL ESALType of VehicleProjection Actual Factor (Projected) (Actual)
Buses 1,680 1,062 2.08 3,495 2,2092-Axle Truck - 2,013 3.20 - 6,4413-Axle Truck 3,410 989 2.57 8,764 2,542Trailer (4-Axle or more) 141 300 8.00 1,128 2,400
Daily 13,387 13,593Yearly 4,886,255 4,961,445
Table IX. Estimated ESAL for Pulilan using projected volumes for 2004 (Truck Factors from DPWH)
2004 2004 Truck ESAL ESALType of VehicleProjection Actual Factor (Projected) (Actual)
Buses 557 2,041 2.08 1,159 4,2462-Axle Truck - 4,132 3.20 - 13,2233-Axle Truck 2,522 2,840 2.57 6,482 7,299Trailer (4-Axle or more) - 757 8.00 - 6,056
Daily 7,641 30,824Yearly 2,788,965 11,250,760
Table X. Estimated ESAL for San Jose using projected volumes for 2004 (Truck Factors from DPWH)
For the Pulilan road section, a yearly ESAL of 4,961,445 was estimated corresponding to theactual volume. This was obtained using the truck factors and the average number of vehiclesper classification, for the duration of the study. This was compared with the ESAL of theprojected volume count obtained from the JICA publication [8]. A value of 4,886,255 ESAL’swas calculated, which is almost the same as the actual (a difference of 1.53%).
Copyright c© 2005 Philippine Engineering Journal Phil. Engg. J. 2005; 26:1–12
10 J. R. F. REGIDOR, R. A. DAMASO II AND A. R. V. BILUGAN
As for the San Jose study section, a yearly ESAL of 11,250,760 was obtained correspondingto the actual volume. This is about 4 times that of the ESAL corresponding to the projectedvolume (i.e., 2,788,965). The computation was done, in a similar fashion as that of the Pulilanroad section. The same truck factors were used for the two segments. Also, the same growthrates were employed in the projection of the number of vehicles to the base year 2004.
4.2. Implications on Maintenance and Rehabilitation
The vehicle classification for the San Jose road section considers only two types of vehicles,buses and trucks, regardless of the number of axles. In the case of Pulilan, there were onlythree classifications considered, omitting 2-axle trucks. Such are perceived to be too simplisticwhen compared with the number of classifications used for the present DWPH volume countformat, where there is an expanded classification for freight vehicles. Hence, the difference inthe design and actual ESAL values is associated with a considerable degree of uncertainty.
The uncertainty is derived from the significant differences in the ESAL values calculatedusing the appropriate and corresponding truck factors as well as the distribution and volumeof trucks (i.e., according to the number of axles). Such is shown in the calculations in thepreceding section 4.1, where the number of ESAL’s for both the San Jose and Pulilan sectionsvary according to available information on truck factors as well as heavy vehicle distribution.
The high variability of ESAL values would have serious implications on maintenance andrehabilitation of roads since these are basic inputs to the design of pavements. This is becausepavement loads are indicated by ESAL values. From Tables IX and X it is easy to see theimpacts of the interaction of volume data and truck factor information on estimated ESALvalues. A difference of about 9 million axles for the San Jose section and about 7 million axlesfor the Pulilan would usually lead to changes in road design that would have implications onthe required quantity and quality of materials.
5. CONCLUSIONS
This paper examined the typical traffic and load characteristics of national roads in thePhilippines. Segments along the Pan-Philippine Highway/Doa Remedios Trinidad Highwayat Pulilan, Bulacan and San Jose, Nueva Ecija represented typical sections. Pavement loadswere estimated and compared based on both projected and actual data including derivedtruck factors and those used by DPWH. The results point to significant discrepancies betweenESAL values as influenced by differences in traffic volume, heavy vehicle composition anddistribution, and truck factors used in deriving loads.
Truck factors are sensitive to the number of samples (i.e., heavy vehicles) and the weightsof these samples. Also, important would be the mixture of loaded and empty vehicles. Lesssamples combined with weights of predominantly fully or overloaded trucks will result inhigh truck factor values. These may explain, in part, the truck factors derived for certainroad feasibility studies in the Philippines. More information on heavy vehicle volume andcomposition (according to the DPWH classification) would allow for the derivation of moreaccurate as well as more sensible truck factors for each heavy vehicle classification. Practicaltruck factors would ensure optimal and economical design of pavements.
Copyright c© 2005 Philippine Engineering Journal Phil. Engg. J. 2005; 26:1–12
TRAFFIC INPUTS TO PAVEMENT DESIGN AND REHABILITATION 11
6. RECOMMENDATIONS
If a Pavement Management System (PMS) is desired particularly for local government units,a history of traffic must be documented, as well as the current state or physical condition ofthe pavement in concern. This will be very useful in planning for future procedures related topavement maintenance. Schedules of rehabilitation must be recorded as these may be used inrefining the timing of these periodic preservation works.
Data collection may involve advanced tools and made more accurate if actual 24-hour trafficcounts are done, instead of projecting the available 10-hr data for the computation of thedaily (24 hrs) load. Also, pavement sections along critical routes such as truck routes must begiven particular attention. Estimates or past computations of axle loadings may be revisitedgiven the regular traffic counting program of the DPWH. Truck factors need to be updatedregularly and according to the heavy vehicle categories of DPWH’s expanded classification.As such, significant changes in freight traffic may be monitored and appropriate pavementmaintenance may be applied on affected road sections.
REFERENCES
1. American Association of State Highway and Transportation Officials (1986) AASHTO Guide forDesign of Pavement Structures, 444 N. Capitol Street, N. W. Suite 225 Washington, D. C.
2. Bilugan, A.R.V, and Damaso R.A. II (2005) Assessment of Traffic Inputs to Pavement Design andRehabilitation, Final Report of Undergraduate Research, Department of Civil Engineering, College ofEngineering, University of the Philippines.
3. Department of Public Works and Highways (1998) Compilation of 1998 Annual Average DailyTraffic (AADT) (Revised Nationwide Traffic Counting Program, Department of Public Worksand Highways, Philippines.
4. Department of Public Works and Highways (2004) DPWH Safety Manual Temporary Signingand Management for Maintenance and Construction Works, Department of Public Works andHighways, Philippines.
5. Domingo, Razon C. (2002) Adopting A Pavement Management System (PMS) for LocalGovernments, Unpublished M.S.C.E. Thesis, University of the Philippines, Diliman
6. Ikeda, Y. (2005) Axle Load Survey in the Philippines, Proceedings of the 13th Annual Conferenceof the TSSP, CD-ROM.
7. Infrastructure Planning and Research Services Division (1999) Annual Average Daily Traffic 1998,Department of Public Works and Highways, Philippines.
8. Japan International Cooperation Agency (1987) Feasibility Study of the Road ImprovementProject on the Pan-Philippine Highway (Philippine Japan Friendship Highway), Departmentof Public Works and Highways, Philippines.
9. Japan International Cooperation Agency (2005) The Inter-Regional Passenger and Freight FlowSurveys in the Republic of the Philippines, Final Report, Department of Transportation andCommunications.
10. Mannering, F. and Kilareski, W. (1990) Principles of Highway Engineering and Traffic Analysis,John Wiley and Sons Inc., USA.
11. Muncal, A. E. and Sagum, S. E. (2004) A Study on Vehicle Axle Loads of Trucks Passing throughthe South Luzon Expressway (SLEX). Final Report of Undergraduate Research, Department of CivilEngineering, College of Engineering, University of the Philippines, Diliman.
12. The Asphalt Institute (1991) Thickness Design-Asphalt Pavements for Highways & Street,Manual Series No. 1, Lexington, KY.
13. Thomson, R. J. B. (1976) The Justification of the Need for Highway Maintenance, An Engineer’s View.Proceedings of Q & R Road Design and Highway Maintenance, Planning and Transport Researchand Computation Int’l Co. Ltd., England.
14. Wright, P. (1996) Highway Engineering, 6th edition, John Wiley and Sons, Inc., Canada.
Copyright c© 2005 Philippine Engineering Journal Phil. Engg. J. 2005; 26:1–12

12 J. R. F. REGIDOR, R. A. DAMASO II AND A. R. V. BILUGAN
Copyright c© 2005 Philippine Engineering Journal Phil. Engg. J. 2005; 26:1–12