Embed Size (px)
Citation preview

Journal of Education and Learning; Vol. 9, No. 5; 2020 ISSN 1927-5250 E-ISSN 1927-5269
Published by Canadian Center of Science and Education
121
Assessment of Training Effectiveness Adjusted for Learning (ATEAL) Part I: Method Development and Validation
Thomas Samuel1, Razia Azen2 & Naira Campbell-Kyureghyan1,3 1 Department of Industrial and Manufacturing Engineering, University of Wisconsin, Milwaukee, Milwaukee, WI, USA 2 Department of Educational Psychology, University of Wisconsin, Milwaukee, Milwaukee, WI, USA 3 Department of Mechanical Engineering, Merrimack College, North Andover, MA, USA
Correspondence: Naira Campbell-Kyureghyan, School of Science and Engineering, Merrimack College, North Andover, MA, 01845, USA. E-mail: [email protected]
Received: July 8, 2020 Accepted: August 17, 2020 Online Published: September 11, 2020
doi:10.5539/jel.v9n5p121 URL: https://doi.org/10.5539/jel.v9n5p121
Abstract
Training programs are a popular method, in industry globally, to increase awareness of desired concepts to employees and employers and play a critical part in changing or supporting performance improvements. The predominant method to assess the effectiveness of training programs is to have the participants answer Multiple Choice Question (MCQ) and True/False (T/F) questions after the training; however, the metrics typically used to report the outcome of such assessments have drawbacks that make it difficult for the trainer and organization to easily identify the concepts that need more focus and those that do not. This study introduces measures of the Assessment of Training Effectiveness Adjusted for Learning (ATEAL) method, which compensate the assessment scores for prior knowledge and negative training impact in quantifying the effectiveness of each concept taught. The results of this method are compared to the results of the most popular methods currently used. A simulation of various scenarios and the training effectiveness metrics that result from them is used to illustrate the sensitivity and limitation of each method. Results show that the proposed coefficients are more sensitive in detecting prior knowledge and negative training impact. Additionally, the proposed ATEAL method provides a quick and easy way to assess the effectiveness of the training concept based on the assessment results and provides a directional guide on the changes that need to be made to improve the training program for the participants. A companion paper expands the concepts using results from actual training sessions in multiple industries.
Keywords: multiple choice question, learning assessment, prior knowledge, training effectiveness
1. Introduction
Employee training in work environments is a popular way to increase competency and/or change expected behavior (Tai, 2006). Globally, organizations spent $359 billion on training in 2016 (Glaveski, 2019) with the US spending a total of $87.6 billion in 2018 (Freifeld, 2018). With this substantial amount of resources being invested, it is critical that organizations are able to ensure that the training is effective and is leading to the expected changes. Measuring training effectiveness using training evaluations or assessments is a the most widely used method to understand and quantify the deficiencies in the training programs and in developing prescriptions for improving (Alvarez, Salas, & Garofano, 2004; Simkins & Allen, 2000). Of the various models presented by Campbell-Kyureghyan, Ahmed and Beschorner (2013) and in the meta-analysis conducted by Alvarez et al. (2004), the Kirpartick’s model (Kirkpartick, 1967), remains one of the most frequently used in training environments to measure training effectiveness (Arthur Jr., Bennett Jr., Edens, & Bell, 2003; Salas & Cannon-Bowers, 2001).
The Kirkpatrick’s model is comprised of four evaluation levels that measure participants Reaction (Level 1), Learning (Level 2), Behavior (Level 3) and Results (Level 4). The evaluation of Learning (Level 2) by participants, is typically measured by scores attained in post-test assessments or by score changes between pre- and post-test assessments (Dimitrov & Rumrill Jr., 2003). The tests that are administered are typically Multiple Choice Question (MCQ) tests as they are the most expeditious to administer (Bar-Hillel & Budescu, 2005). As

jel.ccsenet.o
we assess effective, knowledge
A pre-testbetween thdifferent seffectiveneand Rumrpre-/post-tWagner (2and the pethe four qscores, or influenced
Despite alan easy mdirectionalfor each ceffectivene
• Quick
• Easily
• Visua
• Usabloption
The aim omethodoloresults.
2. Method
2.1 Learni
The evaluavarious poterminologwas quadrdescribed correct ans“CC” indicorrect ans
In Figure 1
• CC: T
org
the scores, itif the particip
e of any of the
t/post-test assehe pre-test anstatistics, suchess of the trainrill Jr. (2003), test assessmen2016). These merformance of tquadrants of le
the differenced by these four
l the informatmethod to helpl guidance on concept traineess of concept
kly, accurately
y interpreted, u
ally impactful t
le in Multiple n is present
f this paper is ogy that satisfi
d
ing Assessmen
ation of traininossible outcomgy that will be rants was condwith two letteswer, and “I” iicates a correcswer on the po
Figure 1. Ter
1, each quadra
The question is
t is importantpants needed concepts due
essment moded post-test assh as score dening and the eBonate (2000
nts results into measures give the participantearning as pose in pre- and learning conc
ion that can bp trainers quithe countermeed. Hence, ths:
& repeatably
understood and
to communicat
Choice Quest
to introduce ties the gaps st
t Notation
ng effectivenemes of the anused in this pa
ducted by Walsers, the first beindicates an in
ct answer on bost-test.
rminology desc
ant contains a f
s answered cor
Journal of Ed
t to clearly beto have the tto the training
el is effective sessments (Saeltas, ANOVAxtensive revie
0) and Tannebquadrants of san overall un
ts in each quessitive, negativpost-test score
cepts and their
e determined ckly and effe
easures to be tahere exists a n
d acted upon to
te easily to ind
ion (MCQ) an
the Assessmentated above an
ess in a pre- annswers, as shaper. A similarstad and Wagneing the pre-te
ncorrect answerboth tests, whil
cribing pattern
frequency (or p
rrectly in both
ducation and Le
122
e able to meatraining at all
g.
at measuringamuel, Azen, &A, and ANCO
ews of their bebaum and Yukstudy was conderstanding instion or concepve, retained anes may produinteractions th
from the availectively undersaken to improvneed for a n
o improve outc
dustry stakehol
nd True/False
nt of Training nd validates th
nd post-test ashown in Figurr method to br
ner (2016). Eacest result and tr or the selectile “IC” repres
n of responses i
percentage) of
the pre-test an
earning
sure if the tral and/or if the
g the change & Campbell-KOVA, have b
enefits and drakl (1992). A nducted on Eco
nto the effectivpt trained. Wand zero and aruce misleadinghat cannot be d
lable assessmestand the learve the learningew methodolo
comes
lders
(T/F) instance
Effectiveness e methodology
sessment begire 1. Additionreak down pre-ch combinationthe second theion of I Don’t sents an incorr
in a pre-/post-t
f respondents a
nd post-test, in
aining of the e participants
in the score Kyureghyan, 2been employe
awbacks are denovel method onomics studenveness of the tlstad and Wagrgued that sol
g results as eacdiscerned easily
ent methods, thrning gaps by g effectivenessogy to help a
es when an I D
Adjusted for Ly using scenar
ins with the unnally, Figure -/post-test assen of pre- and pe post-test resuKnow (IDK).
rect answer on
test assessmen
and can be inte
ndicating that t
Vol. 9, No. 5;
concepts has regressed in
of the particip2019). A varieed to measureetailed by Dimto break downnts by Walstadtraining as a wgner (2016) delely using posch of the scory.
here does not concept and
s of the participassess the tra
Don’t Know (I
Learning (ATErios and simul
nderstanding o1 summarizes
essment resultspost-test answult. “C” indicaThus, for exam
n the pre-test a
nt model
erpreted as foll
the participant
2020
been their
pants ty of e the
mitrov n the d and whole fined t-test res is
exist give
pants ining
IDK)
EAL) ation
of the s the s into ers is ates a mple, and a
ows:
s had

jel.ccsenet.org Journal of Education and Learning Vol. 9, No. 5; 2020
123
pre-knowledge of the question or concept
• CI: The question is answered correctly in the pre-test and incorrectly or as IDK in the post-test, indicating that the participants experienced negative learning of the question or concept
• IC: The question is answered incorrectly or as IDK in the pre-test and correctly in the post-test, indicating that the participants learned the concept
• II: The question is answered incorrectly or as IDK in both the pre- and post-test, indicating that the participants did not learn the question or concept
2.2 Traditional Assessment Metrics
Assessment metrics are used to measure the effectiveness of the training and to help determine if there has been an increase in the level of knowledge for the learning objectives among the participants. There are several traditional metrics used to assess pre-/post-training effectiveness. It is important to note that learning is the measure of success, and that training is one technique that can be used to impart the desired knowledge. In this manuscript training impact is the impact of the training on learning of the concepts that were trained.
The most common method to assess testing results for a certain question or concept is to report the number of participants who answered a certain question correctly compared to the total number of participants who answered the question (Campbell-Kyureghyan et al., 2013). It can be used both in a pre-/post-training assessment model or in a post-training only assessment model. The formula (1) below illustrates the calculation in the case of a pre-/post-training assessment model with an IDK option, and computes the number of correct post-test responses as a proportion of the total responses:
Total Percent Correct (TPC) = (1)
The key benefits of TPC are that it can be easily calculated, explained, and understood by the training participants and other organizational stakeholders. However, it gives broad stroke representations of the learning of the participants and thus the performance of the trainee. It is very difficult to discern participant pre-knowledge from actual learning and the use of this metric to make improvements to the training programs is problematic. Additionally, this metric does not provide an understanding of the negative learning that any of the participants may have experienced, where negative learning is defined as answering the pre-training question correctly and answering incorrectly on the post-training assessment (CI).
Another method to assess learning is to examine the difference between the number of participants who answered the question correctly in the post-test and the pre-test, which can only be used when the same questions are administered before and after the training (Bonate, 2000). The formula (2) below illustrates the calculation in the case of a pre-/post-training assessment model with or without an IDK option. As seen in Figure 1, both the IDK and an incorrect answer are treated identically.
Post – Pre-Training Percent Correct (PPPC) = − = (2)
Similar to the TPC metric, this measure is easy to calculate, explain and understand. It can also be used to determine the number of participants who answered a certain question correctly. Additionally, it compensates for participants who might have experienced negative learning. However, it is difficult to easily discern what percentage of the participants actually learned the new concept as this measure is insensitive to the prior knowledge of the participants. This also means that it does not allow for determination of the total knowledge of the participants.
2.3 Assessment of Training Effectiveness Adjusted for Learning (ATEAL)
In an effort to overcome the deficiencies of the metrics detailed above, this paper introduces and validates the ATEAL method that compensates the assessment scores for trainee prior knowledge and guessing. A description of this method starts with the introduction of the Learning Adjustment Coefficient (LAC) and the Net Training Impact Coefficient (NTIC). A number of intermediate metrics and parameters, which will be subsequently used in the calculation of these two coefficients, are defined first.
2.3.1 Prior Knowledge (PK)
This metric represents the proportion of all participants who answered a question correctly in the post-training assessment who also answered correctly in the pre-training assessment; it is calculated using the formula (3) below.

jel.ccsenet.org Journal of Education and Learning Vol. 9, No. 5; 2020
124
Prior Knowledge (PK) = (3)
This metric ranges from 0 to 1, where a 0 implies that none of the participants who answered the question correctly in the post-training assessment had any prior knowledge of the concept and 1 implies that all of the participants who answered the question correctly in the post-training assessment had prior knowledge of the concept. That is, a higher PK indicates greater prior knowledge among the participants. This metric is specifically different from CC as a fraction of all the participants answering the question since it helps better estimate the proportion of correctly answering participants with prior knowledge.
2.3.2 Positive Training Impact (PTI)
This metric represents the proportion of all the participants who needed to learn the concept (responded incorrectly or IDK in the pre-test assessment) who actually did learn the concept as indicated by their response changing to correct in the post-test. It is described below in (4).
Positive Training Impact (PTI) = (4)
This metric ranges from 0 to 1, where a 0 implies that none of the participants who could potentially learn actually learned the concept, and a 1 implies that all of the participants who could potentially learn actually learned the concept. That is, a higher PTI indicates more learning among the participants who did not know the concept prior to training. This metric is specifically different from IC as a fraction of all the participants answering the question since it helps better estimate the proportion of participants who did not know the concept prior to training who learned the concept.
2.3.3 Negative Training Impact (NTI)
This metric represents the proportion of participants who presumably knew the concept prior to training (answered correctly in the pre-training assessment) who answered incorrectly or IDK in the post-test assessment, potentially due to confusion during the training or guessing. It is described below in (5).
Negative Training Impact (NTI) = (5)
This metric ranges from 0 to 1, where 0 implies that none of the participants were negatively impacted by the training and 1 implies that all of the participants (who knew the material prior to training) were negatively impacted by the training. That is, a higher NTI indicates that more participants “unlearned” the material after training. This metric is specifically different from CI as a fraction of all the participants answering the question since it helps better estimate the proportion of participants who had a negative impact from the training.
2.3.4 Learning Adjustment Coefficient (LAC)
The LAC is intended to measure the necessity of the training. That is, it compares the positive impacts of the training, determined through the PTI, to the prior knowledge (PK) of the participants. This difference between (actual) learning and prior knowledge is calculated (6) as:
PTI – PK = − (6)
This metric ranges from -1 to +1. To make the scale more intuitive, it is transformed to represent a proportional change by the following transformation, resulting in the Learning Adjustment Coefficient as shown in (7):
LAC = ( )
(7)
The LAC coefficient ranges from 0 to 1, where a 0 implies that all the respondents had prior knowledge so there was no actual learning for that specific concept/question, and 1 implies that there was no prior knowledge and all the respondents who needed to learn the concept did learn the concept. Higher values of LAC thus indicate that the training was needed, and effective, for a higher proportion of the respondents. Lower values indicate that either the training was ineffective, or a substantial number of respondents had previous knowledge and did not require training on the concept.
2.3.5 Net Training Impact Coefficient (NTIC)
The NTIC is intended to measure the negative impact of the training session. That is, it compares the positive

jel.ccsenet.o
impacts ofThe differe
This metrilost knowlall the respthat there negative e
2.3.6 Train
To summconcept/quNTIC are on the qua
Quad 1 coeither priothe traininpercentagelearning anFigure 2. Tthe changethe participnegative lethat there Quad 3 copositive lereduction iit indicates
2.4 Method
Two approscenarios w
org
f the training, ence in the lea
ic ranges fromledge for that spondents who were more poffects, and a v
ning Effectiven
marize these muestion (as weplotted togeth
adrant an item
ontains the queor knowledge ong is larger the who experiennd no prior knThis effectivene in the gradienpants had morearning than pwas significan
ontains the queearning. It is uin the level ofs a deficiency
ds to Evaluate
oaches will bewill be used to
determined tharning and neg
m -1 to +1, whespecific conceneeded to lear
ositive than nealue of 0 mean
ness Matrix (T
measures andell as determiner as illustrateis in, where th
Figure 2. Train
estions/conceptor negative leahan the percenced negative nowledge or nness decreases nt of color fro
re prior knowlepositive learninnt prior knowlestions for whiundesirable forf knowledge foin the training
e Measures
e used to como illustrate the
Journal of Ed
hrough PTI, toative impact is
NTIC = PTI
ere a -1 impliept/question, an
rn the concept egative effectsns the positive
TEM)
d allow for ve appropriate
ed in Figure 2. he quadrants fo
ning Effective
ts for which tharning. That is,entage who ha
learning. In thnegative learnin magnitude
om dark green edge than posing. While for ledge so trainiich the participr questions to lor the concept g content, asses
mpare the tradie meaning of e
ducation and Le
125
o the negatives calculated in
I – NTI =
es that all the nd a 1 implies did learn the c
s from the traiand negative
visual identifadjustment if The results re
or which NTIC
eness Matrix w
he percentage , the percentagad knowledgehe perfect caseing, then the as a question to yellow. Qu
itive learning; items in this qing time couldpants had subsland in this qubased on the t
ssment questio
itional and proeach metric and
earning
e impact of tra(8) as: −
respondents exthat there was
concept. Valueining. Values effects were eq
fication of ththe training w
egarding effectC is below 0 are
with the quadra
of participantsge of participane before traine scenario, if aquestion woulscores closer t
uad 2 contains however, the q
quadrant the trd potentially bstantial negativuadrant as it imtraining or wer
on, or method o
oposed metricsd their relation
aining (NTI) o
xperienced nes no negative tes of NTIC higlower than zequal.
he training efwas ineffective)tiveness can bee combined.
ant layout
s had more posnts who learneing and is alall participantsld score as (1,to (0.5, 0). Thithe questions/question did noraining was effbe better utilizve learning anmplies that there forced to guof training.
s. First, meaninship. The use
Vol. 9, No. 5;
of the respond
egative trainingtraining impacgher than 0 indero indicate gr
ffectiveness f), the LAC ane determined b
sitive learninged the concept so larger thans had only pos, 1) on the axis is illustrated/concepts for wot experience
ffective, it indied on other to
nd it outweighse participants huess. In both c
ingful hypothee of these scen
2020
dents.
(8)
g and t and
dicate reater
for a d the based
than from
n the sitive es in with
which more cates
opics. s any had a cases,
etical narios
jel.ccsenet.org Journal of Education and Learning Vol. 9, No. 5; 2020
126
allows for clear expectations and intuitive insight into the meaning of the metrics. Second, a simulation was performed to allow for investigating a larger number of possible outcomes and scenarios, across the range of possibilities. The results of the traditional and proposed metrics were compared to determine their relationship and aid in interpretation of all metrics.
2.4.1 Hypothetical Scenarios
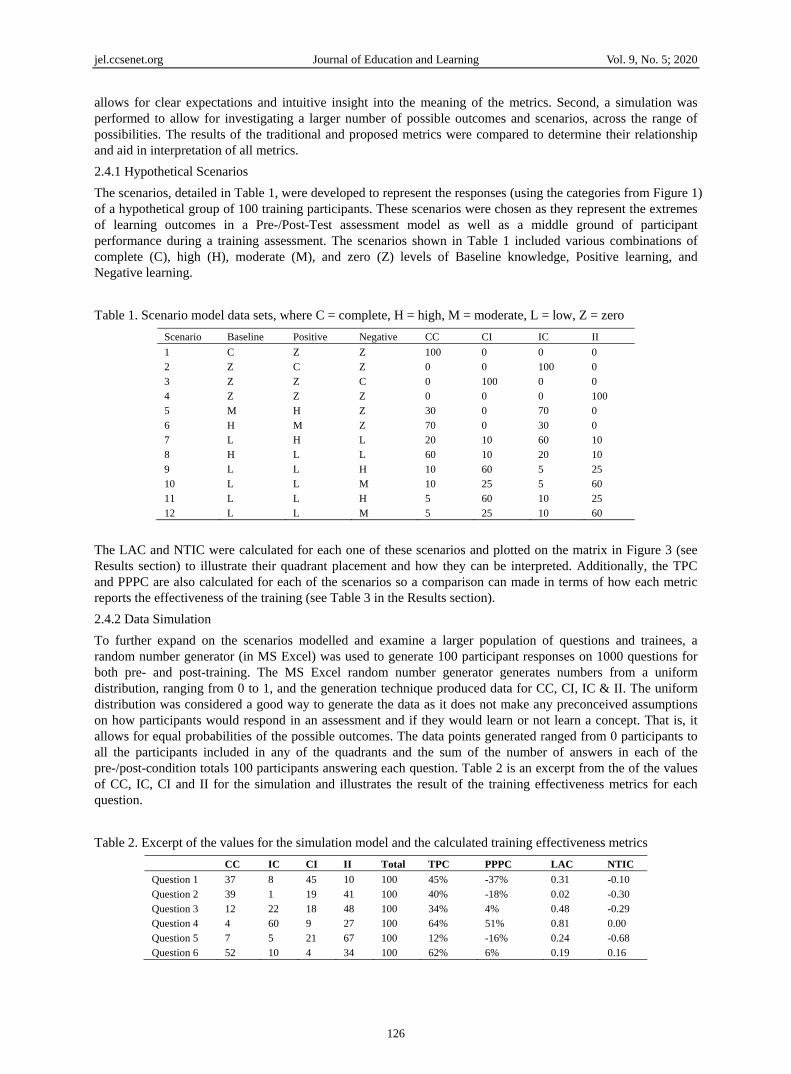
The scenarios, detailed in Table 1, were developed to represent the responses (using the categories from Figure 1) of a hypothetical group of 100 training participants. These scenarios were chosen as they represent the extremes of learning outcomes in a Pre-/Post-Test assessment model as well as a middle ground of participant performance during a training assessment. The scenarios shown in Table 1 included various combinations of complete (C), high (H), moderate (M), and zero (Z) levels of Baseline knowledge, Positive learning, and Negative learning.
Table 1. Scenario model data sets, where C = complete, H = high, M = moderate, L = low, Z = zero
Scenario Baseline Positive Negative CC CI IC II
1 C Z Z 100 0 0 0 2 Z C Z 0 0 100 0 3 Z Z C 0 100 0 0 4 Z Z Z 0 0 0 100 5 M H Z 30 0 70 0 6 H M Z 70 0 30 0 7 L H L 20 10 60 10 8 H L L 60 10 20 10 9 L L H 10 60 5 25 10 L L M 10 25 5 60 11 L L H 5 60 10 25 12 L L M 5 25 10 60
The LAC and NTIC were calculated for each one of these scenarios and plotted on the matrix in Figure 3 (see Results section) to illustrate their quadrant placement and how they can be interpreted. Additionally, the TPC and PPPC are also calculated for each of the scenarios so a comparison can made in terms of how each metric reports the effectiveness of the training (see Table 3 in the Results section).
2.4.2 Data Simulation
To further expand on the scenarios modelled and examine a larger population of questions and trainees, a random number generator (in MS Excel) was used to generate 100 participant responses on 1000 questions for both pre- and post-training. The MS Excel random number generator generates numbers from a uniform distribution, ranging from 0 to 1, and the generation technique produced data for CC, CI, IC & II. The uniform distribution was considered a good way to generate the data as it does not make any preconceived assumptions on how participants would respond in an assessment and if they would learn or not learn a concept. That is, it allows for equal probabilities of the possible outcomes. The data points generated ranged from 0 participants to all the participants included in any of the quadrants and the sum of the number of answers in each of the pre-/post-condition totals 100 participants answering each question. Table 2 is an excerpt from the of the values of CC, IC, CI and II for the simulation and illustrates the result of the training effectiveness metrics for each question.
Table 2. Excerpt of the values for the simulation model and the calculated training effectiveness metrics
CC IC CI II Total TPC PPPC LAC NTIC
Question 1 37 8 45 10 100 45% -37% 0.31 -0.10 Question 2 39 1 19 41 100 40% -18% 0.02 -0.30 Question 3 12 22 18 48 100 34% 4% 0.48 -0.29 Question 4 4 60 9 27 100 64% 51% 0.81 0.00 Question 5 7 5 21 67 100 12% -16% 0.24 -0.68 Question 6 52 10 4 34 100 62% 6% 0.19 0.16

jel.ccsenet.org Journal of Education and Learning Vol. 9, No. 5; 2020
127
3. Results
Results of the simulations are presented with an emphasis on comparing the traditional and newly proposed assessment metrics, and the relationship between the two new metrics.
3.1 Scenario Results
Table 3 illustrates the metrics calculated for each of the twelve scenarios detailed in Table 1. In scenario 1, where all the participants have pre-knowledge of the concept taught, the TPC reports the score as 100% implying that all the participants learned the concept, which is an incorrect interpretation of the training effectiveness. The PPPC reports the score as 0% implying that none of the participants learned the concept. Although this is a correct interpretation of training effectiveness, it is not distinguishable from scenario 4 and it would not be possible to distinguish concepts in which the participants had all pre-knowledge or zero learning. Looking at the two new coefficients for scenario 1, the LAC is 0 implying that 100% of the participants had prior knowledge and none learned the topic during training, and an NTIC of 0 implying that there is equal amount of positive training impact and negative training impact. The two introduced coefficients must be examined together to clearly understand the performance of the participants for each scenario.
Table 3. Metrics calculated for each scenario
Scenario Baseline Positive Negative TPC PPPC LAC NTIC
1 C Z Z 100% 0% 0 0 2 Z C Z 100% 100% 1 1 3 Z Z C 0% -100% 0.5 -1 4 Z Z Z 0% 0% 0.5 0 5 M H Z 100% 70% 0.85 1 6 H M Z 100% 30% 0.65 1 7 L H L 80% 50% 0.80 0.52 8 H L L 80% 10% 0.46 0.52 9 L L H 15% -55% 0.25 -0.69 10 L L M 15% -20% 0.21 -0.64 11 L L H 15% -50% 0.48 -0.64 12 L L M 15% -15% 0.40 -0.69
Note. TPC – Total Percent Correct; LAC – Learning Adjustment Coefficient; PPPC – Post – Pre-Training Percent Correct; NTIC – Net Training Impact Coefficient.
To visualize the implication of each scenario, the TEM is provided in Figure 3 and includes each scenario labeled by its number. From the matrix we can easily see that scenarios 2, 5, 6, 7, and 8 show a positive training impact on the participants, to varying degrees, and it is easy to visualize the magnitude of the impact based on how the points lie in the upper right quadrant. We can also see that scenario 8, along with scenario 1, consists of more prior knowledge than learning, representing cases in which the training was perhaps unnecessary. Scenario 4 shows zero learning impact, and participants had equal learning and prior knowledge. Finally, scenarios 3, 9, 10, 11 & 12 show more negative training impact that positive impact. Similar interpretations for most, but not all, scenarios can be made by looking at the PPPC. However, it is not possible to make that same determination using the TPC. Thus, the LAC and NTIC provide a finer resolution on the PPPC and TPC. This additional information will help trainers and organizations better understand whether the concept needs to be taught and ensure that the participants experience more positive than negative learning due to the content presented or method by which it was delivered.

jel.ccsenet.o
3.2 Simula
Figure 4 ildata points-1) to (1, 1PK. In eithcontain anthe TEM d
The simulsensitivitytraining imTPC, (b) Pthe changeand right oof -0.55 in
org
ation Results
llustrates the Ls (i.e., test que1) as we wouldher case, with
ny data points. does not contai
Figur
lated data way of the TPC, mpact. StartingPPPC, (c) LACes in prior knoof the scatter pndicating that
Figure 3. Tr
LAC and NTIestions or concd expect in par
h a large LAC Similarly, forin any data poi
re 4. Training E
as used to proPPPC, LAC a
g with prior knC, and (d) NTIowledge with aplot are relatedas the percent
Journal of Ed
raining Effecti
C values of thcepts), plotted rticipant answethe NTI cann
r low LAC theints.
Effectiveness M
ovide a large and the NTIC nowledge (PK)C on the y-axia slope of -0.0d to the resultstage of prior k
ducation and Le
128
iveness Matrix
he simulated don the TEM.
ers. Larger valnot be small, sere can be littl
Matrix for the
number of dto changes in
), Figure 5 preis, and PK on t072. The striats for very low knowledge incr
earning
x for the 12 sce
data, calculatedThe data poinlues of LAC reso the lower rile positive lear
1000 simulate
different casesn percentage oesents the valuthe x-axis. TPtions of data pvalues of CC.reases from 0%
enarios
d for each of tnts are observeesult from eithight corner of rning, so the u
ed data points.
s and allows of prior knowlues for the simC is observed
points observed PPPC has a n% to 100%, th
Vol. 9, No. 5;
the 1000 simud to range from
her high PTI orthe TEM doe
upper left corn
for examiningledge and neg
mulated cases oto be insensiti
d at the bottomnegative correlhe PPPC decre
2020
ulated m (0, r low s not
ner of
g the gative of (a) ve to
m left ation
eases,

jel.ccsenet.o
although textending approachelimited, wi
We observmuch morplots for thto PK beinlow values
Figure 5
Next, the cFigure 6 iPPPC are percentagegiven valuis observewith NTI. sensitive oparticipant
org
the total knowfrom (0, 1) tos 0% and PPPith a maximum
ve that LAC hare so than PPPhe other measung one compons of PK. Finall
5. Sensitivity a
changes in theillustrates the
observed to e of negative true of NTI sinceed to be insens
This is expecof all the mets can only exp
wledge is not do (1, 0) as bothC can assume
m of 0.0 when
as a very stronPC, to changesures, demonstrnent of LAC. Aly, as expected
a
c
analysis of the with
e four metrics changes in (a)have a negat
raining impacte IC always rasitive to NTI. cted as the NTetrics to NTI. perience PTI w
Journal of Ed
decreasing. Thh PK and PPPany value. CoPK equals 1.0
ng negative cors in prior knowrating a strongAs PK increas
d, the NTIC app
simulation valh increasing pri
are investigat) TPC, (b) PPtive correlatiot increases, boanges from 0 tFinally, we ob
TIC is directlyAs NTI app
when there is n
ducation and Le
129
he plot also illC are related t
onversely, as IC0.
rrelation of -0.wledge. The pger linear relatises the maximupears insensiti
lues of (a) TPCior knowledge
ted as the negaPPC, (c) LAC on of -0.77 anth the TPC an
to 100 while Cbserve that NT
y dependent onproaches zero no NTI.
earning
lustrates that dto changes in C nears 0%, PK
.82 with PK, inplot for LAC aionship with Pum value of Live to prior kno
C, (b) PPPC, (ce (PK, x-axis)
ative training iand (d) NTIC
nd -0.62, respnd PPPC decreaCI is directly reTIC has a stron the negativewe observe t
data does not IC. As IC appK approaches
ndicating that also exhibits lePK. The emptyLAC is limited,owledge.
b
d
c) LAC, and (d
impact varies C with respectpectively, indiase. PPPC haselated to NTI. ong negative ce training impathat NTIC ran
Vol. 9, No. 5;
occur above aproaches 100%100% and PPP
it is very sensess scatter thany quadrants are, and vice vers
d) NTIC (y-ax
from 0% to 1t to NTI. TPCicating that as a lower limit LAC, as expe
correlation of act and is the nges from 0−
2020
a line %, PK
PC is
itive, n the e due sa for
is)
00%. C and s the for a
ected, -0.82 most
−1 as

jel.ccsenet.o
Figure 6. S
4. Discuss
The analywill discusimulation
4.1 Scenar
In applyinthat Quad illustrates a higher pexperienceexperiencidetermine knowledgenot test onparticipantlarger perworst-casetraining codetermine analyze an
org
Sensitivity ana
sion
sis conducted ss the merits
n results.
rio Compariso
ng the ATEAL1 (Figure 3) perfect learnin
percentage of ed negative traing positive trathe concepts
e. In these casen it as it is reduts. Scenarios 3centage of pae scenarios anontent and/or the number o
nd develop cor
a
c alysis of the va
n
illustrates trenand drawback
ons
L method and pranges from (
ng as in Scenaparticipants exaining. When aining (Scenarfor which thees, it would beundant; that is3, 9, 10, 11, aarticipants expd represent cathe delivery m
of participants rrective action
Journal of Ed
alues of (a) TPCnegative trainin
nds in the metks of each of t
plotting the sce(0.5, 0), whichario 2. Scenarioxperienced pothere is a hig
rios 1 & 8) we ere are a largee advisable fors, valuable traiand 12 lie in Qperiencing moases where themethod. It is that experienc
ns to prevent t
ducation and Le
130
C, (b) PPPC, (ng impact (NT
trics used to rethe metrics an
enarios on theh illustrates zeos 5, 6, and 7 ositive learninggher percentage
observe that tr percentage o
r the trainer to ining time couQuad 3 and thre negative le
e participants wimportant for ced higher NTthis from futur
earning
(c) LAC, and (TI, x-axis)
eport training nd their behav
e Training Effeero learning aslie in Quad 1 ag than those te of participanthey lie in Quaof participantsspend minima
uld be better sphese scenarios earning than pwere either guthe training p
TI, pay attentiore occurrences
b
d (d) NTIC (y-ax
effectiveness.vior in the var
ectiveness Mats in Scenario as all of these that had prior nts having priad 2. Thus, it is that had a hial time reviewipent on concep
represent caspositive learniuessing or werprovider and ton to these cons. Additionally
Vol. 9, No. 5;
xis) with increa
In this sectiorious scenarios
trix (TEM), w4, to (1, 1), wscenarios illusknowledge an
or knowledge s easy and quiigher level of ing the conceppts unknown tses when thereing. These arere confused bythe organizationcepts, and cloy, these results
2020
asing
n we s and
e see which strate nd/or than
ck to prior t and o the
e is a e the y the on to osely s can

jel.ccsenet.org Journal of Education and Learning Vol. 9, No. 5; 2020
131
also be used to determine the amount of supervisor support and reinforcement needed to help support the use of skills (Russ-Eft, 2002).
In analyzing the same scenarios with TPC, we see that this metric is overly optimistic in its interpretation of the participants’ performance. As shown in Table 3, for Scenarios 1, 5, and 6, TPC reports the performance of participants as 100%. This would imply that all participants learned these concepts; however, in these scenarios, all participants had prior knowledge. In using this metric, we would interpret the training as extremely effective although the participants would feel that the training of the concept was a waste of time because they already knew it. The correct course of action for a concept that behaves like Scenario 1 is to either not train on the concept or do a cursory training without testing on the concept and focus instead on concepts for which the participants have less prior knowledge. In Scenario 3, all the participants exhibited negative learning but the TPC reports the performance as 0%, implying that there was no learning among the participants. In this scenario we know that the participants were, in effect, guessing or losing knowledge due to the training process, which would indicate that there were significant issues with the content or the method of delivery. It is not possible to distinguish between this outcome (Scenario 3) and Scenario 4 in which had all the participants answered incorrectly in both the pre- and post-test assessments. Additionally, when using the TPC metric to measure training effectiveness, it is not possible to distinguish between Scenarios 9, 10, 11, and 12, which all had differing amounts of negative learning and participants answering incorrectly in both the pre- and post-test assessment. This severely limits the understanding of participant performance and the determination of needed training improvements.
When examining the scenario results using PPPC, we observe that this metric performs better than the TPC metric in representing the learning of the participants. In Scenario 1, it reports that there was no learning by the participants since they had 100% prior knowledge; however, unlike the ATEAL method, it is not possible to easily discern if the low score is due to prior knowledge or a lack of learning or guessing. In Scenario 2 PPPC indicates that the participants experienced 100% learning, same as the ATEAL method. This is distinctly different from the results illustrated by the TPC (100% in both scenarios 1 and 2) and helps the trainers better understand the impact of the training. In Scenario 3, PPPC reports a result of -100% since all the participants experienced negative learning, same as the ATEAL method that plots Scenario 3 at the lowest score in Quad 3. In Scenarios 5, 6 and 7the PPPC reports positive learning based on changes in the number of participants who have prior knowledge and those experiencing positive learning. When there is more negative learning than positive learning or prior knowledge (Scenarios 9, 10, 11 & 12) PPPC reports a negative value, thereby indicating that there is a significant issue with the training and that the participants are being affected in a negative manner. These negative results are similar to the ATEAL method that plots these scenarios in Quad 3. In Scenario 8, the PPPC reports that the participants experienced positive learning, however, using the ATEAL method, we are very quickly able to diagnose that Scenario 8 had more prior knowledge than positive learning. This is not readily apparent when looking at the PPPC results, and it requires the trainers/assessors to review the raw data to arrive at the conclusion that the ATEAL method readily provides. Additionally in Scenarios 1 and 4, PPPC reports that no participants learned the concept trained, however, when using the ATEAL method, we observed that in Scenario 1 all the participants had prior knowledge of the concept taught and did not need to learn the concept and in Scenario 4, none of the participants exhibited any learning.
4.2 Simulation Results
In interpreting the results of the simulation using the ATEAL methodology, we observe that the LAC is the most sensitive (slope of -0.82) of all the metrics to prior knowledge of the participants. This implies that as the prior knowledge among the participants increases, for a certain question or concept taught, the value of the LAC decreases. Similarly, the NTIC is the most sensitive (slope of -0.82) of all the metrics to negative training impact. As in the case of the LAC, this implies that as the participants experience more negative training for a certain question or concept, the value of NTIC decreases, and when 100% of the participants experience negative training, all associated NTIC values are negative. Thus, the use of these two coefficients to develop the TEM, enables the matrix to be more sensitive for the effects of prior knowledge and negative training when reporting the training effectiveness for the concepts taught.
It is also important to note that the NTIC can be sensitive to the number of trainees with prior knowledge. If a small number of trainees have prior knowledge the NTI can be large, even if only one or two trainees experienced negative learning. Conversely, if most trainees have prior knowledge the PTI is greatly impacted by even a small number of trainees who learn the concept. Thus, either very high or very low values of NTIC must be further examined to determine the cause, since either extreme case may indicate problems with the training related to prior knowledge rather than the training quality.
jel.ccsenet.org Journal of Education and Learning Vol. 9, No. 5; 2020
132
The TPC metric is completely insensitive to participant prior knowledge and treats it as learning, which is troublesome as it does not give feedback to the trainers or the organization that would help improve the training and better focus on the needs to the participants’ knowledge gaps. It paints an overly optimistic picture of the training when, in effect, the participants’ and organizations’ time might be wasted by the training. Additionally, the participants could be getting bored during the training, causing them to lose focus and pay less attention to the concepts that they actually do not know and need to learn. The TPC does illustrate a negative trend when the participants experience negative training. This is due to the fact that participants experiencing negative learning answer incorrectly in the post-test assessment, thus reducing the TPC score. The score, however, does not clearly show that this is due to negative learning and it can be interpreted to mean that the participants did not learn the content being trained, which is a completely different scenario.
Finally, the PPPC metric is sensitive to prior knowledge as it decreases with an increase in prior knowledge as noted by several authors (e.g., Bonate, 2000; Dimitrov & Rumrill Jr., 2003; Tannebaum & Yukl, 1992). The PPPC also has similar sensitivity towards Negative Training Impact, in that it decreases with an increase in negative training impact. However, unlike the NTIC, when the negative training impact is close to a 100%, a small percentage of the data points are greater than zero. This makes interpretation of the PPPC metric slightly more challenging than the NTIC in which all the values are negative when 100% of the participants experience negative training. Additionally, it is difficult to discern participant performance when there is a low positive score; that is, we are not able to easily determine whether the low score was due to high prior knowledge or due to negative learning. Hence, it makes it difficult to quickly determine the countermeasures that are needed to improve the effectiveness of the training.
The comparisons of the scenario and simulation results using these metrics and associated discussions in this section allow us to observe the following benefits of the newly introduced ATEAL:
- It is much more effective in helping determine the true performance of the participants in a training session for each concept taught.
- The metrics involved are easy to calculate and provide visual guidelines for the training providers and the organizations on the best and worst learned concepts.
- It is much more specific than the other two metrics and helps to quickly diagnose issues with participant performance by identifying whether the training should be improved (by making the content taught more challenging, to get around prior knowledge) or if the training is causing confusion among the participants and thus reducing their learning.
5. Conclusion/Future Direction
Metrics to quantify the amount of learning that training participants exhibit for a particular training course, or concepts within the course, are critical to understanding and quantifying the effectiveness of the training. The Assessment of Training Effectiveness Adjusted for Learning (ATEAL) method is introduced in this paper and defines new metrics to measure the level of prior knowledge, as well as positive and negative training impacts experienced by the participants. Additionally, it introduces two coefficients, Learning Adjustment Coefficient (LAC) and Net Training Impact Coefficient (NTIC), that are plotted in a novel method to create the Training Effectiveness Matrix (TEM). This matrix helps visually assess the performance of the participants for each question/concept introduced in the training. The method proves effective in quickly identifying the training gaps that the participants experienced and providing direction on the countermeasures that should be taken for each concept trained.
Validation of this new method and comparison of its performance to the traditional metrics of TPC and PPPC was conducted using scenario modelling and a simulation. Some recommendations that can be derived from this study are:
• Using only the TPC in the post-test assessment to assess training effectiveness (i.e., how much the participants learned) may give a highly inaccurate impression and does not provide clear guidance on areas of improvement.
• The PPPC is a much better metric than the TPC to assess training effectiveness, but it lacks the ability to quickly provide guidance on changes to be made to the training content or training delivery to improve training effectiveness.
• The use of the ATEAL method in calculation of the Learning Adjustment Coefficient and the Net Training Impact Coefficient is extremely easy and interpretation using the Training Effectiveness Matrix is intuitive and visual.

jel.ccsenet.org Journal of Education and Learning Vol. 9, No. 5; 2020
133
Acknowledgements
This study was partially funded by the US DOL Susan Harwood Grants: SH-20840-SH0; SH-22220-SH1; SH-23568-SH2. The authors also express their gratitude to Karen Cooper, Sruthi Boda and Madiha Ahmed for assisting with the test development and administration.
References
Alvarez, K., Salas, E., & Garofano, C. M. (2004). An integrated model of training evaluation and effectiveness. Human Resource Development Review, 3(4), 385−416. https://doi.org/10.1177/1534484304270820
Arthur Jr, W., Bennett Jr, W., Edens, P. S., & Bell, S. T. (2003). Effectiveness of training in organizations: a meta-analysis of design and evaluation features. Journal of Applied Psychology, 88(2), 234. https://doi.org/10.1037/0021-9010.88.2.234
Bar-Hillel, M., Budescu, D., & Attali, Y. (2005). Scoring and keying multiple choice tests: A case study in irrationality. Mind & Society, 4(1), 3−12. https://doi.org/10.1007/s11299-005-0001-z
Bonate, P. L. (2000). Analysis of pretest-posttest designs. Chapman and Hall/CRC. https://doi.org/10.1201/9781420035926
Campbell-Kyureghyan, N., Ahmed, M., & Beschorner, K. (2013, May). Measuring training impact 1−5. Paper presented at the US DOL Trainer Exchange Meeting, Washington DC, March 12−13, 2013.
Dimitrov, D. M., & Rumrill Jr, P. D. (2003). Pretest-posttest designs and measurement of change. Work, 20(2), 159−165.
Freifeld, L. (2018). 2018 Training Industry Report. Retrieved October 10, 2019, from https://trainingmag.com/trgmag-article/2018-training-industry-report/
Glaveski, S. (2019). Where Companies Go Wrong with Learning and Development. Retrieved October 2, 2019, from https://hbr.org/2019/10/where-companies-go-wrong-with-learning-and-development
Kirkpatrick, D. L. (1967). Evaluation of training. In R. L. Craig & L. R. Bittel (Eds.), Training and Development Handbook (pp. 40−60). New York: McGraw Hill.
Russ-Eft, D. (2002). A typology of training design and work environment factors affecting workplace learning and transfer. Human Resource Development Review, 1(1), 45−65. https://doi.org/10.1177/1534484302011003
Salas, E., & Cannon-Bowers, J. A. (2001). The science of training: A decade of progress. Annual Review of Psychology, 52(1), 471−499. https://doi.org/10.1146/annurev.psych.52.1.471
Samuel, T., Azen, R., & Campbell-Kyureghyan, N. (2019). Evaluation of learning outcomes through multiple choice pre-and post-training assessments. Journal of Education and Learning, 8(3), 122. https://doi.org/10.5539/jel.v8n3p122
Simkins, S., & Allen, S. (2000). Pretesting students to improve teaching and learning. International Advances in Economic Research, 6(1), 100−112. https://doi.org/10.1007/BF02295755
Tai, W. T. (2006). Effects of training framing, general self-efficacy and training motivation on trainees’ training effectiveness. Personnel Review, 35(1), 51−65. https://doi.org/10.1108/00483480610636786
Tannenbaum, S. I., & Yukl, G. (1992). Training and development in work organizations. Annual Review of Psychology, 43(1), 399−441. https://doi.org/10.1146/annurev.ps.43.020192.002151
Walstad, W. B., & Wagner, J. (2016). The disaggregation of value-added test scores to assess learning outcomes in economics courses. The Journal of Economic Education, 47(2), 121−131. https://doi.org/10.1080/00220485.2016.1146104
Copyrights
Copyright for this article is retained by the author, with first publication rights granted to the journal.
This is an open-access article distributed under the terms and conditions of the Creative Commons Attribution license (http://creativecommons.org/licenses/by/4.0/).