Embed Size (px)
Citation preview
Journal of Babylon University/Engineering Sciences/ No.(1)/ Vol.(25): 2017
224
Assessment of WQI and Microbial pollution for two water treatment plants in Baghdad city
Mohammed AliAl-Hashimi University of Technology- Baghdad- Iraq (in past) and Dijlah University
College(currently) Salih A.Al-Bakri Ayah A. Okab
University of Technology- Baghdad- Iraq AlQasim Green University Email: [email protected]
ABSTRACT Tigris River is the main water source for all water treatment plants in Baghdad city. In current
study, Water Quality Index (WQI) and microbial pollution was obtained for two water treatment plants and their networks in Baghdad city Al-Karama and Al-Wathba WTP for both raw and treated water, In order to assess water suitability as a source of domestic water supply. Physical, chemical, and Microbialparameters werestudied fora period of four months (March-June, 2014). The parameters which were taken into account for the present work are pH, turbidity (Nephelometric Turbidity Unit), Total Alkalinity (TA), Electrical Conductivity (EC), Calcium (Ca++), Magnesium (Mg++), Total Hardness (TH), Total Dissolved Solids (TDS),Chloride (Cl-), and Most Probable Number (MPN) method as microbial pollution indicator. The results indicate that WQI for untreated Tigris water was classified as "unfit for human consumption" at both WTPs intakes and along study period and after water passing through the sequence treatment units in WTPs its quality is gradually increased and finally, the treated water quality ranged from "Good" to " Moderately polluted" at both All-Karama and Al-Wathba WTPs. In networks the quality of water ranged between "Good" to "moderately polluted" in Al-Karama WTP network and between "Moderately polluted" to "severely polluted" in Al-Wathba WTP network. For Microbiological pollution, MPN throughout the period of study was between (0-150 cell/100ml) at Al-Karama WTP and between (0- 240 cell/100ml) at Al-Wathba WTP. The highest value obtained was (240 cell/100ml) at raw water in Al- Wathba WTP intake in June, while the lowest value obtained was (0 cell/100ml) at all chlorinated samples. Keywords:Water Quality Index (WQI), Most Probable Number (MPN), water pollution.
الخالصةاعتماد جرىفي الدراسة الحالیة .بغداد مدینةمحطات التصفیة في صدر الرئیسي والوحید للمیاه لجمیعنھر دجلة الم یعد
للماء ) محطة الكرامة ومحطة الوثبة(في مدینة بغداد وشبكتیھما لمحطتي ماء المایكروبيوقیاس التلوث (WQI)مؤشر نوعیة المیاه قیاس المؤشرات الفیزیائیة تم. الخام والمعالج لغرض تقییم مدى مالئمة میاه نھر دجلة والمیاه المعالجة كمصدر لالستھالك البشري
، القاعدیة الكلیة، العكارة، pHالمؤشرات المستخدمة ھي . 2014 حزیرانال� اذار من و المایكروبیةخالل اربعة اشھر والكیمیائیةو العد االكثر احتمالي كقیاس للمؤشر لورایدالك، الذائبة الكلیةلمواد ا، العسرة الكلیة، المغنیسیوم، الكالسیوم، التوصیلیة الكھربائیة
وعند " غیر صالحة لالستخدام البشري"تائج ان مؤشر نوعیة المیاه الخام لنھر دجلة قبل المعالجة كانت ھرت النواظ. المایكروبيما في الشبكة أ. في المحطتین " معتدلة التلوث"الى "جیدة" تدریجیاحیث تراوحت بین نوعیتھ تتحسندخول المیاة الى محطة المعالجة
شبكة في" شدیدة التلوث"ى لا" معتدلة التلوث"محطة الكرامة و شبكة في " التلوث معتدلة"الى " جیدة"ما بینفأن نوعیة المیاه تتراوح في محطة ) ملم100/خلیھ 150- 0(خالل فترة الدراسة من العد االكثر احتمالي فقد تراوحت قیم المایكروبيأما التلوث .محطة الوثبة
240(محطة الكرامة الماء الخام عند مأخذ على قیمة فيفي محطة الوثبة وكانت ا) ملم100/خلیة 240 - 0(الكرامة وبین .وفي جمیع عینات الشبكات في المحطتین الكلورة عملیة بعد) ملم100/خلیة 0(زیران واقل قیمة خالل شھر ح) ملم100/خلیة
. التلوث المائي ،العد األكثر أحتمالي، مؤشر نوعیة المیاه -:كلمات مفتاحیة
1. INTRODUCTION Lakes, streams, and rivers have important multi usage components, like
sources of drinking water, irrigation, and energy production(Iscen, et.al.,2008). In the last few decades, there has been anenormous increase in the demand for
fresh water due to rapid growth of population and the accelerated pace of industrialization.Human health is threatened by most of the agricultural development activities particularly in relation to excessive application of fertilizers and unsanitary conditions (Ramakrishnaiah , et.al., 2009).
External and internal factors could be effect on water parameters. There is a complex relationship between the external and internal factors in aquatic environments. Meteorological events and contamination are some of the external factors which affect physico-chemical parameters such as temperature, pH, and
Journal of Babylon University/Engineering Sciences/ No.(1)/ Vol.(25): 2017
225
hardness of the water. These parameters have major influences on biochemical reactions that happen in the water body. Sudden changes of these water parameters may be indicative of changing conditions in the water. On the other hand, internal factors include events, which happen between and within bacterial and plankton populations in the water (Bezuidenhout, et.al., 2002).
The water quality required to maintain ecosystem health is largely a function of natural background conditions. Some aquatic ecosystems are able to resist large changes in the quality of water without any detectable effects on ecosystem composition and function, while other ecosystems are sensitive to small changes in the physical and chemical composition of the water body and this can lead to degradation of ecosystem services and loss of biological diversity. The degradation of physical and chemical water quality because of human influences is often gradual, and invisible adaptations of aquatic ecosystems to these changes may not always be readily detected until a dramatic shift in ecosystem condition happen(Stark, et.al, 2000).
Accurate and periodically information on the water quality is necessary in order to shape a sound public policy and to implement the water quality improvement programs efficiently. The mosteffective way to obtain information on the quality of water is by indices(Dwivedi and Pathak, 2007).
The water quality indexcan be defined as a single value obtained from huge number of variables in water sample. It summarizes those huge numbers into terms that can be described as excellent, good, bad and so on for the purpose of reporting to recognized bodies or organizations and to the public on the state of water in a place. Various methods have been employed to calculate the water quality index (Canadian Council of Ministers of the Environment Water Quality Index (CCME WQI), Bhargava method) but the most commonly employed is the Weighted Arithmetic Index (WAI) method (Oko, et.al., 2014).
In the Tigris River stretch the pollution increase due to effluent discharges by various uncontrolled sources as domestic, industries, agriculture along the downstream stretch so, river water quality monitoring is necessary to evaluate the water quality for different uses (khudair, 2013).
Alobaidy,et.al., 2010 Assessed Dokan Lake Ecosystem, Kurdistan Region, Iraq by Application Water Quality Index. Ten water quality parameters (pH, Dissolved Oxygen, Turbidity, Conductivity, Hardness, Alkalinity, Sodium, Biochemical Oxygen Demand, Nitrate and Nitrite) were analyzed. The results showed that water quality of Dokan Lake decreased from Good in the years 1978, 1979, 1980, 1999, 2000 and 2008 to Poor (moderately polluted) in 2009.
Al-Janabi, et.al., 2012 determined the water quality of Tigris River by using Water Quality Index (CCME WQI). Canadian Council of Ministers of the Environment Water Quality Index (CCME WQI) was applied for the 3 locations sited along with Tigris river in Baghdad city, Iraq from February to December 2010. The results showed that the WQI of Tigris river ranged 37-42 which mean that river has the worst quality (unfit for human consumption) due to effect of various urban pollutant sources.
Florence, et.al., 2012 made an assessment of water quality for the ground water in YercaudTalnk, India during June-July 2010. The physicochemical parameters were studied such as temperature, pH, Total Alkalinity (TA), Electrical Conductivity (EC), salinity, Calcium Hardness (CH), Magnesium Hardness (MH), Total Hardness (TH), Total Dissolved Solids (TDS), Total Suspended Solids (TSS),
Journal of Babylon University/Engineering Sciences/ No.(1)/ Vol.(25): 2017
226
Total Solids (TS) and fluoride. The results explained that the WQI of the most samples were good and of excellent quality according to standard permissible limit as prescribed by WHO.
Abdul –Rahman and Ahmad, 2013 made a comparison of water quality index at water treatment plants intakes in Baghdad city, Iraq in order to calculate the competence of water source for different consumptions. The intakes of eight WTPs of Baghdad city were collected as samples stations and these samples analyzed during 2009-2010. These WTPs arranged from north to south of Baghdad city as follows (Karkh, East Tigris, Wathba, Karama, Qadisiya, Dora, Wahda and Rashid in the south). Canadian Council of Ministry of the Environment (CCME, 2001) procedure was obtained to determine WQI of the raw water in the intake of these WTPs. The results illustrated that the best WQI was in the intake of Al-Karkh WTP and the worst was in Al-Rashid WTP.
Al-Badran, 2013 made an assessment to Shatt Al-Arab River and treated water for some water treatment plants in Basrah, Iraq. Water quality index was determined for both raw and treated water for ten water treatment plants. Physic-chemical parameters were measured for the determination of WQI for Winter, Spring, Summer, and Autumn seasons from March- 2011 to March- 2012. The results indicate that Shatt Al-Arab was very poor for domestic, industrial, and irrigation uses during Winter, Spring, Summer, and Autumn seasons and seven of ten of studied water treatment plants produce water of poor quality.
In a study done by Alsaqqar, et.al., 2013 on the Euphrates River within Al-Anbar Province, Iraq water quality was calculated in terms of Water Quality Index that was determined by summarizing multiple parameters of water test results. These water parameters were physicochemical parameters (pH value, Alkalinity (ALK), Orthophosphate (PO4-3), Nitrate (NO-3), Sulphate (SO4-2), Chloride (Cl-), Total Hardness (TH), Calcium (Ca), Magnesium (Mg), and Total Dissolved Solids (TDS)). From this study the quality of the Euphrates River was classified as "very poor quality" (severely polluted).
Al-Baidhani and Mokif, 2013 evaluated water quality index for nine water treatment plants spreading in four districts (Al-Hilla, Al-Hashimiyia, Al-Musayab and Al-Mahawil) in Babylon governorate for raw and treated during a period of nine months ( December 2011- August 2012). Two methods were used for determination the water quality indices included weighted average method (WAV WQI) and the second is the method which is adopted by Ministry of Nature and Environment of Mongolia (MNE WQI).The results showed that the values of (WAV WQI) at all water treatment plants ranged between (excellent to poor water) for raw and treated water and the worst water quality for raw and treated water was observed in December month at all water treatment plants. All values of MNE WQI indicated that the (raw and treated) water is clean.
During the study presented by Arya and Zaidi, 2014, various samples of ground water were collected from different locations in and around the Kanpur city, India. These samples were analyzed for their physico-chemical parameters. The results of this study were compared with the WHO water quality standard. Water quality index (WQI) that calculated was lied under the slightly polluted (moderately polluted).
Dubey, et.al., 2014 calculated the ground water quality of Dwarka district, national capital, India. The samples of the ground water were collected manually from the bore wells which were approximately equally distributed all over 29 sectors
Journal of Babylon University/Engineering Sciences/ No.(1)/ Vol.(25): 2017
227
and nearby areas. WQI has been determined for the Dwarka sub-city and was studied for the suitability of water for drinking consumptions. The results illustrated that the ground water quality was "unfit for drinking" in almost all of the areas scoring.
Vema and Kumar; 2014 studied the groundwater quality and its suitability for domestic and irrigation uses at Amroha Uttar Pradesh, India. WQI for underground drinking water at Amroha for twelve different locations has been determined with the help of estimated values of water quality physico-chemical characteristics and WHO water quality standards. Underground drinking water quality at ten locations was found to be "severely polluted". At a few locations it was "moderately polluted" and at one location was "fit for human consumption".
The chief objective of the current study is to link the quality of water and microbial pollution in Tigris River through and two water treatment plants with their networks. This shall be helpful for the efficient improvement in drinking water quality.
2. MATERIALS AND METHODS 2.1. Study area
Tigris river water is the only source of drinking water for the Baghdad city, and the river divides the city into two sides Karkh and Risafa with a flow direction from north to south. The study area within Baghdad City is located between latitudes 33°14'-33°25' N and longitudes44°31'-44°17' E, 30.5 to 34.85 m at sea level (a.s.l). The area is characterized by arid to semi-arid climate with dry hot summers and cold winters; the mean annual rainfall is about 151.8 mm (Al-Adili, 1998).
2.2. Sampling Stations
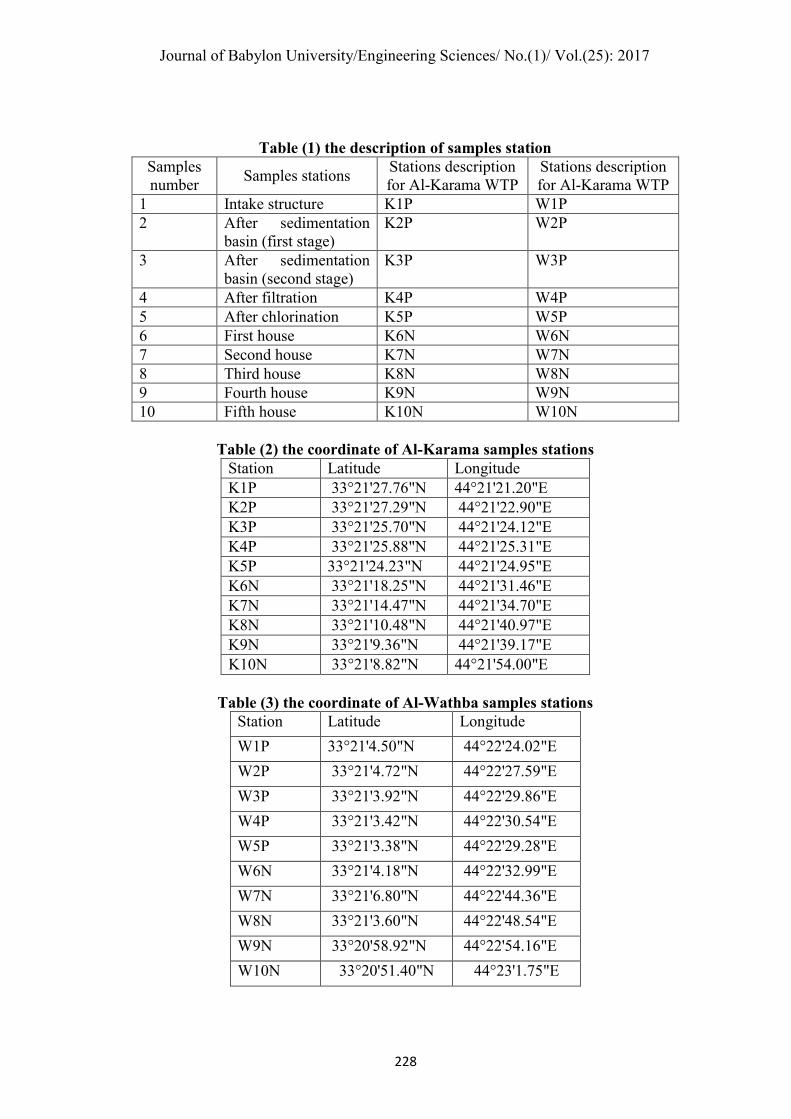
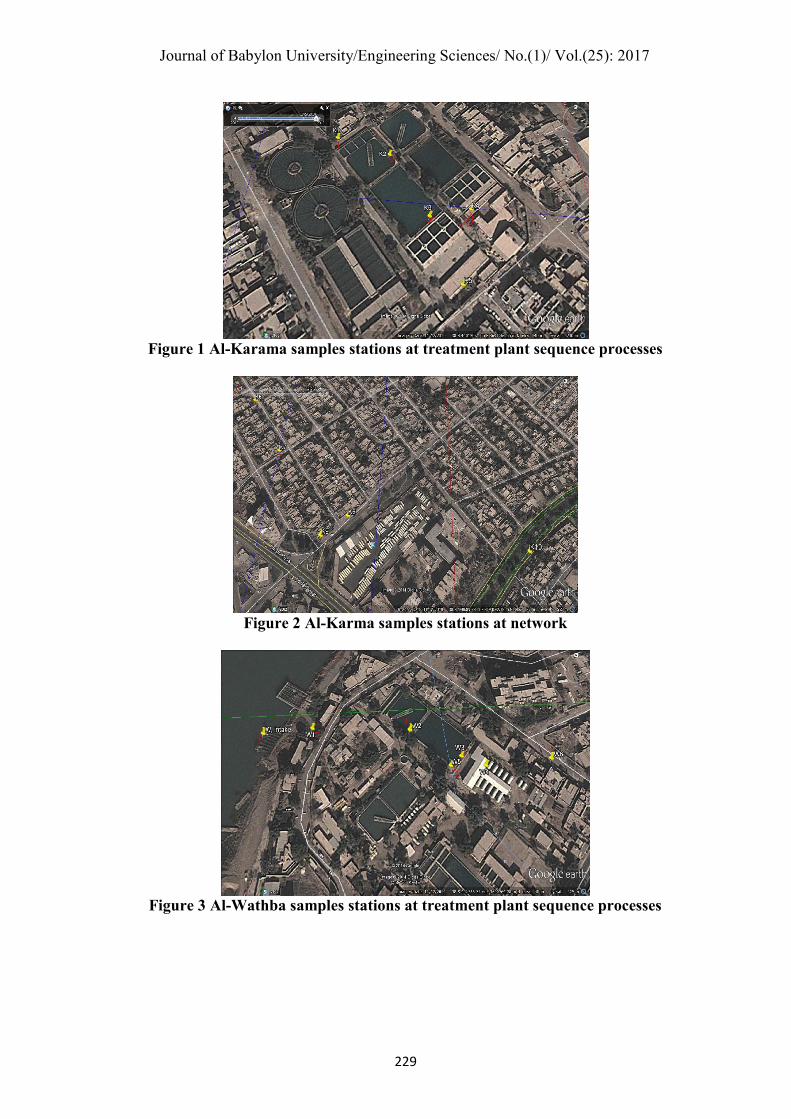
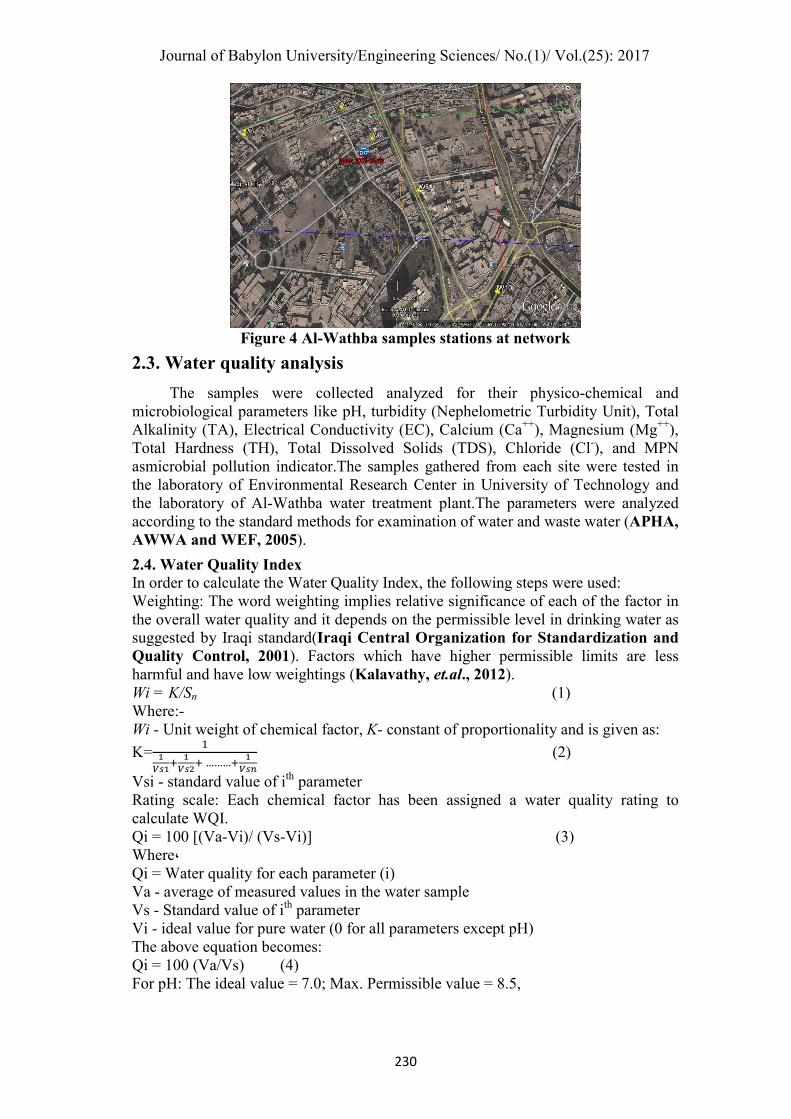
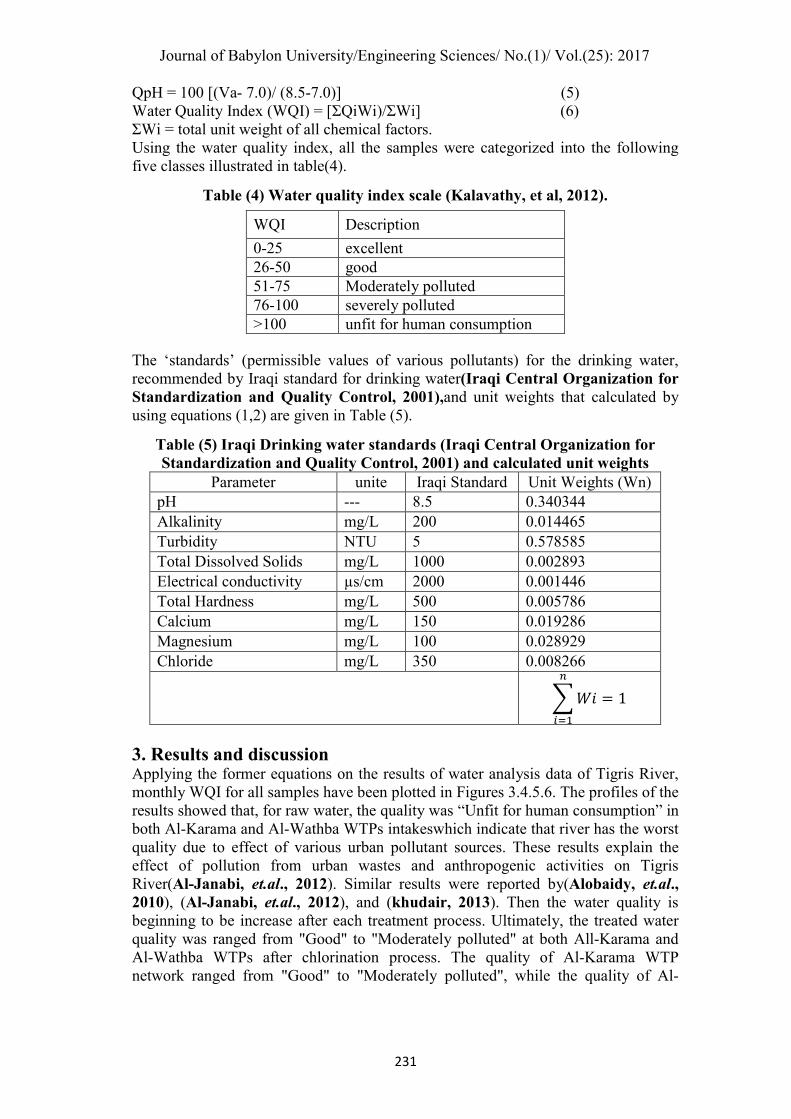
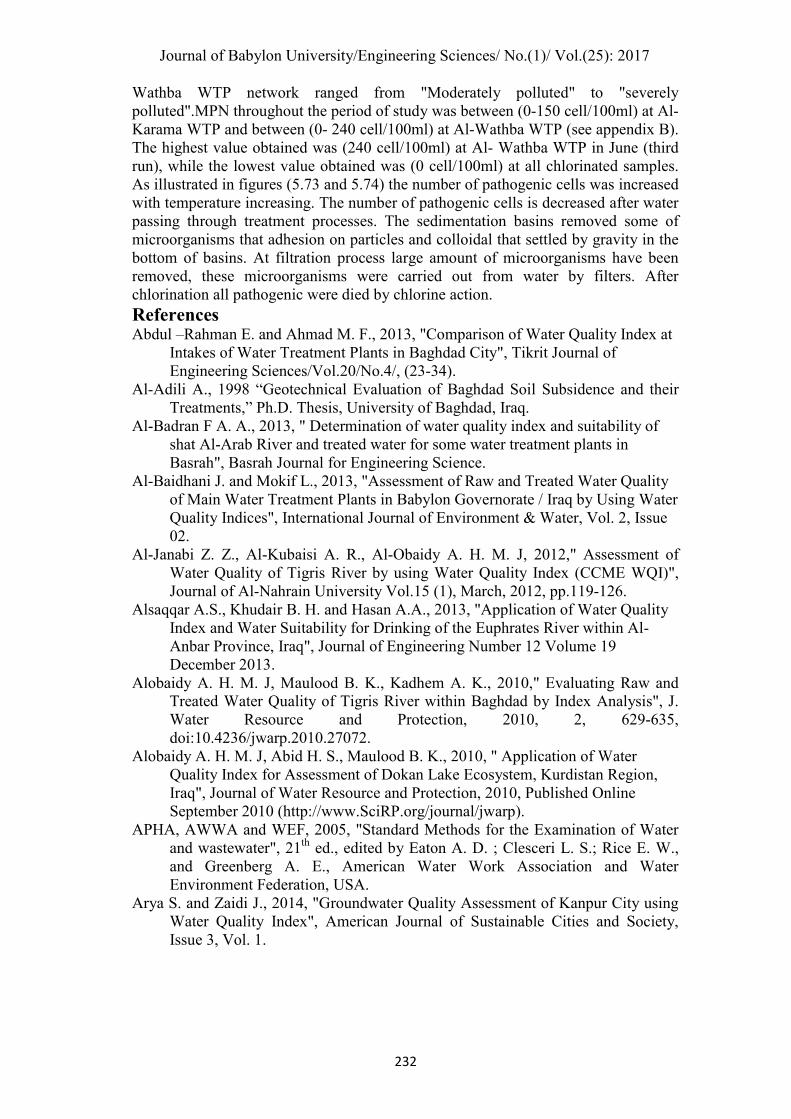
For the present study,two water treatment plants that sites on Tigris River have been selected. The first water treatment plant isAlKrama and this WTP located in AlKarkh side andwas constructed in 1956.It is located in Al-Atafya quarter. While the second water treatment plants is Al-Wthba, this WTP located in Al-Risafa side and established in 1936 and it is the oldest project for water treatment in Baghdad. This project is located in Alaaoadih area (the doctors' district) locality 118 alley. The water samples are collected from this two water treatment plants Al-Wathba and Al-Krama in addition to their networks. Five sites from each WTP samples are taking from: 1. Raw water (Intake structure (inlet)). 2. After primary sedimentation basin. 3. After secondary sedimentation basin. 4. After filtration. 5. After chlorination (treated water (outlet)). Also network samples are taking from five sites in transect direction. The coordinates of Al-Krama and Al-Wathba water treatment plants are illustrated in tables (1, 2, and 3) below.
Journal of Babylon University/Engineering Sciences/ No.(1)/ Vol.(25): 2017
228
Table (1) the description of samples station Samples number
Samples stations Stations description for Al-Karama WTP
Stations description for Al-Karama WTP
1 Intake structure K1P W1P 2 After sedimentation
basin (first stage) K2P W2P
3 After sedimentation basin (second stage)
K3P W3P
4 After filtration K4P W4P 5 After chlorination K5P W5P 6 First house K6N W6N 7 Second house K7N W7N 8 Third house K8N W8N 9 Fourth house K9N W9N 10 Fifth house K10N W10N
Table (2) the coordinate of Al-Karama samples stations
Station Latitude Longitude K1P 33°21'27.76"N 44°21'21.20"E K2P 33°21'27.29"N 44°21'22.90"E K3P 33°21'25.70"N 44°21'24.12"E K4P 33°21'25.88"N 44°21'25.31"E K5P 33°21'24.23"N 44°21'24.95"E K6N 33°21'18.25"N 44°21'31.46"E K7N 33°21'14.47"N 44°21'34.70"E K8N 33°21'10.48"N 44°21'40.97"E K9N 33°21'9.36"N 44°21'39.17"E K10N 33°21'8.82"N 44°21'54.00"E
Table (3) the coordinate of Al-Wathba samples stations
Station Latitude Longitude
W1P 33°21'4.50"N 44°22'24.02"E
W2P 33°21'4.72"N 44°22'27.59"E
W3P 33°21'3.92"N 44°22'29.86"E
W4P 33°21'3.42"N 44°22'30.54"E
W5P 33°21'3.38"N 44°22'29.28"E
W6N 33°21'4.18"N 44°22'32.99"E
W7N 33°21'6.80"N 44°22'44.36"E
W8N 33°21'3.60"N 44°22'48.54"E
W9N 33°20'58.92"N 44°22'54.16"E
W10N 33°20'51.40"N 44°23'1.75"E
Journal of Babylon University/Engineering Sciences/ No.(1)/ Vol.(25): 2017
229
Figure 1 Al-Karama samples stations at treatment plant sequence processes
Figure 2 Al-Karma samples stations at network
Figure 3 Al-Wathba samples stations at treatment plant sequence processes
Journal of Babylon University/Engineering Sciences/ No.(1)/ Vol.(25): 2017
230
Figure 4 Al-Wathba samples stations at network
2.3. Water quality analysis
The samples were collected analyzed for their physico-chemical and microbiological parameters like pH, turbidity (Nephelometric Turbidity Unit), Total Alkalinity (TA), Electrical Conductivity (EC), Calcium (Ca++), Magnesium (Mg++), Total Hardness (TH), Total Dissolved Solids (TDS), Chloride (Cl-), and MPN asmicrobial pollution indicator.The samples gathered from each site were tested in the laboratory of Environmental Research Center in University of Technology and the laboratory of Al-Wathba water treatment plant.The parameters were analyzed according to the standard methods for examination of water and waste water (APHA, AWWA and WEF, 2005).
2.4. Water Quality Index In order to calculate the Water Quality Index, the following steps were used: Weighting: The word weighting implies relative significance of each of the factor in the overall water quality and it depends on the permissible level in drinking water as suggested by Iraqi standard(Iraqi Central Organization for Standardization and Quality Control, 2001). Factors which have higher permissible limits are less harmful and have low weightings (Kalavathy, et.al., 2012). Wi = K/Sn (1) Where:- Wi - Unit weight of chemical factor, K- constant of proportionality and is given as:
K=�
�
����
�
����………�
�
���
(2)
Vsi - standard value of ith parameter Rating scale: Each chemical factor has been assigned a water quality rating to calculate WQI. Qi = 100 [(Va-Vi)/ (Vs-Vi)] (3) Where، Qi = Water quality for each parameter (i) Va - average of measured values in the water sample Vs - Standard value of ith parameter Vi - ideal value for pure water (0 for all parameters except pH) The above equation becomes: Qi = 100 (Va/Vs) (4) For pH: The ideal value = 7.0; Max. Permissible value = 8.5,
Journal of Babylon University/Engineering Sciences/ No.(1)/ Vol.(25): 2017
231
QpH = 100 [(Va- 7.0)/ (8.5-7.0)] (5) Water Quality Index (WQI) = [ΣQiWi)/ΣWi ] (6) ΣWi = total unit weight of all chemical factors. Using the water quality index, all the samples were categorized into the following five classes illustrated in table(4).
Table (4) Water quality index scale (Kalavathy, et al, 2012). The ‘standards’ (permissible values of various pollutants) for the drinking water, recommended by Iraqi standard for drinking water(Iraqi Central Organization for Standardization and Quality Control, 2001),and unit weights that calculated by using equations (1,2) are given in Table (5).
Table (5) Iraqi Drinking water standards (Iraqi Central Organization for Standardization and Quality Control, 2001) and calculated unit weights
Parameter unite Iraqi Standard Unit Weights (Wn) pH --- 8.5 0.340344 Alkalinity mg/L 200 0.014465 Turbidity NTU 5 0.578585 Total Dissolved Solids mg/L 1000 0.002893 Electrical conductivity µs/cm 2000 0.001446 Total Hardness mg/L 500 0.005786 Calcium mg/L 150 0.019286 Magnesium mg/L 100 0.028929 Chloride mg/L 350 0.008266
��� = 1
�
���
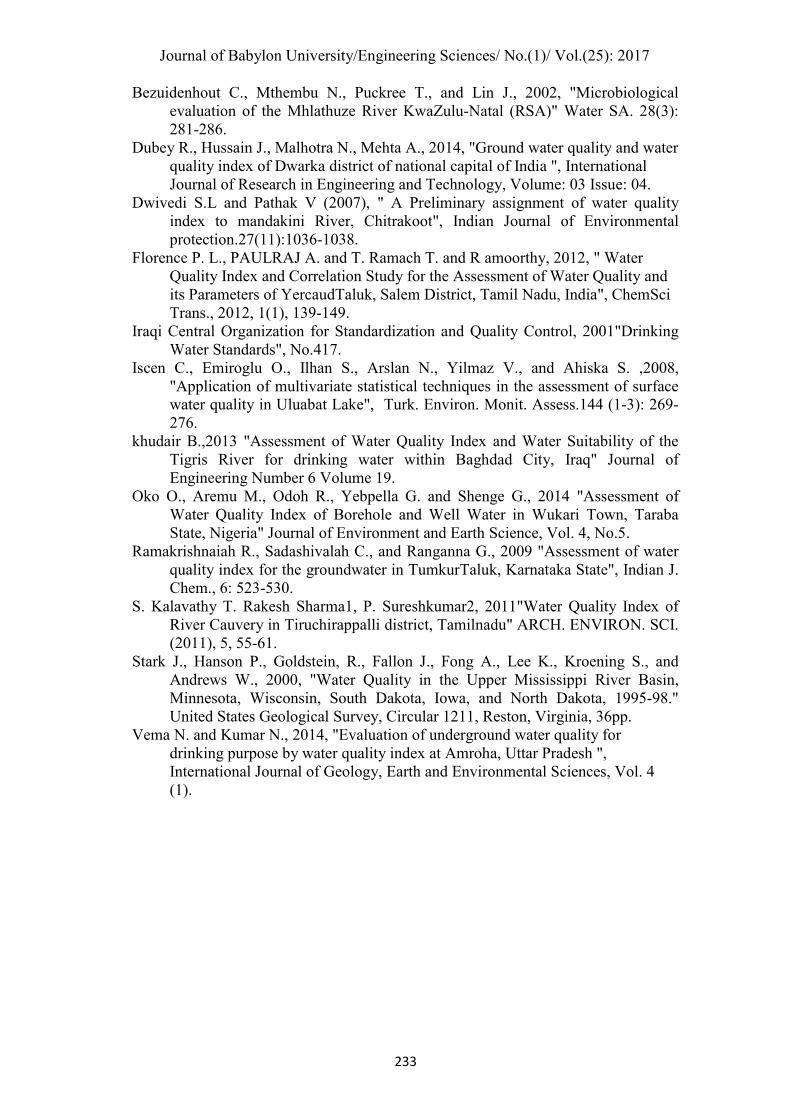
3. Results and discussion Applying the former equations on the results of water analysis data of Tigris River, monthly WQI for all samples have been plotted in Figures 3.4.5.6. The profiles of the results showed that, for raw water, the quality was “Unfit for human consumption” in both Al-Karama and Al-Wathba WTPs intakeswhich indicate that river has the worst quality due to effect of various urban pollutant sources. These results explain the effect of pollution from urban wastes and anthropogenic activities on Tigris River(Al-Janabi, et.al., 2012). Similar results were reported by(Alobaidy, et.al., 2010), (Al-Janabi, et.al., 2012), and (khudair, 2013). Then the water quality is beginning to be increase after each treatment process. Ultimately, the treated water quality was ranged from "Good" to "Moderately polluted" at both All-Karama and Al-Wathba WTPs after chlorination process. The quality of Al-Karama WTP network ranged from "Good" to "Moderately polluted", while the quality of Al-
WQI Description
0-25 excellent 26-50 good 51-75 Moderately polluted 76-100 severely polluted >100 unfit for human consumption
Journal of Babylon University/Engineering Sciences/ No.(1)/ Vol.(25): 2017
232
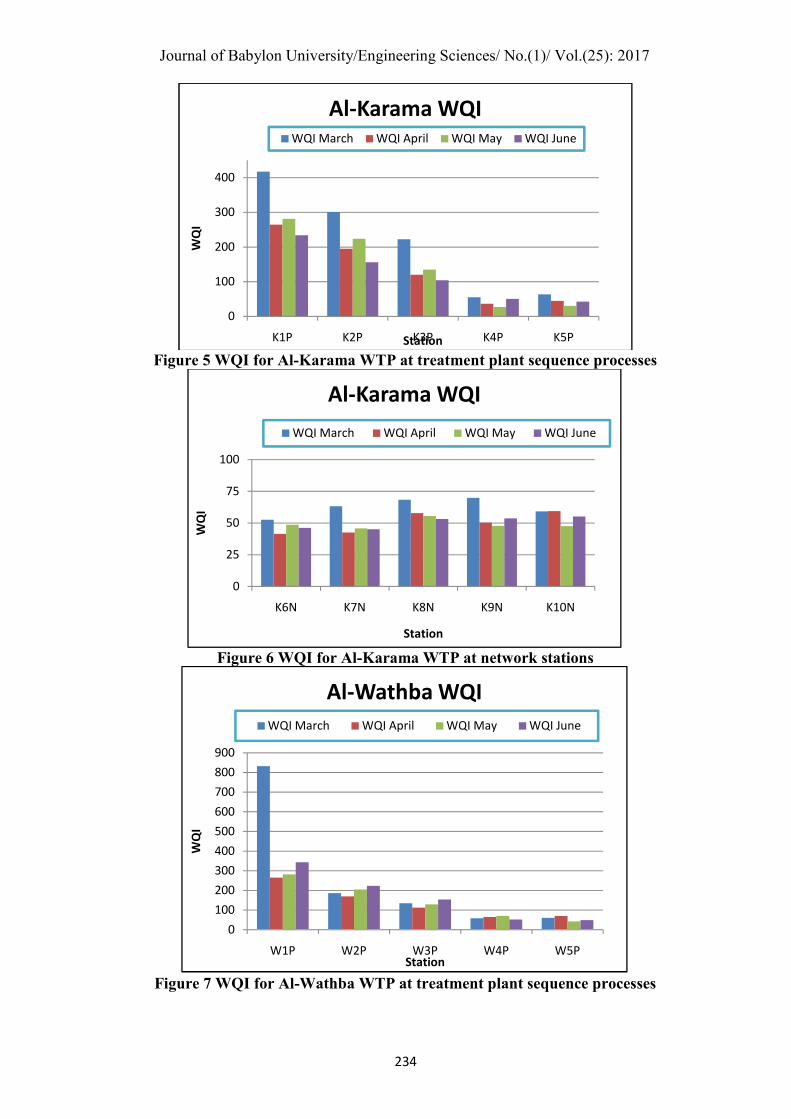
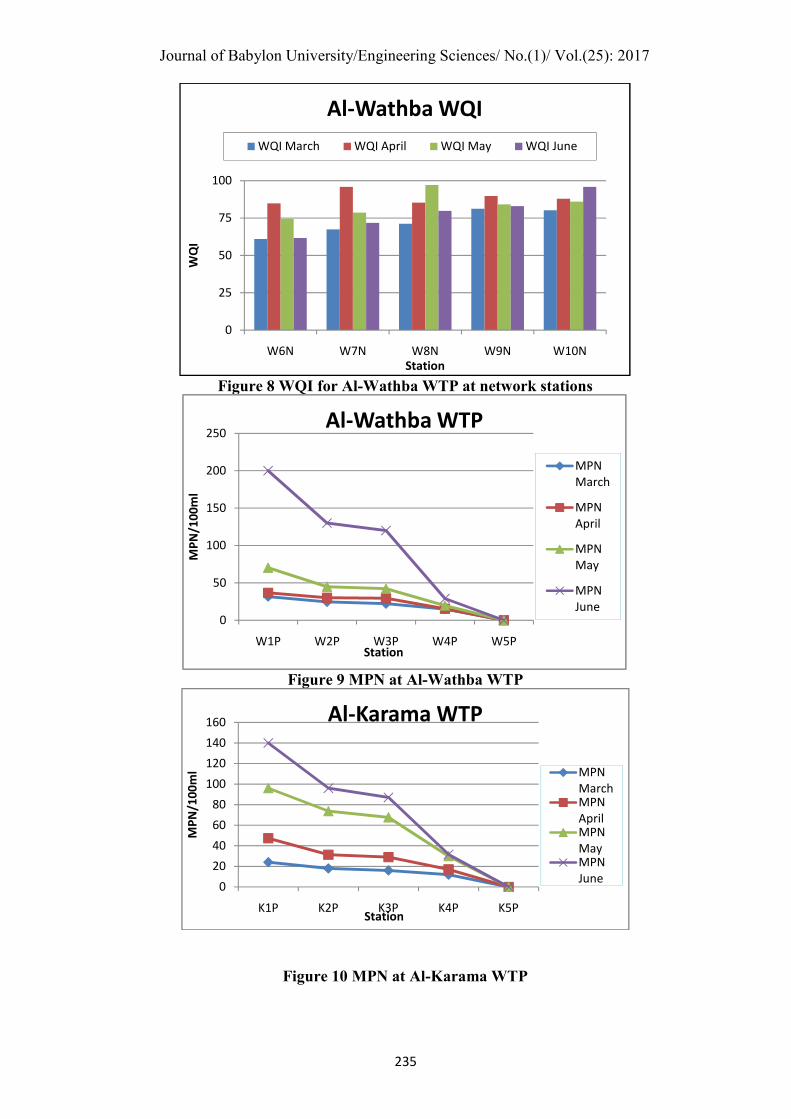
Wathba WTP network ranged from "Moderately polluted" to "severely polluted".MPN throughout the period of study was between (0-150 cell/100ml) at Al-Karama WTP and between (0- 240 cell/100ml) at Al-Wathba WTP (see appendix B). The highest value obtained was (240 cell/100ml) at Al- Wathba WTP in June (third run), while the lowest value obtained was (0 cell/100ml) at all chlorinated samples. As illustrated in figures (5.73 and 5.74) the number of pathogenic cells was increased with temperature increasing. The number of pathogenic cells is decreased after water passing through treatment processes. The sedimentation basins removed some of microorganisms that adhesion on particles and colloidal that settled by gravity in the bottom of basins. At filtration process large amount of microorganisms have been removed, these microorganisms were carried out from water by filters. After chlorination all pathogenic were died by chlorine action.
References Abdul –Rahman E. and Ahmad M. F., 2013, "Comparison of Water Quality Index at
Intakes of Water Treatment Plants in Baghdad City", Tikrit Journal of Engineering Sciences/Vol.20/No.4/, (23-34).
Al-Adili A., 1998 “Geotechnical Evaluation of Baghdad Soil Subsidence and their Treatments,” Ph.D. Thesis, University of Baghdad, Iraq.
Al-Badran F A. A., 2013, " Determination of water quality index and suitability of shat Al-Arab River and treated water for some water treatment plants in Basrah", Basrah Journal for Engineering Science.
Al-Baidhani J. and Mokif L., 2013, "Assessment of Raw and Treated Water Quality of Main Water Treatment Plants in Babylon Governorate / Iraq by Using Water Quality Indices", International Journal of Environment & Water, Vol. 2, Issue 02.
Al-Janabi Z. Z., Al-Kubaisi A. R., Al-Obaidy A. H. M. J, 2012," Assessment of Water Quality of Tigris River by using Water Quality Index (CCME WQI)", Journal of Al-Nahrain University Vol.15 (1), March, 2012, pp.119-126.
Alsaqqar A.S., Khudair B. H. and Hasan A.A., 2013, "Application of Water Quality Index and Water Suitability for Drinking of the Euphrates River within Al-Anbar Province, Iraq", Journal of Engineering Number 12 Volume 19 December 2013.
Alobaidy A. H. M. J, Maulood B. K., Kadhem A. K., 2010," Evaluating Raw and Treated Water Quality of Tigris River within Baghdad by Index Analysis", J. Water Resource and Protection, 2010, 2, 629-635, doi:10.4236/jwarp.2010.27072.
Alobaidy A. H. M. J, Abid H. S., Maulood B. K., 2010, " Application of Water Quality Index for Assessment of Dokan Lake Ecosystem, Kurdistan Region, Iraq", Journal of Water Resource and Protection, 2010, Published Online September 2010 (http://www.SciRP.org/journal/jwarp).
APHA, AWWA and WEF, 2005, "Standard Methods for the Examination of Water and wastewater", 21th ed., edited by Eaton A. D. ; Clesceri L. S.; Rice E. W., and Greenberg A. E., American Water Work Association and Water Environment Federation, USA.
Arya S. and Zaidi J., 2014, "Groundwater Quality Assessment of Kanpur City using Water Quality Index", American Journal of Sustainable Cities and Society, Issue 3, Vol. 1.
Journal of Babylon University/Engineering Sciences/ No.(1)/ Vol.(25): 2017
233
Bezuidenhout C., Mthembu N., Puckree T., and Lin J., 2002, "Microbiological evaluation of the Mhlathuze River KwaZulu-Natal (RSA)" Water SA. 28(3): 281-286.
Dubey R., Hussain J., Malhotra N., Mehta A., 2014, "Ground water quality and water quality index of Dwarka district of national capital of India ", International Journal of Research in Engineering and Technology, Volume: 03 Issue: 04.
Dwivedi S.L and Pathak V (2007), " A Preliminary assignment of water quality index to mandakini River, Chitrakoot", Indian Journal of Environmental protection.27(11):1036-1038.
Florence P. L., PAULRAJ A. and T. Ramach T. and R amoorthy, 2012, " Water Quality Index and Correlation Study for the Assessment of Water Quality and its Parameters of YercaudTaluk, Salem District, Tamil Nadu, India", ChemSci Trans., 2012, 1(1), 139-149.
Iraqi Central Organization for Standardization and Quality Control, 2001"Drinking Water Standards", No.417.
Iscen C., Emiroglu O., Ilhan S., Arslan N., Yilmaz V., and Ahiska S. ,2008, "Application of multivariate statistical techniques in the assessment of surface water quality in Uluabat Lake", Turk. Environ. Monit. Assess.144 (1-3): 269-276.
khudair B.,2013 "Assessment of Water Quality Index and Water Suitability of the Tigris River for drinking water within Baghdad City, Iraq" Journal of Engineering Number 6 Volume 19.
Oko O., Aremu M., Odoh R., Yebpella G. and Shenge G., 2014 "Assessment of Water Quality Index of Borehole and Well Water in Wukari Town, Taraba State, Nigeria" Journal of Environment and Earth Science, Vol. 4, No.5.
Ramakrishnaiah R., Sadashivalah C., and Ranganna G., 2009 "Assessment of water quality index for the groundwater in TumkurTaluk, Karnataka State", Indian J. Chem., 6: 523-530.
S. Kalavathy T. Rakesh Sharma1, P. Sureshkumar2, 2011"Water Quality Index of River Cauvery in Tiruchirappalli district, Tamilnadu" ARCH. ENVIRON. SCI. (2011), 5, 55-61.
Stark J., Hanson P., Goldstein, R., Fallon J., Fong A., Lee K., Kroening S., and Andrews W., 2000, "Water Quality in the Upper Mississippi River Basin, Minnesota, Wisconsin, South Dakota, Iowa, and North Dakota, 1995-98." United States Geological Survey, Circular 1211, Reston, Virginia, 36pp.
Vema N. and Kumar N., 2014, "Evaluation of underground water quality for drinking purpose by water quality index at Amroha, Uttar Pradesh ", International Journal of Geology, Earth and Environmental Sciences, Vol. 4 (1).
Journal of Babylon University/Engineering Sciences/ No.(1)/ Vol.(25): 2017
234
Figure 5 WQI for Al-Karama WTP at treatment plant sequence processes
Figure 6 WQI for Al-Karama WTP at network stations
Figure 7 WQI for Al-Wathba WTP at treatment plant sequence processes
0
100
200
300
400
K1P K2P K3P K4P K5P
WQ
I
Station
Al-Karama WQIWQI March WQI April WQI May WQI June
0
25
50
75
100
K6N K7N K8N K9N K10N
WQ
I
Station
Al-Karama WQI
WQI March WQI April WQI May WQI June
0
100
200
300
400
500
600
700
800
900
W1P W2P W3P W4P W5P
WQ
I
Station
Al-Wathba WQI
WQI March WQI April WQI May WQI June
Journal of Babylon University/Engineering Sciences/ No.(1)/ Vol.(25): 2017
235
Figure 8 WQI for Al-Wathba WTP at network stations
Figure 9 MPN at Al-Wathba WTP
Figure 10 MPN at Al-Karama WTP
0
25
50
75
100
W6N W7N W8N W9N W10N
WQ
I
Station
Al-Wathba WQI
WQI March WQI April WQI May WQI June
0
50
100
150
200
250
W1P W2P W3P W4P W5P
MP
N/1
00
ml
Station
Al-Wathba WTP
MPN March
MPN April
MPN May
MPN June
0
20
40
60
80
100
120
140
160
K1P K2P K3P K4P K5P
MP
N/1
00
ml
Station
Al-Karama WTP
MPN MarchMPN AprilMPN MayMPN June