Embed Size (px)
Citation preview

ASSET LIFE CYCLE MANAGEMENT AT PPG AC
EMEA.
THE DESIGN OF AN ASSET LIFE CYCLE
MANAGEMENT TOOL TO PRIORITIZE ASSET
LIFETIME IMPACTS BASED ON THE LIFETIME
IMPACT IDENTIFICATION ANALYSIS (LIIA).
Master’s thesis Project

COLOPHON MANAGEMENT TEAM DR. P. C. SCHUUR DR. A. J. J. BRAAKSMA COMPANY SUPERVISOR A. F. M. BUSKERMOLEN MSc Faculty of Business, Management and Social Science (BMS) Department Industrial Engineering and Business Information Services (IEBIS) DATE 5-Dec-18
REFERENCE APA TYPE Confidential VERSION Final
PROJECT Master’s thesis Project
AUTHOR Nina Jakubeit
TELEPHONE 0049/01635874249
EMAIL [email protected] POSTAL ADDRESS Postbox 217 7500 AE Enschede The Netherlands WEBSITE www.utwente.nl
DOCUMENT NAME ASSET LIFE CYCLE MANAGEMENT AT PPG AC EMEA. THE DESIGN OF AN ASSET LIFE CYCLE MANAGEMENT TOOL TO PRIORITIZE ASSET LIFETIME IMPACTS BASED ON THE LIFETIME IMPACT IDENTIFICATION ANALYSIS (LIIA). COPYRIGHT © University of Twente, the Netherlands. All rights reserved. No part of this publication may be reproduced, stored in a database or retrieval system, or published, in any form or by any means – electronic, mechanical, photocopying, recording or otherwise – without the prior written permission of the University of Twente.

Master’s thesis Project
Page | i
MANAGEMENT SUMMARY
The need to make more effective decisions on physical assets is being recognized increasingly,
supported by the fact that it connotes significant financial value. Hence, the right management of
these assets is essential for each organization. PPG, an American paint and coatings producer
with factories in the Netherlands and other European countries, has also recognized the need for
an increased focus on their installed base of technical assets. In order to do so, new investments
in the factory should show clear benefits beyond a simple one-to-one functional replacement of
machines, as is still common practice at the moment. PPG has shown interest in designing a
decision-making tool that can prioritize impacts affecting the remaining lifetime of their technical
assets. Identifying those priorities can support local teams to make better investment decisions,
and could help general management make better decisions on their manufacturing footprint.
Therefore, the main research question answered in this master’s thesis is:
“How can the asset decision-making process at PPG be structured to guide to more effective
asset investments?”
The aim of this master thesis is twofold, that is on the one hand to develop theory by designing an
asset decision-making tool, and on the other hand to apply theory by testing the decision-making
tool at one of PPG’s paint factories.
The designed tool is composed out of 11 steps, having the following structure:
1. Asset selection,
2. Collection of general asset information,
3. Expert session to identify asset lifetime impacts,
4. Writing the lifetime impact report (LIR),
5. Evaluation of report,
6. Collection of information from the business strategy,
7. Establishing and validating the scale for criteria and sub-criteria,
8. 2nd Expert-session:
a. Weighing of criteria,
b. Scoring of lifetime impacts on criteria,
9. Analyzing the collected data,
10. Writing the report on prioritization of lifetime impacts,
11. Final evaluation.
The tool was implemented and tested at PPG’s Amsterdam factory and showed promising results.
In the case of this PPG paint factory, which is still reliant on manual labor, many organizational

Master’s thesis Project
Page | ii
lifetime impacts were identified in particular. Not surprisingly, the most important lifetime impact at
PPG’s Amsterdam factory is the risk of not attracting enough highly skilled personnel. Generally,
the lifetime impacts identified at PPG do not exclusively guide to more effective asset investment
decision-making, but can also identify strategic focus areas of the factory, and can thus be seen
as a support tool to set strategy goals for the plant.
Based on the results of the tool and personal observations at the company as a business expert
an advice is presented, consisting of a strategic roadmap for the Amsterdam factory (see figure
below).
Strategic Roadmap for PPG's Amsterdam site stating short-, medium-, and long-term strategies.
The advice focuses on low tech solutions like shop floor management and total productive
maintenance (TPM) in order to counteract the risk of having not enough technicians in the short-
run. By assigning additional tasks to the operators and supporting them better at the filling and
packaging area, where most of the failures occur, less repetitive but more challenging are left to
the maintenance department. This in turn makes the work more attractive and helps them to set
the right priorities (to break out of daily firefighting). Since implementation of organizational change
is mostly challenging, also an implementation step approach is provided in this report. In the long-
run (within the next 10 years) it is advised to prepare the operational organization for the
introduction of new technologies like increased automation and modular assembly of production.
This is important in order to react to outside threats, like changing customer demands, material
price development, high labor costs and competitors investing in Mega Plants. Moreover, internal
challenges demanded by management, like the reduction of working capital in the warehouse and
the desired footprint reduction of the company, as well as the issues arising from the high average
age (<50) of operators can also be addressed by investing in new technologies in the long-run.

Master’s thesis Project
Page | iii
One important limitation is that the results of the tool are only representing a snapshot of the current
situation at the Amsterdam factory. By changing the personnel participating in the expert session,
the asset or the time, other results could be expected.
Recommendations for further improvement of the tool are given by incorporating the factor
uncertainty in the tool. To account for uncertainty, scenarios can be used on the lifetime impacts.
All in all, the designed support tool helped to better structure the asset decision-making process at
PPG, and to support effective decisions on technical assets. This indicates that the tool can also
be implemented at other PPG sites.

Master’s thesis Project
Page | iv
CONTENTS
Management Summary i
Figures vii
Tables viii
Reader’s Guide ix
Abbreviations x
1 Introduction 1 1.1 Brief context description .................................................................................................. 1 1.2 Motivation of research ..................................................................................................... 2 1.3 Problem description ........................................................................................................ 2 1.4 Research objective .......................................................................................................... 3 1.5 Research question(s) ...................................................................................................... 4 1.6 Thesis outline .................................................................................................................. 5
2 Context Analysis 7 2.1 Background description ................................................................................................... 7
2.1.1 The paint and coatings industry .................................................................................. 7 2.1.2 PPG Industries, Inc. and PPG AC EMEA ................................................................... 8 2.1.3 PPG’s Amsterdam paint factory .................................................................................. 9
2.2 Asset management at PPG ........................................................................................... 10 2.3 Empirical framework ...................................................................................................... 10 2.4 Conceptual model to identify problems ......................................................................... 15 2.5 Overview of problems in maintenance & asset management ....................................... 15 2.6 Conclusion ..................................................................................................................... 15
3 Methodology 17 3.1 Design science research ............................................................................................... 17 3.2 Conceptual model ......................................................................................................... 17
3.2.1 Problem analysis ....................................................................................................... 18 3.2.2 Initial solution ............................................................................................................. 18 3.2.3 Development of the solution ...................................................................................... 19 3.2.4 Implementation and testing ....................................................................................... 19
3.3 Data collection technique .............................................................................................. 19 3.4 Summary ....................................................................................................................... 20
4 General Literature Review on Asset Management 21 4.1 Maintenance & asset management .............................................................................. 21

Master’s thesis Project
Page | v
4.2 Delphi-study on maintenance innovation priorities ....................................................... 23 4.3 Definitions ...................................................................................................................... 24
4.3.1 Asset ......................................................................................................................... 24 4.3.2 Lifetime impacts ........................................................................................................ 25
4.4 Summary ....................................................................................................................... 26
5 Problem Analysis 27 5.1 Stakeholder analysis for asset decision-making process ............................................. 27
5.1.1 Identification of interviewees (key stakeholders) ...................................................... 27 5.2 Current processes & support tools for asset investment decision-making ................... 30 5.3 Problems with regard to making innovative asset decisions ........................................ 31
5.3.1 Interviews with key stakeholders ............................................................................... 31 5.3.2 Interviews to the problem exploration ....................................................................... 32 5.3.3 Findings of the interviews .......................................................................................... 32
5.4 Summary of challenges ................................................................................................. 32
6 Specific Literature Review for the Support Tool 35 6.1 Lifetime impact identification analysis ........................................................................... 35 6.2 Company specific performance criteria ......................................................................... 35
6.2.1 Risk management ..................................................................................................... 35 6.2.2 Balanced scorecard .................................................................................................. 36
6.3 Prioritization of lifetime impacts..................................................................................... 37 6.3.1 Multi-Criteria Decision Analysis ................................................................................. 37 6.3.2 Lifetime Impact Centered Asset Management .......................................................... 38 6.3.3 Analytical Hierarchy Process .................................................................................... 40
6.4 Summary ....................................................................................................................... 41
7 Initial Solutions 43 7.1 Specific criteria for an asset decision support tool ........................................................ 43 7.2 Usability of the LIIA for the support tool ........................................................................ 46 7.3 Extension of the LIIA for the support tool ...................................................................... 48
7.3.1 Comparison of models .............................................................................................. 51 7.3.2 Developed tool for prioritization ................................................................................. 52
7.4 Summary of all challenges and initial solutions ............................................................ 53
8 Solution Design 17
9 Implementation and Testing of the Solution Design 23 9.1 Implementation of the model at Amsterdam ................................................................. 23 9.2 Results of the model ..................................................................................................... 23 9.3 Personal reflection of results and advice ...................................................................... 23
10 Conclusion and Final Recommendations 33

Master’s thesis Project
Page | vi
10.1 Conclusion regarding the developed solution for PPG ................................................. 33 10.2 Limitations ..................................................................................................................... 35 10.3 Final recommendations ................................................................................................. 35 10.4 General conclusion internship assignment PPG........................................................... 38
References 39
11 Appendices 43 A.1 The paint production process .............................................................................................. 43 A.2 Operations performance objectives .................................................................................... 45 A.3 Multi criteria decision analysis ............................................................................................ 47 A.4 Multi Attribute Utility Theory ................................................................................................ 48 A.5 AHP explanation of steps .................................................................................................... 49 A.6 Semi-structured interview to identify the problem ............................................................... 52 A.7 Semi-structured interview to identify criteria for the decision-making tool .......................... 53

Master’s thesis Project
Page | vii
FIGURES
Figure 1 Visual description of research objectives. .................................................................. 4 Figure 2 Competitive Landscape of the paint and coating industry. (Bruno, 2018) ................. 7 Figure 3 Conceptual model to identify the problem ................................................................ 15 Figure 4 Design science process and output. (Ruitenburg, 2017, p.19) ................................ 17 Figure 5 Design science, step 1. ............................................................................................ 27 Figure 6 Salient model of the asset decision-making process at PPG. ................................. 30 Figure 7 Combined problems from pre-research and interviews. .......................................... 34 Figure 8 The four quadrants with different management approaches for lifetime impacts. ... 39 Figure 9 Design science, step 2. ............................................................................................ 43 Figure 10 AHP hierarchy tree for prioritization of lifetime impacts at PPG. ............................. 53 Figure 11 Design science, step 3. ............................................................................................ 17 Figure 12 Visualization of lifetime impact scores to show an example. ................................... 20 Figure 13 Visualization of the process to identify and prioritize lifetime impacts ..................... 21 Figure 14 Design science, step 4. ............................................................................................ 23 Figure 15 Strategic Roadmap for PPG's Amsterdam site ........................................................ 26 Figure 16 Artifact including scenarios ...................................................................................... 37 Figure 17 Visualization of the paint production process ........................................................... 43 Figure 18 Polar representation of five performance objectives ................................................ 46 Figure 19 "Hierarchy tree", decomposition of a problem into a hierarchy. ............................... 49

Master’s thesis Project
Page | viii
TABLES
Table 1 Applied CIMO logic................................................................................................... 18 Table 2 Comparison managing assets vs. Asset Management ............................................. 22 Table 3 Project stakeholder asset decision-making process ................................................ 28 Table 4 Model criteria related to the identified challenges. ................................................... 46 Table 5 Explanation of sub-criteria for Impact on the business ............................................ 50 Table 6 Comparison of models for prioritization of lifetime impacts. .................................... 51 Table 7 Overview of initial solutions to the identified challenges (and criteria)..................... 15 Table 8 Implementation of Shop Floor Management ............................................................ 29 Table 9 Implementation of Total Productive Maintenance .................................................... 30 Table 10 Internal and external benefits of excelling at performance objectives ..................... 45 Table 11 Average random consistency (RI), (T.L. Saaty, 1990) ............................................. 50 Table 12 Pairwise comparison table ....................................................................................... 51

Master’s thesis Project
Page | ix
READER’S GUIDE
The reader’s guide defines which chapters to read when the reader is only interested in understanding the practical contribution or only the scientific contribution. It classifies the chapter according to its focus area.
Chapter Chapter name Practical contribution Scientific contribution 1 Introduction X X 2 Context Analysis X 3 Methodology X 4 General Literature Review X 5 Problem Analysis X X 6 Literature Review for the
Support Tool X
7 Initial Solutions X 8 Solution Design X X 9 Testing & Implementation X
10 Conclusion X X

Master’s thesis Project
Page | x
ABBREVIATIONS
Abbreviation : Definition Introduced at page AC : Architectural Coatings 01
ACT : Authorization for Capital Transaction 04
AHP : Analytical Hierarchy Process 34
ALCM : Asset Life Cycle Management 02
AMF : Asset Management Framework 03
CAPEX : Capital Expenditure 17
CI : Consistency Index 83 (appendix)
CIMO : Context, Intervention, Mechanism, Outcome 14
CR : Consistency Ratio 86 (appendix)
CRV : Current Replacement Value 14
DCA : Distribution Center Amsterdam 10
DIY : Do-It-Yourself 09
EHS : Environment, Health & Safety 25
EMEA : Europe, Middle East and Africa 01
HR : Human Resource 02
ICC : Interclass Correlation Coefficient 83 (appendix)
ISO : International Organization for Standardization 17
KPI : Key Performance Indicator 09
LCC : Life Cycle Costing 19MAUT
LICAM : Lifetime Impact Centered Asset Management 05
LIIA : Lifetime Impact Identification Analysis 04
MAUT : Multi- Attribute Utility Theory 34
MAVT : Multi- Attribute Value Theory 34
MCDA : Multi Criteria Decision Analysis 15
NL : the Netherlands 25
OEE : Overall Equipment Effectiveness 33
OEM : Original Equipment Manufacturer 33
OPEX : Operational Expenditure 17
OTIF : On Time In Full 46
PPG : Pittsburgh Plate Glass 08
RI : Average Random Consistency 86 (appendix)
RNE : Region North & East 24
ROI : Return On Investment 33

Master’s thesis Project
Page | xi
Abbreviation : Definition Introduced at page RQ : Research Question 04
R&D : Research & Development 10
SBU : Strategical Business Unit 08
SFM : Shop Floor Management 65
SKU : Stock Keeping Unit 10
SWOT : Strengths, Weaknesses, Opportunities & Threats 05
TC : Technical Committee 17
TCO : Total Cost of Ownership 54
TECC : Technical, Economic, Commercial, Compliance 43
TECCO : Technical, Economic, Commercial, Compliance, Organizational 15

Master’s thesis Project
Page | xii

Master’s thesis Project
Page | 1
1 INTRODUCTION
In the framework of this master’s thesis project conducted within the scope of the master program
Industrial Engineering & Management, with the specialization Production & Logistic Management,
research was performed at PPG into the design of a decision-making tool that prioritizes lifetime
impacts. During an internship period of six months the student performed research at the case company
PPG, a multinational American-owned paint and coatings producing company, to structure PPG’s asset
decision-making process more effectively. To PPG, assets are factories and warehouses.
The purpose of the first chapter is to give a general introduction to asset management and the problem
to solve during the research project at PPG. It lays the foundation for the project and discusses the
research questions relevant to approach during the project in order to successful accomplish the project.
Chapter 1 is structured as follows: a brief introduction of the relevance of asset management is given
in section 1.1 and the motivation for the research project at PPG is outlined in section 1.2 . The problem
is introduced in section 1.3, as well as the thesis objective in section 1.4 and research questions
together with a plan of approach per research question and the deliverables of the project in section
1.5. Finally, the outline of the thesis is presented in section 1.6.
1.1 Brief context description In 2008, the Western world faced an economic downturn, which still influences business decisions
today. It resulted in more volatile markets and a more conservative approach towards new investment
projects (Haarman & Delahay, 2016). This also affected the market of architectural coatings, where
sales volumes have stagnated (IHS Markit, 2017). Also, within PPG Architectural Coatings Europe,
Middle-East & Africa (PPG AC EMEA)1 no large-scale investment projects have been realized since.
Even though physical assets, such as machinery, factories and infrastructure, typical have a lifetime of
several decades, it has been investigated that many of these assets soon reach the end of their lifetime,
indicating that large-scale replacement of physical assets in the Western world lies ahead (Tinga, 2013).
Most of the equipment is capital intensive to buy and maintain, so that often such large-scale
replacements of assets cannot be justified economically. Still, the assets will need more intensive
maintenance, modernization and life extension. The current situation calls for careful planning of
resources as capital and qualified engineers are scarce. Also, PPG faces the issue of aging assets and
wants to utilize asset opportunities in a more efficient way.
On top of that, the asset portfolio of companies today is often a collection of old, updated and new
equipment. These assets are indispensable for the company as a whole and represent large amounts
of financial value. Especially for PPG this is a relevant issue as they grew through mergers &
acquisitions in recent years. Therefore, their asset portfolio is hardly standardized. Because they
1 simply referred to as ‘PPG’ from this point onwards

Master’s thesis Project
Page | 2
produce so many different products with unique ingredients and formulations, it is not so easy to
produce it on different lines, let alone in a completely different factory.
These developments indicate that there is an urgent need for a more structured approach to make
effective decisions on whether and when to replace or modify the asset. To do so, the current and future
performance of the asset portfolio has to be identified. For asset life cycle management (ALCM) to be
included in a company’s day-to-day activities the designed model has to be in line with the corporate
objectives and embedded in the organizational structure.
1.2 Motivation of research There is an increasing need for making more effective decisions on assets. The World Class
Maintenance network in the Netherlands has identified asset portfolio management as one of the
leading maintenance innovation priorities in their recently published Delphi-study (Akkermans,
Besselink, van Dongen, & Schouten, 2016), in which they asked 50 maintenance experts from Dutch
industry and academia to evaluate the success potential of new trends within the field. Asset portfolio
management was ranked as the 10th most important innovation in maintenance for the coming 5-10
years. This indicates that many organizations recognize the need to develop an overview of the current
and future costs and performance of the asset portfolio, so that objective decisions can be made
regarding the asset strategy. Moreover, a shift towards asset management and the need to include
general management in maintenance-relevant decisions is identified. The strategic and long-term life
cycle view is gaining importance in the field of maintenance, especially due to the large financial value
involved. It is also important to note that asset management is a young, rapidly developing field with
great potential to uncover. The business value of maintenance is still widely underestimated (Haarman
& Delahay, 2016), demanding an asset management approach. On top of that, asset life cycle
management is viewed as a multidisciplinary practice (Pudney, 2010) by aligning maintenance and
asset management to the corporate strategy and by cooperating with disciplines such as Sales and
Human Resource (HR) Management. As such, incorporating different views in the model is a
requirement for this master’s thesis project. Also, PPG faces the challenge that there is no such process
established, which enables departments to work together and breaking out of the daily fire-fighting
atmosphere in order to make more effective decisions on the asset. Thus, by introducing a more
structured decision-making process that identifies and prioritizes critical impacts on the asset, well-
grounded decisions on asset investments can be made. Consequently, bringing asset life cycle
management at PPG to a more structured level will be a challenge in its own right.
1.3 Problem description The paint and coatings industry can be characterized as a low cost and labor-intensive industry.
An indication of low cost is provided by the relatively low, restricted re-investment budgets in the
factories – the re-investment budget for new equipment is well below the yearly depreciation rate of
installed equipment in the plant. Also, around half of the production costs are labor costs, explained in
more detail in section 2.1.4.

Master’s thesis Project
Page | 3
PPG is a leader in innovation & color, and puts an increasing focus on sustainability. The company
operates 17 factories in Europe, all of which are relatively outdated, suffering from a considerable level
of deferred maintenance (Buskermolen, 2010). To renew such a large physical asset base would
involve huge investments, which are not always justifiable in a relatively low-budget industry. PPG
strives for operational excellence in production, including asset management. To reach this goal, PPG
introduced an Asset Management Framework (AMF) in 2014, which has a multidisciplinary focus.
PPG’s maintenance mission reads: “We keep our assets safe and available, and make them last longer,
by running a controlled maintenance process, using the right strategies, and by continuously improving
it”. Nevertheless, maintenance activities executed are still predominantly corrective, and only some are
preventive. Moreover, PPG AC EMEA wants to investigate opportunities in digitalization and in more
proactive ALCM. The challenge for PPG is to keep their partly outdated physical asset base legally
compliant, fit-for-purpose and cost-effective in a rapidly changing business and technological
environment.
Therefore, the core problem at PPG is the currently inefficient decision-making process regarding asset
investments. It is the result of several sub-problems, namely:
1. There is little alignment between different stakeholders within PPG’s asset decision-making
process.
2. PPG is managing asset lifetime impacts2 and their effect on asset performance not efficiently.
3. PPG has issues translating the impact of changes in asset performance to business value.
4. Project teams feel not motivated to focus on technological innovations in the factories, because
of a strategic cost reduction focus which has been dominant the last decade.
1.4 Research objective This research project aims to design a decision-making tool that prioritizes challenges and opportunities
in the internal and external environment of the asset, which will affect the asset performance in the
future. This tool can be used to make efficient decisions for asset lifetime impacts. In this context, the
first objective is to determine the current obstacles in the asset (investment) decision-making process
at PPG. The second objective is to identify ALCM and decision-making methods in recent literature that
will help PPG structure their asset decision-making process. Based on the theoretical and practical
implications the design will be guided. The designed tool should optimize the currently reactive and
rather unstructured approach and assist the asset managers in making more strategic decisions.
A visual description can be found in Figure 1.
2 The concept of lifetime impacts will be explained in paragraph 4.3.2.

Master’s thesis Project
Page | 4
Figure 1 Visual description of research objectives.
1.5 Research question(s) To achieve this objective the central research question for this master’s thesis project is:
“How can the asset decision-making process at PPG be structured to guide to more effective asset
investments?”
In order to be able to answer the central research question, the following research questions (RQs) will
be answered in this master’s thesis first. The plan of approach – how to address the RQ – is stated in
bullets below the research question.
1. Who are the stakeholders in the asset decision-making process at PPG?
- Mapping of the project environment.
- Determination of influence and interest of stakeholders.
2. To what extent are asset (investment) proposals and decisions at PPG currently supported by
tools and processes?
- Interviews with key stakeholders and personal meetings with Maintenance &
Engineering team.
- Study of the company documents (I.e. Authorization for Capital Transaction (ACT)).
3. What are the problems with regard to making (innovative) asset decisions at PPG Amsterdam?
- Review of literature about current problems in asset management decisions.
- Interviews with key stakeholders about the asset decision-making process.
4. What are specific criteria for an asset decision support tool at PPG?
- Analysis of the challenges of the asset decision-making process at PPG and translating
those to criteria for the tool.
- Finding solution principles from literature that address the criteria appropriately.
- Evaluation that all challenges are well-approached by the criteria.
5. To what extent can the Lifetime Impact Identification Analysis (LIIA)3 and process be used in
the specific context of PPG for the identified criteria?
3 The LIIA is a method that uses technical, economic, compliance, commercial and organizational perspectives to identify long-term challenges and opportunities for the asset.

Master’s thesis Project
Page | 5
- Outline of the main characteristics of the LIIA.
- Investigation of the extent to which the specific criteria for an asset decision support
tool are met by the LIIA.
6. To what extent does the LIIA have to be extended in order to fulfil all identified criteria for the
decisions support tool at PPG?
- Investigation of literature on lifetime impact centered asset management (LICAM), the
balanced scorecard and MCDA.
- Interviews with key stakeholders on the criteria of the tool.
- Analysis of the extent to which the MCDA tools and techniques address the specific
criteria of the asset decision support tool.
7. How can the designed tool be implemented and tested at PPG in order to evaluate its
effectiveness?
- Choice of an appropriate asset of PPG that can benefit from improvement in the asset
decision-making process.
- Evaluation of the choice with a SWOT- (strengths, weaknesses, opportunities &
threats) analysis.
- Testing of the solution design at the factory of choice to evaluate the effectiveness of
the design.
After answering the RQs the following deliverables are provided:
• The solution design of the support tool that prioritizes lifetime impacts at PPG to guide
to more effective asset investments.
• Results of the application of the tool at PPG’s Amsterdam factory (report of the LIIA
and the prioritization of lifetime impacts).
• Implications for further use of the support tool at other factories of PPG.
• Implications for practitioners and theorists.
• Recommendations for further improvement of the support tool.
1.6 Thesis outline The structure of the thesis is as follows. In chapter 2 the context is analyzed by introducing background
information of PPG and mapping the problem context. After this, in chapter 3, the methodology used in
this research is introduced – the design science research methodology. Next, in chapter 4 a literature
review on asset (life cycle) management is conducted, followed by answering the first three research
questions in the problem analysis (chapter 5). The problem analysis is also the first step of the design
science cycle. In chapter 6, more specific literature is investigated to design the support tool for asset
decisions at PPG. The second step of the design science cycle is conducted, and initial solutions from
the literature are presented in chapter 7. Moreover, this chapter also answers the research questions
four to six. Then the solution design (conceptual model) of the decision-making tool is explained in
chapter 8 that combines the initial solutions encountered in the previous chapter to a final solution and

Master’s thesis Project
Page | 6
is the third step in the design science cycle. It also answers the central research question. The solution
design is implemented and tested at PPG’s Amsterdam factory (chapter 9), with this step the design
science cycle is closed. This also gives answer to the 7th research question and validates the answer
to the central research question given in chapter 8. Finally, in chapter 10 a conclusion and some
recommendations are presented.

Master’s thesis Project
Page | 7
2 CONTEXT ANALYSIS
The purpose of chapter 2 is to provide background information on the context. Hence, more information
about the case company PPG is provided to get a better understanding of the environment they are
operating in. Moreover, asset management at PPG and the associated problems are outlined.
This gives a first indication of the problems to approach in this master’s thesis. The difference to chapter
5, the problem analysis, is that the problems identified here are based on desk research – studying
company documents, whereas the problems from the problem analysis are based on findings from
interviews.
This chapter is structured as follows: section 2.1 provides the background of the industry and an
introduction to the company. The same section also introduces PPG’s Amsterdam factory in more detail,
as the designed tool has been implemented there. In context of the master’s thesis, the current asset
management practices of PPG are presented in section 2.2. After this, the empirical framework is
explained first in section 2.3, followed by outlining how the problems were identified in a conceptual
model in section 2.4. Problems in asset management are described and put into perspective in section
2.5. In section 2.6 a final summary of the identified problems is charted.
2.1 Background description
2.1.1 The paint and coatings industry
The paint and coatings market is relatively competitive with a lot of small players. Half of the world
market-share is distributed over the ten biggest suppliers. PPG Industries, Inc. is currently the second
biggest supplier worldwide of paints and coatings, which makes them dominate the market together
with Sherwin-Williams and AkzoNobel (Figure 2). Also in Europe they are under the leading producers
of paint and coatings. More information regarding the European brand market combinations of PPG
can be found in the appendix (A.1 Brand market combinations PPG in Europe).
Figure 2 Competitive Landscape of the paint and coating industry. (Bruno, 2018)

Master’s thesis Project
Page | 8
In general, sales in the architectural paint and coatings industry are stagnating due to a mature market,
despite a relatively healthy economy in the Western World. Therefore, the demand growth prognosis
from 2016 to 2021 in Western Europe is around 2% (IHS Markit, 2017). Moreover, the demand for more
product variation and a higher product quality is rising. Especially waterborne and high solids coatings,
powders, UV curables, and two-component systems have a good growth perspective. One reason for
that is an overall trend towards more stringent environmental regulations to limit the emissions of
volatile organic compounds (VOCs) and hazardous air pollutants (HAPs) (IHS Markit, 2017).
Product design is also increasingly driven by new innovative solutions and an increasing focus on
sustainability (PPG, 2018a).
2.1.2 PPG Industries, Inc. and PPG AC EMEA
PPG Industries, Inc.4 was founded in 1883 as a producer of high-quality thick plate glass. In 1900, they
acquired the Milwaukee-based “Patton Paint Company”, because of the similarity in the distribution
channels of paint and glass. In the period 1900-1920 PPG is one of the first American companies
expanding production to Europe, by acquiring a Belgium-based glass factory. This step provided them
with consistent growth, because the automotive and skyscraper construction industry expanded.
After the Second World War PPG’s continued growth benefited from the increased car and building
construction. In 1968 Pittsburgh Plate Glass Company changed its name to PPG Industries, reflecting
its diversification, growth and increasing global presence. Continuing this strategy, in 1989 PPG begins
to acquire businesses worldwide that expand the company’s product base by serving industries like
automotive, industrial, aerospace and packaging coatings. Since 2005, PPG transformed its business
to a purely paint and coatings supplier. In a period over ten years they sold their business units in
Optical, Commodity Chemicals and Glass, while at the same time acquiring several competitors from
the paint and coatings industry. They acquired the SigmaKalon Group (2008), Dyrup (2013), the US-
and Canadian Architectural Coating (AC) business unit of AkzoNobel (2013), and Comex (2014/2015).
This acquisition strategy enabled PPG to increase their sales by approximately 5% (Bruno, 2018).
Due to the takeover of SigmaKalon, they can claim to have one of the longest traditions of paint-making.
Pieter Schoen, one of the companies merging into Sigma Coatings in 1972 and absorbed into
SigmaKalon in 1999, was founded as a paint company in 1722 and developed to one of the leading
paint producers in Europe before being sold to PPG (PPG, 2018b).
PPG has a global presence with 156 manufacturing sites around the world and headquarters in the US,
Hong-Kong, Brazil and Switzerland. They are split in two major segments – Performance Coatings and
Industrial Coatings. Within the segment Performance Coatings there are five strategic business units
(SBUs): Automotive Refinish, Aerospace, Architectural Coatings America & Asia Pacific, Architectural
Coatings (AC) Europe, Middle East & Africa (EMEA) and Protective & Marine (Bruno, 2018).
This master’s thesis concentrates on the 17 sites of the SBU AC EMEA. PPG AC is PPG’s largest
4 Pittsburgh Plate Glass Company, in the following thesis referred to as ‘PPG’

Master’s thesis Project
Page | 9
global SBU. Their European based SBU produces around 400 million liter of paint annually for
professional and Do-it-yourself (DIY) customers and generated € 1.7 billion of sales in 2017 (Spruijt,
2018b).
The company’s corporate vision is to be the world’s leading coatings producer by delivering high-quality,
innovative and sustainable solutions to the customer. This is supported by recent developments and
future goals. PPG introduced some major product innovation (e.g. smart coatings that absorb pollution)
and set a target to generate 25% of sales from products introduced in the last four years.
Moreover, they committed to several sustainable goals to create awareness for the protection of our
planet. To name a few goals: 40% of sales should be generated by sustainable products and processes
and a 10% reduction of waste disposal should be achieved by 2020 (PPG, 2018b).
Another essential aspect of the future direction of the company will be the digitalization of business
processes. The management is increasingly looking into how to change the corporate culture to cope
with the demands of a digitalized world. Customer driven digitalization projects are already in place, i.e.
an online direct ordering platform. Furthermore, the vision of a digital supply chain with a 5-year digital
transformation roadmap was introduced in 2018. These recent developments will shape the challenges
put on the production process in the future and therefore have a major influence on future asset projects
(Buskermolen, 2018c).
2.1.3 PPG’s Amsterdam paint factory
In this master’s thesis, the solution design will be implemented at PPG’s Amsterdam factory. Reasons
why the Amsterdam based factory was chosen to test the decision-making tool are:
• Research access: It is easier to organize personal meetings and expert sessions with the
relevant stakeholders.
• Business relevance: It is not assumed that the Amsterdam plant will be shut down in the short-
to-mid-term future to reduce PPG’s footprint, because of its strategic importance.
o PPG’s Amsterdam factory produces high quality products, which cannot easily be
produced in other factories.
• Improvement potential: In recent years many of the investment projects at PPG’s Amsterdam
factory were focused on replacement only, much to the disappointment of general
management.
o Comparable factories of PPG in the UK have convinced senior management with
stronger business cases and thus got more budget approved.
o The project execution capability in Amsterdam is limited, the project execution key
performance indicator5 (KPI) is currently only at around 40%.
5 The project execution KPI determines how much percent of the originally planned projects for the year could actually be completed within the year.

Master’s thesis Project
Page | 10
o Competitor Akzo Nobel recently built a “Master-Plant”, and many other competitors are
investing heavily currently: in order to stay competitive, investments in new
technologies are needed.
o Personnel satisfaction in the Amsterdam factory is decreasing due to recurring failures
of machines and not getting the budget approved for new projects.
• Information availability: Data on the decreasing technical condition of assets in the factory is
available.
PPG’s Amsterdam paint plant is one of the most complex production sites of PPG. It is located in the
west of the Netherlands, close to highways and Schiphol Airport, which allows for fast distribution to
customers in the Netherlands and neighboring Germany and Belgium.
The site produces approximately 22,000 tons of paint and coatings annually, even though it has a
design capacity of 50,000 tons annually (Buskermolen, 2018a). This means the Amsterdam factory only
has an average utilization rate of around 45%, although some critical lines operate at a much higher
rate. The factory produces 16 different brands, and can sizes vary from 0.25-20 L. 600 types of raw
materials and around 1000 different manufacturing formulations are used to produce around 4000
packaging stock keeping units (SKUs) (Buskermolen, 2013). Finished products (SKUs) are produced
to stock, and the site has its own warehouse on site, the “Distribution Center Amsterdam (DCA)”.
Even though the marketing department is currently investigating options to reduce complexity in the
product portfolio, from a supply chain perspective this is not expected to succeed in the short- to
intermediate future. The reason for this is that marketing and research and development (R&D) are
introducing new product development at the same rate as they are eliminating old products.
On top of the huge product variation, the site has to deal with seasonal effects in demand.
Together with the high finished goods storage costs, these factors demand a high flexibility in the
production process. More information about the current situation and possible external influences to the
Amsterdam factory can be found in the SWOT- analysis in the confidential appendix. More detailed
information regarding the current situation of the Amsterdam factory cannot be displayed because of
confidentiality.
2.2 Asset management at PPG
Information is shown in the confidential appendix.
2.3 Empirical framework The empirical framework that is used in this master’s project, consists of earlier surveys of deferred
maintenance and findings from interviews with key asset management stakeholders. In the context of
this project, PPG’s Amsterdam factory is used as a typical example of the problem studied.
Ramtahalsing (2017) conducted a survey of the state of deferred maintenance at PPG’s Amsterdam
factory. Furthermore, other technical documents, like the maintenance dashboard, support
Ramtahalsing’s findings that the technical condition of assets has deteriorated.

Master’s thesis Project
Page | 15
Since asset management is a multidisciplinary approach, not focused solely on technical aspects of the
asset, the interviews with key stakeholders revealed other obstacles in the current asset decision-
making process. The overview of identified problems in maintenance and asset management can be
found in the next paragraph. The analysis of the interviews will be presented in chapter 5.
All in all, the information from the empirical framework suggests that there is a need for an asset
decision-making tool, to prioritize the mitigation of the identified lifetime impacts affecting the
performance of the asset.
2.4 Conceptual model to identify problems
Figure 3 Conceptual model to identify the problem
The empirical framework in the previous section already explains which information is relevant in order
to identify the problem at PPG. This section focuses on how the information generated is used to come
to the final list of challenges in the asset decision-making process. First, desk research is performed by
studying company documents to identify practical problems, and literature is studied to recognize
theoretical problems. Both are combined in the interview guide with a view to verify the problems in the
asset decision-making process with key stakeholders. The identified challenges from studying company
documents are presented in section 2.6. Later in this report, those challenges are verified and extended
with the challenges identified during the interviews with key stakeholders. This step is shown in section
5.4 and makes the original problems identified in the studied documents even stronger. Finally, all
identified problems are merged to define the full scope of the problem.
2.5 Overview of problems in maintenance & asset management
Information is stored in the confidential appendix.
2.6 Conclusion From studying the company documents and making observations a number of challenges in asset
management were encountered:
Challenge 1: The technical condition of the assets in the factory is deteriorating, demanding more
effective decision-making for maintenance management and for new and replacement investments
alike.

Master’s thesis Project
Page | 16
Challenge 2: There is a recognized need to invest in digitalization opportunities in the supply chain. In
order to stay competitive PPG has to invest in new technologies. However, so far the operational
organization is not equipped to follow up effectively.
Challenge 3: There is a discrepancy between the perception and interest of general management and
the employees working in the plant in terms of asset project focus.
Challenge 4: Different part of the organization are demanding new functionalities from the assets,
requiring more flexibility.
Overall challenge: PPG has to keep their partly outdated physical asset base legally compliant, fit-for-
purpose and cost-effective in a rapidly changing business and technological environment.
This will be investigated in more detail in the interviews with key stakeholders of the asset decision-
making process in order to support the observations so far. Moreover, it can be seen that the challenges
currently seen in asset management are multidisciplinary and do not only focus on technical issues.

Master’s thesis Project
Page | 17
3 METHODOLOGY
The 3rd chapter introduces the design science research. This is the methodology applied to develop the
support tool. Moreover, the conceptual model and data collection techniques are presented.
The chapter is structured as follows: in section 3.1 the design science research methodology is
introduced, after which the conceptual model used in this master’s thesis is explained in section 3.2.
The applied data selection technique is outlined in section 3.3. Finally, a short summary of the chapter
is given in section 3.4.
3.1 Design science research Design science research and explanatory science research are two commonly used methodologies in
engineering. The design science research aims at developing knowledge that can be used to design a
solution for a specific problem. It is an iterative process, which involves implementing and testing the
solution design in order to assess its effectiveness (van Aken, Chandrasekaran, & Halman, 2016).
Its contribution to science is concerned with understanding why the design directs to this specific result,
and relate it to the wider literature (Holmström, Ketokivi, & Hameri, 2009). Especially in operations
management, design science wants to close the gap between, and make a contribution to, science and
practice (Hevner, March, Park, & Ram, 2004). Explanatory science research, on the other hand, only
wants to generate an explanation for the problem, but does not go so far to solve it. The main goal is to
acquire new insights to the problem in order to be able to define a more precise problem (van Aken,
Berends, & van der Bij, 2007). Within this research project the aim is to design a decision-making tool
that prioritizes lifetime impacts influencing the assets performance and guide to asset investment
proposals, then implement and test it at PPG. Hence, first a problem is identified, and by designing a
decision-making tool a solution to this problem is generated. That is why design science will be the
methodology used in the research project conducted at PPG.
3.2 Conceptual model
Figure 4 Design science process and output. (Ruitenburg, 2017, p.19)
The conceptual model is based on the four steps described in Figure 4. It is grounded in the three
phases of the design science approach identified by Meyer, Buijs, Szirbik, & Wortmann (2014).
They defined the three phases as follows. First, performing a case study at the company to identify the

Master’s thesis Project
Page | 18
problems. Second, a set of solutions will be designed to be able to conquer those problems. After that,
the initial solutions will be combined to a final solution, which will be implemented and tested at the
company. Other than Meyer et al. (2014), who view the final solution design and implementing and
testing it as one phase, Ruitenburg (2017) differentiates between creating a final solution design (step
3) and implementing and testing this solution in practice in step 4 (Figure 7). Generally, however, they
follow the same logical steps and both can be applied. In this master’s thesis it will be distinguished
between those steps of Figure 7 by using different chapters. In that way a clear structure of the design
science methodology can be applied. It helps the reader to understand the clear reasoning in the
successive steps.
3.2.1 Problem analysis
During the first phase, the problem exploration, the practical problem at PPG will be studied. Data is
collected using semi-structured interviews with key stakeholders, see appendix (A.6 Semi-structured
interview to identify the problem).
Moreover, informal conversations with stakeholders, studying company documents and observations
were also used as information sources to identify the problem. The problems encountered during
studying the company documents were already outlined in section 2.6, the problems identified in the
interviews are explained in the problem analysis (chapter 5). The multiple sources of information allow
for drawing reliable conclusions. The findings are discussed with the SBU Maintenance and Engineering
manager for further validation. Moreover, also the identified research questions can be addressed in
this context, as they ask for the current problems in the asset decision-making process and the criteria
necessary for prioritization of lifetime impacts.
3.2.2 Initial solution
In order to generate an initial solution for each of the main identified problems of the previous step,
scientific literature will be reviewed. The first step is to find criteria for the model that address the
challenges identified in the problem analysis. Then initial solutions can be found that incorporate those
criteria. When generating the initial solution, the so-called Context, Intervention, Mechanism and
Outcome (CIMO)- logic can be applied (Denyer, Tranfield, & van Aken, 2008). It means that in context
(C), use intervention (I) to trigger mechanisms (M) that generates outcome (O). One example of applied
CIMO-logic is presented in Table 1. This will be performed for all identified challenges/ criteria of the
problem, and ultimately combined to a solution design. The initial solutions to the identified problems
are presented in chapter 7. Table 1 Applied CIMO logic
Challenge There is a discrepancy between the perception and interest of general management and the employees working in the plant in terms of asset project focus.
Context In the multidisciplinary context of asset management…

Master’s thesis Project
Page | 19
Intervention Bringing people together from the different TECCO6- perspectives…
Mechanism Will start a knowledge exchange and discussion of perceptions…
Outcome Thereby creating a shared view and alignment of interests for new asset projects.
3.2.3 Development of the solution
In the third phase, the solution design (also called conceptual model), the previous initial solutions are
combined to one, by introducing a model. The main goal is to describe the designed tool and to show
the decisions involved. A clear chain of evidence is developed to validate the model. Implications from
theory and practice are put together to find a solution to the identified problem. For example, the LIIA,
a method that identifies impacts that are affecting the remaining lifetime of the asset, will be a relevant
method to embed in the solution design as it provides some solution to parts of the problem.
More research is conducted in order to provide a “complete solution” to the identified problem. The
solution design is introduced in chapter 8.
3.2.4 Implementation and testing
After development of the solution, the solution design is implemented at PPG’s Amsterdam factory to
test its effectiveness. The reasons to choose this factory have already been discussed in paragraph
2.1.3. The purpose of this step is to get to understand the mechanisms leading to the desired result,
and to validate the model. Therefore, the success of the model is evaluated with key stakeholders in
face-to-face discussions. In case the model delivers the desired outcome, it can be acted upon.
The implementation and testing of the model is discussed in chapter 9.
3.3 Data collection technique First, data is generated by performing face-to-face and telephone surveys with management.
Interviewing is a relevant data collection technique to get the right information from respondents, and
also understand their reasoning (van Aken et al., 2007). Interviews offer the interviewer the possibility
to ask further questions and dive deeper into a complex problem structure. This data collection
technique will typically be applied to help understand the full scope of the problem.
Second, a literature review is conducted to identify:
• Recent trends in asset life cycle management to identify impacts that affect the remaining
lifetime of the asset,
• Recent developments in multi-criteria decision analysis (MCDA) to be able to prioritize asset
risks and opportunities, and
• Business performance objectives to identify possible prioritization criteria.
6 TECCO = technical, economic, commercial, compliance, organizational. These are relevant perspectives that can influence the asset performance in the future. Explained in more detail in chapter 7.

Master’s thesis Project
Page | 20
Those two techniques are the main drivers to generate a solution design for the identified problem.
However, in order to test the solution design more data collection techniques will be relevant.
Expert sessions will be held additionally, as they facilitate the interactive information sharing (van Aken
et al., 2007). This strategy in particular is a powerful tool to gasp all relevant asset lifetime impacts and
prioritize them. Also, during the expert sessions, the extent of discussion and agreement between
experts on the lifetime impact indicates the reliability of the collected data, similar to the Delphi-method
(Okoli & Pawlowski, 2004). The Delphi-method is a structured and interactive method relying on
objective experts. The experts are chosen carefully to evaluate the lifetime impacts, and information is
shared so that one can come to mutual agreements (Rowe & Wright, 2001). The information generated
in the expert sessions will be collected in a report and experts have the chance to give feedback to this
report as a confirmation step.
Other sources of information are company internal reports. The recent report on deferred maintenance
(Ramtahalsing, 2017)7, the maintenance dashboard (for information on maintenance and production
costs) and the supply-chain financial reports (for information on labor and machine costs per line), are
used to provide a first problem identification (section 2.6) and serve as background information to the
expert sessions8.
3.4 Summary This chapter outlined the methodology applied to design the solution. It introduced the design science
methodology and why it is regarded as the most appropriate method for this project. Moreover, the
conceptual model was shown to explain how design science is used. Finally, it was outlined how the
required information to design the support tool are collected.
7 for information on current replacement value (CRV), deferred maintenance, performance-critical assets, unavailability of assets 8 This information will not be included directly in the master’s thesis, but aided in the preparation of the expert-session.

Master’s thesis Project
Page | 21
4 GENERAL LITERATURE REVIEW ON
ASSET MANAGEMENT
The following chapter discusses recent developments in literature about maintenance and asset
management. Moreover, a recent study on innovations in maintenance and the need for asset portfolio
management is introduced. After this, some useful definitions are provided. The difference between
chapter 4 and chapter 6 is the focus of the literature review. The current chapter outlines the
development of asset management and approaches the general topic of this thesis – asset life cycle
management- while chapter 6 presents a more detailed focus of the literature investigated. It studies
specific concepts that are relevant to the design of the asset decision support tool. To this end, chapter
4 starts with a general introduction to maintenance and asset management in (section 4.1), and then
specifically outlines the recent study that identified asset portfolio management as a leading priority in
maintenance in section 4.2. Section 4.3 defines concepts like lifetime impacts and assets, relevant in
the scope of this master’s thesis project. Finally, section 4.4 gives a short summary of this chapter.
4.1 Maintenance & asset management Maintenance is a topic discussed extensively in recent literature. A general indication suggests that
there is a shift from maintenance seen as a pure cost factor to the value potential creation of the
maintenance function. In that context, Kelly (2006) uses the term “business-centered maintenance”,
where a maintenance decision-making process is established that focuses on realizing long-term
business objectives. Haarman & Delahay (2016) introduce the “value-driven maintenance” approach to
realize value creation of the maintenance function in capital intensive industries. In this context, the
term asset management is used. With a rather financial focus maintenance is presented as being
responsible for the operational maintenance costs (OPEX= operating expenditure), while asset
management has an extended focus, also including investment costs (CAPEX= capital expenditure).
Furthermore, the International Organization for Standardization (ISO),Technical Committee (TC) of
Asset Management Systems (2018) defines asset management as a function that “coordinates the
financial, operational, maintenance, risk, and other asset-related activities of an organization to realize
more value from its assets” (ISO Technical Committee for Asset Management Systems, 2018).
This already indicates a multidisciplinary approach as well as a value creation focus. In a recently
published report on asset management, the ISO Technical Committee distinguishes between the short-
term focus of managing assets and the long-term life cycle focus of asset management (ISO/TC251,
2017). A detailed comparison can be seen in Table 2. Managing assets is really focused on the
operational execution of the maintenance tasks, whereas asset management has a more strategic focus
on getting the most out of the performance of the assets over their lifetime. This master’s thesis focuses
on asset management rather than managing assets, which does not imply than one is more important
than the other.

Master’s thesis Project
Page | 22
Table 2 Comparison managing assets vs. Asset Management
Managing assets Asset Management
Your colleagues are focused on:
• Asset data, location and condition
assessment
• Current KPI’s
• Department budget
Your colleagues are focused on:
• Information supported decisions (strategic
context, related to customer needs)
• Strategies to select and exploit assets over their
life cycle to support business aims
• Collaboration across departments to optimize
resource allocation and activities
Your stakeholders are focused on:
• Costs
• Current Performance
• Response to failures/maintaining
functions
Your stakeholders are focused on:
• Triple bottom line9 and value
• Clarity of purpose of the organization
• Focus on impact of activities on organization’s
objectives
Your top management is focused on:
• Short-term gain/loss
• Departmental/individual performance
• Savings, especially OPEX
Your top management is focused on:
• Long-term value for the organization
• Developing competences and capabilities across
workforce
• Business risks understood and mitigated
Your suppliers are focused on:
• Short-term contracts and performance
• Service level agreements are focused on
contract specifications
Your suppliers are focused on:
• Long-term contracts and/or partnering
relationships in support of client value and
objectives
• Understanding client strategy and needs in 5-10
years
ISO 55000:2014, the ISO standard on asset management from 2014 supports the value creation
potential of assets due to maintenance (and other support functions). It states that asset management
is the “coordinated activity of an organization to realize value from assets” (International Organization
for Standardization, 2014, p.2). Asset management “involves the balancing of costs, opportunities and
risks against the desired performance of assets, to achieve the organizational objectives” (International
Organization for Standardization, 2014, p.14). The ISO 55000:2014 serves as prime input for “what to
do” in asset management, however it provides no guidance in “how to do” so. This lack of guidance is
recognized by several authors (Ruitenburg (2017), Haarman & Delahay (2016)). Another definition
provided by Campbell, Jardine, & McGlynn states: “Asset Management Excellence is the balance of
performance, risk and costs to achieve an optimal solution” (Campbell et al., 2016, p.1). Similar to the
ISO standard on asset management, Campbell also identifies the balance between performance, risk
and costs as main drivers, but adds that by balancing this out an optimal solution can be found.
Pudney (2010) provides a definition of asset management that combines all of the named
characteristics into one statement by expressing:
9 Triple bottom line looks at social, environmental and financial aspects

Master’s thesis Project
Page | 23
“Asset Management is an organization’s coordinated multidisciplinary practice that applies
human, equipment and financial resources to physical assets over their whole life cycle to
achieve defined asset performance and cost objectives at acceptable levels of risk whilst taking
account of the relevant governance, geo-political, economic, social, demographic and
technological regimes” (Pudney, 2010, p.8)
What can be concluded from those definitions is that asset management is the multidisciplinary function
to manage the physical assets of an organization over their complete life cycles and aligned to the
corporate objectives in order to generate value for the relevant stakeholders. The asset management
elements to balance between are:
• Performance,
• Risks, and
• Costs.
Ruitenburg (2017) names this definition Asset Life Cycle Management, because it implies the
management of assets over their entire life cycles. This definition will also be used in the further course
of this thesis when referring to Asset (Life Cycle) Management. Finally, when designing an asset
decision-making tool, the goal is to define a model that incorporates the characteristics of ALCM listed
above.
4.2 Delphi-study on maintenance innovation priorities The World Class Maintenance network in the Netherlands published an overview of the most important
innovations in the field of maintenance in 2016 (Akkermans et al., 2016). In order to identify these
innovations, they conducted a Delphi-study with fifty participants from Dutch academia and industry to
evaluate the most important innovations in maintenance up to 2020. One striking result of this study is
that maintenance experts view process-oriented innovations as more important than technology-
oriented, contrary to what is popularly discussed in the press. Asset portfolio management also belongs
to those process-oriented innovations in maintenance, ranked at the 10th most important maintenance
innovation in the coming years. Akkermans et al. define asset portfolio management as “developing a
comprehensive overview of the current and anticipated costs and performance of all technical assets.”
(2016, p.4). This idea of asset portfolio management is closely connected to ALCM, where an optimal
balance between costs, risks and performance of physical assets has to be found. To a greater extent,
the developed model for PPG should aid in optimizing PPG’s asset portfolio. Their asset portfolio is the
result of a number of recent mergers and acquisitions, with factories scattered all over Europe, which
are all different with respect to process, equipment condition and manufactured product portfolio.
A comprehensive overview of costs, risks and performance of those assets, under the influence of
internal and external developments, will help optimizing the portfolio and making better decisions on
the assets, i.e. by reducing the footprint or investing only in critical plants.
In this context, another process-oriented innovation that was identified in the study was found to have
an influence on ALCM, namely life cycle costing (LCC). Life cycle costing “calculates the costs of
acquisition, operation, maintenance and decommissioning of technical assets across the entire
Master’s thesis Project
Page | 24
lifecycle” (Akkermans et al., 2016, p.4) and thus covers the lifecycle aspect of ALCM.
Knowledge management is seen as a substantial condition for a more rapid progress of asset portfolio
management and life cycle costing (Akkermans et al., 2016). As indicated by Ruitenburg (2017)
quantitative information is often lacking in calculating the end of lifetime of physical assets, though
qualitative information can be gathered by experts from multidisciplinary areas concerning the asset.
By sharing this knowledge from multidisciplinary experts, asset portfolio management can be conducted
in a more structured and effective way.
All of this shows there is a striking need for implementing ALCM practices in the maintenance
organization of firms. Also, for PPG ALCM could offer an interesting opportunity to identify, structure
and present the asset lifetime impacts to make better decisions on assets. Especially PPG could benefit
from making more effective (investment) decisions by considering internal and external developments,
as its current asset portfolio shows little standardization. Such a situation calls for applying ALCM
practices to the current asset management and maintenance organization.
4.3 Definitions
4.3.1 Asset
In all the definitions found in the literature of asset management, the asset is at the core. Therefore, it
is important to have the same understanding of the word ‘asset’. In this thesis an asset is defined as
having the following characteristics:
• it is composed of a physical structure,
• it provides an important function to the organization in question,
• it represents considerable value to its stakeholders, and
• it has a long lifetime (over 10 years) (Pudney, 2010).
Moreover, as stated before, the asset can only achieve optimal performance by applying human,
equipment and financial resources (Pudney, 2010). Hence, investing in equipment or human capital
can impact the performance, suggesting both must be included in an asset decision-making tool. As an
example, for PPG assets are paint factories and warehouses. Optimal performance of these assets can
only be achieved by applying labor, like operators and maintenance personnel, and equipment, like
dispersers or filling lines, to the asset. Focusing on personnel will therefore be needed, as processes
at PPG are still heavily labor-dependent compared to other production industries. Thus, prioritizing on
organizational asset risks and opportunities will be important for the tool. It was decided to use a holistic
approach, not focusing on equipment or work station level, but on the factory level. The reasons to do
so are the following.
1. Multidisciplinary nature of problems regarding the asset: The problems in the factory are often
being of organizational nature rather than technical solvable. There is a strong silo mentality
between different departments, and different departments are demanding different functions
from the asset, indicating that by focusing on only one aspect or equipment type no optimization
can be performed.
a. Problems are not necessarily technical: The report on deferred maintenance,
conducted by Ramtahalsing (2017) uncovers the technical deterioration of the

Master’s thesis Project
Page | 25
Amsterdam factory very detailed. As a result one could have focused e.g. only on the
filling- and packaging lines. However, it was assessed that the deferred maintenance
of the plant is not causing any gradual problems in the first place, because of the
underutilization in the plant. This indicates that another approach to identify the
performance of the asset is necessary, not focusing only on technical issues.
b. The labor intensive production process: To rely on labor in production indicated that by
improving only the equipment it cannot be ensured that an overall improvement can be
realized.
c. Interdisciplinary functions of the asset: Different departments are demanding different
functions from the asset, and the performance should be optimized going forward. For
example, the commercial departments want to establish small batch sizes serving the
varying market demands, whereas production wants to increase batch size to decrease
costs and the financial department wants to decrease working capital, which will put
another challenge on the asset. The asset should be defined so it accounts for all this.
2. No vision or strategic objectives are established for the plant: It was aimed to establish a tool
that that measures the asset performance by aligning to predefined objectives. Since so far no
objectives for the short- and long-term are established, first a tool is needed that helps to identify
strategic objectives, and then it can be analyzed how these goals can be reached. This implied
that a top-down approach was needed in order to set the right priorities, before going in to much
detail.
3. Adaptation of tool to other plants: Management demanded a tool that can also help to optimize
the performance of the other 16 factories, without much adoption. Since the factories are hardly
standardized, a tool that is too focused cannot easily be adopted to other settings/assets.
4.3.2 Lifetime impacts
In asset management, it is relevant to identify risks and opportunities that might affect the asset during
the lifetime, in order to make more effective decisions. Ruitenburg (2017) defines these risks and
opportunities as lifetime impacts. He determines lifetime impacts as “probable (technical and non-
technical) events or trends that may have a positive or negative influence on the value creation through
the use of the asset in the intermediate or long term” (Ruitenburg, 2017). Hence, by identifying those
lifetime impacts, the value creation of the asset can be guided. The idea of identifying lifetime impacts
in order to make more relevant decisions will also be applied in this master’s thesis. Those lifetime
impacts can be investment opportunities, but also improvements on the organization. By knowing what
the asset performance could affect in the future, solutions can be generated that either mitigate the risk
of a negative lifetime impact, or exploit the opportunity of a positive lifetime impact, so that it can be
used to its full benefit. Lifetime impacts are means to identify what the asset is exposed to in the internal
and external environment and ultimately make better decisions on the asset.

Master’s thesis Project
Page | 26
4.4 Summary Chapter 4 provides academic background information about why asset management, and in particular
asset portfolio management, is an increasingly important topic in literature and industry alike. It indicates
the reasons why it is important for PPG to invest in asset portfolio management with a view to making
more effective decisions regarding the assets going forward. Moreover, the chapter outlines relevant
definitions for this master’s thesis project.

Master’s thesis Project
Page | 27
5 PROBLEM ANALYSIS
This chapter covers the first step of the design science cycle, namely the problem analysis.
This indicates that the design science cycle starts here by employing the design science methodology,
as can be seen in the circle of the Figure 5.
Figure 5 Design science, step 1.
The problem analysis at PPG clarifies the identified problems, from studying company documents and
by interviewing key stakeholders. Within this context, also the first three research questions are
answered. In the end of this chapter a summary of all identified challenges is presented.
Section 5.1 sketches a stakeholder analysis of the asset decision-making process, followed by outlining
the current processes and support tools for asset (investment) decisions at PPG in section 5.2.
Next, this chapter depicts the current problems with regard to making innovative asset decisions at PPG
in section 5.3. This chapter closes with a summary of all identified challenges in section 5.4.
5.1 Stakeholder analysis for asset decision-making process This section answers the first research question. A stakeholder analysis has been performed at PPG in
order to identify the employees directly or indirectly affected by an asset decision-making tool. In this
way it can be ensured that the model targets the right stakeholders and identifies the problems relevant
for those stakeholders in the asset decision-making process.
5.1.1 Identification of interviewees (key stakeholders)
The key stakeholders were identified with the help of the PPG’s SBU Maintenance & Engineering
manager. The definition of stakeholders used here is “a person who has an interest in, or influence on
the project” (Symbol Business Improvement, 2014, p.2). A stakeholder analysis is conducted in order
to identify these persons with interest and influence. The first steps to perform in a stakeholder analysis
are the following (Symbol Business Improvement, 2014):
1. Map the project environment (make a list of stakeholders).
2. Determine influence and interest.
3. Apply Salience Model (Agle, Mitchell, & Sonnenfeld, 1999).
A list of stakeholders including roles, responsibilities and in which project stage they are involved is
shown in Table 3. The responsibilities and project stages in which the stakeholder is involved within the
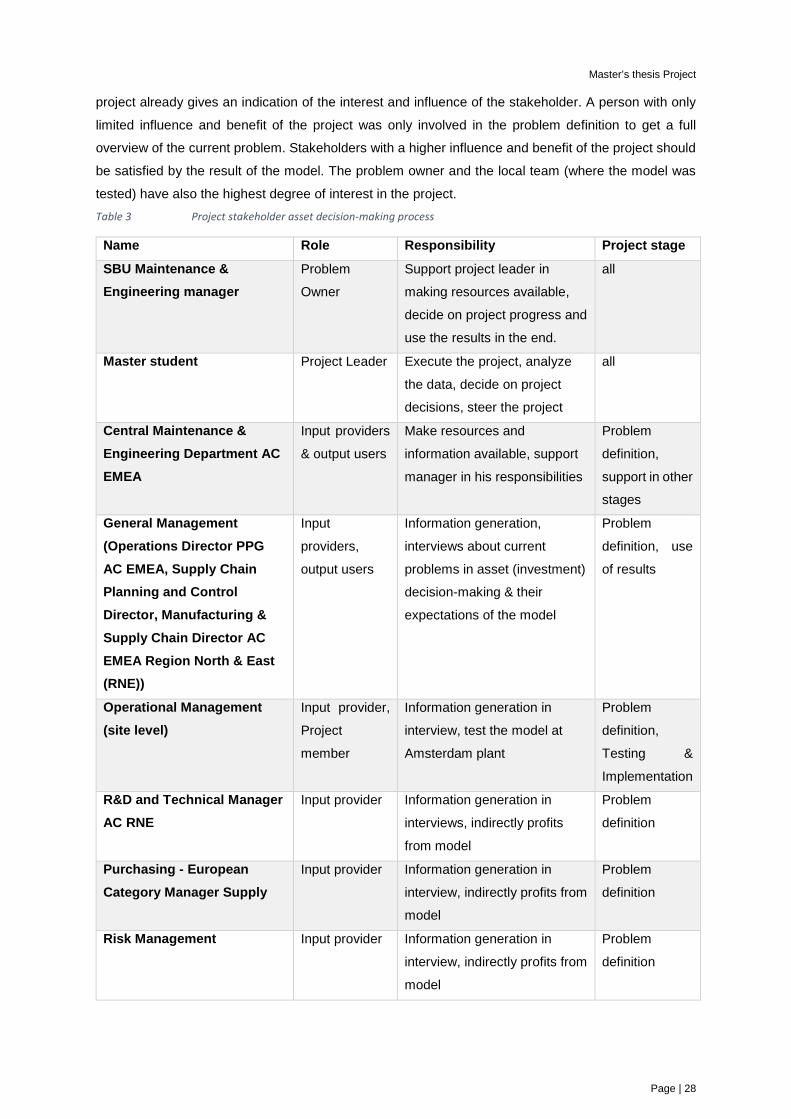
Master’s thesis Project
Page | 28
project already gives an indication of the interest and influence of the stakeholder. A person with only
limited influence and benefit of the project was only involved in the problem definition to get a full
overview of the current problem. Stakeholders with a higher influence and benefit of the project should
be satisfied by the result of the model. The problem owner and the local team (where the model was
tested) have also the highest degree of interest in the project. Table 3 Project stakeholder asset decision-making process
Name Role Responsibility Project stage SBU Maintenance & Engineering manager
Problem
Owner
Support project leader in
making resources available,
decide on project progress and
use the results in the end.
all
Master student Project Leader Execute the project, analyze
the data, decide on project
decisions, steer the project
all
Central Maintenance & Engineering Department AC EMEA
Input providers
& output users
Make resources and
information available, support
manager in his responsibilities
Problem
definition,
support in other
stages
General Management (Operations Director PPG AC EMEA, Supply Chain Planning and Control Director, Manufacturing & Supply Chain Director AC EMEA Region North & East (RNE))
Input
providers,
output users
Information generation,
interviews about current
problems in asset (investment)
decision-making & their
expectations of the model
Problem
definition, use
of results
Operational Management (site level)
Input provider,
Project
member
Information generation in
interview, test the model at
Amsterdam plant
Problem
definition,
Testing &
Implementation
R&D and Technical Manager AC RNE
Input provider Information generation in
interviews, indirectly profits
from model
Problem
definition
Purchasing - European Category Manager Supply
Input provider Information generation in
interview, indirectly profits from
model
Problem
definition
Risk Management Input provider Information generation in
interview, indirectly profits from
model
Problem
definition

Master’s thesis Project
Page | 29
Name Role Responsibility Project stage European Supply Chain Manager
Input provider Information generation in
interview, indirectly profits from
model
Problem
definition
Packaging Director AC EMEA
Input provider Information generation in
interview, indirectly profits from
model
Problem
definition
EHS Manager AC EMEA the Netherlands (NL)
Input provider,
project
member
Information generation in
interview (no access to EHS
AC EMEA level), test model at
Amsterdam plant
Problem
definition,
Testing &
Implementation
Maintenance & Engineering Manager Amsterdam
Project
member
Test the model at Amsterdam
plant
Testing &
Implementation
Business Analysist AC EMEA NL
Project
member
Test the model at Amsterdam
plant
Testing &
Implementation
HR Business Partner Supply NL
Project
member
Test the model at Amsterdam
plant
Testing &
Implementation
Manager Operations Trade NL
Project
member
Test the model at Amsterdam
plant
Testing &
Implementation
The aim was to have a well distributed number of stakeholders representing on the one hand general
management, who assess the quality of the proposals and allocate the budget, and on the other hand
operational management, involved in handing in project proposals. A second aim in determining the
right stakeholders was to have a sufficient number of different, multidisciplinary perspectives. This was
realized by conducting interviews with technical marketing, purchasing, risk management, supply-chain
management, maintenance & engineering, EHS (Environment, Health & Safety) management and
packaging management. All except one stakeholder were internal stakeholders. The external
stakeholder interviewed is a consultant who has worked with PPG for several years, ensuring that he
knows the organization very well.
As discussed before, a differentiation was made between general management, who evaluate asset
projects, and employees working on a regional level, who determine what is needed in the factories,
and who define proposals for new projects. Also employees who are not directly involved with the assets
could give helpful input in the interviews. At a later stage, the developed model was tested at PPG’s
Amsterdam plant with the local team. That is why those employees are also referred to as project
members in the stakeholder list.
After determining their interest and influence, the stakeholders were classified according to the salience
model by Agle, Mitchell, & Sonnenfeld (1999). This model classifies stakeholders according to power,
legitimacy and urgency in the project. Resulting from this classification a strategy how to manage these
stakeholders within the project can be drawn. Stakeholder power is determined by assessing how much

Master’s thesis Project
Page | 30
influence the stakeholder has on the project. Legitimacy indicates the genuineness of involvement, so
high legitimacy means stakeholder have a legitimate interest in the project. Urgency is determined by
the degree to which stakeholder requirements call for immediate attention in the project. Sometimes
stakeholders have two or even all three of these characteristics, which has to be accounted for when
managing the stakeholders in the project. A division of stakeholders to the categories is depicted in
Figure 6.
Figure 6 Salient model of the asset decision-making process at PPG.
Roughly it is divided as follows. The stakeholders for whom the urgency is highest will be interviewed
to identify the problem. They will have specific requirements for the project, which call for attention.
General management has the power to influence other stakeholders or project members, so they will
have to be managed and satisfied more intensively too. The central Maintenance & Engineering team
has a legitimate interest in the success of the project, because they would like to use the model also
for other plants. The local site team, including operational management, both have an urgency and
legitimacy in the project. If successful they can use the results of the project to their advantage to initiate
new asset projects, but they also have their own requirements to be incorporated in the tool. In order to
deal with these stakeholders, the tool will be tested with the local team and feedback from team
members will be incorporated in the model. Finally, the SBU Maintenance & Engineering manager is a
core stakeholder. Being the problem owner, he has the power, legitimacy and urgency in the project.
Special attention is paid to him by managing him closely and provide him with updates and decisions
regarding the project on a regular basis.
5.2 Current processes & support tools for asset investment decision-making The second research question is answered in this section. Currently PPG does not employ any
supporting tools that aid the project teams in handing in well-supported project proposals. That is why
there is a need to develop a tool, which identifies the most valuable opportunities for the organization.
At the moment, when project teams in the factory are handing in new investment project proposals, the

Master’s thesis Project
Page | 31
ACT process comes into play. This is explained in more detail in the confidential appendix. The
information to submit with the proposal are:
• Statement of purpose,
• Investment budget for acquiring equipment,
• Cost savings due to new equipment,
• (3 year) pay-back period, and
• EHS statement.
Thus, the focus of a new project is either on realizing cost savings by having a short pay-back period,
or on other benefits, which the project team has to convincingly present to general management.
This means the current supporting processes for asset investments are not covering all needs and
benefits in a comprehensive way. For example, the process does not provide sufficient guidance to
project teams regarding what might be important for the future. Neither does it provide a process to
assess ‘do-nothing’ risks, nor a process to identify future opportunities for the factory. In short, it is left
to the discretion of local project teams to determine what they need in order to stay competitive and
hand in corresponding proposals. Or, in the words of the SBU Operations Director: “It is your ship.
You need to sail it.” So, facilitated by the matrix structure of the company, the factories enjoy relative
freedom in designing their production as long as they work towards the company’s strategic objectives.
The AC EMEA SBU has a central Maintenance & Engineering vision, which can help the local project
teams to work towards the “right” direction and to support their claims for new project proposals.
In summary, there is no strict process or tool to identify risks and opportunities in the current production
processes, and to translate these to possible asset investments. A tool which identifies the risks that
the asset is exposed to, and lists the opportunities that can improve the performance of the asset, and
prioritizes those according to their overall importance for, is not yet available either. Such a tool could
help to improve the competitive position of the factory. Moreover, it could support the local teams to
make a valuable contribution to the organization, by communicating which areas of the factory need
improvement and how they will act upon them.
5.3 Problems with regard to making innovative asset decisions This section gives answer to the third research question. After the identification of the stakeholders and
the discussion of the current practices, the next challenge was to identify the problems stakeholders
are seeing in the current process regarding asset decisions. Therefore, interviews with key stakeholders
were prepared based on findings from literature and company documents.
5.3.1 Interviews with key stakeholders
The semi-structured interviews with 13 different key stakeholders were conducted over a period of two
months. For preparation, every interviewee received an introduction to the assignment, a short
presentation on asset management and the interview guideline with the invitation for the interview.
In that way it was guaranteed that when the interview took place, all respondents had the same chance
to prepare and knew what to expect. It also helped to use the limited time during the interviews in an
efficient way. Each interview was scheduled for approximately one hour, so that enough time for
explanations was given. Most of the interviews were conducted face-to-face and 4 out of 13 were

Master’s thesis Project
Page | 32
conducted via telephone/Skype. The meetings were recorded, and notes were taken, in order to capture
all relevant information. After that, the information was analyzed and consolidated for comparison.
The conducted interviews were semi-structured, which gave some freedom to the interviewees in their
answers. Moreover, it allowed for checking the reasoning behind the answers. In doing so, the whole
scope of the problem could be managed, considering the multidisciplinary views and different levels of
engagement with assets in the factory teams.
5.3.2 Interviews to the problem exploration
In all interviews, a short introduction of the interviewee was requested (function, job responsibilities and
knowledge/involvement with the assets). This validated the difference between people who are actively
involved in asset decisions, and those who will only have an indirect benefit from the model. During the
interviews, a problem exploration step was conducted to identify the current obstacles in the asset
decision-making process. Since not everyone is equally well acquainted with the process, the
knowledge regarding the decision-making process of the interviewees was evaluated. That helped to
determine the value of the interviewee for identifying obstacles in the current process. In a next step, it
was assessed what can be improved in the current process. This enabled the interviewees to say
whatever they perceive as not covered or not considered in the process, without already giving
directions. After that, some obstacles which had been identified earlier were presented (mainly based
on literature study, i.e. problems of ALCM that are addressed by the LIIA) and the interviewee was
asked to take position vis-a-vis these obstacles. This was important in order to check their reasoning,
no matter if they would agree or not, and to better understand the problem. After presenting the
obstacles, the list was double-checked with the interviewee to make sure no omissions were made.
This made sure that all the relevant information was captured. The interview guide for the problem
exploration can be found in appendix (A.6 Semi-structured interview to identify the problem).
5.3.3 Findings of the interviews
Cannot be displayed because of confidentiality of the results.
5.4 Summary of challenges In the following section, the challenges identified in the interviews and during studying company
documents (paragraph 2.6) are summarized. Some challenges were mentioned by several
respondents, so that double ones were filtered out and similar challenges were grouped together.
Some other obstacles were not considered in the list below, because they were considered as out of
the scope of ALCM and the designed model. For example, the mature market situation of the paint and
coatings industry in Europe cannot be influenced by the created model, but is still valuable information
that should be used as an input variable. The resulting list of challenges in the process at PPG are:
1. The technical condition of the assets in the factory is deteriorating, demanding more
effective decision-making for maintenance management and for new and replacement
investments alike. This challenge was supported and complemented in the interviews by
interviewees mentioning that there is currently no approach to identify factory life cycle costs to
make better decisions on the asset.
Master’s thesis Project
Page | 33
2. The company has a strong silo mentality, where information is dispersed over several
departments, but the communication is missing and the visibility is not at the right place and
time in the organization, demanding a multidisciplinary approach. Also, there is no centralized
asset management function. The SBU Maintenance & Engineering manager recognizes the
need for an asset management approach and works towards the goal to establish a shared
asset management view, for more details see section 2.2 and the confidential appendix. But
there is no person focusing only on implementing an asset management approach in the
organization or someone acting as asset manager on a factory level. An asset management
function could help in collecting all relevant information from different departments to make
better decisions on the asset’s future.
3. There is a recognized need to invest in digitalization opportunities in the supply chain.
In order to stay competitive PPG should invest in new technology in the long-run. However, so
far, the operational organization is not equipped for this. Reasons for that are the short-term
focus of the organization and the weak business cases (focusing mainly on one-to-one
replacements of machines) presented by local management to date.
4. Different parts of the organization are demanding different functions from the asset, requiring more flexibility. This is even part of the corporate objectives, where a reduction of
working capital, operational excellence as well as increased focus on product innovation
(variation) are demanded. It was identified by studying company documents. 5. The availability of well-skilled and trained human resources is becoming increasingly
limited. That means maintenance staff has only limited time to focus on decisions regarding
the assets indicating that decisions on the asset should become as effective as possible.
6. There is a discrepancy between the perception and interest of general management and the local site team regarding asset project focus. This challenge was supported in the
interviews by employees on the operational level mentioning a missing discussion for the plant
in terms of footprint and vision elements. General management complained about weak
business cases and demanded a more objective decision-making process.
Overall challenge: PPG has to keep their partly outdated physical asset base legally compliant, fit-for-
purpose and cost-effective in a rapidly changing business and technological environment.
As already said the challenges are matched with the challenges of the pre-research (section 2.6) and
extended with the additional findings from the interviews. Partly, the identified challenges from the pre-
research are re-arranged to match better with the criteria that will address the challenges, as described
in section 7.1. A visualization of the combined challenges from the pre-research and from the more
detailed evidence of the interviews can be seen in Figure 7. The blue rectangles show the challenges
identified during the desk research (studying company documents), the yellow rectangles depict the
challenges encountered during the interviews and the green rectangles make the challenges identified
in both approaches visible. This figure also supports the strengths of the identified challenges.
By discussing challenges in both the pre-research and the interviews they become more important to

Master’s thesis Project
Page | 34
the solution design. Next to that, it confirms that both, the pre-research and the interviews, work towards
the same goal – that is identifying challenges of the asset decision-making process.
Figure 7 Combined problems from pre-research and interviews.

Master’s thesis Project
Page | 35
6 SPECIFIC LITERATURE REVIEW FOR THE SUPPORT TOOL
In Chapter 6 literature which can guide the design of the support tool is reviewed. The reviewed literature
consists of the lifetime impact identification analysis in section 6.1. It thereby builds the foundation on
which the 5th research question can be answered. Followed by outlining literature to company specific
performance criteria, i.e. the balanced scorecard, in section 6.2. Furthermore, literature on multi-criteria
decision analysis is regarded as essential for the tool, hence its inclusion in section 6.3. Sections 6.2
and 6.3 provide a foundation for answering research question 6. Chapter 6 ends with a summary of the
literature findings relevant for the support tool, in section 6.4.
6.1 Lifetime impact identification analysis Ruitenburg, Braaksma, & van Dongen (2014) designed the Lifetime Impact Identification Analysis
(LIIA), which is based on the requirements of the asset management definition by Pudney (2010). It has
a similar function as asset portfolio management proposed by Haarman & Delahay (2016), and attempts
to assist in finding the remaining useful lifetime of the asset (population) by monitoring changes in the
context of the asset. The LIIA identifies so-called lifetime impacts, by bringing together experts from
different TECCO- perspectives (technical, economic, compliance, commercial and organizational) in an
expert session. An example of a positive lifetime impact for PPG could be the use of inline dispersion
in the plant. This will reduce spills, increase the safety of operators and reduce the cycle times.
An example of a negative lifetime impact for PPG could be the risk of operators not being able to operate
high tech machines. This could lead to unnecessary stops and failures resulting in more work for the
maintenance department and working over hours.
The focus is on changes that do not only happen in the immediate future, but also on longer-term
changes the asset might be exposed to. The risks and opportunities identified during the expert
sessions allow the asset owner to prioritize the urgency of these lifetime impacts. Ultimately, solution
strategies can be assigned to the high priority lifetime impacts, so that more effective investment and
organizational decisions can be made.
6.2 Company specific performance criteria
6.2.1 Risk management
One of the main criteria in asset management that has to be accounted for is risk. Hence, risk and
uncertainties are crucial elements that should be part of an asset decision-making tool. The Royal
Society defines risk as ‘‘the probability that a particular adverse event occurs during a stated period of
time, or results from a particular challenge” (The Royal Society, 1992). Similarly, Mitchell defines risk
as “the probability of loss and the significance of that loss to the organization or individual’’ (Mitchell,
1995). He assesses risk with the help of a formula:
𝑅𝑅𝑅𝑅𝑅𝑅𝑅𝑅𝑛𝑛 = 𝑃𝑃(𝑙𝑙𝑙𝑙𝑅𝑅𝑅𝑅𝑛𝑛) ∗ 𝑙𝑙(𝑙𝑙𝑙𝑙𝑅𝑅𝑅𝑅𝑛𝑛),𝑤𝑤𝑅𝑅𝑤𝑤ℎ

Master’s thesis Project
Page | 36
• P = probability of loss
• l = significance of loss This formula of probability x significance (also often called frequency x severity, or likelihood x impact)
is also applied in risk matrices to set priorities (Cox, 2008). Cox mentions that those risk matrices have
to be used with caution, because they can easily draw misleading conclusions. He found that
introducing a third criterion, a budget constraint, supports good decision-making and generates more
reliable outcomes. Brenchley (2000) categorizes risks into six different categories, namely: financial
loss, performance loss, physical loss, psychological loss, time loss, and social loss.
In asset management especially financial and performance losses have to be taken into consideration,
but time losses may have an impact on asset-related decisions too. Also Catrinu & Nordgård (2011),
who introduced a decision support framework for maintenance and re-investment strategies, use simple
risk analysis techniques and MCDA under uncertainty. Ruitenburg (2017) puts a strong focus on risk
mitigation by prioritizing the lifetime impacts based on their likelihood (probability) and impact
(significance). The criteria likelihood and impact are discussed by several authors to classify risk, as
can be seen at the beginning of this paragraph. That is why it is proposed to validate this result in the
interviews. As Ruitenburg (2017, p.175) indicates that the impact “should be measured in a multifaceted
way”, further research was conducted in order to find those (sub-level) criteria. PPG does not have a
standardized procedure in place, so that a literature review helped in identifying possible (sub-level)
criteria for the effect on the business.
Since the decision-making tool has to be able to translate the lifetime impacts to business value,
literature on innovation management and strategy will also be reviewed. In order to choose the lifetime
impact with the highest priority, it is important to consider the balance between performance, costs and
risks as mentioned in the ALCM definition. The focus of this paragraph is on identifying possible
performance objectives against which the lifetime impacts can be measured. The balanced scorecard
is introduced since it is a management tool, which can help to get to business performance objectives.
Operations performance objectives are discussed in the appendix (A.2 Operations performance
objectives) as they add to the final definition, but will not directly be used for the decision-making tool.
6.2.2 Balanced scorecard A commonly used approach to translate the identified lifetime impacts into business objectives makes
use of the balanced scorecard (BSC) (Kaplan & Norton, 1996). It assesses the performance of internal
functions in the organization and their external results. The BSC focusses on four pillars – learning and
growth, business processes, customer satisfaction and financial performance. As mentioned by Kaplan
& Norton (1996) the balanced scorecard can be extended by another pillar depending on the
organizational needs. Several authors discuss extensions of the balanced scorecard, i.e. the
maintenance balanced scorecard (Alsyouf, 2006), the sustainability balanced scorecard (Kalender &
Vayvay, 2016), and many more.
Alsyouf's (2006) goal was to develop a framework that assesses the contribution of support functions
to the strategic business objectives. Thus, the rather technical focus of maintenance activities can be

Master’s thesis Project
Page | 37
communicated better to top management, so that they understand it. The main disadvantages of the
maintenance balanced scorecard are that it mainly focusses on top-down performance measures, and
that it concentrates on a customer perspective, thereby missing a partner or supplier relation focus.
Regarding the needs of PPG to prioritize lifetime impacts, the maintenance balanced scorecard still has
a too strong focus on maintenance, whereas lifetime impacts focus on the future of the whole asset
(factory).
The sustainability balanced scorecard by Kalender & Vayvay (2016) incorporates a broader view and
can more easily be adapted to the needs of PPG. Its fifth pillar corresponds to the EHS-compliance
perspective from the LIIA, which is an element of risk that should not be underestimated. Within PPG’s
strategic elements (PPG Industries, 2018) sustainability is a main factor as well, which cannot be
covered by any of the other four pillars. In the document on the “strategic elements – big 5” it reads:
“Sustainability & Compliance: Increase focus on corporate citizenship. Act with ethics and integrity.”
This indicates the need to include the fifth pillar in the model designed for PPG.
In summary, applied to the factory level, the five pillars are the following:
1. Financial perspective: please the shareholder (improve profitability, reduce operating costs,
increase return on investment (ROI), increase production).
2. Customer perspective: satisfy customer needs in price, quality and product availability
(reliability of service, value advantage, and frequent launch of new products).
3. Sustainability perspective: answer and comply to safety, health and environment requirements
(equipment used reduces impact on the state of natural resources, higher company’s
environmental efficiency, energy consumption, waste reduction (air emission, waste water),
product durability (lifecycle approach), employee health & safety standards).
4. Internal processes perspective: satisfy and possibly exceed the needs and expectations of
customer efficiency and effectiveness – overall equipment effectiveness (OEE) & cost
effectiveness (quality, speed, (delivery) reliability, flexibility and responsiveness).
5. Innovation, learning & growth perspective: the organizational capability. The degree of
cooperation and communication with the original equipment manufacturer (OEM) or supplier,
degree of cooperation with research center and universities, qualification of labor force, level of
training and human resource development, level of new investments in factory.
The five perspectives impact each other and cannot be regarded as exhaustive. Nevertheless, they
provide a good representation of elements that the identified lifetime impacts can have an impact on.
Therefore, the BSC is a valuable approach to prioritize lifetime impacts.
6.3 Prioritization of lifetime impacts
6.3.1 Multi-Criteria Decision Analysis
In order to be able to prioritize the identified asset risks and opportunities, a multi criteria decision-
making tool has to be constructed. MCDA is applied in order to systematically rank alternatives (lifetime
impacts) with regard to a number of criteria (performance objectives) to identify a preferred option
(Niekamp, Bharadwaj, Sadhukhan, & Chryssanthopoulos, 2015). The field of MCDA has grown
significantly in recent years as part of operations research. In their literature review on multi criteria

Master’s thesis Project
Page | 38
decision-making techniques, Mardani et al. (2015) confirm that the number of publications in the field
has increased substantially since 2006. MCDA aids decision-makers in making more objective
decisions on subjective performance criteria (Zavadskas, Turskis, & Kildienė, 2014). However, it is
widely accepted that there is no optimal solution to a multi criteria decision problem (Niekamp et al.,
2015). There exists a wide number of different MCDA tools and techniques, employed in various
industries like operations research, supply chain and production management and project-, safety- and
risk management (Mardani et al., 2015). In asset management MCDA techniques have been used too.
For example, Niekamp et al. (2015) used a multi criteria decision support framework for sustainable
management of industrial assets with multiple (conflicting) objectives.; Ojanen, Hatinen, Kaerri, Kaessi,
& Tuominen (2012) used decision support methods in a collaborative multidisciplinary project to study
success factors and risks in developing value-based industrial services in maintenance management.
Likewise, R. Ruitenburg (2017) uses MCDA in prioritizing the identified lifetime impacts. Catrinu &
Nordgård (2011) incorporate company objectives and risk analysis in MCDA framework to help decide
how to best manage physical assets. This provides enough evidence that the MCDA methodology can
also be applied in this master’s thesis to prioritize the lifetime impacts identified. In the appendix more
detailed information to MCDA, criteria and weighing is given (A.3 Multi criteria decision analysis).
As mentioned earlier, recent literature discusses a wide range of different MCDA tools and techniques.
The discussed methods in this master’s thesis are listed below:
• Lifetime Impact Centered Asset Management (LICAM),
• Analytical Hierarchy Process (AHP),
• Multi-Attribute Utility Theory (MAUT) (or Multi-Attribute Value Theory (MAVT)) will be discussed
in the appendix (A.4 Multi Attribute Utility Theory), as it was not chosen to be implemented in
the final tool.
However, many more techniques exist., MAUT and AHP especially are widely used and accepted in
literature (Mardani et al., 2015). Moreover, MAUT, AHP and LICAM are also applied by other authors
in maintenance and asset management related context (Ruitenburg et al., 2014; Niekamp et al. 2015;
Márquez, 2007). So enough evidence is provided that these methods might also be applicable to PPG.
In the following sections, more details about the methods are outlined so that a well-grounded decision,
which method to apply at PPG, can be drawn.
6.3.2 Lifetime Impact Centered Asset Management
LICAM is the method developed by Ruitenburg (2017) consisting of three steps. The first step is to
prepare the lifetime impacts resulting from the LIIA. Then the lifetime impacts are prioritized based on
established criteria. Finally, solution strategies are assigned to the most important lifetime impacts.
This master thesis only focuses on the second step, the prioritization of the identified lifetime impacts.
In this approach, the criteria likelihood, consequence and effort are used as prioritization criteria with
the following definition (Ruitenburg, 2017, p. 175-176):
• Consequence of the impact: The effect should be measured in a multifaceted way. Issues to
consider are performance, safety, and financial and environmental consequences.

Master’s thesis Project
Page | 39
• Likelihood of the lifetime impact: The probability that this lifetime impact will occur in the future/
will have an impact in the future.
• Effort: assessed in terms of resources (e.g. manpower, time, money, capacity to change,
etcetera).
Each lifetime impact score is then assessed by the three criteria to be able to prioritize. To calculate the
total score the author multiplies the consequence (effect) and likelihood of the impact, similar to risk
management, and names the combination the impact size. In order to assign solution strategies to the
lifetime impacts an effort-benefit (impact size) matrix is established, in which a certain management
approach is assigned to the lifetime impacts, depending on the score of the lifetime impacts in four
different quadrants. A visualization of those management approaches in the scoring graph can be seen
in Figure 8. This has two main advantages; first, plotting the lifetime impacts in such a graph helps to
make the most important lifetime impacts visible. Second, each quadrant describes a certain proposed
management approach to deal with the lifetime impact (Ruitenburg, 2017).
Figure 8 The four quadrants with different management approaches for lifetime impacts.
All in all, LICAM provides a good basis for prioritizing lifetime impacts. However, there are some
disadvantages. By multiplying likelihood and the effect, the method mirrors a risk management
perspective. This approach is definitely suitable for negative lifetime impacts, which are mainly risks,
but has not proved to be similarly successful for positive lifetime impacts (opportunities). With a 50%
probability risks will be classified as super high and would need to be addressed in any case.
Conversely, however, an opportunity with 50% success probability will probably only be considered
occasionally. Taking that word of warning into account, the application of the model by Ruitenburg et
al. (2014) can nevertheless be considered a success for opportunities as well. Furthermore, the applied
scale used by Ruitenburg (2017, p.176) in his application example of Liander gives a further indication
to caution. By assuming a linear scale, and by using the scoring table provided in the book (Ruitenburg,
2017, p.176, Table 7.6.1), a score in the right half of the graph can only be reached in 3 out of 25
possibilities. Thus, only extremely certain impacts with a high probability of emergence will actually be
considered. Both Niekamp et al. (2015), and Ruitenburg (2017) suggest to incorporate criteria defined
by the stakeholders, which is not possible in the model focusing on risk reduction. It also does not

Master’s thesis Project
Page | 40
provide any insights into what areas of the business the lifetime impact will have an effect on. Therefore,
a more advanced MCDA model for prioritization of lifetime impacts could prove useful. This would also
ensure that the effect on the business aligns with the company’s strategic objectives. Moreover, more
research into weighing of the criteria can help to set the right priorities. LICAM does not offer this
possibility. Within LICAM lifetime impacts can only be prioritized based on a fixed relation between
criteria, but this might not be in the best interest of the company. It can therefore not be determined if
this method would provide the best solution for PPG to prioritize lifetime impacts. Hence, more research
in MCDA has been performed to come to a better supported decision for the final choice of the applied
model at PPG.
6.3.3 Analytical Hierarchy Process
Analytical Hierarchy Process is an MCDA technique that establishes the ratio-scaled importance of
alternatives by pairwise comparison of criteria and alternatives (Wang, Jing, Zhang, & Zhao, 2009).
This technique also allows alternatives to compensate a bad score on one criterion by a good score on
another criterion. Márquez (2007) emphasizes that the AHP is based on three rather simple principles:
• Decomposition
• Pairwise comparison
• Hierarchic composition to define priorities
The exact steps to perform AHP are outlined in the appendix (A.5 AHP explanation of steps).
AHP is a widely accepted method, used most often in recent literature when establishing MCDA
frameworks in several industry areas (Mardani et al., 2015). Also in maintenance and asset
management AHP is used, for example Márquez (2007) applies AHP in a petrochemical plant to
prioritize the equipment according to their criticality. Similarly, Ojanen et al. (2012) identified and
prioritized the value-creation elements in maintenance services. Identifying lifetime impacts can be
treated similar to value-adding maintenance services in an organization. Moreover, Niekamp et al.
(2015) recommend to use AHP in further research for their framework on sustainable asset
management decisions with conflicting objectives, in order to validate the results.
As identified, several articles described application of the AHP method, also in maintenance and asset
management. This gives enough evidence that the AHP can also be applied in this master’s thesis to
prioritize the risks and opportunities affecting the asset according to the importance for the organization.
On top of that, AHP can account for future uncertainty of risks (Ojanen et al., 2012). In conclusion, the
APH method seems to fit well to the needs of the organization. It has several advantages, i.e. that it
can cope with subjective judgements and assures consistency. Moreover, it provides deeper insights
in the choice of an alternative and relies on stakeholder specific criteria. On top of that, AHP can
compensate bad scores. The main disadvantage of this method, the computational effort, can be
reduced by applying AHP only for determining the criteria weighs and not pairwise comparing all
alternatives with each other. So, for prioritizing lifetime impacts based on their importance for the factory
to support the organization, AHP is a legitimate method that can be applied.

Master’s thesis Project
Page | 41
6.4 Summary Within the support tool specific literature review, articles regarding the LIIA, company specific
performance criteria (in innovation management and operations management) and MCDA tools and
techniques were reviewed. MCDA tools like the LICAM or AHP seem to be promising methods that can
be applied to the supporting tool for prioritizing lifetime impacts at PPG. Chapter 7 outlines how all those
methods reviewed in chapter 6 will address all identified criteria for the support tool that prioritizes
lifetime impacts to guide to more effective decisions on asset investments at PPG.

Master’s thesis Project
Page | 42

Master’s thesis Project
Page | 43
7 INITIAL SOLUTIONS
The 7th chapter presents the initial solutions to the challenges identified in the problem analysis. It is the
second step of the design science methodology as can be seen in Figure 9. The second step of this
methodology is circled in black. It clarifies the goal of this chapter, to identify the initial solutions. In order
to do so it relies on the findings of the literature review of chapter 6. Moreover, it approaches the
problems defined in chapter 5 by translating them to criteria and then finding initial solutions that will
help to overcome those challenges described in section 5.4.
Figure 9 Design science, step 2.
Criteria for an asset decision support tool are defined first. Based on the literature review in chapter 6
and the identified criteria in section 7.1 a second interview with key stakeholders was conducted to
verify the aspects of the support tool. After that, CIMO-logic is used to demonstrate that the initial
solutions are addressing the challenges/ criteria correctly. This chapter also answers research
questions 4 to 6. By investigating to what extent LIIA can be applied to the situation at PPG, it becomes
clear that the model has to be extended by multi-criteria decision analysis to fulfil all specific criteria for
an asset decision support tool.
The structure of chapter 7 is as follows: section 7.1 addresses the specific criteria for an asset decision
support tool and answers research question 4. Next, section 7.2 investigates to what extent the LIIA
approaches those criteria, thereby answering research question 5. Since it was encountered that the
LIIA alone is not sufficient, section 7.3 gives answer to the 6th research question by outlining what has
to be extended to the support tool. Finally, section 7.4 gives a summary of all challenges and initial
solutions for the support tool at PPG.
7.1 Specific criteria for an asset decision support tool This section gives answer to the 4th research question. From the interviews held during the problem
exploration phase it has become clear that an asset decision support tool for PPG should fulfill several
criteria. These criteria can be derived from the identified challenges listed in section 2.6. Criteria are
measurable, they are defined as a principle by which something can be judged. In this case it will be
judged if the decision support tool indeed measures up to what it intends to achieve. Since the criteria
are derived from the challenges, six specific criteria are identified, namely the decision support tool
should:
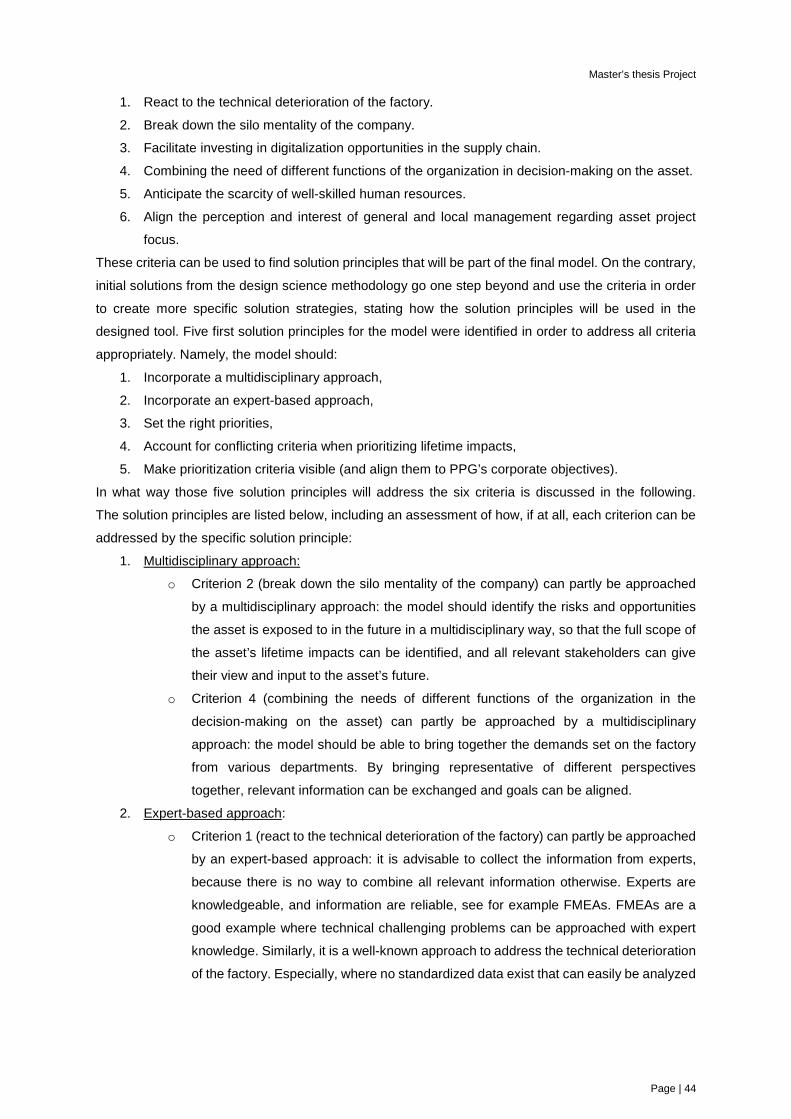
Master’s thesis Project
Page | 44
1. React to the technical deterioration of the factory.
2. Break down the silo mentality of the company.
3. Facilitate investing in digitalization opportunities in the supply chain.
4. Combining the need of different functions of the organization in decision-making on the asset.
5. Anticipate the scarcity of well-skilled human resources.
6. Align the perception and interest of general and local management regarding asset project
focus.
These criteria can be used to find solution principles that will be part of the final model. On the contrary,
initial solutions from the design science methodology go one step beyond and use the criteria in order
to create more specific solution strategies, stating how the solution principles will be used in the
designed tool. Five first solution principles for the model were identified in order to address all criteria
appropriately. Namely, the model should:
1. Incorporate a multidisciplinary approach,
2. Incorporate an expert-based approach,
3. Set the right priorities,
4. Account for conflicting criteria when prioritizing lifetime impacts,
5. Make prioritization criteria visible (and align them to PPG’s corporate objectives).
In what way those five solution principles will address the six criteria is discussed in the following.
The solution principles are listed below, including an assessment of how, if at all, each criterion can be
addressed by the specific solution principle:
1. Multidisciplinary approach:
o Criterion 2 (break down the silo mentality of the company) can partly be approached
by a multidisciplinary approach: the model should identify the risks and opportunities
the asset is exposed to in the future in a multidisciplinary way, so that the full scope of
the asset’s lifetime impacts can be identified, and all relevant stakeholders can give
their view and input to the asset’s future.
o Criterion 4 (combining the needs of different functions of the organization in the
decision-making on the asset) can partly be approached by a multidisciplinary
approach: the model should be able to bring together the demands set on the factory
from various departments. By bringing representative of different perspectives
together, relevant information can be exchanged and goals can be aligned.
2. Expert-based approach:
o Criterion 1 (react to the technical deterioration of the factory) can partly be approached
by an expert-based approach: it is advisable to collect the information from experts,
because there is no way to combine all relevant information otherwise. Experts are
knowledgeable, and information are reliable, see for example FMEAs. FMEAs are a
good example where technical challenging problems can be approached with expert
knowledge. Similarly, it is a well-known approach to address the technical deterioration
of the factory. Especially, where no standardized data exist that can easily be analyzed

Master’s thesis Project
Page | 45
quantitatively, it is advantageous to use expert knowledge. Moreover, experts can rely
on their experience, which might reveal aspects no data could have predicted.
o Criterion 2 (break down the silo mentality of the company) can partly be approached
by an expert-based approach: Since quantitative data, especially on multidisciplinary
aspects is perceived as limited, an expert-based approach is advisable. Such
multidisciplinary data sources are hardly standardized or comparable, so that no
quantitative method would be able to incorporate all information in order to make the
best possible decision.
3. Setting the right priorities:
o Criterion 1 (react to the technical deterioration of the factory) can partly be approached
by setting the right priorities: by setting the right priorities for the future the technical
deterioration of the factory can be counteracted on. When setting the right priorities
already small improvements can help to improve the overall technical condition of the
factory in order to keep it fit-for-purpose. That also encourages to break the cycle of
firefighting, since long-term solutions (for the next 1-10 years) for the factory can be
implemented.
o Criterion 3 (facilitate investing in digitalization opportunities in the supply chain) can be
approached by setting the right priorities: the model should be able to account for
opportunities and investing in more digitalization is a recognized opportunity for the
company. Here, not only the immediate future is meant, but also a longer-term view
should be considered, in order to make more effective decisions on the asset and
breaking the cycle of firefighting. The time scope of the next 1-10 years is therefore a
relevant time perspective to consider in order to set the right priorities for the factory
already today. As an asset has a life of up to several decades, it is not only important
to set the right priorities for now and at the time of disposal, but also to prepare for
changes during the operational life of the asset. Hence, setting the right priorities is an
important criterion for the model.
o Criterion 5 (anticipate the scarcity of well-skilled human resources) can be approached
by setting the right priorities: since well-skilled labor is scarce, the available resources
have to be used in the most efficient way. By setting the right priorities, those resources
are not only used for firefighting, but their knowledge will effectively be used in an
expert-session on lifetime impacts to prepare for the future.
4. Account for conflicting criteria:
o Criterion 4 (combining the needs of different functions of the organization in decision-
making on the asset) can be approached by accounting for conflicting criteria:
the model should be able to bring together the demands set on the factory by the
corporate objectives, and the needs of various departments. By accounting for
conflicting criteria, the model should be able to prioritize lifetime impacts without
dismissing some disciplines completely. So, accounting for conflicting criteria is
important in this case.

Master’s thesis Project
Page | 46
o Criterion 6 (align the perception and interest of general and local management
regarding asset project focus) can partly be approached by accounting for conflicting
criteria: since general and local management have sometimes different interests
regarding asset project focus. By accounting for conflicting criteria in the model, both
interests can be combined to a solution, which is acceptable for both groups alike.
5. Make prioritization criteria visible:
o Challenge 6 (align the perception and interest of general and local management
regarding asset project focus) can partly be approached by making the prioritization
criteria visible: by incorporating this in the model, it goes one step beyond accounting
for conflicting objectives. The model should also make the objectives of a lifetime
impact visible and align it to the corporate strategic objectives. This would ensure that
general management and employees working on a local level have the same
information regarding desired opportunities, and make the decision why a certain
project is chosen over another one more transparent. By incorporating PPG’s vision in
the visible criteria, the operational organization is assisted in developing in a direction
which PPG general management can support.
In short, Table 4 describes how each criterion of the model will be addressed by the solution principles. Table 4 Model criteria related to the identified challenges.
Criteria Solution Principles React to the technical deterioration of the factory. Expert-based approach, setting the right
priorities
Break down the silo mentality of the company. Multidisciplinary approach, expert-based
approach
Facilitate investing in digitalization opportunities
in the supply chain.
Setting the right priorities
Combining the need of different functions of the
organization in decision-making on the asset.
Multidisciplinary approach, accounting for
conflicting criteria
Anticipate the scarcity of well-skilled human
resources.
Setting the right priorities
Align the perception and interest of general and
local management regarding asset project focus.
Account for conflicting criteria, visibility of
prioritization criteria
Now that the criteria for the model have been outlined, a literature review is conducted to validate and
support the findings. LIIA will be applied to check if it can support the criteria and solution principles,
and additional literature is studied in order to design a model that addresses all identified criteria
appropriately.
7.2 Usability of the LIIA for the support tool An answer to the 5th research question is provided in this section. Regarding the solution principles of
the model, three of the five solution principles are well-covered in the LIIA, which is further supported
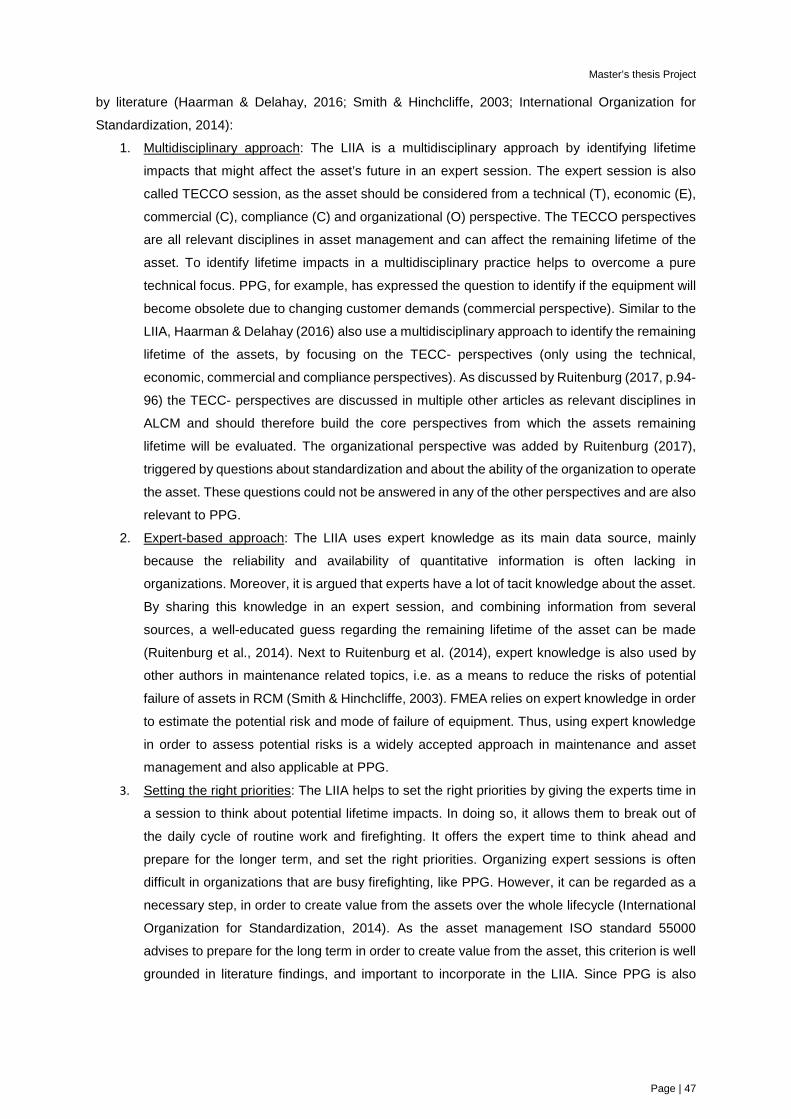
Master’s thesis Project
Page | 47
by literature (Haarman & Delahay, 2016; Smith & Hinchcliffe, 2003; International Organization for
Standardization, 2014):
1. Multidisciplinary approach: The LIIA is a multidisciplinary approach by identifying lifetime
impacts that might affect the asset’s future in an expert session. The expert session is also
called TECCO session, as the asset should be considered from a technical (T), economic (E),
commercial (C), compliance (C) and organizational (O) perspective. The TECCO perspectives
are all relevant disciplines in asset management and can affect the remaining lifetime of the
asset. To identify lifetime impacts in a multidisciplinary practice helps to overcome a pure
technical focus. PPG, for example, has expressed the question to identify if the equipment will
become obsolete due to changing customer demands (commercial perspective). Similar to the
LIIA, Haarman & Delahay (2016) also use a multidisciplinary approach to identify the remaining
lifetime of the assets, by focusing on the TECC- perspectives (only using the technical,
economic, commercial and compliance perspectives). As discussed by Ruitenburg (2017, p.94-
96) the TECC- perspectives are discussed in multiple other articles as relevant disciplines in
ALCM and should therefore build the core perspectives from which the assets remaining
lifetime will be evaluated. The organizational perspective was added by Ruitenburg (2017),
triggered by questions about standardization and about the ability of the organization to operate
the asset. These questions could not be answered in any of the other perspectives and are also
relevant to PPG.
2. Expert-based approach: The LIIA uses expert knowledge as its main data source, mainly
because the reliability and availability of quantitative information is often lacking in
organizations. Moreover, it is argued that experts have a lot of tacit knowledge about the asset.
By sharing this knowledge in an expert session, and combining information from several
sources, a well-educated guess regarding the remaining lifetime of the asset can be made
(Ruitenburg et al., 2014). Next to Ruitenburg et al. (2014), expert knowledge is also used by
other authors in maintenance related topics, i.e. as a means to reduce the risks of potential
failure of assets in RCM (Smith & Hinchcliffe, 2003). FMEA relies on expert knowledge in order
to estimate the potential risk and mode of failure of equipment. Thus, using expert knowledge
in order to assess potential risks is a widely accepted approach in maintenance and asset
management and also applicable at PPG.
3. Setting the right priorities: The LIIA helps to set the right priorities by giving the experts time in
a session to think about potential lifetime impacts. In doing so, it allows them to break out of
the daily cycle of routine work and firefighting. It offers the expert time to think ahead and
prepare for the longer term, and set the right priorities. Organizing expert sessions is often
difficult in organizations that are busy firefighting, like PPG. However, it can be regarded as a
necessary step, in order to create value from the assets over the whole lifecycle (International
Organization for Standardization, 2014). As the asset management ISO standard 55000
advises to prepare for the long term in order to create value from the asset, this criterion is well
grounded in literature findings, and important to incorporate in the LIIA. Since PPG is also

Master’s thesis Project
Page | 48
firefighting a lot this step is perceived as important to them as well to generate more value from
the asset.
Thus, the methodologies applied in the LIIA are well grounded in earlier findings in literature and also
support three of the identified solution principles for the model at PPG.
Summarizing, the LIIA is well equipped to address the first three solution principles for an asset
decision-making support tool for PPG. However, two crucial solution principles for the model remain
unaddressed by the LIIA. Those are: to be able to account for conflicting criteria when prioritizing lifetime
impacts and to make the prioritization criteria visible (paragraph 7.1). As discussed, this is elemental in
order to approach the criteria four (combining the need of different functions of the organization in
decision-making on the asset) and six (align the perception and interest of general and local
management regarding asset project focus). These are both important criteria that have to be
addressed in the model. So, the LIIA can be applied to the specific case of PPG, but it might need some
more investigation on how to prioritize lifetime impacts to identify effective asset (investment)
possibilities.
7.3 Extension of the LIIA for the support tool This section gives answer to the 6th research question. As discussed in the previous section, the LIIA
does not yet make use of all identified solution principles. Using design science, more research into
company specific prioritization criteria and MCDA was conducted in chapter 6. This section describes
how the reviewed literature can be used in a support tool. The second step of the design science cycle
is only closed when initial solutions to all solution principles have been found. Hence, this step can be
seen as small intermediate design science cycle, going back to investigating more literature until all
criteria/ solution principles of the support tool are properly addressed with initial solutions. In order to
account for the last two solution principles identified (accounting for conflicting prioritization criteria and
visibility of prioritization criteria) a second round of interviews with the same 13 stakeholders of the
asset decision-making process was performed. In the interviews, the interviewees were asked to assess
the aspects (criteria) of a future decision-making tool for assets at PPG. The purpose of the tool should
be to prioritize lifetime impacts influencing the assets performance, based on company-specific criteria.
The first question, which criteria to prioritize (effect/impact on the business, realization effort and
probability of success), is based on the criteria used by Ruitenburg (2017) (impact, likelihood and effort).
Again, it was asked in such a way that respondents had to explain their answers. By giving the
interviewees choices, and at the same time asking for reasons why they would include this choice, well-
reasoned criteria were identified. Furthermore, by giving them the opportunity to introduce their own
criteria, all important aspects of the tool were covered. New criteria identified in one interview were also
included in the next interviews to validate the importance. The interview guideline can be found in
appendix (A.7 Semi-structured interview to identify criteria for the decision-making tool).
The interview findings show that there is general agreement on the solution principle to prioritize lifetime
impacts. Overall it can be stated that the following criteria should be incorporated in a MCDA tool for
PPG:
1. Effect/Impact on the business: All interviewees agreed to prioritize lifetime impacts based on
the effect they will have on the business.

Master’s thesis Project
Page | 49
2. Likelihood: People widely agreed to this criterion. It was mentioned by a few interviewees that
this might provide interesting insights, and that it is not accounted for at the moment.
Some concerns were raised that there is no data available to measure it yet.
3. Realization effort: most interviewees agreed to integrate realization effort as a criterion in an
asset decision-making tool. Some respondents, however, disagreed to include this.
These answers came mostly from general management, as they wanted to stress that in
general it does not only matter how much is spent on an investment project, but rather how
much it will bring to the business. In this context, realization ease was identified by an
interviewee as another criterion, looking more to the time, complexity and manpower needed
for the realization of the project. This criterion was widely accepted. Generally, realization effort
was thus accepted as a criterion, with the extended focus to include manpower, time, capacity
to change, etc., next to money.
After this, interviewees were asked about potential other prioritization factors, which had not been
captured so far. Two more factors were raised in the discussion:
• Strategic fit: Strategic fit with the organization was named as another prioritization criterion.
It was decided that it can be accounted for in the effect on the business by aligning the
balanced scorecard elements to PPG’s strategic elements. This will be included in the scoring
table, so that the experts can recognize PPG’s strategic elements when scoring the lifetime
impacts.
• Business risk: Business risk was identified as another prioritization criterion. As mentioned
before, the criteria impact and likelihood are based on a risk management approach.
After scoring, the lifetime impacts can be shown in a risk matrix to set the right priorities.
This criterion is also well covered in the current criteria
It was decided to use only the three main criteria in the model, which was supported by the key
stakeholders of the asset decision-making process at PPG. Strategic fit and business risk are indirectly
accounted for in the model as described. The following definition of the main criteria is used:
1. Impact on the business: The effect/consequence of a lifetime impact, in case it becomes
reality. It is measured in a multifaceted way, see sub-criteria.
2. Likelihood: The likelihood/probability of a lifetime impact to become reality. It also indicates
the sense of urgency of when the lifetime impact has to be approached.
3. Realization effort: The effort necessary in order to address the lifetime impact appropriately,
measured in terms of resources (manpower, time, money, capacity to change).
Next, the sub-criteria were investigated. The balanced scorecard, which can be applied in accordance
with PPG’s strategic elements, was found to be a good fit to the specific needs of PPG. PPG is aiming
for a more structured decision-making process, aligned to the company’s strategic objectives. As the
need for a vision on operational level was stressed by PPG, the balanced scorecard could be used in
that process, by classifying the identified lifetime impacts according to their strategic fit, and aligning
them to the corporate strategic objectives. In doing so, a connection to the business impact of identified
lifetime impacts is made as was requested by PPG general and operational management alike.
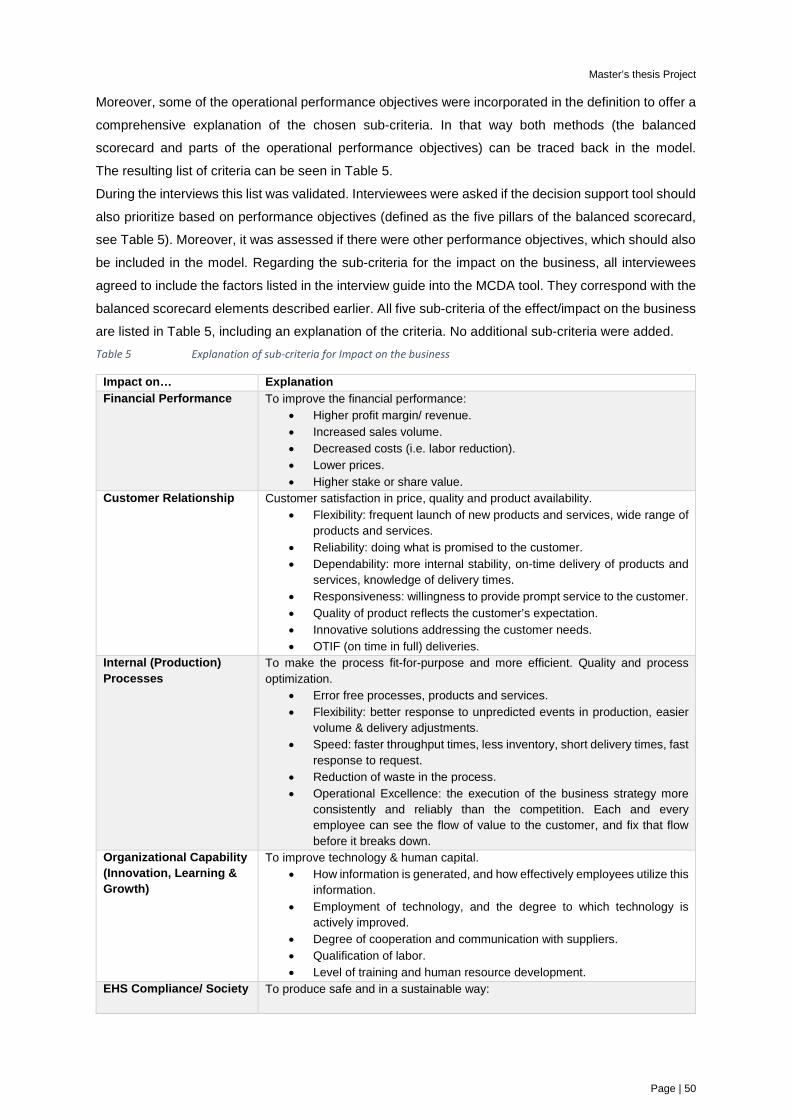
Master’s thesis Project
Page | 50
Moreover, some of the operational performance objectives were incorporated in the definition to offer a
comprehensive explanation of the chosen sub-criteria. In that way both methods (the balanced
scorecard and parts of the operational performance objectives) can be traced back in the model.
The resulting list of criteria can be seen in Table 5.
During the interviews this list was validated. Interviewees were asked if the decision support tool should
also prioritize based on performance objectives (defined as the five pillars of the balanced scorecard,
see Table 5). Moreover, it was assessed if there were other performance objectives, which should also
be included in the model. Regarding the sub-criteria for the impact on the business, all interviewees
agreed to include the factors listed in the interview guide into the MCDA tool. They correspond with the
balanced scorecard elements described earlier. All five sub-criteria of the effect/impact on the business
are listed in Table 5, including an explanation of the criteria. No additional sub-criteria were added. Table 5 Explanation of sub-criteria for Impact on the business
Impact on… Explanation Financial Performance
To improve the financial performance: • Higher profit margin/ revenue. • Increased sales volume. • Decreased costs (i.e. labor reduction). • Lower prices. • Higher stake or share value.
Customer Relationship
Customer satisfaction in price, quality and product availability. • Flexibility: frequent launch of new products and services, wide range of
products and services. • Reliability: doing what is promised to the customer. • Dependability: more internal stability, on-time delivery of products and
services, knowledge of delivery times. • Responsiveness: willingness to provide prompt service to the customer. • Quality of product reflects the customer’s expectation. • Innovative solutions addressing the customer needs. • OTIF (on time in full) deliveries.
Internal (Production) Processes
To make the process fit-for-purpose and more efficient. Quality and process optimization.
• Error free processes, products and services. • Flexibility: better response to unpredicted events in production, easier
volume & delivery adjustments. • Speed: faster throughput times, less inventory, short delivery times, fast
response to request. • Reduction of waste in the process. • Operational Excellence: the execution of the business strategy more
consistently and reliably than the competition. Each and every employee can see the flow of value to the customer, and fix that flow before it breaks down.
Organizational Capability (Innovation, Learning & Growth)
To improve technology & human capital. • How information is generated, and how effectively employees utilize this
information. • Employment of technology, and the degree to which technology is
actively improved. • Degree of cooperation and communication with suppliers. • Qualification of labor. • Level of training and human resource development.
EHS Compliance/ Society
To produce safe and in a sustainable way:
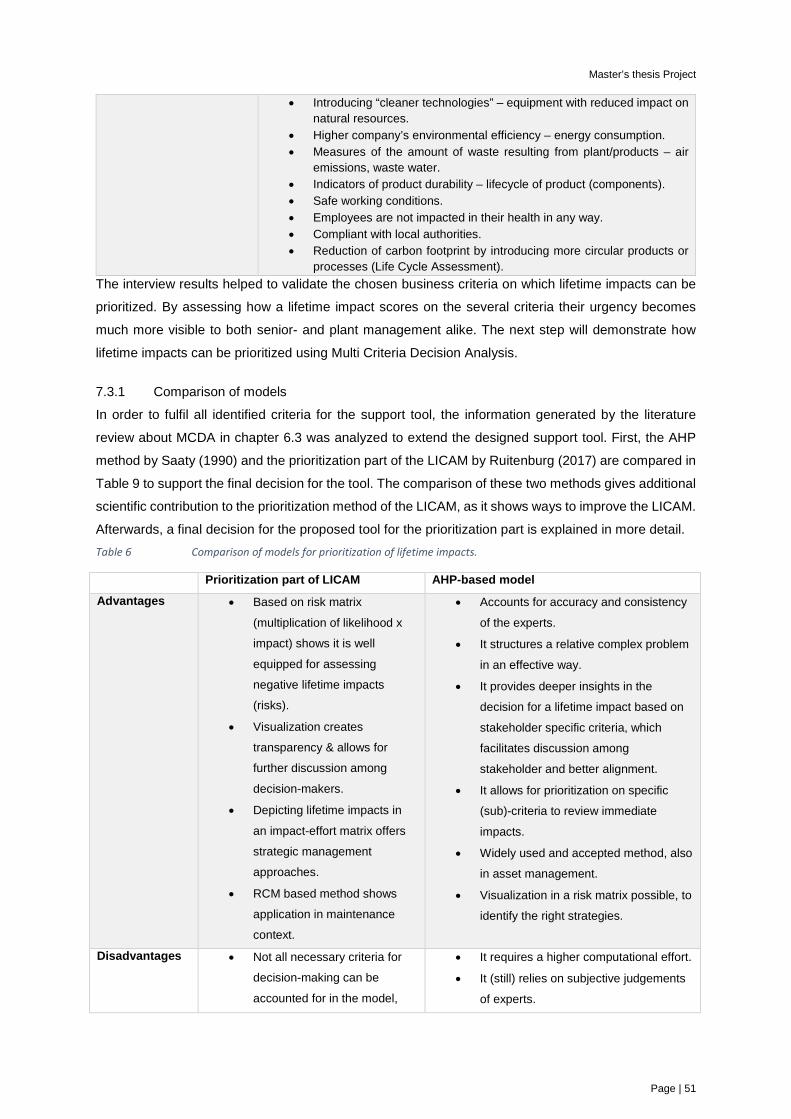
Master’s thesis Project
Page | 51
• Introducing “cleaner technologies” – equipment with reduced impact on natural resources.
• Higher company’s environmental efficiency – energy consumption. • Measures of the amount of waste resulting from plant/products – air
emissions, waste water. • Indicators of product durability – lifecycle of product (components). • Safe working conditions. • Employees are not impacted in their health in any way. • Compliant with local authorities. • Reduction of carbon footprint by introducing more circular products or
processes (Life Cycle Assessment). The interview results helped to validate the chosen business criteria on which lifetime impacts can be
prioritized. By assessing how a lifetime impact scores on the several criteria their urgency becomes
much more visible to both senior- and plant management alike. The next step will demonstrate how
lifetime impacts can be prioritized using Multi Criteria Decision Analysis.
7.3.1 Comparison of models
In order to fulfil all identified criteria for the support tool, the information generated by the literature
review about MCDA in chapter 6.3 was analyzed to extend the designed support tool. First, the AHP
method by Saaty (1990) and the prioritization part of the LICAM by Ruitenburg (2017) are compared in
Table 9 to support the final decision for the tool. The comparison of these two methods gives additional
scientific contribution to the prioritization method of the LICAM, as it shows ways to improve the LICAM.
Afterwards, a final decision for the proposed tool for the prioritization part is explained in more detail. Table 6 Comparison of models for prioritization of lifetime impacts.
Prioritization part of LICAM AHP-based model Advantages • Based on risk matrix
(multiplication of likelihood x
impact) shows it is well
equipped for assessing
negative lifetime impacts
(risks).
• Visualization creates
transparency & allows for
further discussion among
decision-makers.
• Depicting lifetime impacts in
an impact-effort matrix offers
strategic management
approaches.
• RCM based method shows
application in maintenance
context.
• Accounts for accuracy and consistency
of the experts.
• It structures a relative complex problem
in an effective way.
• It provides deeper insights in the
decision for a lifetime impact based on
stakeholder specific criteria, which
facilitates discussion among
stakeholder and better alignment.
• It allows for prioritization on specific
(sub)-criteria to review immediate
impacts.
• Widely used and accepted method, also
in asset management.
• Visualization in a risk matrix possible, to
identify the right strategies.
Disadvantages • Not all necessary criteria for
decision-making can be
accounted for in the model,
• It requires a higher computational effort.
• It (still) relies on subjective judgements
of experts.

Master’s thesis Project
Page | 52
which would facilitate more
discussion among
stakeholders.
• Scale of the model focuses on
mitigating risks, it is not proved
to be effective for exploiting
opportunities.
• There is no possibility to judge
the importance of the criteria
for the company.
• It relies on subjective
judgements of experts.
• It does not yet assign solution
strategies, but the high priority lifetime
impacts are the ones with the highest
score.
• The weighted sum (so the relative
importance) might mislead the results,
i.e. a high effort can still be worth the
effort if the benefits are high enough.
• The decision-maker might
underestimate the complexity.
• No multiplication of impact x likelihood,
which better classifies risks.
Regarding the fit of the models for PPG, the AHP method provides deeper insights and is able to
differentiate better. Nevertheless, it involves more effort (and PPG has only limited resources available)
and is slightly more complex in its application. It was decided to test both methods with three previously
established lifetime impacts to come to a final and supported solution. After some testing and discussion
with the Maintenance and Engineering department of PPG, it was found that the AHP method performed
better with the sub-criteria as it gave more insight into the exact impact and can be aligned with the
strategic objectives of the company.
7.3.2 Developed tool for prioritization
To prioritize the identified lifetime impact, AHP pairwise comparison method will be used (Saaty, 2013)
to weigh the different sub-criteria. This ensures that stakeholder specific criteria are implemented in the
model, and their importance relative to the overall goal is assessed in a structured way. This is based
on the findings of Niekamp et al. (2015), who also suggest to incorporate stakeholder specific criteria
in the model. The determination of the weights will be performed with the same experts of the first expert
session in a discussion, similar to the Delphi-method (Rowe & Wright, 2001). The results of the
interviews already revealed the structure of the AHP hierarchy tree, with the criteria likelihood, impact
on the business and realization effort in level one, and the financial performance, customer relationship,
internal (production) processes, organizational capability (learning, growth & innovation) and EHS
compliance/ society as sub-criteria for the impact on the business in level two. The overall goal of the
AHP hierarchy tree is to prioritize the lifetime impacts based on their importance for the factory in order
to reach and align to the corporate strategic objectives. A visualization of the AHP hierarchy tree for the
prioritization of lifetime impacts can be seen in Figure 10. It is proposed to only perform a pairwise
comparison between the several sub-criteria and not between all the alternatives (each lifetime impact
with each sub-criterion), because of the huge effort in generating judgements. Moreover, it became
clear during the expert session that the main criteria likelihood, impact and realization effort seem to
have the same importance on the overall goal. Since risks should be incorporated in the model, it is
chosen to multiply the first level (likelihood x impact x realization effort), similar to the prioritization of
the LICAM method or FMEAs.
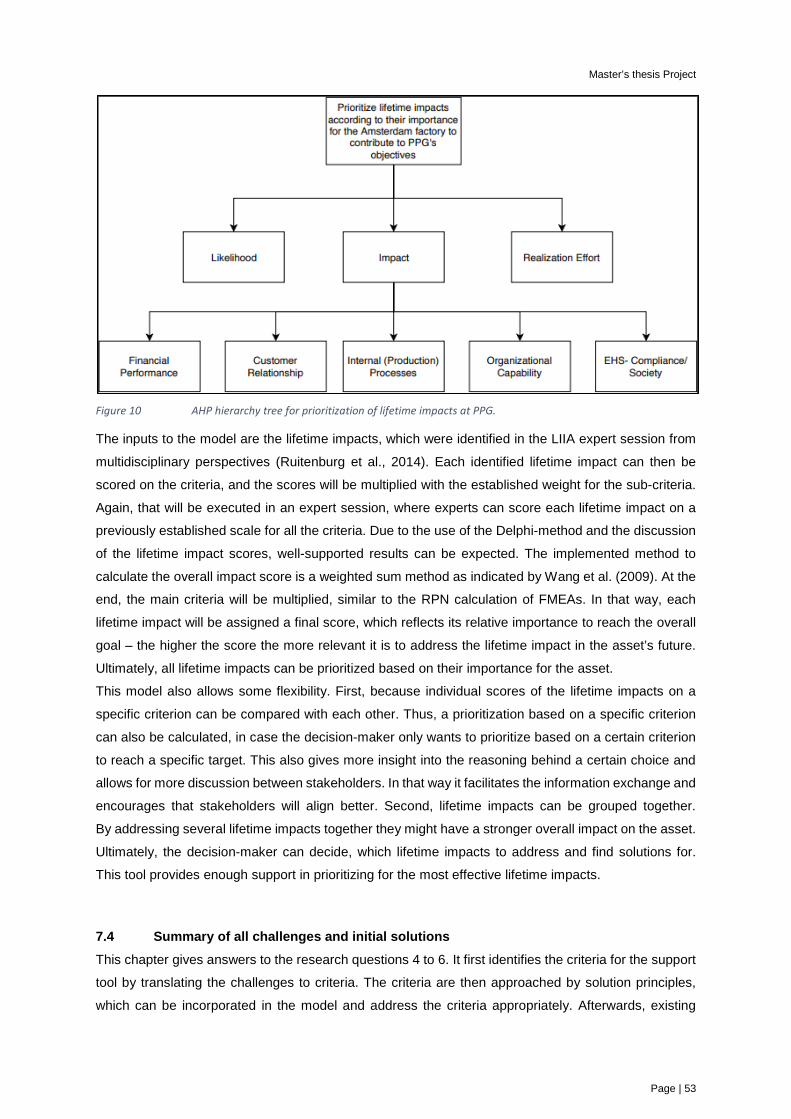
Master’s thesis Project
Page | 53
Figure 10 AHP hierarchy tree for prioritization of lifetime impacts at PPG.
The inputs to the model are the lifetime impacts, which were identified in the LIIA expert session from
multidisciplinary perspectives (Ruitenburg et al., 2014). Each identified lifetime impact can then be
scored on the criteria, and the scores will be multiplied with the established weight for the sub-criteria.
Again, that will be executed in an expert session, where experts can score each lifetime impact on a
previously established scale for all the criteria. Due to the use of the Delphi-method and the discussion
of the lifetime impact scores, well-supported results can be expected. The implemented method to
calculate the overall impact score is a weighted sum method as indicated by Wang et al. (2009). At the
end, the main criteria will be multiplied, similar to the RPN calculation of FMEAs. In that way, each
lifetime impact will be assigned a final score, which reflects its relative importance to reach the overall
goal – the higher the score the more relevant it is to address the lifetime impact in the asset’s future.
Ultimately, all lifetime impacts can be prioritized based on their importance for the asset.
This model also allows some flexibility. First, because individual scores of the lifetime impacts on a
specific criterion can be compared with each other. Thus, a prioritization based on a specific criterion
can also be calculated, in case the decision-maker only wants to prioritize based on a certain criterion
to reach a specific target. This also gives more insight into the reasoning behind a certain choice and
allows for more discussion between stakeholders. In that way it facilitates the information exchange and
encourages that stakeholders will align better. Second, lifetime impacts can be grouped together.
By addressing several lifetime impacts together they might have a stronger overall impact on the asset.
Ultimately, the decision-maker can decide, which lifetime impacts to address and find solutions for.
This tool provides enough support in prioritizing for the most effective lifetime impacts.
7.4 Summary of all challenges and initial solutions This chapter gives answers to the research questions 4 to 6. It first identifies the criteria for the support
tool by translating the challenges to criteria. The criteria are then approached by solution principles,
which can be incorporated in the model and address the criteria appropriately. Afterwards, existing

Master’s thesis Project
Page | 54
methods from literature were investigated and it was assessed to what extent those methods can be
incorporated in the model, because they were making use of the identified solution principles.
These adopted methods are named initial solutions.
Table 7 below summarizes how each identified challenge can be dealt with by making use of the initial
solutions. Each challenge corresponds with the derived criterion, and can be seen as interchangeable.
For ease of reading, the syntax follows the CIMO-logic (Denyer et al., 2008), to provide a logical flow
and reasoning. More detailed focus is put on challenge 6 to stress the importance to extent the LIIA by
MCDA and the balanced scorecard aligned to PPG’s corporate strategic objectives.

Master’s thesis Project
Page | 15
Table 7 Overview of initial solutions to the identified challenges (and criteria), based on the CIMO-logic.
CIMO Context Intervention Mechanism Outcome Based on Challenge 1: The technical condition of the assets in the factory is deteriorating, demanding more effective decision-making for maintenance management and for new
and replacement investments alike.
1 In the context of
deteriorating technical
condition and difficulties
to estimate commercial
end of lifetime,
bringing together experts in a
discussion to take time off from
firefighting
will start a process of
information sharing from
knowledgeable experts
which results in an “educated
guess” of potential failure
modes and the commercial
end of lifetime based on the
available information.
LIIA (Ruitenburg et al., 2014); expert-
based approach (Smith & Hinchcliffe,
2003); setting the right priorities
(International Organization for
Standardization, 2014);
Challenge 2: The company has a strong silo mentality, where information is dispersed over several departments. But the communication is missing and the visibility is
not at the right place and time in the organization. 2 In the context of a strong
silo mentality, bringing together experts from
different TECCO perspectives will start a process of
knowledge and information
exchange
that leads to a shared view on
the lifetime impacts relevant to
the asset.
LIIA (Ruitenburg et al., 2014); expert-
based approach (Smith & Hinchcliffe,
2003); multidisciplinary approach
(Haarman & Delahay, 2016) Challenge 3: There is a recognized need to invest in digitalization opportunities in the supply chain. In order to stay competitive PPG should invest in new technology.
However, so far the operational organization is not equipped for this.
3 In the context of having a
need to invest in
digitalization
opportunities in order to
stay competitive,
creating a long-term overview of
all risks and opportunities
may help to decide where to
allocate (which digitalization
opportunities to focus on) the
limited budget & time
which may result in a more
long-term focus and well-
grounded business cases for
new technologies.
LIIA (Ruitenburg et al., 2014); setting
the right priorities (International
Organization for Standardization,
2014);
ALCM (Pudney, 2010)
Challenge 4: Different part of the organization are demanding different functions from the asset, requiring more flexibility. This is even part of the corporate objectives,
where a reduction of working capital, operational excellence as well as increased focus on product innovation (variation) are demanded.
4 In the context of
demanding different
aspects from the asset,
basing the decision regarding the
asset on company specific criteria
and ensuring that all relevant
perspectives are considered
will ensure the decision is in
line with the company
strategic objectives and in
line with all relevant interests
that leads to better and more
effective decision-making.
AHP in Asset Management (Márquez,
2007),
multidisciplinary approach (Haarman
& Delahay, 2016)

Master’s thesis Project
Page | 16
Challenge 5: The availability of well-skilled and trained human resources is becoming increasingly limited, so that decisions on the asset should become as effective as
possible.
5 In the context of
decreasing availability of
skilled human resources,
creating an overview of long-term
risks and opportunities
may help to decide where to
allocate the limited time &
resources on
which may result in less fire-
fighting and to spend more
time on long-term issues.
LIIA (Ruitenburg et al., 2014); setting
the right priorities (International
Organization for Standardization,
2014)
Challenge 6: There is a discrepancy between the perception and interest of general management and the local site team regarding asset project focus. 6 In the context of different
perceptions and interests
of asset project focus
areas,
basing the decision-making on
company specific criteria
will ensure the decision
aligns with company
strategic objectives
that leads to a shared view in
terms of asset project focus
areas.
Balanced scorecard (Kaplan &
Norton, 1996); AHP in Asset
Management (Márquez, 2007);
MCDA (Wang et al., 2009)
Challenge 6.1: In the relation of discrepancy between interest and perception of different stakeholders, it was discussed that there is a missing objectivity in evaluating
asset proposals at PPG.
6.1 In the context of missing
objectivity in
asset decision-making,
grounding the decision on an
objectively designed MCDA
framework
may help in allocating the
limited budget in the most
objective way
which may result in more
motivated employees to hand
in new ideas and more
effective decision-making.
Balanced scorecard (Kaplan &
Norton, 1996); PPG’s strategic
elements;
MCDA (Wang et al., 2009)
Challenge 6.2: In the relation of discrepancy between interest and perception of different stakeholders, PPG faces issues like on-time visibility and communication between
stakeholders.
6.2 In the context of missing
on-time visibility and
communication
introducing a well-established
MCDA framework to base
decisions on
may help in making the
decision criteria visible to the
stakeholders
which may aid stakeholders in
establishing stronger business
cases and serve as a vision
guideline as it represents the
company’s strategic objectives
Balanced scorecard (Kaplan &
Norton, 1996);
MCDA (Wang et al., 2009)

Master’s thesis Project
Page | 17
8 SOLUTION DESIGN
In the previous chapter the identified challenges at PPG for an asset decision-making tool were
identified, and suitable solutions from literature were reviewed. It was also assessed to what extent the
LIIA, developed by Ruitenburg et al. (2014), can be applied to the specific case at PPG. In this chapter
the solution design will be presented. The solution design is the third step of the design science as can
be seen in the circle of Figure 11. Moreover, it is the first attempt to approach the central research
question, because the solution design tries to give answer to how the asset decision-making process
at PPG can be structured. Nevertheless, only after the implementation and testing a conclusion can be
drawn, if the solution design is effectively addressing the research question. The solution design
incorporates the initial solutions generated with the CIMO-logic in order to create the artifact.
The difference between chapter 7 (initial solutions) and chapter 8 (solution design) is that chapter 7
reviews the criteria for the support tool and possible solution principles that address the criteria, whereas
chapter 8 combines all the elements to one final model that can be applied in practice. It incorporates
the aspects listed in the initial solutions (Table 7) and combines it to a solution design that can solve a
practical problem. The solution design is a 11-step approach, which will ultimately address the problems
outlined in chapter 5 by making use of the solution principles described in chapter 7.
Figure 11 Design science, step 3.
The solution design consists of the LIIA in order to identify the lifetime impacts. Some additional steps
are added that help to prioritize the lifetime impacts.
The LIIA is a model that identifies “trends or events that may have a positive or negative influence on
the remaining lifetime of the asset” (Ruitenburg et al., 2014, p.1). The LIIA is doing so by applying the
following structure (Ruitenburg, 2017):
1. Asset selection
2. Collection of general asset information
3. Expert session
4. Writing the lifetime impact report (LIR)
5. Evaluation
The contribution of this master thesis is the addition of the steps 6,7,8,9,10,11, which are added to the
LIIA in order to prioritize the identified lifetime impact. The motivation to add these steps to the tool is
outlined in section 7.2 and 7.3. A description of the additional steps can be seen below.

Master’s thesis Project
Page | 18
6. Collecting information from the business strategy of PPG,
7. Establish and validate scale for criteria and sub-criteria,
8. 2nd Expert-session:
a. Weighing of criteria,
b. Scoring of lifetime impacts on criteria,
9. Analyze data,
10. Report on prioritization of lifetime impacts,
11. Final evaluation.
In the following section a more detailed explanation of the steps is presented. Decisions as well as
design choices are outlined in each step:
1. Asset Selection
Even though asset selection seems to be an obvious step, it is important to choose the asset with
careful consideration. Questions like criticality, cost or age of the asset can help making this decision.
Also, choosing assets which are subject to more strategic decisions, and where the effect of these
decisions might create an unstable environment, can be a good choice to perform a LIIA on.
Additionally, to define the scope of the analysis is important as well. It should be answered beforehand
whether the LIIA is applied to one type of asset or to multiple similar assets.
2. Collection of general asset information
During the second step, collection of general asset information, the focus is on describing the asset
characteristics in order to prepare for the expert session. In that way, all experts will have the same
background information on the asset during the session. This ensures that the focus can be put on the
future challenges and opportunities the asset might be exposed to. Important information concerning
the assets are physical characteristics, function, current (and past) performance and strategic
objectives. Both qualitative as well as quantitative information may be valuable input for the expert
session.
3. Expert session
In the expert session itself, experts from multiple disciplines are brought together to identify the lifetime
impacts. The expert session is also called TECCO-session. TECCO is an acronym to define the five
categories of potential lifetime impacts on the asset (Braaksma, 2016, p.26-36):
• Technical: Questions like does the asset still measure up to the original specification are
answered here. Experts could for example think about failure modes, degradation
mechanisms, wear, condition monitoring or availability of spare parts to identify relevant
lifetime impacts.
• Economic: The essential question here is if the asset will still be generating financial benefits
to the owner. To answer this, experts can think about costs of spare parts, failure costs, OPEX,
Life Cycle Costs (LCC) or Total Cost of Ownership (TCO).
• Commercial: Identifying lifetime impacts in this perspective can be done by assessing if the
asset still fulfils the market demand. Here one could think of product trends, innovation,
performance and obsolesce of the asset.

Master’s thesis Project
Page | 19
• Compliance: The compliance perspective ensures that the asset still fulfils its function in
compliance with applicable rules and regulations. In order to find out the relevant lifetime
impacts experts can think about hazardous materials, working conditions, operating envelope,
safety, environment and developments in society.
• Organizational: To identify organizational lifetime impacts experts should answer the question
if the organization will still be able to operate the asset going forward. This could include
elements like knowledge, expertise, data, availability of employees and standardization.
All these perspectives will be discussed separately in the expert session to identify all relevant impacts
per perspective. Tacit knowledge, opinions as well as statistical data can be included in the discussion.
4. Lifetime impact report
After this, the lifetime impacts are put together in a lifetime impact report (LIR). This report is a compact
summary of the value creation potential of the asset in the long term. Hence, it addresses the identified
lifetime impacts, as well as the current performance and strategic objectives in order to facilitate long-
term strategic decision-making on the asset.
5. Evaluation
For evaluation, the LIR is sent back to the experts and their feedback is incorporated to cover all relevant
information. It is important to evaluate the LIR with the experts to verify that all information from the
expert session is understood correctly. Another important advantage of the evaluation is that experts
will have to work with the information from the session, so it is good to get their approval on it.
6. Collecting information from the business strategy of PPG
To be able to prioritize, first some information regarding the business strategy, as well as specific
industry and company data regarding the criteria are collected. This information serves as input for the
weighing and scoring of the criteria. It is important to align company specific information to the scoring
and weighing of criteria in order to be able to make more effective decisions on the asset that facilitate
the organization.
7. Establish and validate the scale for criteria and sub-criteria
The scale is established and validated together with the experts, and is based on the information
collected in the previous step. In that way it is also assured that the experts are well prepared for the
expert session. By incorporating the business strategic elements of the company in the scoring table of
the balanced scorecard elements, it will be easier for the experts to score the lifetime impacts and it is
assured that the prioritization of lifetime impacts is aligned to the corporate objectives. The same
approach should be conducted for the other two criteria. Likelihood can represent how far the
organization normally looks into the future. Realization effort can be based on the established levels of
approval for new investments within the organization. This makes the model more usable for the
organization.
8. 2nd expert session
In the following expert session, the weighing of sub-criteria is performed in a discussion, based on the
AHP pairwise comparison. The discussion element between experts facilitates information sharing, in
order to show that the importance of each criterion is well-grounded. After weighing the different sub-
criteria, each identified lifetime impact has to be scored on each criterion of the BSC and likelihood and

Master’s thesis Project
Page | 20
effort. Again, this step in the expert session is performed to stimulate discussion between all the experts.
Talking about each lifetime impact and how it will affect the five criteria forces the experts to think about
the influence of the lifetime impact on the business. Thus, one of the main advantages of this tool lies
in the discussion and exchange of valuable information, including a focus on potential consequences.
It provides the experts with better arguments for new asset decisions.
9. Analyze data
After the second expert session, all the information is collected, analyzed and shared in the form of a
risk matrix, similar to the example depicted in Figure 12. On the x-axis of this figure is the impact score
depicted, on the y-axis the likelihood score shown and the size of the bubble reflects the effort score
for the particular lifetime impact. The bigger the bubble, the quicker wins can be generated because of
a low realization effort. Moreover, the score of each lifetime impact on a single criterion is visualized
separately, which can help making more focused decisions. Moreover, the weighted average impact
score of each lifetime impact is calculated and all main criteria are multiplied to a final score. This final
score will be compared with only the risk score (likelihood x impact) to back up the results and to offer
the expert the chance to make decisions only based on the risks. This will just serve as a suggestion to
the experts and it is up to them to decide where they want to act upon.
Figure 12 Visualization of lifetime impact scores to show an example.
10. Report on prioritization of lifetime impacts
The analyzed data is combined in a report on prioritization of lifetime impacts. The report gives a
summary of why a certain lifetime impact is more important to the organization than another one, and
what part of the organization is triggered by the lifetime impact. It provides visibility of impacts and their
scores against the criteria, so that experts have a clear view on the important factors influencing the
assets’ remaining lifetime. Moreover, the report can be used as a support tool to deliver better
arguments for new project proposals, i.e. investments.
11. Final evaluation
0,53
0,32
0,21
0,32
0,00
0,20
0,40
0,60
0,80
1,00
1,20
1,40
1,60
0,00 0,50 1,00 1,50 2,00 2,50 3,00
Like
lihoo
d Sc
ore
Impact Score
Visualization of lifetime impacts
Effort

Master’s thesis Project
Page | 21
In the end, a final evaluation of the report will be conducted together with the experts. This gives the
experts the chance to validate the results, and potentially reevaluate their answers. The expert will work
with the information collected and should give his/her approval in order for the model to succeed.
Finally, the experts will have the last word on which lifetime impact(s) they want to approach first.
The collected and analyzed data will serve as a supporting tool for this decision. After this, the expert
can decide on solutions and can start writing a business case based on the prioritization results.
With the final evaluation the 11-step approach of the solution design is completed. In the following some
general remarks to the solution design are given.
After implementing the business case and monitoring the asset performance, the “feedback loop” can
be closed to start the process all over again. By incorporating the “feedback loop” the supported results
will get stronger, and will be secured in a context of ‘plan-do-check-act’. This can also be seen in Figure
13, which is a visualization of the whole process.
Figure 13 Visualization of the process to identify and prioritize lifetime impacts (the artifact). The green rectangles are outlining the contribution of this master’s thesis.
The red rectangles show the input data for the analysis. They have to be collected in order to make
more effective decisions on the asset. The green rectangles show the artifact, namely the LIIA and
prioritization of lifetime impacts. The artifact/ designed solution, which is outlined in the larger green
rectangle, serves as answer to the central research question:
“How can the asset decision-making process at PPG be structured to guide to more effective asset
investments?”
Resulting from the solution design a strategic focus area for new asset (investment) projects can be
identified (purple rectangle), which can be used by local project teams to establish well designed

Master’s thesis Project
Page | 22
business cases (purple rectangle). However, it is not restricted to new investment opportunities.
The support tool can also initiate projects to optimize the organization around the asset. To close the
“feedback loop” the yellow rectangles are identified, which serve as an input for the next “round of
analysis”. After implementing the business cases/projects the improved performance can be monitored,
which will be input for applying the decisions support tool again.
All in all, the solution design serves the purpose of structuring the asset decision-making process at
PPG well to guide to more effective asset investments.

Master’s thesis Project
Page | 23
9 IMPLEMENTATION AND TESTING OF THE SOLUTION DESIGN
The designed model will be applied at PPG’s Amsterdam factory to test its effectiveness. This is the
last step of the design science as can be seen in the circle of Figure 14. In this step the designed asset
decision support tool will be implemented at PPG’s Amsterdam factory to test if it works in practice as
intended and if adjustments are necessary to change the solution design accordingly. It gives answer
to the 7th research question on effectiveness of the tool and thereby validates that the solution design
is indeed a decision support tool that can guide to more effective asset investments at PPG. Hence, it
also validates the answer of the central research question in chapter 8. The 11 steps of the solution
design presented in chapter 8 are here applied in practice to test its usability.
Figure 14 Design science, step 4.
9.1 Implementation of the model at Amsterdam
This steps cannot be shown due to confidentiality.
9.2 Results of the model This steps cannot be shown due to confidentiality.
9.3 Personal reflection of results and advice Generally, I agree with the results determined by the implemented model. Based on the priority rank
assigned in Table 11, below I will present my thoughts to some chosen lifetime impacts. The number in
brackets represents the priority score of the analysis. In total there were 15 lifetime impacts prioritized.
• The need for skilled technicians in the plant (1) is a high risk, all stakeholders are
acknowledging. The Maintenance & Engineering department at the Amsterdam factory is
decreasing in size, while their work load is not. Recently, the Maintenance & Engineering
Manager of Amsterdam and another technician left the company. On top of that, the currently
performed work in the plant is not very attractive and rather repetitive, as constantly the same
machines break down. Already in chapter 2, the challenge was outlined that the technical
condition of the plant is deteriorating (section 2.5.1). The current Maintenance & Engineering
department of the Amsterdam factory is busy with firefighting all the time, not having time to set
the right priorities for future replacements or modifications of machines. Because of this high
level of repetitive work and firefighting, it is also not easy to attract new technicians.

Master’s thesis Project
Page | 24
Moreover, some operators not being able to operate the rather new machines in filling &
packaging leads to other failures the maintenance department has to repair, which could maybe
be prevented with better skilled operators or more intensive training/supervision. Because of all
these reasons, the risk of not being able to attract new technicians is very present and should
be of high priority. Not solving this issue in the short-run could affect the production processes,
EHS matters and ultimately increase costs or lead to production shortcomings.
• The opportunity to introduce new technologies in the plant (2) is important considering a long-
term view. On the one hand, with the current equipped operational organization pushing high
tech solutions into the plant is not necessarily the right step, because the plant is already
underutilized and operators have trouble operating new machines. Also dismissing people by
replacing them with technology is not a decision taken lightly. On the other hand, general
management is missing a local vision for the plant, which can prepare them better for future
challenges. Such a vision can involve to become more flexible in the production in order to fulfil
new customer demands and be able to reduce the working capital in the warehouse.
The increased flexibility and adaptability could be accomplished by introducing new
technologies, like more automation and modular assembly of production lines. It should be part
of a long-term vision, so that the current operational organization is able to lay the fundamentals
in order to be able to introduce new technologies in the plant within the next 10 years. In this
relation, another important lifetime impact (the high average age of operators, < 50) can further
push technologies focusing on automation. Those technologies demand less labor input,
meaning that by natural attrition no employees have to be dismissed. Hence, personally I would
have scored the sense of urgency of new production technologies a bit lower. Nevertheless, it
is important to already prepare the operational organization for this.
• To introduce more shop floor visibility in the plant (4) certainly is an important topic. Especially,
because the process is labor dependent and it seems there are often failures occurring because
of operators not being familiarized with the new processes. In this relation we talked about shop
floor management, which I think is a good idea to further integrate into PPG. Shop floor
management is a way to manage and develop operations, equipment and workers by requiring
management to spend more time at the shop floor. Important elements are transparency,
created by visualizing goals and performance, documenting and standardizing new work
processes and identifying areas of improvement to guide the employees better (Symbol
Business Improvement, 2014). In that way, operators get more support and can directly adapt
their behavior until it becomes an automatism. Standardizing new processes is important in
order to prevent failure, as well as experiencing support from management.
• To increasingly invest in complexity optimization (5) is another important subject which is
extensively discussed at PPG. It can develop to a high risk for the factory in the future and PPG
already puts effort in mitigating the risk. If there are too many unique and complex paint
formulations, it is difficult for the factory to be able to produce all of them. Due to all the mergers
and acquisitions in recent years the amount and product complexity increased, even though
the products from different brands might be very similar their formulation is not. By performing

Master’s thesis Project
Page | 25
complexity optimization PPG might be able to sort out products which are not sold anymore
and combine similar formulations to one, which in turn can reduce the number of raw materials
used and increase the batch size of products. Thus, performing complexity optimization can
help the factory to save costs and should be an important lifetime impact to consider.
• The impact of the underutilization of the plant in the long-run (13) was not scored very high.
In my opinion this can be explained by experts not seeing the sense of urgency at the moment.
Certainly, this might become more important in the future, when competitors can create a
competitive advantage due to cost savings in their production. However, at the moment PPG
does not have any disadvantages because of the underutilization of the factory, if at all the
spare capacity helps them to shift production in case of unplanned standstills. Moreover, with
the ongoing footprint discussion the underutilization of the Amsterdam plant might even be seen
as a benefit. Generally, when considering the impact in the short-run the result is
understandable. But when considering the impact it can create in the long-run, I would score it
higher.
• Poorly documented asset performance and OEE not being in hearts & minds of operators (15)
was scored as lowest priority. It requires effort to update the documentation of the asset
performance and training/supervision to ensure that operators correctly make use of OEE, but
it is worth the effort. OEE helps to understand the losses of the production processes to make
the right decisions in order to improve efficiency and reduce operating costs. Thus, it will be
beneficial for the factory to pay more attention to this. In my opinion, this lifetime impact should
be approached with more priority.
Based on the results of the model and my own observations as a business expert at PPG, I developed
the following advice for their factory. The strategic roadmap (Figure 15) can be read as a 10-year plan
and is classified in three major stages: the left side shows the short-term focus (to be approached in
2019), in the middle the medium-term solution strategies are displayed (implemented between 2020-
2023) and on the right side the long-term strategies are depicted (approached at end of the 10-year
plan, between 2024 and 2028). On the y-axis are different solution strategies displayed and the arrows
show their relation to each other and the time horizon.

Master’s thesis Project
Page | 26
Figure 15 Strategic Roadmap for PPG's Amsterdam site stating short-, medium-, and long-term strategies.
As discussed before, currently there are a lot of organizational lifetime impacts that are important for
the factory to address in time. The proposed solution strategies are mainly focusing on addressing
those organizational lifetime impacts in the short run. Only in the long run, when the operational
organization is equipped for it, more technical lifetime impacts are addressed to improve the
performance of the factory.
Generally, I advise to focus on lean based solutions, that focus on creating value by standardizing
processes to prevent failure from happening (Symbol Business Improvement, 2014). The core methods
I focused on are shop floor management and total productive maintenance.
Short-term strategies:
Important is to establish a long-term vision for the factory. The strategic roadmap can serve as such a
document. A long-term vision ensures that everyone is working towards the same goals and helps to
plan for and achieve the long-term goals. For example, by setting a long-term goal on increased
automation in the plant some fundamentals have to be prepared already in the short run. That is for
instance to promote digitalization in the whole organization. Summarizing, a long-term vision for the
plant with specific goals is necessary in order to prepare for future challenges.
Furthermore, complexity optimization should be performed constantly, because the R&D and marketing
departments are introducing new product innovations at a high speed. The advantages of complexity
reduction are already discussed at the beginning of this section, for example to increase batch size and
save costs. In order to prepare for the longer-term future, complexity optimization is an essential
component. PPG will face new customer demands (more individual products, shorter delivery times)

Master’s thesis Project
Page | 27
and at the same time they want to reduce the working capital in the warehouse. Moreover, the ongoing
footprint discussion might involve to make better use of the spare capacity in the Amsterdam factory in
the future. This together with external threats, like competitors which invested in Mega Plants that are
able to produce cheaper and the material price development support the need for complexity
optimization in the future.
Moreover, in order to anticipate the need for technicians in the plant in the short run an idea would be
to prepare better supervision and training for operators. Those supervisors are needed especially in
filling and packaging where most of the failures happen and where the availability of machines is the
lowest (data in the confidential appendix). The machines in filling and packaging are the newest and
most automated machines in the Amsterdam factory. Many of these failures only occur because of
operators not being able to properly operate the machines, either because their skill level is not good
enough or because their training on the job was not sufficient. Hence, by incorporating shop floor
management and providing the operators more direct guidance, some failures can be prevented.
Advantages of shop floor management are the chance to directly intervene and give feedback for
improvement, spot operators that need additional trainings and control that new working processes are
implemented correctly and standardized by the operator. On top of that, shop floor management
ensures transparency through visualization of goals and assigns responsibilities to the operators
depending on their skill level. In order to prevent failure certain methods can be used (Symbol Business
Improvement, 2014), which can also be realized with operators of a low skill level:
• Poka Yoke: build in failure prevention mechanism in machines.
• Visual Management: clearly visualize desired and undesired situations.
• Standardization of working procedures through clear documentation and elimination of
variation.
• Operator skill matrix to assign only tasks appropriate to skill and training levels (and identify
employees that need additional trainings).
• 1:3 & 3:1 rule: 1 operator manages 3 tasks and 3 operators are managing 1 task.
• Employability matrix: to identify employee and workstation utilization in order to distribute work
fair and to identify operators that might need more trainings.
• Gemba: every manager spends around 30 minutes per day at the shop floor. In that way they
can keep track of the bigger picture, identify improvement possibilities and encourage the team
to perform better.
Medium-term strategies:
Next to shop floor management, total productive maintenance (TPM) offers another solution strategy to
mitigate the need for more technicians. TPM is a lean based method to get waste out of the process.
Wireman (2004, p.1) defines it as “the maintenance activities that are productive and implemented by
all employees. TPM involves everyone in the organization from operators to senior management in
equipment improvement.” The method has five main pillars (goals) that are the following:
1. Improving equipment effectiveness,
2. Improving maintenance efficiency and effectiveness,
3. Early equipment management and maintenance prevention,
Master’s thesis Project
Page | 28
4. Training to improve the skills of all people involved,
5. Involving operators in routine maintenance (Wireman, 2004, p.1-2).
Generally, the aim of TPM is to train operators also in taking care of their machines, by cleaning
regularly and incorporating routine checkups in their daily working processes. Even though the skill
level of the operators at PPG are not very high, by standardizing new processes and providing support
at the job through supervision in the beginning a simple form of TPM that supports the maintenance
labor in their work can be realized. This ensures that the remaining tasks for the maintenance labor
decreases in size but increases in attractiveness (more challenging tasks). In this relation, the use of
OEE and its importance for the factory should be discussed. Operators need to incorporate the use of
OEE in their daily working habits so that the right decisions can be made to improve efficiency and
reduce operating costs. Equipment, which is not performing well can easily be identified and measures
for improvement can be initiated.
Long-term strategies:
In the long-run PPG has to prepare for the internal and external threats by i.e. investing in a modular
assembly of production or more automation. Modular assembly in production may help to become more
flexible and adaptive in the production process (to anticipate the changing customer demands), reduce
the waste in pipes and ensure that the equipment can more easily be adapted to new regulations.
More automation may yield faster throughput times (important i.e. for the footprint discussion, the
changing customer demands and the reduction of working capital) and save costs (because of less
labor input and labor costs are currently high). Moreover, another advantage could be that it enhances
the natural attrition of the work force. The lifetime impact of the average age of operators being above
50 years old, and the associated risk that most of the labor will retire in the next 10 years can be
counteracted by investing in more automation in the factory.
All in all, those solution strategies help the Amsterdam factory to prepare its organization for short-term
as well as long-term challenges. Moreover, the solution strategies can also relate back to PPG’s Asset
Management Framework (in the confidential appendix). In the short- to medium-term it is advised to
focus on the pillars Human Resource Development and Ownership & Integration, whereas in the long-
run the operational organization should focus on improving the pillar Asset & Process Improvement.
Final Remark: Especially shop floor management and TPM require high effort and commitment for change.
When implementing change that effects employees, the success of the implementation is always critical
and depends on two main criteria: open communication about all steps, and understanding and
committing to the benefits of the changed solution (Kotter, 1995). Especially, to have a strong change
agent, preferable an employee of senior management level supporting the success of the change and
continuously promoting this in the organization, is crucial to the success. Generally, when implementing
solutions requiring change, like TPM or shop floor management, Kotter’s “leading change” model can
guide a successful implementation of the new way of working (Kotter, 1995). Kotter established an
8-step approach for leading change in an organization. The 8-steps for change management should be
conducted in parallel instead of sequential. First the 8 steps are outlined, afterwards an implication what
this means for TPM and shop floor management is explained.

Master’s thesis Project
Page | 29
Kotter’s 8-step approach (Kotter, 1995):
1. Create a sense of urgency,
2. Build a powerful coalition,
3. Create a vision for change,
4. Communicate the vision,
5. Empower action,
6. Create quick wins,
7. Build on the change,
8. Make it stick.
The first three steps are important in order to create a climate for change. Then the emphasis lies on
engaging and enabling the organization. Finally, the change is implemented and sustained.
Those 8 steps can also be applied to implement TPM and shop floor management in the organization.
The steps can include the following actions and actors.
Shop floor management (SFM): Table 8 Implementation of Shop Floor Management
Step Actions Actors Create a sense of urgency
SWOT analysis on the factory to identify
opportunities and risks. These opportunities and
risks should be approachable by shop floor
management. That can lead to the desire for change.
Senior management,
plant management,
change agent
Build a powerful coalition
Stakeholder analysis in order to identify the steering
committee for the change project. Try to get people
on board from every layer of the organization.
Gain commitment from top management.
Encourage the steering committee to work as a
team. Have a strong change agent and limit the team
to approximately 6 employees.
Senior management,
plant management,
change agent, steering
committee: senior-, plant-
management,
maintenance-, EHS- and
BPI staff, work station
supervisor(s), operator(s)
Create a vision for change
Create a vision – to implement shop floor
management in order to improve the efficiency of the
processes to ultimately reduce production costs.
Establish clear objectives for short-, medium-, and
long-term. Use SMART objectives.
Steering committee
(cross-divisional & cross-
hierarchical),
Change agent
Communicate the vision
Clear and consistent communication in order to
anticipate concerns. Why is shop floor management
chosen? State the benefits. Outline to what extent
the job of operators and management changes.
Create change teams that are acting as good
example of shop floor management and promote the
benefits.
Steering committee to the
whole operational
organization, change
agent, change team
(consisting of senior &
plant management,
supervisors, operators)

Master’s thesis Project
Page | 30
Empower action
Effective leadership: concern of senior management;
communicate shop floor management and
encourage everyone to work towards that goal; lead
by example and actively engage on the shop floor.
Employee recognition: engage staff by e.g.
establishing a monthly award for best team effort in
identifying and addressing a problem.
Steering committee,
change agent, change
team(s) & other work
station teams
implementing SFM
(consisting of senior &
plant management,
supervisors, operators)
Create quick wins
Identify pilot project, e.g. work station that is easiest
to improve without much pre-knowledge of the
methodology, e.g. filling lines.
Change team (cross-
divisional & cross-
hierarchical), e.g. filling
station team
Build on the change
Implement 5S and Visualization of key metrics and t-
cards.
5S: photograph, clear area, organize, clean up,
photograph, establish check list, establish regular
audit.
Use employability matrix and operator skill matrix.
Introduce Gemba (every manager spends around 30
minutes on the shop floor).
Make use of Poka Yoke.
Work station teams
(cross-divisional & cross-
hierarchical), change
agent/team, plant &
senior management
Make it stick Regular review to look for opportunities and build on
the change. Visualize connection between the new
behavior and the success of the operation, i.e. use
improved metrics. Reward employees that perform
well. Standardize new working procedures, so that it
sticks.
Senior management,
Work station teams
(cross-divisional & cross-
hierarchical), change
agent
Total productive maintenance: Table 9 Implementation of Total Productive Maintenance
Step Actions Actors Create a sense of urgency
SWOT analysis on the factory to identify
opportunities and risks. That can lead to the desire
for change. Identify benefits of TPM, which help to
accomplish the opportunities or mitigate the risks
identified.
Senior-, plant-,
maintenance-
management, change
agent
Build a powerful coalition
Stakeholder analysis in order to identify the steering
committee for the change. Try to get people on
board from every layer of the organization.
Change agent, Steering
committee: senior-, plant-
, maintenance-, BPI-,

Master’s thesis Project
Page | 31
Gain commitment from top management.
Encourage the steering committee to work as a
team. Have a strong change agent and limit the
team to approximately 6 employees.
EHS- management/staff,
work station
supervisor(s), operators
Create a vision for change
Create a vision – to implement TPM in order to
reduce failures and unplanned standstills. Establish
clear objectives for short-, medium-, and long-term.
Use SMART goals.
Steering committee
(cross-divisional & cross-
hierarchical),
Change agent
Communicate the vision
Clear and consistent communication in order to
anticipate concerns. Why is TPM the right solution?
State the benefits. Outline to what extent the job of
operators and maintenance staff changes.
Create change teams that are acting as good
example of TPM and promote the benefits.
Steering committee to the
whole operational
organization, change
team: plant management,
maintenance-, EHS-
staff, supervisors &
operators)
Empower action
Effective leadership: concern of plant management;
communicate TPM and encourage everyone to
work towards that goal; lead by example and
actively engage on the shop floor.
Employee recognition: engage staff by establishing
a monthly award for best team effort in performing
5S.
Change agent, Steering
committee, change team
& other work station
teams (having the same
hierarchical & divisional
composition)
Create quick wins
Identify pilot project, e.g. equipment type that is
easy to improve (filling or packaging stations). Most
appropriate in organizations with little TPM
experience.
Change team, change
agent
Build on the change
Implement 5S, autonomous maintenance and start
measuring OEE.
5S: photograph, clear area, organize, clean up,
photograph, establish check list, establish regular
audit
Autonomous maintenance: identify inspection
points, make inspection points visible, identify and
document all set points & lubrication points,
operator training, create checklist for all points,
establish regular schedule for auditing.
Change team, work
station teams (cross-
functional), change
agent, maintenance staff
Make it stick Regular review to look for opportunities and build
on the change, for example by using OEE data.
Address major losses (e.g. use Kaizen) and
Senior-, plant- &
maintenance
management, change

Master’s thesis Project
Page | 32
visualize and document the improvements
afterwards. Communicate old vs. new metrics.
Standardize 5S and autonomous maintenance so
that it sticks. Reward employees that perform well.
agent, work station
teams,
Summing up, by following these steps, and performing these actions with the relevant actors a
smooth and efficient implementation of the organizational change of TPM and SFM can be reached.

Master’s thesis Project
Page | 33
10 CONCLUSION AND FINAL RECOMMENDATIONS
In the following chapter a conclusion to the designed support tool is given. Some limitations and final
recommendations to the tool are also presented. On top of that, a general conclusion regarding the
challenges encountered during the assignment and personal developments are reflected.
Chapter 10 is structured as follows: section 10.1 gives a conclusion to the developed solution for PPG.
After that, section 10.2 discusses the limitations, and final recommendations are presented in section
10.3. Last but not least, a more general conclusion concerning the internship assignment at PPG is
provided in section 10.4.
10.1 Conclusion regarding the developed solution for PPG All in all, this master’s thesis aimed at making a theoretical and a practical contribution to improve the
asset decision-making process at PPG. The theoretical contribution was to develop theory, which was
achieved by designing an asset decision-making tool at PPG. The tool provided a second view on the
LIIA in a different setting (in a low-cost and labor intensive industry). The thesis validated the usability
of the LIIA method and presented possible improvements of the prioritization part of the LICAM method.
Regarding the practical contribution it was aimed to support the operational organization of PPG’s
Amsterdam factory in making more valuable decisions on their asset’s future. The tool identified
strategic focus areas at the factory to prepare for future challenges. Moreover, an advice is given for a
strategic roadmap of PPG’s Amsterdam factory. In order to do so, the developed support tool prioritizes
lifetime impacts at PPG. Several challenges within asset management at PPG were identified by
studying company documents. After the interviews with key stakeholder of the asset decision-making
process it became visible that a good starting point for the development of the tool was to incorporate
the lifetime impact identification analysis at PPG’s Amsterdam factory. Nevertheless, not all relevant
challenges could be addressed by introducing the LIIA to the specific case of PPG. More literature was
studied and the tool was extended based on MCDA to prioritize the identified lifetime impacts.
The developed tool was tested with the Amsterdam based expert team and the results were validated
with the SBU Maintenance & Engineering department as well as with the Amsterdam plant
management. Before the Amsterdam based expert team made use of the support tool there was no
prioritization of lifetime impacts. They had an idea of the impacts affecting the factory in the future, but
they did not know explicitly on which impacts to focus first. Consequently, the support tool makes the
decision easier and provides the expert with a structured approach that can also be used to support
his/her decision in front of senior management. In the end, it will also save the expert time as he/she
will focus on the most important issues first. As the approach relies on expert knowledge it is possible
to incorporate information form multidisciplinary perspectives. That ensures that no important lifetime
impacts are overseen. When relying on expert knowledge there is always some subjectivity left in the
results that cannot be completely mitigated. Nevertheless, expert knowledge collected in a discussion
is a proven approach that generates valuable outcomes (i.e. see FMEA’s or the LIIA) and the model
shows results that were in consistency with key stakeholders’ opinion (i.e. the SBU Maintenance and

Master’s thesis Project
Page | 34
Engineering Manager’s opinion). By accounting for conflicting criteria, the lifetime impacts collected in
a multidisciplinary way all have an equal opportunity to be scored as highest priority. Therefore, it is
essential that the model can deal with multiple conflicting criteria. In order to do so, the AHP method
was introduced on the sub-criteria. AHP is able to deal with multiple conflicting criteria and scores the
alternatives based on the weight assigned to the criteria. This is an important scientific contribution to
improve the prioritization part of the LICAM. It thereby provides deeper insights into the exact impact
score. Moreover, by aligning the BSC to PPG’s strategic objectives the impact score better reflects the
strategic direction of the company and factory, and ultimately leads to better supported results.
The visualization in the end contributed to better understanding of the results by the experts. It will help
them to make better-supported decisions, and in making more specific decisions on individual criteria.
Together with the SBU Maintenance and Engineering manager the results were verified, and it was
decided that the support tool can also be used in a more generalized approach, for the 16 other
European factories of PPG. One limitation of the application at the Amsterdam factory was the fact that
there was no representative of the commercial perspective while prioritizing the lifetime impacts.
Certainly, that could have changed the results slightly in favor of commercial lifetime impacts and should
be kept in mind when designing business cases.
Generally, the tool helps the local team to expose important lifetime impacts in order to set the right
priorities. The discussion during the expert sessions facilitated information sharing and knowledge
exchange. Especially, the exchange of different views on lifetime impacts aided in a better
understanding of the multidisciplinary focus perspectives of the experts. One specific strength of the
model is that stakeholders are able to take time off their daily routine to be able to “break out” of daily
fire-fighting. This was certainly one of the main advantages of the expert sessions, because measures
to prepare better for the future can be initiated based on the results of the expert sessions.
Moreover, the implemented tool supports a more structured ALCM at PPG. Even though the LIIA was
originally designed for application at capital intensive industries, the adoption of this model at PPG
showed that it can also be applied in more labor-intensive industries. Only the identified lifetime impacts
vary slightly in those two cases. Whereas capital intensive industries, like the energy industry, have a
stronger focus on reliability and uptime of machines, PPG’s lifetime impacts focused more on
organizational matters, e.g. the shortage of skilled technicians. Another remark to the designed support
tool is that it was originally designed to help to guide to more effective asset investments. Considering
the technical lifetime impacts, the results can be used to introduce specific asset investment proposals,
i.e. machines with more automation. However, the tool ended up not being restricted to asset
investments but also incorporates strategic areas of the asset that call for improvement, named strategic
focus areas. Strategic focus areas can also mean to improve the organization around the asset instead
of making new investments. For example, by helping the local site team to design strategic objectives
for the factory. One problem which was encountered during the interviews indicated that some local
sites have trouble with creating a local vision for the factory. This can be viewed as an additional benefit
of the tool. Thus, it can be stated that the developed model supports PPG in making more effective
decisions regarding their assets and prepares their assets well for future challenges.

Master’s thesis Project
Page | 35
10.2 Limitations The asset decision support tool applied at PPG also revealed some limitations. First of all, the solution
strongly relies on qualitative expert knowledge, which can be seen as a limitation. Nevertheless, in such
a multidisciplinary practice there is not always reliable quantitative data available, so that relying on
qualitative data is the only option. Also, some might argue that this is also a strong suit of the tool, as
by combining knowledge and prioritizing it, all perspectives of the asset are accounted for, which is
hardly possible with data alone. On top of that, the tool is designed for the specific environment of PPG,
and might therefore not be easily applicable to other industries. There is a strong focus on organizational
lifetime impacts due to the high labor input ratio in the plants and the tool aligns with the corporate
strategic objectives, which will differentiate per organization.
Considering the testing of the solution design it revealed that the expert team scored the impact of EHS
compliance much higher than all other possible impacts. AHP allows in general for a compensation of
a bad score, which can be valuable. However, due to the strong focus on EHS compliance no
compensation of a bad score in EHS compliance was possible. Following, by valuing one perspective
exceptionally more important than all other perspectives no compensation of a bad score in this
perspective is possible. That certainly might have caused some bias in the results, and should be
accounted for when using the model. It can be seen as a limitation of the use of AHP in the model.
Finally, the scoring and weighing of the lifetime impacts are dynamic, meaning that this thesis
represents only a snapshot of the current situation. Importance of the lifetime impacts may change in
time, which this thesis cannot predict. Moreover, a change in the personnel participating in the expert
team could also change the results. The tool is therefore only a mirror of what PPG’s employees
experience at the moment, and does not incorporate the views of the external environment or other
experts in the organization. Hence, when conducting the analysis in another setting the conditions may
have changed, suggesting that the results could vary. The results of the application of the model at the
Amsterdam site are thereby not the same for all of PPG’s factories, all expert teams and can change
over time.
All in all, the tool still shows some limitations which should be considered when using the tool in another
environment.
10.3 Final recommendations First of all, important success factors of the support tool are:
1. To conduct the extended version of the LIIA in a cyclic manner on a yearly basis for the same
asset. Only then it can be assessed if important lifetime impacts are approached properly and
it can be ensured that no new essential lifetime impacts are overlooked. It is up to the problem
owner to initiate the sessions. That means, general commitment is a prerequisite for the
success of the tool.
2. To prepare the experts before the session well and provide enough background material to the
methodology and the assets performance. Then the time during the session can be used more
effectively. To meet with all the experts separately for preparation of the session is therefore
advisable.

Master’s thesis Project
Page | 36
3. To create stakeholder commitment and engagement is essential for the success of the
sessions. By encouraging the experts to exchange views during the session and providing the
chance to talk to other parts of the organization, with which the experts do not talk to on a
regular basis, a committed atmosphere was created. This is the main advantage of the model,
as it facilitates information sharing and widens the view of the experts, away from the daily fire-
fighting routine. Only then, the experts are able to make more effective decisions on the asset.
Facilitating information exchange is therefore crucial to the success and should be addressed
with extra effort.
For the future, in order to improve the support tool some final recommendations are given. As mentioned
before, Catrinu & Nordgård (2011) investigated that risks cannot be separated from the presence of
uncertainty in asset management. Hence, uncertainty should be accounted for in MCDA assessment
criteria and the uncertainty present in the collected data should also be included in the decision-making
model. One way to cope with uncertainty is by using sensitivity analysis. The estimated relevance of
each criterion can be varied in order to identify the impact of this variation on the end result (Niekamp
et al., 2015). Mostly, a few criteria can be determined that influence the whole system. Sensitivity
analysis is often applied in scenario planning to identify these criteria. Scenarios are used “in order to
simulate the consequences the decision alternatives might have in terms of the different criteria”
(Catrinu & Nordgård, 2011, p.665). In this way, it can be assessed to what extent certain output values
are dependent on the input criteria. With the help of a sensitivity analysis the most important and
significant criteria can be identified. To construct scenarios i.e. Monte Carlo Simulation can be used to
model chains of events (Catrinu & Nordgård, 2011). Summarizing, in order to make the developed
support tool even stronger scenarios can be incorporated in the model to perform sensitivity analysis.
This can be done by identifying scenarios in the external environment, and test in how far the results of
the prioritization of lifetime impacts would change with these scenarios (Figure 16). Scenarios are added
to the artifact in the grey rectangles. It is recommended to use scenarios in the future when applying
the tool at other factories of PPG. However, it was out of the scope of this research project.
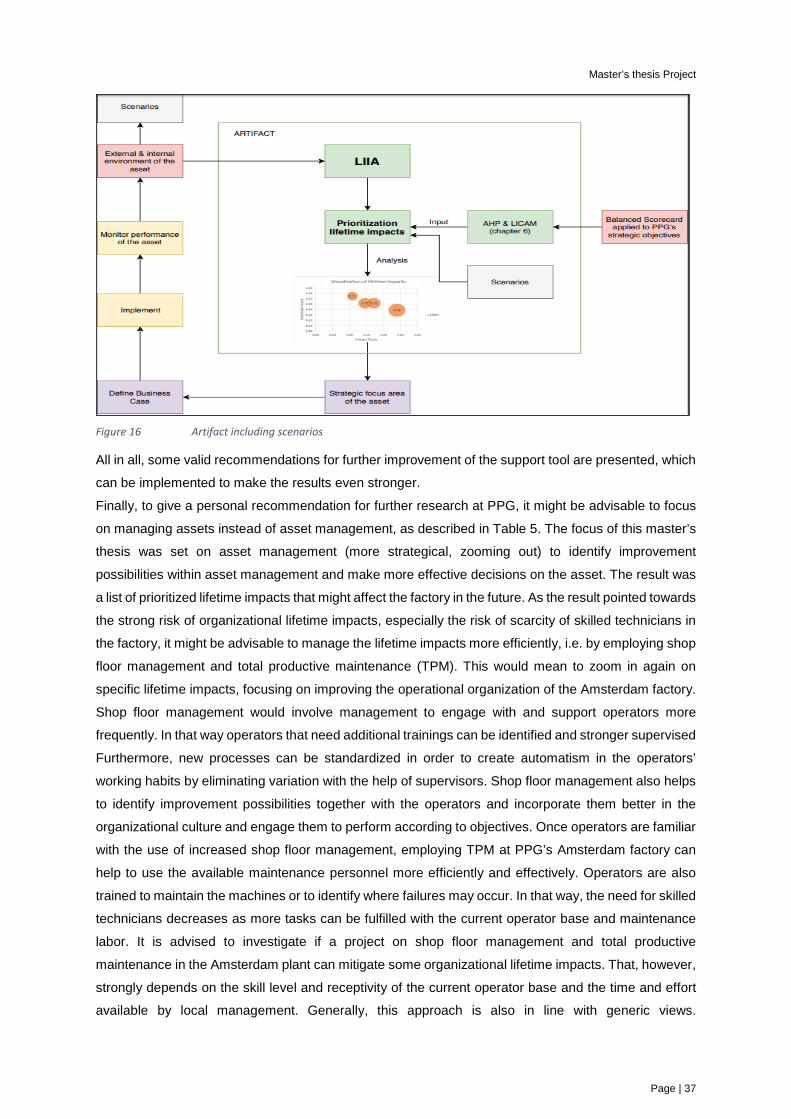
Master’s thesis Project
Page | 37
Figure 16 Artifact including scenarios
All in all, some valid recommendations for further improvement of the support tool are presented, which
can be implemented to make the results even stronger.
Finally, to give a personal recommendation for further research at PPG, it might be advisable to focus
on managing assets instead of asset management, as described in Table 5. The focus of this master’s
thesis was set on asset management (more strategical, zooming out) to identify improvement
possibilities within asset management and make more effective decisions on the asset. The result was
a list of prioritized lifetime impacts that might affect the factory in the future. As the result pointed towards
the strong risk of organizational lifetime impacts, especially the risk of scarcity of skilled technicians in
the factory, it might be advisable to manage the lifetime impacts more efficiently, i.e. by employing shop
floor management and total productive maintenance (TPM). This would mean to zoom in again on
specific lifetime impacts, focusing on improving the operational organization of the Amsterdam factory.
Shop floor management would involve management to engage with and support operators more
frequently. In that way operators that need additional trainings can be identified and stronger supervised
Furthermore, new processes can be standardized in order to create automatism in the operators’
working habits by eliminating variation with the help of supervisors. Shop floor management also helps
to identify improvement possibilities together with the operators and incorporate them better in the
organizational culture and engage them to perform according to objectives. Once operators are familiar
with the use of increased shop floor management, employing TPM at PPG’s Amsterdam factory can
help to use the available maintenance personnel more efficiently and effectively. Operators are also
trained to maintain the machines or to identify where failures may occur. In that way, the need for skilled
technicians decreases as more tasks can be fulfilled with the current operator base and maintenance
labor. It is advised to investigate if a project on shop floor management and total productive
maintenance in the Amsterdam plant can mitigate some organizational lifetime impacts. That, however,
strongly depends on the skill level and receptivity of the current operator base and the time and effort
available by local management. Generally, this approach is also in line with generic views.

Master’s thesis Project
Page | 38
First, zooming out to understand the bigger picture and afterwards zooming in again on the critical areas
for improvement.
10.4 General conclusion internship assignment PPG During the six months internship period at PPG I learned a lot about the organization of such a large
corporation as PPG. Due to the complexity of the organization and the information overload in the
beginning it took some time until a structure and plan of approach for the project was determined. With
so many different stakeholders (possibly) involved in the project, the first important lesson I learned was
to prioritize: which information is relevant for my project and what falls out of the scope of the
assignment? Which employees do I have to involve at what stage of the project in order to make most
progress? Most of the time it showed that doing less and structure the content as simple as possible
would gain the most for the project, the stakeholders and the organization. Moreover, establishing a
project plan and trying to stay within this charter really benefited the progress. Especially, in such large
organizations organizing personal meetings (expert sessions) with a multidisciplinary team was one of
the main challenges. Sometimes I had to wait one to two months until the next possible meeting with
everyone present could take place. That also meant to be more flexible with other tasks, by shifting
tasks and learning to work proactively. Moreover, the design of the tool still evolved during the course
of the project, meaning it is important to not lose an overview. On top of that, I learned how models
studied at University can be applied in practice. Studying the LIIA and AHP method and trying to apply
it with the Amsterdam based expert team really let me see where the benefits of these methods are.
As an information facilitator I had a special function and could view the team interaction more from a
distance. The main advantage of those sessions was knowledge exchange in a multidisciplinary team
and discussion about critical topics to see where the factory could benefit from in the future.
Even though I was also skeptical in the beginning to prioritize lifetime impacts in a rather qualitative
manner, I was surprised how reliable and consistent the tool performed in practice. Also, the feedback
from all participants showed that the designed support tool for PPG can really help the factory in setting
the right priorities for the future. Finally, I made the experience that not all circumstances are always as
straightforward as they look from the outside. PPG is a labor-intensive company, which means that
optimizing the reliability of equipment not necessarily lowers the overall costs so much. Situations in
practice are often more complex, with a lot of influencing factors to consider, indicating that finding a
simple, straightforward solution to the problem is not always possible. Generally, I had a good time
during my internship at PPG, especially for a first practical experience at a company everyone was very
supportive and patient with me. It certainly facilitated my personal development as well as I got
toughened a lot for my further career.

Master’s thesis Project
Page | 39
REFERENCES
Agle, B. R., Mitchell, R. K., & Sonnenfeld, J. A. (1999). Who matters to CEOs? An investigation of stakeholder attributes and salience, corporate performance, and CEO values. Academy of Management Journal, 42(5), 507–525.
Akkermans, H., Besselink, L., van Dongen, L., & Schouten, R. (2016). Smart moves for smart maintenance. World Class Maintenance, (December), 82.
Al-Harbi, K. M. A.-S. (2001). Application of the AHP in project management. International Journal of Project Management, 19, 19–27.
Alsyouf, I. (2006). Measuring maintenance performance using a balanced scorecard approach. Journal of Quality in Maintenance Engineering, 12(2), 133–149. https://doi.org/10.1108/13552510610667165
Anthony Cox, L. (2008). What’s wrong with risk matrices? Risk Analysis, 28(2), 497–512. https://doi.org/10.1111/j.1539-6924.2008.01030.x
Bachmann, T. (2013). Towards life cycle sustainability assessment: Drawing on the NEEDS project’s total cost and multi-criteria decision analysis ranking methods. The International Journal of Life Cycle Assessment, 18(9).
Bond, S. D., Carlson, K. A., & Keeney, R. L. (2008). Generating Objectives: Can Decision Makers Articulate What They Want? Management Science, 54(1), 56–70. https://doi.org/10.1287/mnsc.1070.0754
Braaksma, A. J. J. (2016). Maintenance Engineering & Management - Lecture 10: Asset Management. Enschede.
Brenchley, R. (2000). Project report to understand how trade compliance risk should be identified, assessed and managed in increasingly dis-integrated global supply networks at Hewlett Packard.
Bruno, J. (2018). PPG Investor Overview. Buskermolen, A. (2010). Deferred maintenance estimation procedure. Buskermolen, A. (2013). Bringing maintenance to the surface: An Asset Management Framework for
PPG Coatings. The University of Manchaster. Buskermolen, A. (2018a). Personal Communication - 09/04/18. Uithoorn. Buskermolen, A. (2018b). Personal Communication - 16/04/18. Uithoorn. Buskermolen, A. (2018c). Personal Communication - 19/04/18. Uithoorn. Campbell, J., Jardine, A., & McGlynn, J. (2016). Asset management excellence: optimizing equipment
life-cycle decisions. Retrieved from https://books.google.nl/books?hl=nl&lr=&id=W96gu5XqM50C&oi=fnd&pg=PP1&dq=campbell+asset+management+excellence&ots=NkqXSIRbzh&sig=DJ7uyiYXC6j0pQzApwZwYV_hKXI
Catrinu, M. D., & Nordgård, D. E. (2011). Integrating risk analysis and multi-criteria decision support under uncertainty in electricity distribution system asset management. In Reliability Engineering and System Safety (Vol. 96, pp. 663–670). https://doi.org/10.1016/j.ress.2010.12.028
Denyer, D., Tranfield, D., & van Aken, J. E. (2008). Developing Design Propositions through Research Synthesis. Organization Studies, 29(3), 393–413. https://doi.org/10.1177/0170840607088020
Haarman, M., & Delahay, G. (2016). Value Driven Maintenance & Asset Management XL. Dordrecht, the Netherlands.
Hevner, March, Park, & Ram. (2004). Design Science in Information Systems Research. MIS Quarterly, 28(1), 75. https://doi.org/10.2307/25148625
Holmström, J., Ketokivi, M., & Hameri, A.-P. (2009). Bridging Practice and Theory: A Design Science Approach. Decision Sciences, 40(1), 65–87. https://doi.org/10.1111/j.1540-5915.2008.00221.x
IHS Markit. (2017). Paint and Coatings Industry Overview - Chemical Economics Handbook (CEH) | IHS Markit. Retrieved April 30, 2018, from https://ihsmarkit.com/products/paint-and-coatings-industry-chemical-economics-handbook.html
International Organization for Standardization. (2014). ISO 55000 - Asset Management. Geneva, Switzerland.
ISO/TC251. (2017). Managing Assets in the context of Asset Management.
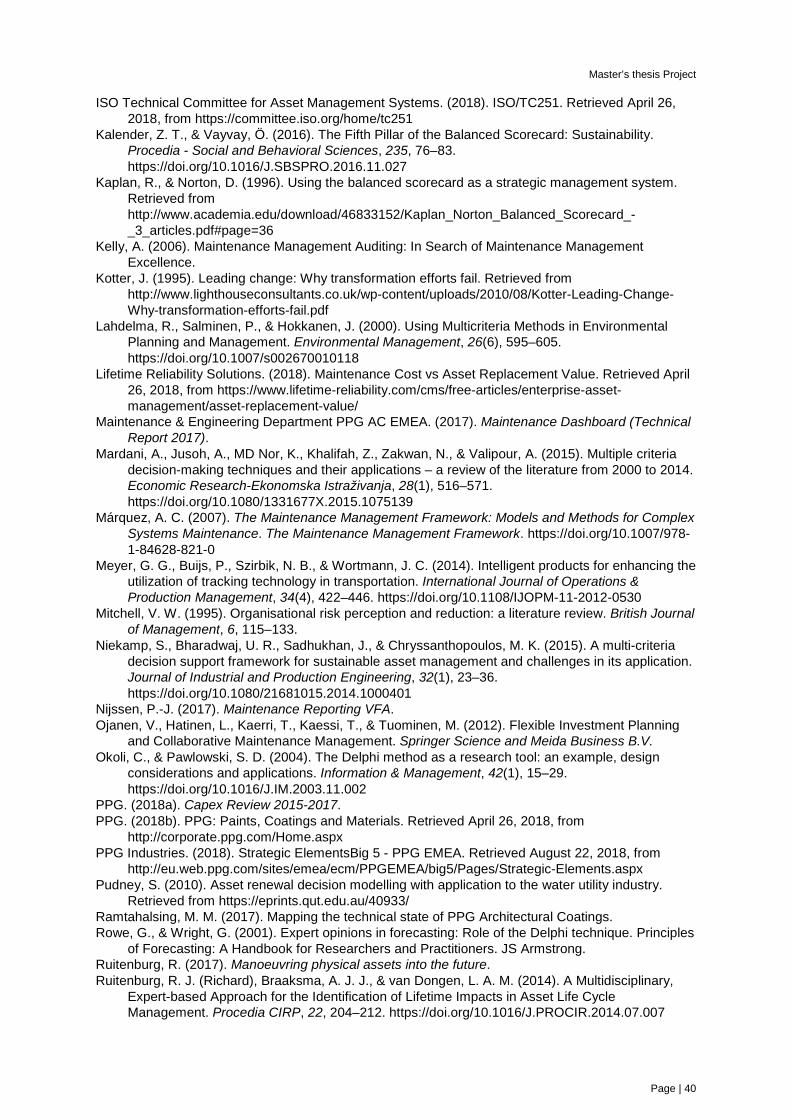
Master’s thesis Project
Page | 40
ISO Technical Committee for Asset Management Systems. (2018). ISO/TC251. Retrieved April 26, 2018, from https://committee.iso.org/home/tc251
Kalender, Z. T., & Vayvay, Ö. (2016). The Fifth Pillar of the Balanced Scorecard: Sustainability. Procedia - Social and Behavioral Sciences, 235, 76–83. https://doi.org/10.1016/J.SBSPRO.2016.11.027
Kaplan, R., & Norton, D. (1996). Using the balanced scorecard as a strategic management system. Retrieved from http://www.academia.edu/download/46833152/Kaplan_Norton_Balanced_Scorecard_-_3_articles.pdf#page=36
Kelly, A. (2006). Maintenance Management Auditing: In Search of Maintenance Management Excellence.
Kotter, J. (1995). Leading change: Why transformation efforts fail. Retrieved from http://www.lighthouseconsultants.co.uk/wp-content/uploads/2010/08/Kotter-Leading-Change-Why-transformation-efforts-fail.pdf
Lahdelma, R., Salminen, P., & Hokkanen, J. (2000). Using Multicriteria Methods in Environmental Planning and Management. Environmental Management, 26(6), 595–605. https://doi.org/10.1007/s002670010118
Lifetime Reliability Solutions. (2018). Maintenance Cost vs Asset Replacement Value. Retrieved April 26, 2018, from https://www.lifetime-reliability.com/cms/free-articles/enterprise-asset-management/asset-replacement-value/
Maintenance & Engineering Department PPG AC EMEA. (2017). Maintenance Dashboard (Technical Report 2017).
Mardani, A., Jusoh, A., MD Nor, K., Khalifah, Z., Zakwan, N., & Valipour, A. (2015). Multiple criteria decision-making techniques and their applications – a review of the literature from 2000 to 2014. Economic Research-Ekonomska Istraživanja, 28(1), 516–571. https://doi.org/10.1080/1331677X.2015.1075139
Márquez, A. C. (2007). The Maintenance Management Framework: Models and Methods for Complex Systems Maintenance. The Maintenance Management Framework. https://doi.org/10.1007/978-1-84628-821-0
Meyer, G. G., Buijs, P., Szirbik, N. B., & Wortmann, J. C. (2014). Intelligent products for enhancing the utilization of tracking technology in transportation. International Journal of Operations & Production Management, 34(4), 422–446. https://doi.org/10.1108/IJOPM-11-2012-0530
Mitchell, V. W. (1995). Organisational risk perception and reduction: a literature review. British Journal of Management, 6, 115–133.
Niekamp, S., Bharadwaj, U. R., Sadhukhan, J., & Chryssanthopoulos, M. K. (2015). A multi-criteria decision support framework for sustainable asset management and challenges in its application. Journal of Industrial and Production Engineering, 32(1), 23–36. https://doi.org/10.1080/21681015.2014.1000401
Nijssen, P.-J. (2017). Maintenance Reporting VFA. Ojanen, V., Hatinen, L., Kaerri, T., Kaessi, T., & Tuominen, M. (2012). Flexible Investment Planning
and Collaborative Maintenance Management. Springer Science and Meida Business B.V. Okoli, C., & Pawlowski, S. D. (2004). The Delphi method as a research tool: an example, design
considerations and applications. Information & Management, 42(1), 15–29. https://doi.org/10.1016/J.IM.2003.11.002
PPG. (2018a). Capex Review 2015-2017. PPG. (2018b). PPG: Paints, Coatings and Materials. Retrieved April 26, 2018, from
http://corporate.ppg.com/Home.aspx PPG Industries. (2018). Strategic ElementsBig 5 - PPG EMEA. Retrieved August 22, 2018, from
http://eu.web.ppg.com/sites/emea/ecm/PPGEMEA/big5/Pages/Strategic-Elements.aspx Pudney, S. (2010). Asset renewal decision modelling with application to the water utility industry.
Retrieved from https://eprints.qut.edu.au/40933/ Ramtahalsing, M. M. (2017). Mapping the technical state of PPG Architectural Coatings. Rowe, G., & Wright, G. (2001). Expert opinions in forecasting: Role of the Delphi technique. Principles
of Forecasting: A Handbook for Researchers and Practitioners. JS Armstrong. Ruitenburg, R. (2017). Manoeuvring physical assets into the future. Ruitenburg, R. J. (Richard), Braaksma, A. J. J., & van Dongen, L. A. M. (2014). A Multidisciplinary,
Expert-based Approach for the Identification of Lifetime Impacts in Asset Life Cycle Management. Procedia CIRP, 22, 204–212. https://doi.org/10.1016/J.PROCIR.2014.07.007
Master’s thesis Project
Page | 41
Saaty, T. L. (1990). How to make decision: the analytic hierachy process. European Journal of Operations Research.
Saaty, T. L. (2003). Decision-making with the AHP: Why is the principal eigenvector necessary. European Journal of Operational Research, 145(1), 85–91. https://doi.org/10.1016/S0377-2217(02)00227-8
Saaty, T. L. (2013). Analytic Hierarchy Process. In Encyclopedia of Operations Research and Management Science (pp. 52–64). Boston, MA: Springer US. https://doi.org/10.1007/978-1-4419-1153-7_31
Slack, N., Chambers, S., & Johnston, R. (2010). Operations management. Retrieved from https://books.google.nl/books?hl=nl&lr=&id=ZhLBcfUXaNwC&oi=fnd&pg=PT28&dq=Slack,+N.,+Chambers,+S.,+Johnston,+R.+(2010).+Operations+management.&ots=5iqWuILkkz&sig=CxwK0Uf7roQIYYC3xIzipXRQ2As
Smith, A., & Hinchcliffe, G. (2003). RCM - Gateway to Worldclass Maintenance. Elsevier. Spruijt, R. (2018a). Interview - 28/05/18. Spruijt, R. (2018b). Personal Communication - 10/04/18. Uithoorn. Symbol Business Improvement. (2014). Project Management. ten Have, E. (2018). Personal Communication - 24/04/18. Uithoorn. The Royal Society. (1992). Risk: Analysis, Perception, Management. London. Tinga, T. (2013). De dynamiek van onderhoud. van Aken, J., Chandrasekaran, A., & Halman, J. (2016). Conducting and publishing design science
research: Inaugural essay of the design science department of the Journal of Operations Management. Journal of Operations Management, 47–48, 1–8. https://doi.org/10.1016/J.JOM.2016.06.004
van Aken, J. E., Berends, H., & van der Bij, H. (2007). Problem Solving in Organisations, a methodological handbook for business students. Cambridge: Cambridge University Press.
Wang, J.-J., Jing, Y.-Y., Zhang, C.-F., & Zhao, J.-H. (2009). Review on multi-criteria decision analysis aid in sustainable energy decision-making. Renewable and Sustainable Energy Reviews, 13(9), 2263–2278. https://doi.org/10.1016/J.RSER.2009.06.021
Weir, J. P. (2005). Quantifying test-retest reliability using the intraclass correlation coefficient and the SEM. Journal of Strength and Conditioning Research, 19(1), 231–240. https://doi.org/10.1519/15184.1
Wireman, T. (2004). Total Productive Maintenance. Industrial Press Inc. Zavadskas, E. K., Turskis, Z., & Kildienė, S. (2014). STATE OF ART SURVEYS OF OVERVIEWS ON
MCDM/MADM METHODS. Technological and Economic Development of Economy, 20(1), 165–179. https://doi.org/10.3846/20294913.2014.892037

Master’s thesis Project
Page | 42

Master’s thesis Project
Page | 43
11 APPENDICES
A.1 The paint production process
Figure 17 Visualization of the paint production process

Master’s thesis Project
Page | 44
In order to sketch the context, the paint production process is introduced next. The main ingredients to
make paint are binders (to homogenize the mixture), solvents (so it can be applied to a surface – they
will evaporate out after usage), fillers (that create the hiding power), pigments (for different colors), and
additives (that control many other paint performance criteria, like surface tension) (Buskermolen, 2013).
In general, the paint production process can be divided into two major stages – the production process
and the packaging & filling process. In the production process, all the above listed raw materials are
mixed together in the so-called dispersion process until a homogenous mixture with the correct powder
particle size and particle size distribution is achieved. For some high-quality products additional grinding
is done in the bead mill. The bead mill is one of the most advanced machines of the factory, and is also
really sensitive to wear (ten Have, 2018). Mostly, the variability in products can be achieved by the
amount and kind of pigments and additives used, as well as the time and speed spent in the disperser
/ bead mill. In the finishing tank some adjustments can still be made to the paint. Eventually, it is stored
in bulk tanks from which it can be discharged into the filling stations. There is a quality control step
before the filling process to guarantee customer satisfaction. At the filling lines the paint is filled into
different cans and packaged, so it can be delivered to the DCA, where it is stored until shipment. The
filling and packaging lines are semi-automated and fully-automated machines. Tinting10 can take place
during several steps in the supply chain - during production, at the warehouse or at the retailer. In case
of “ready-mix paint”, where the tinting is done during production, the production lines of white and
colored paint are strictly separated (Buskermolen, 2013; ten Have, 2018). A visualization of paint
production process can be seen in Figure 17.
10 Tinting is the process where color is added to the base paint.

Master’s thesis Project
Page | 45
A.2 Operations performance objectives Since physical assets of a company often consist of equipment that has to perform to keep the operation
running, the so-called operations performance objectives (Slack, Chambers, & Johnston, 2010)
could be applied as well. As identified by Slack et al. (2010) those performance objectives are quality
(to do things right – fit for purpose standard), speed (to do things fast – availability), dependability (to
do things on time – anticipate customer demand), flexibility (to be able to change the process when
unforeseen circumstances arise) and costs (to do things cheap). Based on these performance
objectives an operations manager assesses the success of the production process. The five
performance objectives, general internal and external benefits can be seen in Table 10.
Table 10 Internal and external benefits of excelling at performance objectives (Chaudhuri, 2014).
Performance objective
Potential internal benefit Potential external benefit
Quality • Error free processes
• More internal reliability
• Lower processing costs
• Error free products and services
• Reliable products and services
Speed • Faster throughput times
• Less inventory
• Lower processing costs
• Short delivery times
• Fast response to request
Dependability • Fewer contingencies needed
• More internal stability
• Lower processing costs
• On-time delivery of products and
services
• Knowledge of delivery times
Flexibility • Better response to
unpredicted events
• Frequent launch of new
products and services
• Wide range of products and
services
• Easier volume adjustments
• Easier delivery adjustments
Cost • Productive processes
• Higher margins
• Lower prices
Hence, this approach could also be adopted to determine the effect of a lifetime impact in terms of the
five perspectives. To visualize it can be quantified and plotted in a polar representation similar to the
one shown in Figure 18. This would help to evaluate on which performance areas the lifetime impact
has the most effect, and to validate with management. Nevertheless, it is rather difficult to compare all
identified impacts in such a figure, so a pre-prioritization has to take place. Moreover, it focuses solely
on operations objectives, thereby forgetting about the business objectives. Especially due to the
multidisciplinary focus of lifetime impacts, their effect on the business might be more important only
considering the effect on operations. One dominant challenge that was identified was the need to

Master’s thesis Project
Page | 46
translate the problems in operations into terms well understood by general management. This is
certainly the main disadvantage of the operations performance objectives, as they do not translate the
effect of a lifetime impact into managerial terms. Thus, the operations performance objectives might be
a good approach to support the decision-making tool, but should not be the main focus of impact
perspectives.
Figure 18 Polar representation of five performance objectives. Example of the scoring differences
between a taxi and a bus service (Slack et al., 2010).

Master’s thesis Project
Page | 47
A.3 Multi criteria decision analysis MCDA is usually structured as follows (Wang et al., 2009); first, a number of alternative solutions is
identified (in this case lifetime impacts). Each alternative solution receives a score on a number of
criteria (for example risks or costs). This can be expressed in an m x n decision matrix, where the
performance score xij is composed of the ith alternative Ai, scoring on the jth criterion Cj (m= number of
alternatives, n= number of criteria). Each criterion Cj can have a certain weight wj.
• Criteria: C1 C2 ... Cn
(weights: w1 w2 ... wn)
• Alternatives: A1 A2 ... An
• X = �𝑥𝑥11 ⋯ 𝑥𝑥1𝑛𝑛⋮ ⋱ ⋮
𝑥𝑥𝑚𝑚1 ⋯ 𝑥𝑥𝑚𝑚𝑛𝑛�
Criteria Criteria provide a specific metric for showing progress towards the overall goal. The decision-maker
has to balance multiple criteria to come to a (nearly) optimal decision. Criteria in prioritizing lifetime
impacts on an asset could be for example the listed balanced scorecard elements(Kaplan & Norton,
1996), the operational performance objectives by Slack et al. (2010), risks and/or costs. Categorization
of the criteria is often performed, but has to be used with caution because assigning the criteria to one
category is not easily done, and can lead to inconsistency (Bachmann, 2013). Therefore, criteria are
required to be complete, concise, unambiguous and direct. However, to reach all of this combined is
not always possible. Some trade-offs between the characteristics have to be made, and the compromise
should be communicated well (Lahdelma, Salminen, & Hokkanen, 2000). Furthermore, Bond, Carlson,
& Keeney (2008) point out the importance to involve stakeholders from an early stage, in order to identify
the best fitting criteria and objectives for the company.
Weighting Weighting is used to prioritize the different criteria according to their importance on the overall goal.
There are different ways to weight the relative impact of the criteria on the overall goal. Since weights
directly influence the results of the decision-making tool, they have to be obtained in a rational way.
Roughly, the distinction can be made between equal weighting and rank-order weighting methods
(Wang et al., 2009). This research is focusing on rank-order weighting methods, because equal
weighting methods ignore the relative importance among criteria. To obtain a certain objectivity in the
weighting factors the consistency and sensitivity of the data can be evaluated. Consistency between
stakeholders’ opinions and the consistency between the assigned weights can be evaluated by applying
the consistency index (CI) (T.L. Saaty, 1990; Thomas L. Saaty, 2003) or calculating the interclass
correlation coefficient (ICC) (Weir, 2005).

Master’s thesis Project
Page | 48
A.4 Multi Attribute Utility Theory Multi Attribute Utility Theory (MAUT) is a multi-criteria decision technique that translates different units
into one common utility to be able to compare them. Comparison between different criteria is done by
assigning weights to the criteria depending on the level of importance. The utility assigned to the criteria
varies on a scale from zero to one (zero being lowest performance, one being highest performance).
MAUT is the most frequently used method, especially to model preference under uncertainty (Catrinu
& Nordgård, 2011). A very similar technique, is the Multi Attribute Value Theory (MAVT), which assigns
values instead of utilities. Typically, these values are restricted to one-digit numbers so that final scores
do not get too high. Nevertheless, the simplest version of MAUT (by adding all the products) resembles
MAVT. This simple (additive) version of MAVT is constructed as follows:
𝑉𝑉(𝐴𝐴𝑖𝑖) = �𝑤𝑤𝑘𝑘𝑣𝑣𝑘𝑘(𝑎𝑎𝑖𝑖𝑘𝑘)𝑛𝑛
𝑘𝑘=1
,𝑤𝑤𝑅𝑅𝑤𝑤ℎ
• 𝑉𝑉(𝐴𝐴𝑖𝑖) = 𝑣𝑣𝑎𝑎𝑙𝑙𝑣𝑣𝑣𝑣 𝑓𝑓𝑣𝑣𝑓𝑓𝑓𝑓𝑤𝑤𝑅𝑅𝑙𝑙𝑓𝑓 𝑙𝑙𝑓𝑓 𝐴𝐴𝑙𝑙𝑤𝑤𝑣𝑣𝐴𝐴𝑓𝑓𝑎𝑎𝑤𝑤𝑅𝑅𝑣𝑣𝑣𝑣 𝑅𝑅
• 𝑤𝑤𝑘𝑘 = 𝑤𝑤𝑣𝑣𝑅𝑅𝑤𝑤ℎ𝑤𝑤 𝑙𝑙𝑓𝑓 𝑓𝑓𝐴𝐴𝑅𝑅𝑤𝑤𝑣𝑣𝐴𝐴𝑅𝑅𝑎𝑎 𝑅𝑅
• 𝑣𝑣𝑘𝑘 = 𝑣𝑣𝑎𝑎𝑙𝑙𝑣𝑣𝑣𝑣 𝑙𝑙𝑓𝑓 𝑓𝑓𝐴𝐴𝑅𝑅𝑤𝑤𝑣𝑣𝐴𝐴𝑅𝑅𝑎𝑎 𝑅𝑅
• 𝑣𝑣𝑘𝑘(𝑎𝑎𝑖𝑖𝑘𝑘) = 𝑅𝑅𝑓𝑓𝑙𝑙𝐴𝐴𝑣𝑣 𝑙𝑙𝑓𝑓 𝑎𝑎𝑙𝑙𝑤𝑤𝑣𝑣𝐴𝐴𝑓𝑓𝑎𝑎𝑤𝑤𝑅𝑅𝑣𝑣𝑣𝑣 𝑅𝑅 𝑙𝑙𝑓𝑓 𝑓𝑓𝐴𝐴𝑅𝑅𝑤𝑤𝑣𝑣𝐴𝐴𝑅𝑅𝑎𝑎 𝑅𝑅
The value function is then used to calculate the alternative with the highest overall value, and this is
recommended to the decision-maker as best alternative (Catrinu & Nordgård, 2011). MAUT/MAVT is a
powerful technique in MCDA provided that the expert, who determines the scores, is rational and
knowledgeable. Many authors use MAUT/MAVT as an MCDA framework, for example Niekamp et al.
(2015) and Catrinu & Nordgård (2011).
MAUT/MAVT are very simple to use, especially in the simple additive form. One of the main advantages
is its ease of use and the fact that it can be easily adapted or extended when new information comes
to the surface. Nevertheless, this technique also has its disadvantages, namely:
• The decision-maker must be rational and knowledgeable about the asset.
• MAVT is not always able to cope with uncertainty, i.e. if preferences are not well specified.
It can be concluded that MAUT/MAVT could be used in the specific case of PPG, as long as the
decision-maker can be sure that the expert evaluating the score is knowledgeable enough. However,
AHP was found to be a better fit, hence MAUT/MAVT was not used for the prioritization as main tool.
Nevertheless, the sub-criteria are added together to the final impact score by applying MAUT.

Master’s thesis Project
Page | 49
A.5 AHP explanation of steps First, AHP decomposes a complex decision problem with several (levels) of criteria into a more
structured “hierarchy tree”. The “hierarchy tree” is divided into the goal of the decision (top layer), with
the criteria (and sub-criteria) in the level(s) below, and depicting the decision alternatives at the bottom
of the tree. A visualization of the “hierarchy tree” can be seen in Figure 19.
Figure 19 "Hierarchy tree", decomposition of a problem into a hierarchy.
As can be seen, it does not matter how many criteria and sub-criteria are evaluated, and also not if
each criterion has (the same number of) sub-criteria. In the end, the relative importance of a (sub-)
criterion on the overall goal is obtained.
Pairwise comparison is used to determine the weights for every criterion (T.L. Saaty, 1990). When
comparing n criteria with each other, the following matrix can be formed in order to do so:
𝐷𝐷 = �𝐶𝐶1/𝐶𝐶1 ⋯ 𝐶𝐶1/𝐶𝐶𝑛𝑛⋮ ⋱ ⋮
𝐶𝐶𝑛𝑛/𝐶𝐶1 ⋯ 𝐶𝐶𝑛𝑛/𝐶𝐶𝑛𝑛�
The relative importance of each criterion compared to every other one can be evaluated with the help
of a scale, similar to the one in the appendix established by (T.L. Saaty, 1990) (A.5 AHP ). Based on
the matrix and the scale the weights for the criteria can be calculated. The weights show traits of
objective measures and subjective preferences and are therefore quite powerful (Márquez, 2007). After
the weights are obtained each performance score of the criteria is multiplied with its weight to generate
local priorities with respect to the parent. After that, all the weighted scores of one hierarchy level are
summed together to get the final performance score for the parent. The technique can also be
categorized as a type of weighted sum methods (Wang et al., 2009).
The same procedure will be repeated for all hierarchy levels until a global performance score for each
alternative is evaluated. In the end, this hierarchic composition establishes priorities for each alternative
(Márquez, 2007). In general, the alternative with the highest overall score is the best alternative.
In more detail, Al-Harbi (2001) describes a seven step approach of how to apply AHP, based on (Saaty,
1990). This approach will also be applied in this master’s thesis, and can be summarized as follows:
1. Define the problem and determine the goal
2. Structure the hierarchy tree:

Master’s thesis Project
Page | 50
a. On top the overall goal from a decision-maker’s perspective.
b. In the intermediate levels the criteria on which the next following level(s) depend.
c. The lowest level shows the list of alternatives.
3. Construction of the pair-wise comparison matrices (n x n) for each of the lower level(s) with one
matrix with the parent element by using relative scale measurement shown in Table 12. Pair-
wise comparison is performed to assess which element dominates the other.
4. Per matrix there are 𝑓𝑓 ∗ (𝑓𝑓 − 1) judgements required. Reciprocals are automatically assigned.
5. When the reciprocal matrix is generated the weights can be determined:
a. Sum each column of the reciprocal matrix.
b. Divide each element of the matrix with the sum of its column to get the normalized
relative weights.
c. The normalized “Eigenvector” (also called priority vector) is obtained by averaging
across rows.
d. The priority vector gives the relative weight among the criteria. The sum of all priority
vectors per level adds up to 1.
To create hierarchical synthesis the weight of each parent will be multiplied with the lower level
weight of each criterion.
6. The consistency is determined by using the eigenvector, 𝜆𝜆𝑚𝑚𝑎𝑎𝑎𝑎, to calculate the CI
a. 𝐶𝐶𝐶𝐶 = 𝜆𝜆𝑚𝑚𝑚𝑚𝑚𝑚−𝑛𝑛𝑛𝑛−1
,𝑓𝑓 = 𝑚𝑚𝑎𝑎𝑤𝑤𝐴𝐴𝑅𝑅𝑥𝑥 𝑅𝑅𝑅𝑅𝑠𝑠𝑣𝑣
Judgement consistency can be checked by taking the consistency ratio (CR)
a. 𝐶𝐶𝑅𝑅 = 𝐶𝐶𝐶𝐶𝑅𝑅𝐶𝐶
,𝑅𝑅𝐶𝐶 = 𝑎𝑎𝑣𝑣𝑣𝑣𝐴𝐴𝑎𝑎𝑤𝑤𝑣𝑣 𝐴𝐴𝑎𝑎𝑓𝑓𝑟𝑟𝑙𝑙𝑚𝑚 𝑓𝑓𝑙𝑙𝑓𝑓𝑅𝑅𝑅𝑅𝑅𝑅𝑤𝑤𝑣𝑣𝑓𝑓𝑓𝑓𝑐𝑐, Table 11. The CR is acceptable if it does
not exceed 0.10. If the result is inconsistent then judgements should be reviewed and
improved. Table 11 Average random consistency (RI), (T.L. Saaty, 1990)
Size matrix 1 2 3 4 5 6 7 8 9 Random consistency
0 0 0.58 0.9 1.12 1.24 1.32 1.41 1.45
7. Step 3-6 are performed for all the levels in the hierarchy.
The main advantages of AHP are:
• Increase in accuracy and consistency compared to other qualitative methods.
• Subjective judgements are quantified in a structured way.
o Pairwise comparison allows for judging each criteria pair separately, without
considering the influence of other criteria on the relationship.
• Can cope with complexity, uncertainty and interdependencies between (sub-) criteria.
• A “bad score” on one criterion can be compensated by a “good score” on another criterion.
The main disadvantage of AHP is the computational effort, as the number of pairwise comparisons
increases exponentially with an increase in criteria.

Master’s thesis Project
Page | 51
Table 12 Pairwise comparison table
Intensity of importance
Definition Explanation
1 Equal importance Two criteria contribute equally to objective
3 Moderate importance of one over
another
Experience and judgement slightly favor one
criterion over another
5 Essential or strong importance Experience and judgement strongly favor one
criterion over another
7 Very strong importance A criterion is favored very strongly over
another; its dominance is demonstrated in
practice
9 Extreme importance The evidence favoring one criterion over
another is of the highest possible order of
affirmation
2,4,6,8 Intermediate values between the
two adjacent judgements
Used to represent compromise between the
priorities listed above
Reciprocals If criterion i has one of the above non-zero numbers assigned to it when compared
to criterion j, then j has the reciprocal value when compared with criterion i
Ratios Ratios arising from the scale If consistency were to be forced by obtaining n
numerical values to span the matrix

Master’s thesis Project
Page | 52
A.6 Semi-structured interview to identify the problem Short introduction to the project: I am a graduation student from the University of Twente at the program industrial engineering and
management. My assignment is designing a decision-making tool to prioritize for lifetime impacts at
PPG AC EMEA. Therefore, I would like to find out more about the current asset decision-making
process and the current problems that can hinder asset investment opportunities. In this context assets
are defined as physical assets, i.e. paint factories or warehouses.
Short introduction interviewee:
1. Function
2. Job responsibilities
3. Knowledge of the asset/ involvement with the asset (population)
Problem exploration: Do you have a clear view on the current asset decision-making process? What do you think can be improved in the current asset decision-making process? To what extent are the following important obstacles in the current asset decision-making process (to
guide to more effective asset investments)?
1. PPG’s short-term focus is the result of the business trying to create shareholder value in
the short term, which sometimes blocks processes to anticipate risks further ahead, thereby
limiting the ability to focus on long-term and strategic asset investment projects.
2. The mature market structure of the paint and coatings industry in Europe limits the financial
incentive for new asset investments.
3. The asset utilization of around 60-70% (leaving unused capacity) in the factory makes new
asset investment projects hard to justify.
4. There is no overview of the impact of factory life cycle costs on current and future business
profitability.
5. Current asset projects are lacking a multidisciplinary focus by including all relevant
elements (i.e. technical, economic, commercial, compliance and organizational).Moreover,
information for the asset process is dispersed over different departments.
6. The quality and reliability of quantitative data is too limited to decide for the exact end of
lifetime of the asset.
Do you see any other obstacles that are relevant in the asset decision-making process?
Do you want to add something which has not been discussed yet?

Master’s thesis Project
Page | 53
A.7 Semi-structured interview to identify criteria for the decision-making tool Aspects of the decision-making tool For the decision-making tool so-called lifetime impacts will be identified. Lifetime impacts are trends or
events that may have a positive or negative influence on the remaining lifetime of the asset. The
resulting list of lifetime impacts has to prioritize lifetime impacts based on their importance for the
factory. Therefore, it is relevant to know which prioritization factors are important for PPG in the asset
decision-making process.
To what extent can asset lifetime impacts be prioritized based on:
a. Effect on the business (performance effect see below), b. Investment effort,
c. Probability of success.
Do you see other prioritization factors that are important for PPG?
In order to measure the performance effect, it is relevant to find out which performance objectives are
important for PPG.
Do you think the following performance objectives are important for PPG in the asset decision-making
process?
The effect the lifetime impact will have on:
a. Financial Performance (lower production costs, increased margin and/or revenue).
b. Customer Satisfaction (to better satisfy customer needs (speed, reliability, flexibility)).
c. Internal (Production) Processes (to make it fit-for-purpose and more efficient (quality
and process optimization)).
d. Organizational Capability/ Learning & Growth (to improve technology & human capital).
e. EHS Compliance/ Society (to produce in a safer and more sustainable way).
Do you see other performance objectives which might be important for PPG in an asset decision?