Embed Size (px)
Citation preview

7/27/2019 Asset Management and Financial Stability
http://slidepdf.com/reader/full/asset-management-and-financial-stability 1/34
Asset Management
and
Financial Stability
September 2013
OFR OFFICE OF FINANCIAL RESEARCH

7/27/2019 Asset Management and Financial Stability
http://slidepdf.com/reader/full/asset-management-and-financial-stability 2/34
ContentsIntroduction 1
Industry Activities 3
Vulnerabilities 9
Transmission Channels 21
Data Gaps 24
Appendix: Asset Management Firms and Activities 27
Reerences 29

7/27/2019 Asset Management and Financial Stability
http://slidepdf.com/reader/full/asset-management-and-financial-stability 3/34
Asset Management and Financial Stability 2013 1
Introduction This report provides a brie overview o the asset management industry and
an analysis o how asset management rms and the activities in which they
engage can introduce vulnerabilities that could pose, ampliy, or transmitthreats to nancial stability.
The Financial Stability Oversight Council (the Council) decided to study the activities o asset management
rms to better inorm its analysis o whether—and how—to consider such rms or enhanced pruden-
tial standards and supervision under Section 113 o the Dodd-Frank Act.1 The Council asked the Oce o
Financial Research (OFR), in collaboration with Council members, to provide data and analysis to inorm this
consideration. This study responds to that request by analyzing industry activities, describing the actors
that make the industry and individual rms vulnerable to nancial shocks, and considering the channels
through which the industry could transmit risks across nancial markets.
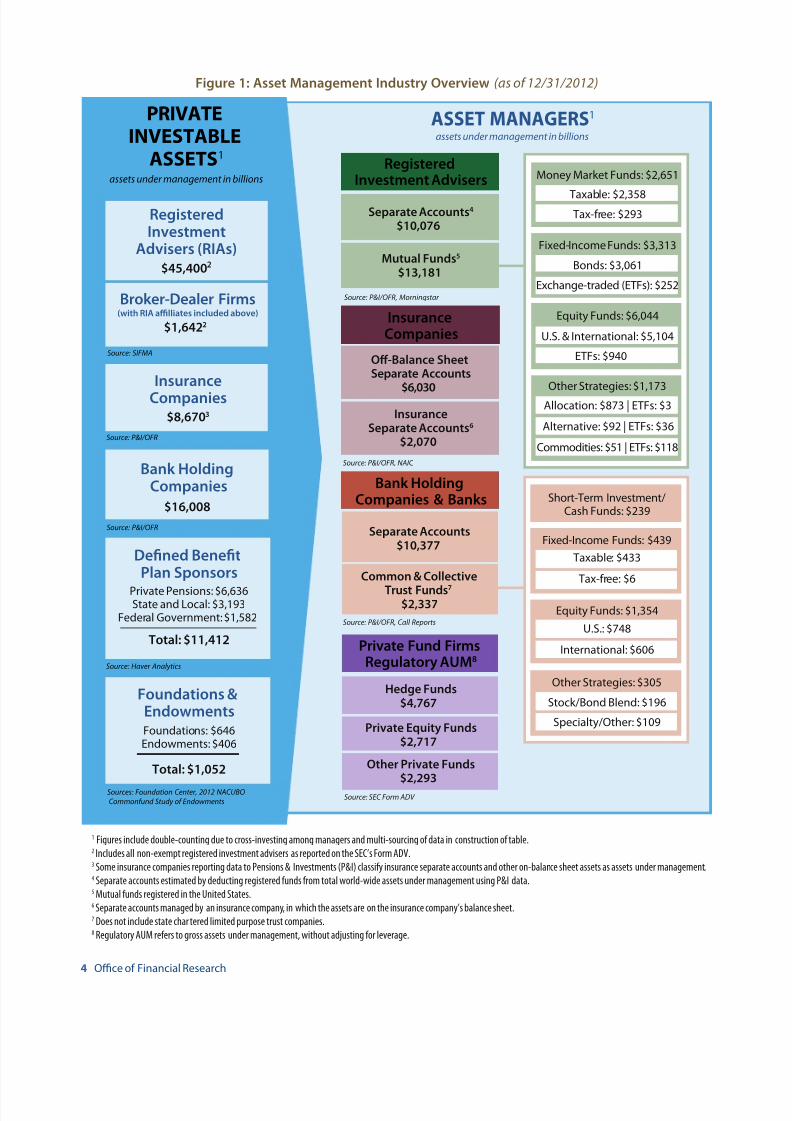
The U.S. asset management industry oversees the allocation o approximately $53 trillion in nancial assets(see Figure 1). The industry is central to the allocation o nancial assets on behal o investors. By acilitating
investment or a broad cross-section o individuals and institutions, discretionary asset management plays a
key role in capital ormation and credit intermediation, while spreading any gains or losses across a diverse
population o market participants. The industry is marked by a high degree o innovation, with new prod-
ucts and technologies requently reshaping the competitive landscape and changing the way that nancial
services are provided.
Asset management rms and the unds that they manage transact with other nancial institutions to trans-
er risks, achieve price discovery, and invest capital globally through a variety o activities. Asset manage-
ment activities include allocating assets and selecting securities, using a variety o investment strategies in
registered and non-registered unds; enhancing returns with derivatives or leverage; and creating custom-
ized investment solutions or larger clients, primarily through so-called separate accounts.
These activities dier in important ways rom commercial banking and insurance activities. Asset manag-
ers act primarily as agents: managing assets on behal o clients as opposed to investing on the managers’
behal. Losses are borne by—and gains accrue to—clients rather than asset management rms. In contrast,
commercial banks and insurance companies typically act as principals: accepting deposits with a liability o
redemption at par and on demand, or assuming specied liabilities with respect to policy holders.
However, some types o asset management activities are similar to those provided by banks and other
nonbank nancial companies, and increasingly cut across the nancial system in a variety o ways. For
example, asset managers may create unds that can be close substitutes or the money-like liabilities
created by banks; they engage in various orms o liquidity transormation, primarily, but not exclusively,through collective investment vehicles; and they provide liquidity to clients and to nancial markets.
The diversity o these activities and the vulnerabilities they may create, either separately or in combination,
has attracted attention to the potential implications o these activities or nancial stability. Some activities
highlighted in this report that could create vulnerabilities—i improperly managed or accompanied by the
use o leverage, liquidity transormation, or unding mismatches—include risk-taking in separate accounts
and reinvestment o cash collateral rom securities lending.
1 FSOC (2012a), p. 21644.
7/27/2019 Asset Management and Financial Stability
http://slidepdf.com/reader/full/asset-management-and-financial-stability 4/34
2 Oce o Financial Research
Unortunately, there are limitations to the data currently available to measure, analyze, and monitor asset
management rms and their diverse activities, and to evaluate their implications or nancial stability. These
data gaps are not broadly recognized. Indeed, there is a spectrum o data availability among asset manage-
ment activities. Mutual unds and other investment companies registered under the Investment Company
Act o 1940 (1940 Act) publicly report data on their holdings; banks report aggregated data on collective
investment unds in regulatory Call Reports; and regulators have recently begun to collect data regarding
private unds and parallel accounts on Form PF, under a mandate included in the Dodd-Frank Act. However,data or separate accounts managed by U.S. asset managers are not reported publicly and their activities are
less transparent than are those o registered unds. Such accounts, according to estimates below, include
roughly two-ths or more o total assets under management (AUM) in U.S. rms. Privately owned asset
management rms, which include several o the largest in the U.S., do not disclose inormation comparable
to the public nancial reports led by asset managers that are public companies or subsidiaries o public
companies. Data on some activities—such as involvement in repo transactions and the reinvestment o
cash collateral rom securities lending—are incomplete, thereby limiting visibility into market practices.
Refecting these issues, this report describes:
• the activities o asset management rms and the unds they manage;
• the key actors that make the industry vulnerable to shocks: (1) “reaching or yield” and herding
behaviors; (2) redemption risk in collective investment vehicles; (3) leverage, which can ampliy asset
price movements and increase the potential or re sales; and (4) rms as sources o risk;
• the key channels through which shocks can be transmitted: exposures across unds and rms and the
impacts o re sales; and
• the data available to measure those activities, vulnerabilities, and channels, and the nature o the gaps
in those data.
The report does not ocus on particular risks posed by money market unds. In November 2012, the Council
released a detailed analysis o these unds and their risks, and the Securities and Exchange Commission
(SEC) recently proposed additional reorms.2
In addition, the activities and risks posed by hedge unds,private equity, and other private unds are not addressed in detail. Additional analysis will be conducted
in conjunction with urther analysis o data that these unds have begun to le on Form PF. The OFR, SEC,
and Commodity Futures Trading Commission (CFTC) are currently evaluating these data or monitoring
purposes.
2 FSOC (2012c); SEC (2013).
7/27/2019 Asset Management and Financial Stability
http://slidepdf.com/reader/full/asset-management-and-financial-stability 5/34
Asset Management and Financial Stability 2013 3
Industry ActivitiesAsset managers provide investment management services and ancillary
services to clients as duciary agents. The diversity o clients’ needs results
in a wide variety o rm structures and business models, ranging rominvestment boutiques that ocus on a single product or clientele to large,
complex nancial institutions that oer multiple services.
Many asset managers ocus their investment strategies on a single asset class, such as equities or xed
income; examples include long-only equity mutual unds and municipal bond unds. Some ocus on a style
o investing within an asset class, such as large-capitalization growth or dividend-yielding U.S. equities.
Other managers cover broad market areas, oering multiple strategies within a und or amily o unds, and
provide custom “solution” investment services or clients.
The industry is highly competitive and, in some ways, highly concentrated. Economies o scale in portolio
management and administration, combined with index-based strategies, have increased industry concen-
tration in recent years. The largest asset managers generally oer the most comprehensive, low-cost client
solutions. At the end o 2012, the top ve mutual und complexes managed 49 percent ($6.6 trillion) o
U.S. mutual und assets, including 48 percent ($2.8 trillion) o equity unds and 53 percent ($1.7 trillion) o
xed income unds. The top 25 mutual und complexes managed 74 percent ($9.9 trillion) o U.S. mutual
und assets, including 74 percent ($4.3 trillion) o equity unds and 75 percent ($2.5 trillion) o xed-income
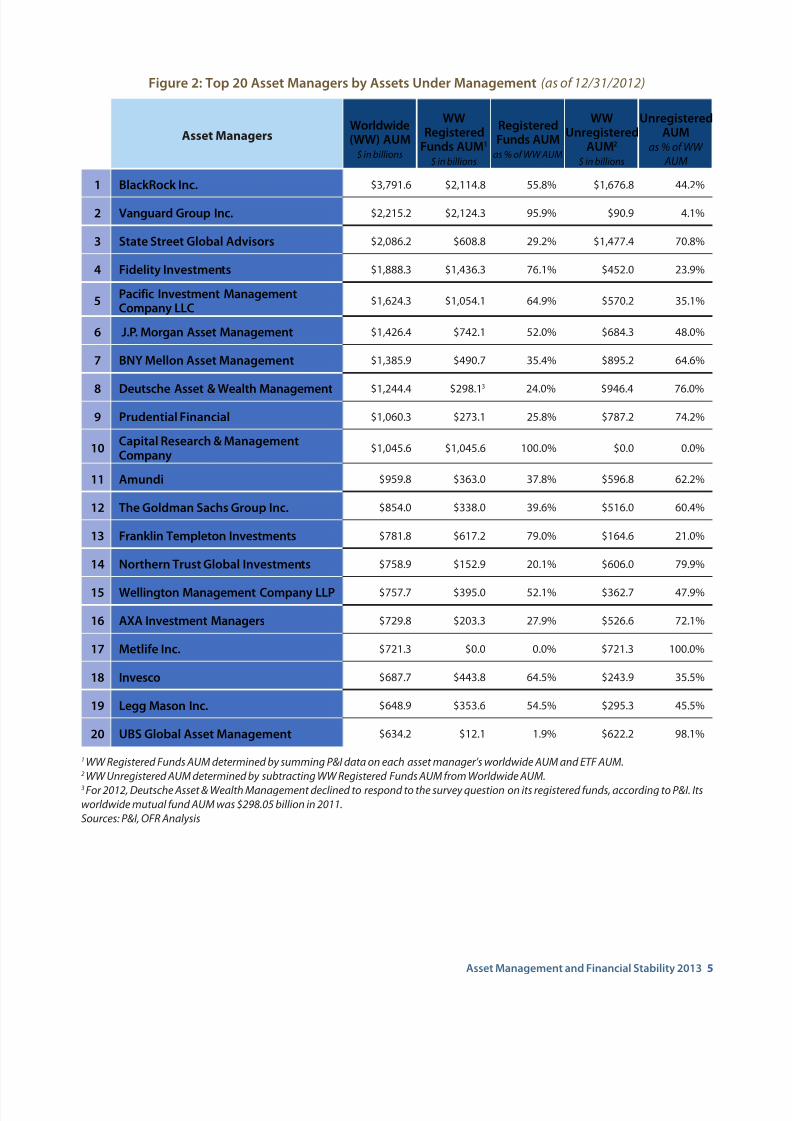
unds.3 Ten rms each have more than $1 trillion in global assets under management (AUM), including nine
U.S.-based managers, as concentration in the sector has increased (see Figure 2). Higher concentrations
could increase the market impact o rm-level risks, such as operational risk and investment risk, or increase
the risk o re sales.
This narrative makes clear that asset management rms have a diverse mix o businesses and businessmodels, oer a broad variety o unds, and engage in many activities. This diversity suggests that asset
management activities should be the analytical building blocks or understanding the industry. Such an
approach permits the fexibility to analyze risks posed by rms (rm divisions, or rms as consolidated
entities) or by industry market sectors by aggregating activities and assessing the interplay among them.
Analyzing activities individually or in combination permits analysis o transmission channels or risks, as
well as assessments o how industry or rm practices could ampliy risks to nancial markets, institutions, or
unds.
Figures 1 through 3 provide an overview o the asset management industry and its rms and activities.
Figure 1 illustrates broad categories o sources o investable assets and translates them into various types
o investment vehicles through the managers that provide them. It is important to note that there is inher-ent double-counting in the gure due to cross-investing among managers and to the use o several data
sources. Figure 2 provides estimates or the top 20 asset managers by AUM. The table illustrates that rms
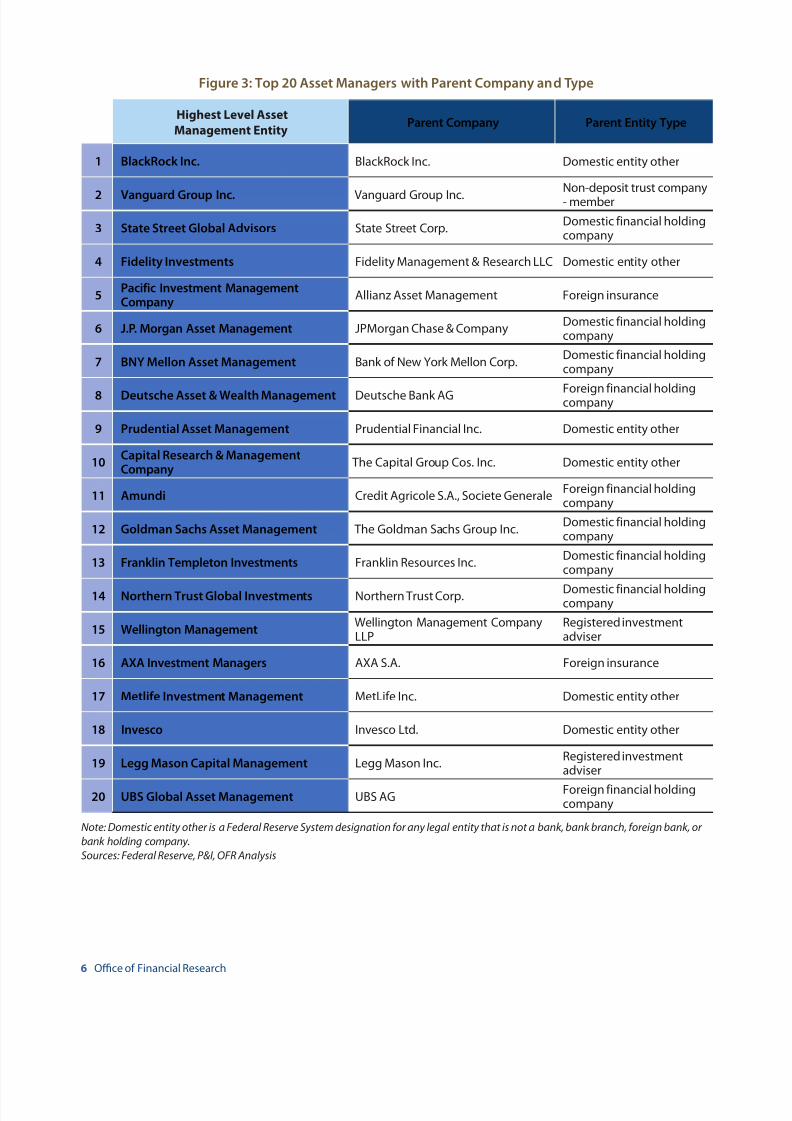
vary signicantly in the extent o their unregistered investment management activities. Figure 3 illustrates
or these rms their relationship with their parent companies. The gures underscore that most o the data
available to analyze the industry relate to rms or unds, not to activities. This report proposes a ramework
or reconciling activities with rms and identies the gaps in data that must be lled or that crosswalk.
3 Morningstar Direct.
7/27/2019 Asset Management and Financial Stability
http://slidepdf.com/reader/full/asset-management-and-financial-stability 6/34
4 Oce o Financial Research
Figure 1: Asset Management Industry Overview (as of 12/31/2012)
PRIVATE
INVESTABLE
ASSETS1
assets under management in billions
RegisteredInvestment Advisers
Separate Accounts4
$10,076
InsuranceCompanies
InsuranceSeparate Accounts6
$2,070
O-Balance SheetSeparate Accounts
$6,030
Source: P&I/OFR, NAIC
Bank HoldingCompanies & Banks
Private Fund FirmsRegulatory AUM8
Hedge Funds$4,767
Private Equity Funds$2,717
Other Private Funds$2,293
Source: SEC Form ADV
ASSET MANAGERS1
assets under management in billions
1 Figures include double-counting due to cross-investing among managers and multi-sourcing of data in construction of table.2 Includes all non-exempt registered investment advisers as reported on the SEC’s Form ADV.3 Some insurance companies reporting data to Pensions & Investments (P&I) classify insurance separate accounts and other on-balance sheet assets as assets under management.4 Separate accounts estimated by deducting registered funds from total world-wide assets under management using P&I data.5 Mutual funds registered in the United States.6 Separate accounts managed by an insurance company, in which the assets are on the insurance company’s balance sheet.7 Does not include state chartered limited purpose trust companies.8 Regulatory AUM refers to gross assets under management, without adjusting for leverage.
RegisteredInvestment
Advisers (RIAs)$45,4002
Broker-Dealer Firms(with RIA alliates included above)
$1,6422
Source: SIFMA
InsuranceCompanies
$8,6703
Source: P&I/OFR
Bank HoldingCompanies
$16,008
Source: P&I/OFR
Money Market Funds: $2,651
Fixed-Income Funds: $3,313
Bonds: $3,061
Exchange-traded (ETFs): $252
Taxable: $2,358 Tax-free: $293
Other Strategies: $1,173
Equity Funds: $6,044
Foundations &EndowmentsFoundations: $646Endowments: $406
Sources: Foundation Center, 2012 NACUBO
Commonfund Study of Endowments
Dened BenetPlan Sponsors
Private Pensions: $6,636State and Local: $3,193
Federal Government: $1,582
Source: Haver Analytics
Total: $11,412
Total: $1,052
U.S. & International: $5,104
ETFs: $940
Short-Term Investment/Cash Funds: $239
Fixed-Income Funds: $439
Taxable: $433
Tax-free: $6
Other Strategies: $305
Equity Funds: $1,354
U.S.: $748
International: $606
Stock/Bond Blend: $196
Specialty/Other: $109
Common & Collective
Trust Funds7 $2,337
Separate Accounts$10,377
Mutual Funds5
$13,181
Source: P&I/OFR, Morningstar
Source: P&I/OFR, Call Reports
Allocation: $873 | ETFs: $3
Alternative: $92 | ETFs: $36
Commodities: $51 | ETFs: $118
7/27/2019 Asset Management and Financial Stability
http://slidepdf.com/reader/full/asset-management-and-financial-stability 7/34
Asset Management and Financial Stability 2013 5
Figure 2: Top 20 Asset Managers by Assets Under Management (as of 12/31/2012)
Asset ManagersWorldwide(WW) AUM
$ in billions
WWRegistered
Funds AUM1
$ in billions
RegisteredFunds AUM
as % of WW AUM
WWUnregistered
AUM2 $ in billions
UnregisteredAUM
as % of WW
AUM
1 BlackRock Inc. $3,791.6 $2,114.8 55.8% $1,676.8 44.2%
2 Vanguard Group Inc. $2,215.2 $2,124.3 95.9% $90.9 4.1%
3 State Street Global Advisors $2,086.2 $608.8 29.2% $1,477.4 70.8%
4 Fidelity Investments $1,888.3 $1,436.3 76.1% $452.0 23.9%
5Paciic Investment ManagementCompany LLC
$1,624.3 $1,054.1 64.9% $570.2 35.1%
6 J.P. Morgan Asset Management $1,426.4 $742.1 52.0% $684.3 48.0%
7 BNY Mellon Asset Management $1,385.9 $490.7 35.4% $895.2 64.6%
8 Deutsche Asset & Wealth Management $1,244.4 $298.13
24.0% $946.4 76.0%
9 Prudential Financial $1,060.3 $273.1 25.8% $787.2 74.2%
10Capital Research & ManagementCompany
$1,045.6 $1,045.6 100.0% $0.0 0.0%
11 Amundi $959.8 $363.0 37.8% $596.8 62.2%
12 The Goldman Sachs Group Inc. $854.0 $338.0 39.6% $516.0 60.4%
13 Franklin Templeton Investments $781.8 $617.2 79.0% $164.6 21.0%
14 Northern Trust Global Investments $758.9 $152.9 20.1% $606.0 79.9%
15 Wellington Management Company LLP $757.7 $395.0 52.1% $362.7 47.9%
16 AXA Investment Managers $729.8 $203.3 27.9% $526.6 72.1%
17 Metlie Inc. $721.3 $0.0 0.0% $721.3 100.0%
18 Invesco $687.7 $443.8 64.5% $243.9 35.5%
19 Legg Mason Inc. $648.9 $353.6 54.5% $295.3 45.5%
20 UBS Global Asset Management $634.2 $12.1 1.9% $622.2 98.1%
1 WW Registered Funds AUM determined by summing P&I data on each asset manager’s worldwide AUM and ETF AUM.2 WW Unregistered AUM determined by subtracting WW Registered Funds AUM from Worldwide AUM.3 For 2012, Deutsche Asset & Wealth Management declined to respond to the survey question on its registered funds, according to P&I. Itsworldwide mutual fund AUM was $298.05 billion in 2011.
Sources: P&I, OFR Analysis
7/27/2019 Asset Management and Financial Stability
http://slidepdf.com/reader/full/asset-management-and-financial-stability 8/34
6 Oce o Financial Research
Figure 3: Top 20 Asset Managers with Parent Company and Type
Highest Level Asset
Management EntityParent Company Parent Entity Type
1 BlackRock Inc. BlackRock Inc. Domestic entity other
2 Vanguard Group Inc. Vanguard Group Inc.Non-deposit trust company- member
3 State Street Global Advisors State Street Corp.Domestic inancial holdingcompany
4 Fidelity Investments Fidelity Management & Research LLC Domestic entity other
5Paciic Investment ManagementCompany
Allianz Asset Management Foreign insurance
6 J.P. Morgan Asset Management JPMorgan Chase & CompanyDomestic inancial holdingcompany
7 BNY Mellon Asset Management Bank o New York Mellon Corp.Domestic inancial holdingcompany
8 Deutsche Asset & Wealth Management Deutsche Bank AG Foreign inancial holdingcompany
9 Prudential Asset Management Prudential Financial Inc. Domestic entity other
10Capital Research & ManagementCompany
The Capital Group Cos. Inc. Domestic entity other
11 Amundi Credit Agricole S.A., Societe GeneraleForeign inancial holdingcompany
12 Goldman Sachs Asset Management The Goldman Sachs Group Inc.Domestic inancial holdingcompany
13 Franklin Templeton Investments Franklin Resources Inc.Domestic inancial holdingcompany
14 Northern Trust Global Investments Northern Trust Corp. Domestic inancial holdingcompany
15 Wellington ManagementWellington Management CompanyLLP
Registered investmentadviser
16 AXA Investment Managers AXA S.A. Foreign insurance
17 Metlie Investment Management MetLie Inc. Domestic entity other
18 Invesco Invesco Ltd. Domestic entity other
19 Legg Mason Capital Management Legg Mason Inc.Registered investmentadviser
20 UBS Global Asset Management UBS AG Foreign inancial holdingcompany
Note: Domestic entity other is a Federal Reserve System designation for any legal entity that is not a bank, bank branch, foreign bank, or
bank holding company.
Sources: Federal Reserve, P&I, OFR Analysis

7/27/2019 Asset Management and Financial Stability
http://slidepdf.com/reader/full/asset-management-and-financial-stability 9/34
Asset Management and Financial Stability 2013 7
Activities can be divided into unctions perormed at the client or und level and those perormed at the
rm level. Activities at the und level include asset allocation and security selection, as well as the manage-
ment o und liquidity and leverage. Portolio managers allocate assets and select portolio holdings accord-
ing to the guidelines prescribed by a und’s prospectus or a separate account’s investment management
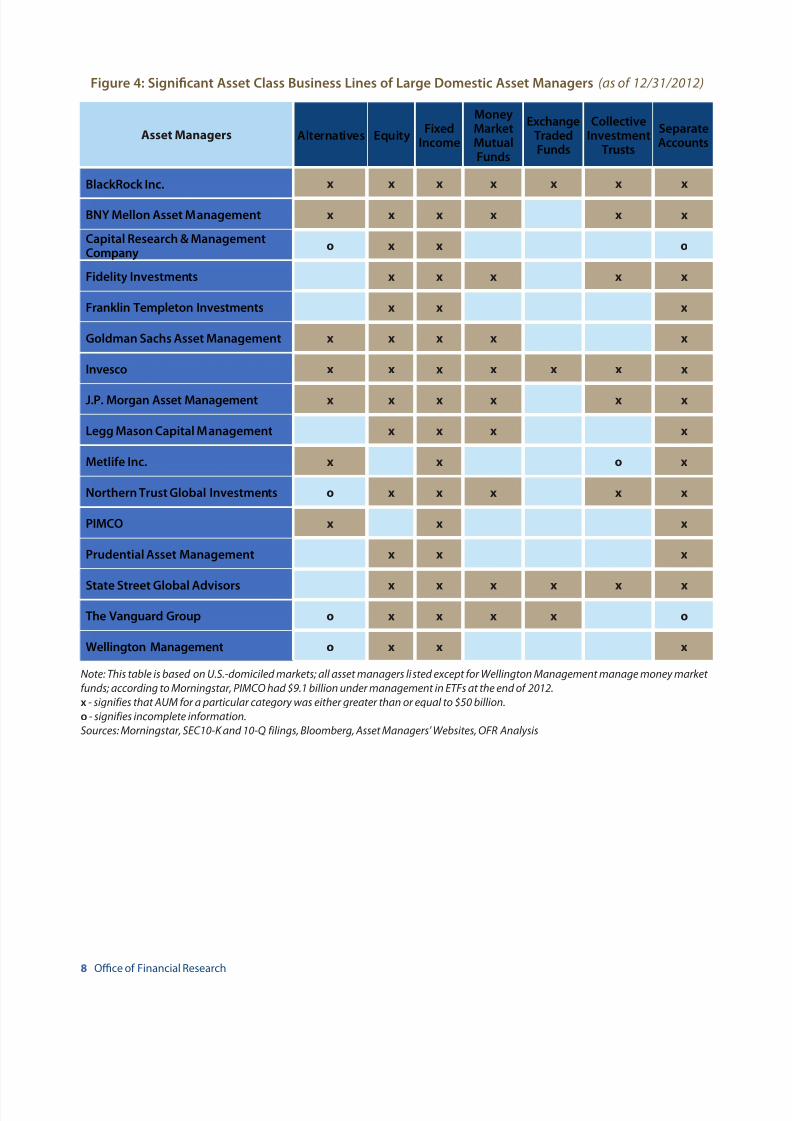
agreement. Figure 4 outlines business lines by signicant asset class or large domestic asset managers.
Activities undertaken at the rm level include centralized trading (including securities trading, derivatives
trading, securities lending, and repo transactions), risk management, market and securities research, andadministrative unctions. Interconnections between und- and rm-level activities are extensive; most unds
rely on their sponsors or core services, and und managers are typically employees o the advisory rm.
Risk management practices and structures vary signicantly among rms. For example, although all regis-
tered investment companies and investment advisers are required by SEC regulation to have chie compli-
ance ocers, not all asset managers have chie risk ocers.4 Regardless o the structure used, eective risk
management is important or the management o operational limits, counterparty limits, and investment
concentrations across unds and accounts.
Some rms adopt a core investment strategy and implement that strategy across multiple unds and
accounts. In addition, rms may oer strategies that seek to hedge risks across asset classes; or example,
so-called risk-parity or all-weather unds combine equity and levered, xed-income portolios to achieverisk parity across the two asset classes. Such strategies may also be oered through multiple channels.
Other activities undertaken at the rm level may either help to manage risk or result in increased risk across
the rm’s activities, such as taking on leverage through unsecured borrowing, establishing and maintaining
redemption lines o credit,5 and managing proprietary investments.6
As described in the sections that ollow, a certain combination o und- and rm-level activities within a
large, complex rm, or engagement by a signicant number o asset managers in riskier activities, could
pose, ampliy, or transmit a threat to the nancial system. These threats may be particularly acute when a
small number o rms dominate a particular activity or und oering. Connections between asset manage-
ment activities and other market activities could contribute to the transmission or amplication o risks
rom one market sector to another, irrespective o whether those risks originated rom asset managers.Activities aimed at boosting returns through leverage, such as the use o derivatives, reliance on borrow-
ing, or other means discussed below, could contribute to system-wide leverage and risk transer. Figure 5
illustrates the connections rom activities to vulnerabilities and transmission channels.
4 Investment Advisers Act, Rule 206(4)-7. Banks typically use dierent titles or employees perorming these unctions.5 A redemption line o credit, provided by the rm that sponsors a und or by a third party such as a bank, oers unds the ability to borrow to cover investor
redemptions. As such, redemption lines oer und managers the exibility to keep less cash on hand, creating potential liquidity risks in the event o amarket decline.
6 Fund management rms oten make proprietary investments, or example, in the orm o seed capital to new unds, although these investments tend tobe small relative to client assets under management.
7/27/2019 Asset Management and Financial Stability
http://slidepdf.com/reader/full/asset-management-and-financial-stability 10/34
8 Oce o Financial Research
Figure 4: Signifcant Asset Class Business Lines o Large Domestic Asset Managers (as of 12/31/2012)
Asset Managers Alternatives EquityFixed
Income
MoneyMarketMutualFunds
ExchangeTradedFunds
CollectiveInvestment
Trusts
SeparateAccounts
BlackRock Inc. x x x x x x x
BNY Mellon Asset Management x x x x x x
Capital Research & ManagementCompany
o x x o
Fidelity Investments x x x x x
Franklin Templeton Investments x x x
Goldman Sachs Asset Management x x x x x
Invesco x x x x x x x
J.P. Morgan Asset Management x x x x x x
Legg Mason Capital Management x x x x
Metlie Inc. x x o x
Northern Trust Global Investments o x x x x x
PIMCO x x x
Prudential Asset Management x x x
State Street Global Advisors x x x x x x
The Vanguard Group o x x x x o
Wellington Management o x x x
Note: This table is based on U.S.-domiciled markets; all asset managers listed except for Wellington Management manage money market
funds; according to Morningstar, PIMCO had $9.1 billion under management in ETFs at the end of 2012.
x - signifies that AUM for a particular category was either greater than or equal to $50 billion.
o - signifies incomplete information.
Sources: Morningstar, SEC10-K and 10-Q filings, Bloomberg, Asset Managers’ Websites, OFR Analysis
7/27/2019 Asset Management and Financial Stability
http://slidepdf.com/reader/full/asset-management-and-financial-stability 11/34
Asset Management and Financial Stability 2013 9
VulnerabilitiesFactors that make the industry vulnerable to nancial shocks include (1)
“reaching or yield” and herding behaviors; (2) redemption risk in collective
investment vehicles; (3) leverage, which can ampliy asset price movementsand increase the potential or re sales; and (4) rms as sources o risk.
Reaching or yield and herding
An extended low interest rate investment climate, low market volatility, or competitive actors may lead
some portolio managers to “reach or yield,” that is, seek higher returns by purchasing relatively riskier
assets than they would otherwise or a particular investment strategy.7 Some asset managers may also
crowd or “herd” into popular asset classes or securities regardless o the size or liquidity o those asset
classes or securities.8 These behaviors could contribute to increases in asset prices, as well as magniy
market volatility and distress i the markets, or particular market segments, ace a sudden shock.
The asset management industry has many practices and regulatory restrictions that can mitigate such risks.
For example, und- and rm-level investment risk management is intended to ensure that investments
conorm to investment mandates and that credit quality, asset concentrations, volatility, leverage, and other
issues are appropriately managed. Independent risk managers can reduce the risk o overextending porto-
lio mandates when they are empowered to challenge investment decisions.
Registered unds are required to disclose inormation to investors about their risks, portolio holdings,
concentrations, and investment strategies. Registered investment advisers are required to disclose to their
clients in their annual brochures their signicant investment strategies and related risks. In addition, regu-
latory restrictions are designed to align the interests o investment advisers and their clients and mitigate
conficts o interest. Managers have strong incentives to provide clients investment strategies matchingtheir risk-return proles. Given that most asset managers earn ees based on the amount o assets under
management and that clients may reely move their accounts to another adviser or und, advisers have
strong incentives to meet client expectations.
However, potential inormation disparities between investment advisers and their clients could undermine
those mitigants in the industry. Specically, investors might not ully recognize or appreciate the nature
o risks taken by their portolio managers, despite required disclosures and investment mandate restric-
tions.9 In some cases, managers’ incentives (or example, some perormance ees) may be structured so that
managers share investors’ gains on the upside but do not share investors’ losses on the downside, a situa-
tion that creates incentives to invest in riskier assets.10
Competitive pressures may also increase incentives or managers to take on extra risks. For example,research on mutual unds has shown that managers who are lagging their peers toward year-end oten take
more risks than managers who are outperorming.11 Depending on the fexibility o investment mandates,
managers may take risks that investors do not ully appreciate. I these risks suddenly become apparent,
7 FSOC (2013), pp. 44-46, pp. 143-144; FSOC (2012b), pp. 139-141.8 Wermers (1999); Sias (2004); Dasgupta, Prat, and Verardo (2011).9 Spatt (2005).10 Keane (2013); Huang, Sialm, and Zhang (2011).11 Chevalier and Ellison (1997); Brown, Harlow, and Starks (1996).

7/27/2019 Asset Management and Financial Stability
http://slidepdf.com/reader/full/asset-management-and-financial-stability 12/34
10 Oce o Financial Research
they could spur redemptions and a fight to quality, which could in turn trigger adverse market contagion
as managers sell assets to meet those redemptions.12
Regulation o asset managers oten ocuses on limiting conficts o interest between asset managers and
their clients, which can help mitigate these risks. However, such regulation ocuses on helping ensure that
managers adhere to their clients’ desired risk-return proles, but does not always address collective action
problems and other broader behavioral issues that can contribute to asset price bubbles or other market
cycles.
Figure 5: Asset Management Activities, Vulnerabilities, and Transmission Channels
Competitive pressures can also be maniest in “herding”—the tendency o asset managers to crowd into
similar, or even the same, assets at the same time. Such herding investment behavior in liquid assets may be
unlikely to ampliy nancial stability shocks. Yet, herding into more illiquid investments may have a greater
potential to create adverse market impacts i nancial shocks trigger a reversal o the herding behavior. This
behavior may occur because those assets appear to oer the best returns relative to the risks, but in other
cases may result rom competitive incentives or product types.
These potential risks could materialize in several dierent asset management activities. Pooled investment
vehicles can potentially create market volatility and more rapid price impacts due to herding behaviors
regarding investments in less liquid assets or increased redemptions due to shiting investments as risk
tolerances or perceptions change.
12 Gennaioli, Shleier, and Vishny (2012).
TRANSMISSION
CHANNELS
Disruptions inmarkets caused by
re sales
Exposure of
creditors,
counterparties,
and investors
Example 1: Losses in highly leveraged funds, combined with reaching for yield behavior, could amplify re sales
and adversely affect fund counterparties.
VULNERABILITIES
Reaching foryield & herding
Redemption risk
Leverage
Firms as
sources of risk
Example 2: During a crisis, the rapid unwinding of investments of cash collateral from securities lending couldpose risks that could amplify re sales and trigger runs.*
ACTIVITIES*
Asset allocation
Portfolio selection
Management of fund liquidity
Management of fund leverage
Risk management & central functions
Possibility of sponsor support
Securities lending cash reinvestment
Management of rm capital & liquidity
Firm-level
Fund-level
* The activities and examples are illustrative and not exhaustive.

7/27/2019 Asset Management and Financial Stability
http://slidepdf.com/reader/full/asset-management-and-financial-stability 13/34
Asset Management and Financial Stability 2013 11
For example, exchange traded unds (ETFs) may transmit or ampliy nancial shocks originating elsewhere.13
These products have provided investors generally low-cost access to diversied investment portolios and
have grown rapidly, with $1.34 trillion in combined U.S. assets at the end o 2012, up rom $102 billion in
2002.14 Although the majority o ETF assets are invested in the very liquid equity market, ETFs also are used
to obtain low-cost, diversied exposure to less liquid market segments, such as xed-income securities,
emerging market assets, and municipal bonds.15 Low interest rates in recent years have contributed to the
rapid growth in xed-income ETFs, with assets growing rom $57 billion at the end o 2008 to $252 billion atthe end o 2012, although this product line is still relatively small compared to bond unds, which had over
$3.1 trillion in assets at the end o 2012.16
The eects on market liquidity o trading in ETFs are ambiguous. On one hand, trading in ETF shares could
improve price discovery in relatively illiquid markets by providing a market price or a portolio whose
underlying holdings are thinly traded. On the other hand, ETFs, like many pooled vehicles, could also poten-
tially accelerate or ampliy price movements in markets during market turbulence, thus reducing market
liquidity. In such circumstances, market makers may step away rom making markets because they do not
have good and reliable pricing inormation regarding those underlying portolio holdings.17
Volatility and tight markets also can have unexpected impacts on ETFs. For example, during market stress
on June 20, 2013, an ETF authorized participant temporarily ceased transmitting redemption orders tovarious ETFs because the authorized participant had reached an internal net capital ceiling imposed by its
corporate banking parent. During that same day, another ETF opted to redeem shares only in-kind (rather
than make available a cash redemption option) because the transaction costs to redeem in cash had
exceeded the costs that the ETF set or that day. In order to address the role that ETFs may potentially have
in transmitting market stress going orward, it will be critical to study how the ETFs’ capital markets service
providers and partners (authorized participants and market makers) cope with market stress and volatility.
Another way that these risks could surace is by investors herding into certain new products, particularly
i the products are relatively illiquid and investors ail to ully appreciate their risks under dierent market
conditions.18 In recent years, asset managers have developed registered unds that allow retail investors
to gain exposure to certain alternative investment strategies more typically pursued by hedge unds. Forexample, certain hedge und and private equity und managers have introduced mutual unds that are
managed using alternative strategies. Such unds can introduce more complex trading strategies and
embedded leverage than traditional retail mutual unds do. During a market shock, when the risks become
13 ETFs combine eatures o a mutual und, which can be purchased or redeemed at the end o each trading day at its NAV per share, with the intraday trad-ing eature o a closed-end und, whose shares trade throughout the trading day at market prices. Only nancial institutions designated as “authorizedparticipants” are permitted to purchase and redeem shares directly rom the ETF, and they can do so only in large blocks (or example, 50,000 ETF shares)commonly called “creation units.” To purchase shares rom an ETF, an authorized participant assembles and deposits a designated basket o securities andcash with the und in exchange or ETF shares. Once the authorized participant receives the ETF shares, it is ree to sell the ETF shares in the secondarymarket to individual investors, institutions, or market makers in the ETF. The redemption process is the reverse o t he creation process. An authorizedparticipant buys a large block o ETF shares on the open market and delivers those shares to the und. In return, the authorized participant receives apre-dened basket o individual securities, or the cash equivalent. This “hybrid” structure creates an arbitrage opportunity that generally keeps the ETF’s
market price relatively close to the ETF’s underlying value. Unlike in the case o mutual und shares, other investors can purchase and sell ETF shares only inmarket transactions and cannot purchase or sell creation units.14 Investment Company Institute (2013a).15 In June 2013, ETFs invested in equities held $1.17 trillion in assets while xed income ETFs held $244 billion in assets. Investment Company Institute
(2013b).16 Morningstar Direct.17 The Flash Crash on May 6, 2010 demonstrated the role ETFs can play in transmitting price dislocations in a distressed market. During that event, two-thirds
o the 21,000 trades cancelled were trades in exchange-traded products. A joint SEC-CFTC report noted that “many o the securities experiencing the mostsevere price dislocations on May 6 were equity-based ETFs.” The report also noted the liquidity mismatch between ETFs and the underlying securities: “Sellpressure that overwhelms immediately-available near-inside liquidity is less likely to be ‘caught’ by resting orders arther rom the mid-quote in an ETFversus an individual stock.” SEC-CFTC (2010).
18 Gennaioli, Shleier, and Vishny (2012).
7/27/2019 Asset Management and Financial Stability
http://slidepdf.com/reader/full/asset-management-and-financial-stability 14/34
12 Oce o Financial Research
more apparent, investors who ailed to appreciate the risks o these investments could engage in heavy
redemptions o these products, exacerbating the shock.
It is important to recognize that asset managers can also have a stabilizing eect on the market. For exam-
ple, asset managers with the nancial strength and liquidity to buy assets trading signicantly below their
intrinsic values potentially could help to stabilize declines in prices.
Redemption risk
Any collective investment vehicle oering unrestricted redemption rights could ace the risk o large
redemption requests in a stressed market i investors believe that they will gain an economic advantage
by being the rst to redeem.19 Investors in mutual unds with portolios o securities with varying levels o
liquidity may have a “rst-mover advantage” to sell early, i they believe cash on hand and maturing assets
are insucient to cover redemption requests and that more liquid assets may need to be sold to meet
redemptions.20 In a stressed market environment, this scenario could leave slower-to-redeem investors
holding shares o an increasingly less liquid portolio whose net asset value (NAV) may all at an accelerating
rate as market liquidity premiums rise. Asset sales in response to redemptions could also spread stress rom
certain types o portolio assets to other portolio assets and market segments.21 Heightened redemptions
rom an asset manager’s unds could increase market risks i there is a perception that the asset manage-ment rm itsel is at risk o ailure.
Fund managers use well-established liquidity management tools to manage and mitigate redemption risk.
As a precaution against high demand or redemptions, unds oten hold cash buers and maintain liquidity
lines o credit. To meet redemption requests, under SEC guidelines, registered mutual unds should hold at
least 85 percent o their investments in assets that the und manager believes could be sold at or near carry-
ing value within seven days.22 Funds may increase the proportion o the portolio invested in more liquid
securities i they anticipate market turbulence or another shock that could lead to heavier redemptions.
Many unds also track their investor redemption behaviors and plan heavier portolio liquidity around times
when und investors are more likely to redeem, such as when tax payments are due or in anticipation o
year-end tax loss selling. Some large asset managers trade directly with other buy-side rms through “dark pool” exchanges, primarily as a means o seeking best execution, but also to guard against potential situa-
tions in which traditional third-party liquidity providers—particularly broker-dealers—are unable or unwill-
ing to provide sucient trade liquidity.
Registered unds have little ability to impose restrictions to prevent heavy redemptions in times o stress.
Registered unds generally may not suspend investor redemptions, and must satisy redemption requests
within seven days. Many mutual unds disclose that they may pay back investors “in kind”—in securities
rather than in cash—i they are under severe stress, although practical challenges have rendered this tool
rarely used by unds, even in times o severe stress. Mutual unds generally would not be able to impose
redemption ees to counter sudden heavy redemptions under existing regulations. In contrast, private
unds are oten structured to permit temporary suspensions o redemptions or the imposition o redemp-
tion ees or gates that limit redemptions in times o stress.
During normal market conditions, the availability o liquidity in capital markets allows managers to trade
securities in response to varying investor und fows. Institutional investors tend to have more predictable
unding needs based on xed expenditures or liabilities, acilitating liquidity management or institutional
19 Mitchell, Pedersen, and Pulvino (2007).20 Chen, Goldstein, and Jiang (2010).21 Manconi, Massa, and Yasuda (2012).22 SEC (1992).

7/27/2019 Asset Management and Financial Stability
http://slidepdf.com/reader/full/asset-management-and-financial-stability 15/34
Asset Management and Financial Stability 2013 13
unds; on the other hand, they tend to be quicker than retail investors to pull their unds in a market down-
turn and take larger investment stakes. Although some und managers may ocus on holding more liquid
assets, such as large capitalization stocks with narrow bid-ask spreads traded on multiple exchanges, others
may ocus on holding assets that are much less liquid, or example, collateralized loan obligations, emerg-
ing market equities, or thinly-traded corporate xed income securities. I the liquidity o those assets varies
signicantly, and that variation widens under stress, und investors in less liquid unds may perceive rst-
mover advantages to liquidating assets ahead o other investors. During the nancial crisis, sophisticatedinvestors tended to react more quickly to deteriorating market conditions than did retail investors, redeem-
ing shares rom unds more quickly i they perceived liquidity shortalls.23
Figure 6 illustrates characteristics that make collective investment vehicles more vulnerable to redemp-
tion risks. On the vertical axis, risks are heightened or unds ocused on preserving investor principal
stability—such as money market unds or short-term investment unds (STIFs)—that oer daily liquidity
to their investors.24 Runs on such short-term unds can be sel-reinorcing, as investor redemptions urther
drive down prices, returns, and liquid assets in the und—spurring more redemptions. I perceived to have
broader market implications, runs on these unds or groups o unds could contribute to risks o widespread
re sales.
Figure 6: Investors’ Liquidity and Stability Preerences
Investors’ concerns about the liquidity o one und can quickly spread to similar or related unds, or to
the sponsor o a und complex. As an agency business, a nancial services rm that suers damage to its
reputation through an extreme event in one business or und may suer redemptions or creditor pull-
backs in its other unds or businesses. For example, investors in unds or accounts oered by a large asset
23 Schmidt, Timmermann, and Wermers (2013).24 STIFs are a type o bank collective investment trust and are excluded rom SEC registration and regulation under the 1940 Act; they are subject to rules
established by banking regulators. The Ofce o the Comptroller o the Currency (OCC) introduced new rules to reduce risks in STIFs in 2012 (OCC, 2012).The SEC introduced new rules to reduce risks in money market mutual unds in 2010.
Source: OFR Analysis
“Money”FDIC-insured deposits
currency
treasuries
GSE debt
Stable
L o c k e d
R e d e e m a b l e
L i q u i d i t y
Stability
Loss-bearing
stable-value funds
time deposits and CDs;
some retirement accounts
bonds/xed-income
equities
ETFsmutual funds
(e.g., 7-day redemption restrictions)
hedge funds with less tight
redemption options
private equity;
hedge funds with tight
redemption rules
“Money-like”STIFs
stable-NAV MMFs
CP and repos
enchanced cash fundssecurities lending cash pools
uninsured deposits

7/27/2019 Asset Management and Financial Stability
http://slidepdf.com/reader/full/asset-management-and-financial-stability 16/34
14 Oce o Financial Research
management und complex may react negatively together i the amily is tainted by an operational ailure,
exposure o poor risk management practices, or collapse o a single und. Although rm-specic problems
are oten attributed to rm idiosyncrasies and may not have broader market impacts, problems associated
with an activity involving a large number o asset managers could aect market condence and lead to
redemptions.
The horizontal axis o Figure 6 categorizes unds by investors’ stability preerences. In some circumstances,
investors may believe that they can rely on sponsor support o the und or product in a crisis, even in
the absence o a legal or stated guarantee. They may hold this belie because o the way a product was
marketed or because such support has been granted in the past.25 Although managers are not required to
provide such support, competitive pressures or protecting rms’ reputations may oblige it. Mutual unds
and other types o products generally oer no guarantees that investors will be protected rom principal
loss, although many publicly-traded asset managers explicitly disclose in their regulatory lings (or exam-
ple, Forms 10-K and 10-Q) that management reserves the right to provide support to any o their unds.
In one example in November 2007, Bank o America supported investors in the $40 billion Strategic Cash
Portolio, then the largest enhanced cash und in the country, and closed the und ater losses on mort-
gage-backed securities prompted the und’s largest investor to withdraw $20 billion.26 In another example
in November 2008, OppenheimerFunds contributed $150 million to a mutual und to cover liquidity short-
alls due to derivatives exposures.27 Direct and indirect support provided to investors in collective invest-
ment vehicles and separate accounts are not prominently disclosed, but, according to industry interviews,
occurred during the crisis. Investors who expect their investments to be protected by explicit or implicit
backstops could be expected to redeem unds in larger numbers i there is any sign that protections are
eroding.
Figure 7: Net Worldwide Fund Flows, July 2008-June 2013 ($ in billions)
There are other possible scenarios in which redemption risk could ampliy nancial or economic shocks. I a
number o unds were invested in similar assets or correlated assets, market events aecting that strategy or
25 Brady, Anadu, and Cooper (2012).26 Grynbaum (2007). Enhanced cash unds are short-term unds that seek to oer higher yields than typically achievable by money market unds.27 SEC (2012).
-$500
$0
$500
$1,000
$1,500
$2,000
Other Alternative
Allocation
Money Market
Equity
Fixed
Income
Source: Morningstar
7/27/2019 Asset Management and Financial Stability
http://slidepdf.com/reader/full/asset-management-and-financial-stability 17/34
Asset Management and Financial Stability 2013 15
set o assets may aect and cause heavier redemptions in a number o unds, and sales o assets rom any o
those unds could create contagion eects on the related unds, spreading and ampliying the shock and its
market impacts.
For example, a signicant amount o assets has fowed into xed income and hybrid mutual unds in the
past ve years (see Figure 7). As o 2012, 32 percent o mutual unds were bond and hybrid unds. Bond
unds could be exposed to a risk o sudden price declines i interest rates were to suddenly rise. In times o
sharp changes in interest rates or related bond-market volatility, managers o these unds may be exposed
to sudden heavier redemptions i they have not adequately managed the und’s liquidity, given market risks
and the thinly traded nature o some xed-income markets. Redemption risk is not prevalent in separate
accounts because the assets are not managed in a collective investment vehicle. However, signicant secu-
rities sales rom separate accounts could still ampliy a market impact.
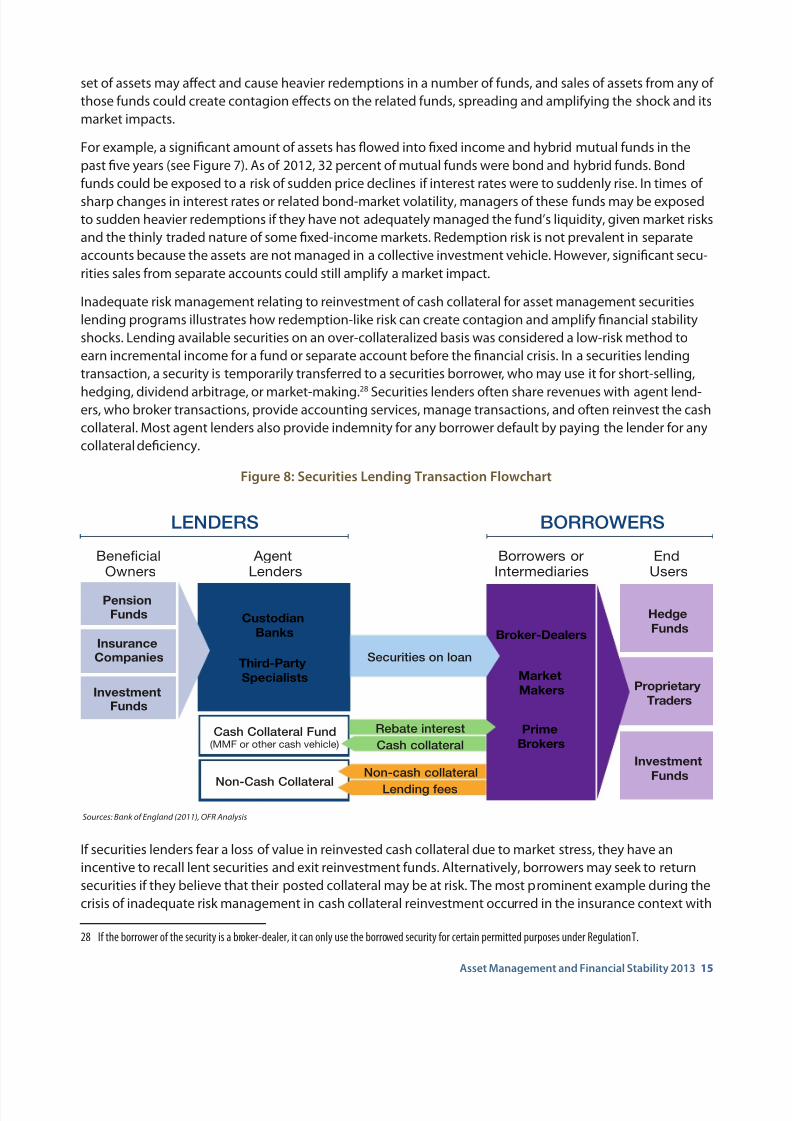
Inadequate risk management relating to reinvestment o cash collateral or asset management securities
lending programs illustrates how redemption-like risk can create contagion and ampliy nancial stability
shocks. Lending available securities on an over-collateralized basis was considered a low-risk method to
earn incremental income or a und or separate account beore the nancial crisis. In a securities lending
transaction, a security is temporarily transerred to a securities borrower, who may use it or short-selling,
hedging, dividend arbitrage, or market-making.28 Securities lenders oten share revenues with agent lend-ers, who broker transactions, provide accounting services, manage transactions, and oten reinvest the cash
collateral. Most agent lenders also provide indemnity or any borrower deault by paying the lender or any
collateral deciency.
Figure 8: Securities Lending Transaction Flowchart
I securities lenders ear a loss o value in reinvested cash collateral due to market stress, they have an
incentive to recall lent securities and exit reinvestment unds. Alternatively, borrowers may seek to return
securities i they believe that their posted collateral may be at risk. The most prominent example during the
crisis o inadequate risk management in cash collateral reinvestment occurred in the insurance context with
28 I the borrower o the security is a broker-dealer, it can only use the borrowed security or certain permitted purposes under Regulation T.
PensionFunds Custodian
Banks
Third-Party
Specialists
Lending fees
Cash collateral
Non-cash collateral
Broker-Dealers
Market
Makers
Prime
BrokersCash Collateral Fund
(MMF or other cash vehicle)
BenecialOwners
AgentLenders
LENDERS BORROWERS
InsuranceCompanies
InvestmentFunds
Sources: Bank of England (2011), OFR Analysis
Hedge
Funds
EndUsers
Borrowers orIntermediaries
Proprietary
Traders
Investment
Funds
Non-Cash Collateral
Rebate interest
Securities on loan

7/27/2019 Asset Management and Financial Stability
http://slidepdf.com/reader/full/asset-management-and-financial-stability 18/34
16 Oce o Financial Research
AIG. Through a subsidiary, AIG Securities Lending Corporation, AIG ran a large securities lending business
on behal o its lie insurance subsidiaries. AIG Securities Lending Corporation’s cash collateral reinvestment
practices, coupled with AIG’s nancial distress, caused it to sell assets that had become illiquid at a loss in
order to return the cash collateral. This substantially contributed to AIG’s losses.
This risk was not limited to AIG. Some asset managers also invested cash collateral in assets adversely
aected by the nancial crisis, such as structured investment vehicles and Lehman Brothers notes, and they
provided nancial support to those cash collateral reinvestment unds.29 The losses on cash collateral rein-
vestment amplied re sales and runs during the crisis. They also contributed to the seizing o the money
markets, in which cash collateral was typically invested. Daily marks and return o collateral due to the
declining stock market urther stressed the liquidity o collateral reinvestment unds.
Cash collateral reinvestment practices are not generally subject to comprehensive, targeted regulation
and are not necessarily transparent to regulators or clients whose securities are lent. Due to data limita-
tions, it is dicult to know, at any given time, the counterparty or risk exposures created by cash collateral
reinvestment.
The connection between securities lending markets and cash collateral reinvestment, redemption risk,
and short-term unding markets is not well understood and is dicult to measure due to a lack o compre-
hensive data.30 When cash collateral is managed in separate accounts, visibility into these connections is
reduced.
Figure 9: Percent o Securities Lending Loans by Industry (as of 3/25/2013)
29 For example, the Mount Vernon Securities Lending Prime Portolio obtained an SEC sta no-action letter to enter into a capital support agreement with itsafliate due to its holdings o Lehman Brothers Holdings, Inc. notes and shares in the Reserve Primary Fund. SEC sta no-action letters relating to undsare available at http://www.sec.gov/divisions/investment.shtml.
30 Keane (2013).
Source: Markit Group Limited
QuasiGovt
Bodies5%
U.S.PublicFunds
6%InsuranceCompanies
8%
PublicPension Plans
9%
Banks10%
PensionFunds12%
CentralBanks13%
MutualFunds18%
Other 19%
7/27/2019 Asset Management and Financial Stability
http://slidepdf.com/reader/full/asset-management-and-financial-stability 19/34
Asset Management and Financial Stability 2013 17
Leverage
The recent crisis illustrated that leverage, particularly short-term leverage, can subject borrowers to margin
calls and liquidity constraints that increase the risk o re sales.31 In addition to borrowing, asset managers
obtain leverage or their unds and accounts through derivatives (utures, options, and swaps), securities
lending, and repurchase agreements.
Investors can obtain leverage through products such as leveraged or derivative-based ETFs or otherexchange-traded products that can magniy gains and losses or the investor compared to the underlying
index or portolio assets. Asset managers can use leverage at the rm level (borrowing by the rm itsel),
the und level (und borrowing, or closed-end unds oering both common and preerred shares), or the
portolio level (acquiring leveraged, structured products or trading in derivatives). Institutional investors
and high-net-worth individuals ace ewer limitations than smaller retail investors in obtaining leverage
through managed unds and accounts. The Investment Company Act o 1940 (1940 Act) limits leverage
levels or investment companies registered under that act. For example, mutual unds generally are required
to hold assets equal to at least 300 percent o their bank debt, restricting leverage rom bank debt to 33
percent o assets. Closed-end unds may also create leverage by issuing preerred shares.32 However, unreg-
istered unds and accounts are not subject to these regulatory restrictions.33 Some complex trading strate-
gies o such unds—such as “carry” trades in dierent currencies—oten rely on leverage to boost returns.34
Registered unds also may incur additional leverage through the use o derivatives. Derivatives generally
can create leverage by allowing unds to obtain exposure to market fuctuations in underlying reerence
assets—such as stock prices, commodity prices, or interest rates—that exceed the und’s investment in the
derivative.35 These transactions can either (1) result in the incurrence o potential debt obligations under the
derivative contract, such as with a swap or uture (indebtedness leverage), or (2) provide increased market
exposure without the incurrence o uture obligations, such as with a purchased option or structured note
(economic leverage).36 Registered unds are permitted to invest in derivatives, but are generally required
to cover these positions with liquid assets equal to the indebtedness exposure created by the transaction;
this cover requirement would either be the ull obligation due at the end o the contract or, with respect to
certain cash-settled derivatives, the daily mark-to-market liability, i any, o the und under the derivative.Alternatively, a und may be permitted to cover by holding an osetting position that eectively eliminates
the und’s exposure on the transaction. Cover is not required or instruments that create economic leverage
but no indebtedness leverage.
Registered unds markedly expanded their exposure to credit derivatives in the run-up to the crisis. By 2008,
60 percent o the 100 largest U.S. corporate bond unds sold credit deault swaps (CDS), up rom 20 percent
in 2004, according to a Federal Deposit Insurance Corporation working paper.37 During the same period,
31 Brunnermeier and Pedersen (2009).32 Closed-end unds can employ higher levels o leverage than mutual unds. Prior to the nancial crisis, preerred shareholders in closed-end unds had a
total o $64 billion in auction-rate preerred shares outstanding (Thomsen, 2008). These shares represented leverage or common shareholders. These
shares were similar to auction-rate securities in that the interest rate was determined in periodic auctions. The reezing o the market or auction-ratesecurities in February 2008 aected auction-rate preerred shares issued by closed-end unds, increasing interest rates on the securities to deault rates.Dividends on common shares ell signicantly. Managers o closed-end unds used various means to support preerred shareholders without hurtingcommon shareholders.
33 Although not subject to regulation, leverage levels or unregistered unds and accounts may be restricted under investment mandates.34 A carry trade involves borrowing in a low-interest-rate market, typically a source o short-term wholesale unding, and investing the proceeds in (longer-
term) higher-yielding assets, sometimes in a dierent currency rom that o the sources o unding. For example, in recent years, investors borrowed in theU.S. dollar-denominated repo market to invest in oreign currency bonds.
35 Funds registered under the 1940 Act are required to submit semiannual disclosures o derivatives holdings to the SEC in Form N-Q, but more inormationwould be required to analyze unds’ derivatives exposures rom a nancial stability perspective.
36 SEC (1994), pp. 22-23.37 Adam and Guettler (2010). In addition to seeking leverage, unds may invest in CDS to obtain exposure to issues that may be unavailable in cash markets.

7/27/2019 Asset Management and Financial Stability
http://slidepdf.com/reader/full/asset-management-and-financial-stability 20/34
18 Oce o Financial Research
the size o the average credit derivatives position in these unds grew rom 2 percent to almost 14 percent,
as measured by the notional value o the position relative to the und’s net asset value (NAV). The notional
value exceeded 50 percent or six o the unds covered in the study. The study ound that unds predomi-
nantly used CDS to increase their exposure to credit risks—that is, they were net sellers o credit protection,
not net buyers.
During the nancial crisis, the use o derivatives to boost leverage resulted in signicant losses or some
registered unds. For example, the Oppenheimer Champion Income Fund and Oppenheimer Core Bond
Fund—two xed-income retail mutual unds—lost roughly 80 percent and 36 percent o their NAV in 2008,
respectively. The losses were primarily due to their exposure to total return swaps—a type o derivative in
which investors exchange the total gains or losses rom a reerence asset without owning it—on AAA-rated
tranched commercial mortgage-backed securities. OppenheimerFunds Inc., the unds’ adviser, supported
one o the unds that had insucient liquidity to make payments related to margin calls on the risks associ-
ated with the swaps. The SEC later ned OppenheimerFunds $35 million or inadequately disclosing the
risks associated with the leverage levels at the unds.38
In 2007, State Street paid signicant settlements related to alleged raudulent misrepresentations about the
exposure o two unds to subprime mortgage credit risk and their use o leverage. The unds were leveraged
approximately three-to-one through the use o total return swaps. These unds were unregistered collectiveinvestment unds managed by State Street Bank that targeted a stable NAV. Their leverage was unusually
high or unds that were marketed as alternatives to money market unds, being more comparable to lever-
age employed at long/short hedge unds.39
The SEC issued a concept release in 2011 seeking public comment on the use o derivatives by registered
unds. The release solicited comment on und leverage, risk management practices, and derivatives expo-
sure limits. Some o these potential options are similar to regulations recently implemented in Europe.40
As discussed below, data are currently insucient to understand the exposures and the extent o lever-
age in separate accounts. As o earlier this year, Form PF requires all private unds to report data to the SEC
related to their use o leverage.41 The FSOC and the OFR have each noted the rationale and importance o
monitoring leverage in the nancial system in their annual reports to Congress.
Firms as sources o risk
The ailure o a large asset management rm could be a source o risk, depending on its size, complex-
ity, and the interaction among its various investment management strategies and activities. Distress
at a large asset manager could ampliy or transmit risks to other parts o the nancial system. An asset
manager’s nancial strength and reputation underpin its ability to attract clients, retain key employees, and
deliver asset management services. Sponsors sometimes act in dual roles, as agents who provide porto-
lio management and other services, and as principals who may invest in their own unds or may provide
implicit or explicit support to investors.
Concentration o risks among unds or activities within a rm may pose a threat to nancial stability.
Instability at a single asset manager could increase risks across the unds that it manages or across markets
through its combination o activities.42 In a variety o ways, rms’ risk managers could ail to understand or
38 SEC (2012).39 State Street was cited by the State o Massachusetts or noncompliance with state disclosure requirements.40 SEC (2011); CESR (2010).41 Certain private unds are required to report their secured and unsecured borrowings (or example, through loans or repos) as well as their use o deriva-
tives. Analysis o these data will allow regulators to determine the overall use o leverage by private unds.42 Bhattacharya, Lee, and Pool (2013); Gaspar, Massa, and Matos (2006).

7/27/2019 Asset Management and Financial Stability
http://slidepdf.com/reader/full/asset-management-and-financial-stability 21/34
Asset Management and Financial Stability 2013 19
anticipate risks with nancial stability implications. For example, a rm could manage a number o large,
highly leveraged unregistered unds which have strategies that turn out to be correlated in ways rm risk
managers did not anticipate, either because correlations shited in times o stress or because the manager
ailed to consider certain actors that led to correlations among portolio assets.43 Similar concerns could
arise i a rm with extensive repo and securities lending businesses, and that managed strategies with an
array o interconnections through derivatives and other exposures, had diculty unwinding or transerring
clients’ investments to another asset manager during a period o market weakness. Under stress, counter-parties also might not distinguish among exposures to the rm and its unds, and thereore could take risk-
mitigating actions that could aggravate risks across the rm’s unds and accounts.
Interconnectedness and complexity can transmit or ampliy threats to nancial stability; large nan-
cial companies tend to have multiple business lines that are interconnected in complex ways. The asset
management division o a bank or insurance company may be linked to other nancial market segments
directly or indirectly through business connections within the rm. For example, some large, dedicated
asset management companies oer comprehensive services through in-house broker-dealers, commod-
ity pool operators, trust companies, or captive insurance divisions. Some oer broker-dealer, consulting,
or pricing services to other asset managers, creating interconnections and dependencies that increase
their importance in nancial markets. Some large asset managers also have subsidiaries in many countries,
complicating risk management and increasing the diculty o supervision.
Moreover, material distress at the rm level, or rm ailure, could increase the likelihood and magnitude
o redemptions rom a rm’s managed assets, possibly aggravating market contagion or contributing to
a broader loss o condence in markets. The largest asset managers continue to win a signicant share o
the market, primarily by oering comprehensive solutions that benet rom established ranchises and
economies o scale.44 Although separate accounts are typically easy to move rom manager to manager due
to separation o custody and management, i an investment adviser managed a large amount o separate
account assets with complex, highly-customized strategies, a new manager may not be willing or able to
quickly replace an existing manager during a period o market turbulence, or clients may require managers
to liquidate assets prior to a transer contributing to market risk.
Several large, complex nancial institutions with asset management divisions suered material distress
during the recent crisis. Recent policy measures that seek to reduce these risks include heightened pruden-
tial standards or banks and designated nonbank nancial companies and enhanced resolution authorities.
During the crisis, stress spread between these companies’ other businesses and their asset management
subsidiaries. Heightened redemptions rom the unds and accounts managed by the asset management
divisions o Bear Stearns, Wachovia, and Lehman occurred in step with other destabilizing events in the
market.
As agency businesses, asset management companies tend to have small balance sheets, and nonbank, non-
insurance asset managers are not required by U.S. regulation to set aside liquidity or capital reserves or
their asset management businesses.45 The Federal Reserve’s annual stress test requires the asset manage-
ment divisions o large bank holding companies with money-like unds to set aside capital to cover the risk that they would have to support some o their unds during stress conditions. Figure 10 shows the book
value o large dedicated asset managers compared to their assets under management—one indication o
43 Boyson, Stahel, and Stulz (2010). Correlations typically rise in periods o stress, reducing the benets o diversication.44 The top 10 incumbent U.S. managers took 65 percent o all net new und assets among managers with positive net ows in 2012 (BCG, 2013).45 Nonbank und managers in the United Kingdom are subject to prudential regulation and minimum capital requirements at the rm level. Those capital
requirements are designed to cover emergency liquidity needs and are thus not comparable to regulatory capital requirements or banks and insurancecompanies (FSA, 2012).
7/27/2019 Asset Management and Financial Stability
http://slidepdf.com/reader/full/asset-management-and-financial-stability 22/34
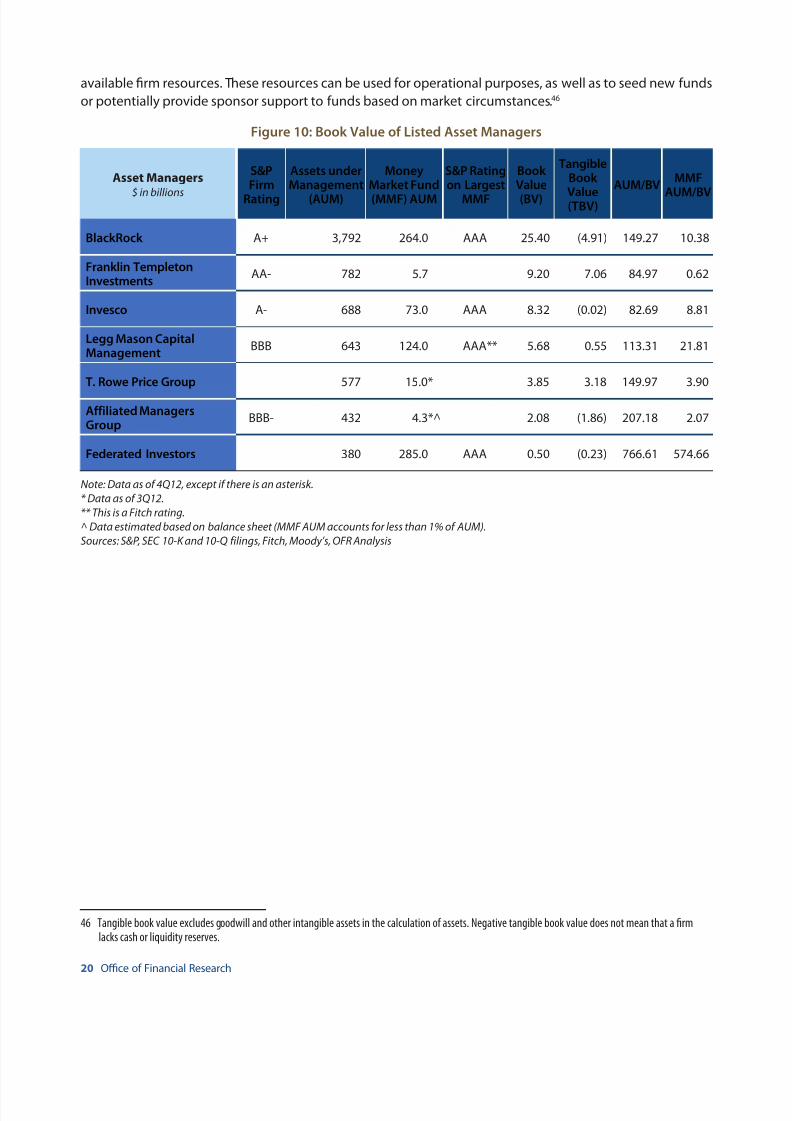
20 Oce o Financial Research
available rm resources. These resources can be used or operational purposes, as well as to seed new unds
or potentially provide sponsor support to unds based on market circumstances.46
Figure 10: Book Value o Listed Asset Managers
Asset Managers
$ in billions
S&PFirm
Rating
Assets underManagement
(AUM)
MoneyMarket Fund
(MMF) AUM
S&P Ratingon Largest
MMF
Book Value
(BV)
TangibleBook
Value(TBV)
AUM/BVMMF
AUM/BV
BlackRock A+ 3,792 264.0 AAA 25.40 (4.91) 149.27 10.38
Franklin TempletonInvestments
AA- 782 5.7 9.20 7.06 84.97 0.62
Invesco A- 688 73.0 AAA 8.32 (0.02) 82.69 8.81
Legg Mason CapitalManagement
BBB 643 124.0 AAA** 5.68 0.55 113.31 21.81
T. Rowe Price Group 577 15.0* 3.85 3.18 149.97 3.90
Ailiated ManagersGroup
BBB- 432 4.3*^ 2.08 (1.86) 207.18 2.07
Federated Investors 380 285.0 AAA 0.50 (0.23) 766.61 574.66
Note: Data as of 4Q12, except if there is an asterisk.
* Data as of 3Q12.
** This is a Fitch rating.
^ Data estimated based on balance sheet (MMF AUM accounts for less than 1% of AUM).
Sources: S&P, SEC 10-K and 10-Q filings, Fitch, Moody’s, OFR Analysis
46 Tangible book value excludes goodwill and other intangible assets in the calculation o assets. Negative tangible book value does not mean that a rmlacks cash or liquidity reserves.
7/27/2019 Asset Management and Financial Stability
http://slidepdf.com/reader/full/asset-management-and-financial-stability 23/34
Asset Management and Financial Stability 2013 21
Transmission ChannelsAsset managers could transmit risks across the nancial system through
two primary channels: (1) Exposure o creditors, counterparties, investors, or
other market participants to an asset manager or asset management activity,and (2) disruptions to nancial markets caused by re sales.
Exposure o creditors, counterparties, investors, or other market participants
The connections asset managers have with an array o nancial companies, both within a holding company
structure and with outside entities, could transmit risks among asset managers, other nancial companies,
and broader markets.
Direct connections among asset managers, banks, broker-dealers, insurance companies, and other nancial
services providers have grown over the past decade.47 Banks and their subsidiaries are major service provid-
ers to the asset management industry, oering broker-dealer services, prime brokerage, und accounting,custody services, and redemption lines o credit, as well as other orms o credit to unds and rms. Banks
and insurance companies also serve as counterparties or various types o derivatives contracts and port-
olio investments. Pricing providers oer valuation services enabling asset managers to mark their porto-
lios to market and calculate daily NAVs. Credit rating agencies also provide critical services. The extensive
connections asset managers have with other nancial services rms, and the concentration o some o
these services, increase the potential that risks originating in other market sectors could be transmitted or
amplied through asset managers into broader nancial markets, or conversely, that risks originating in
asset managers could be transmitted to other market sectors.
These industry linkages have increased the indirect connections among asset managers in recent years.
Having common service providers, such as custodians, pricing providers, or securities lending brokers, orhaving common, large clients as investors, could result in common diculties in the event o widespread
service disruptions or redemptions. Fund-o-unds strategies that create implicit linkages between unds
could also cause stress in the event o rapid redemptions, i severe price declines in more illiquid unds in
the portolio lead to increased selling pressure on more liquid unds.48
During interviews, asset managers suggested that counterparty risk management varies widely, with some
rms establishing separate counterparty teams and others taking a und-level approach subject to the
discretion o portolio managers. Funds are not specically required to conduct ongoing credit analysis o
their derivatives counterparties.
Disruptions to fnancial markets caused by fre sales
Fire sales are rapid sales o assets that temporarily depress market prices, typically refecting market partici-
pants’ responses to market distress, including an escalating premium on liquidity and demand or it.49
Higher demand or liquidity associated with re sales can magniy and spread quickly across both asset
47 Billio, Getmansky, Lo, and Pelizzon (2011).48 Bhattacharya, Lee, and Pool (2013).49 Begalle, Martin, McAndrews, and McLaughlin (2013).

7/27/2019 Asset Management and Financial Stability
http://slidepdf.com/reader/full/asset-management-and-financial-stability 24/34
22 Oce o Financial Research
classes and nancial institutions, causing market prices to decline and market condence to all across
market sectors.50
Fire sales can have a number o causes. Financial rms and market participants that use leverage or are
required to maintain specic capital levels may be orced to sell assets at depressed prices i a decline in
asset prices prompts higher haircuts or margin calls rom creditors. Signicant sales by a single large rm
could depress asset valuation or increase market volatility, thereby transmitting stress to other institutions,
which may then also ace margin calls and be orced to sell assets, creating a knock-on eect. Alternatively,
securities dealers having diculty unding their activities may sell assets to generate liquidity, or investors
in repurchase agreements may decide to sell collateral in the wake o a dealer deault. Cascading eects
rom re sales can ampliy deterioration o market condence and deepen a crisis.
In asset management, the ollowing actors can increase the likelihood and severity o re sales:
• Large market positions and concentrations. Fire sales may be exacerbated when a single und
or und complex holds a large market position in a particular asset, sector, or strategy. This risk is
heightened i the market has high inormational or other barriers to entry; a lack o substitute investors
could result in severe price depression i the und or und complex unwound its portolio quickly.
Asset managers managing large specialized unds and separate accounts with similar strategies
may manage signicant shares o important niche markets, which may not be ully transparent.
Specialization concerns apply most directly to unds that ocus on illiquid investments or unds that
make large, concentrated bets.
• Illiquid markets. As markets become more illiquid, potentially due to market stress, they become
increasingly prone to re sales. Asset classes that tend to be less liquid include xed-income securities,
bank loans, and derivatives such as single-name credit deault swaps. Customized or “bespoke”
products can be particularly illiquid i they include complex combinations o derivatives and less liquid
assets.
• Reputation risk. I an asset manager or one o its specialized unds suers damage to its reputation,
the redemption risk or the asset manager’s unds could increase and heighten re-sale risk. The
potential asset pricing impact would be heightened i asset managers’ unds and accounts held large
positions in sectors with relatively low trading volumes, as in certain xed income assets or markets.
• Crowded trades. Crowded trades can distort market prices and increase re-sale risk. As discussed
earlier, crowded trades occur when market participants have similar, correlated holdings in an asset
class or trading strategy, and herding occurs. In the event o a shock, investors in crowded trades
may try to sell or unwind their positions at the same time and in the same direction. Crowded trades
may be especially problematic during a crisis, when ew substitute investors may emerge to halt the
downward spiral.
• Leverage. Excessive leverage can increase the risk that margin calls or other capital calls could prompt
increased asset sales to cover positions. This risk is heightened in complex or less liquid unds, because
price dislocation may be more severe, and during periods o market stress.
• Transactions with liquidity “puts.” Certain transactions, such as securities lending and repo, have
contractual obligations requiring liquidity upon demand and involve a large number o market
50 Coval and Staord (2007); Jotikasthira, Lundblad, and Ramadorai (2012); Raddatz and Schmukler (2012).
7/27/2019 Asset Management and Financial Stability
http://slidepdf.com/reader/full/asset-management-and-financial-stability 25/34
Asset Management and Financial Stability 2013 23
participants. During periods o market stress, orced sales associated with these contractual
obligations could increase the probability o re sales.
• Funding mismatches. Short-term unding o long-term investments can lead to re sales when
unding liquidity is tight and investment values experience a negative shock.51
Mutual unds aced signicant redemption requests during the crisis. According to Morningstar, redemp-
tions rom strategic income unds totaled $75 billion in the ourth quarter o 2008, nearly twice the volumeduring the quarter a year earlier, and redemptions by investors in government bond unds were $31
billion, 130 percent higher than during the ourth quarter o 2007. Although redemption risks that increase
outfows rom unds during periods o market stress do not necessarily pose threats themselves, they
complicate liquidity management and can contribute to re-sale risk.
According to some research, mutual unds in 2008 appeared to have been aected by re-sale dynamics.
Sharp declines in the value o their holdings o nancial stocks may have compelled asset managers to
sell o nonnancial stocks in their portolios as well. As evidence, researchers ound in a 2012 paper that
10.5 percent o the 52 percent decline in the U.S. stock market related to the crisis could be attributed to
distressed selling by mutual unds.52 The paper noted, somewhat counter-intuitively, that this discount
was highest or stocks that were considered stable and perormed well beore the crisis. In this way, unds
sought to avoid realizing potentially large losses rom selling stocks with the most depressed prices.
Although this strategy had a stabilizing eect on the price o nancial stocks, increased selling o nonnan-
cial stocks may have contributed to market weakness in other sectors.53
51 Boyson, Stahel, and Stulz (2010); Covitz, Liang, and Suarez (2013).52 Hau and Lai (2012).53 Manconi, Massa, and Yasuda (2012).

7/27/2019 Asset Management and Financial Stability
http://slidepdf.com/reader/full/asset-management-and-financial-stability 26/34
24 Oce o Financial Research
Data GapsSignicant data gaps impede eective macroprudential analysis and
oversight o asset management rms and activities. Data gaps block
regulators’ and supervisors’ view o risk-taking, leverage, and liquiditytransormation across nancial markets and hinder their ability to ully
analyze the nature and extent o nancial stability risks relating to the asset
management industry.
This section highlights several areas in which better data collection could acilitate macroprudential analy-
sis, oversight, and monitoring o asset management rms and activities. Although increased data reporting
requirements impose costs on rms, the OFR and regulators with jurisdiction over the rms and their activi-
ties discussed below could consider the extent to which signicant benets to nancial stability monitoring
could merit such increased reporting.
Data gaps in separate accounts
Registered investment advisers, banks, and insurance companies manage trillions o dollars in separate
account assets; the top ve asset management companies alone manage $5.5 trillion in separate accounts.54
Data about the types o assets held in these accounts, their counterparty and other risk exposures, and
amounts o leverage are limited. As a result, supervisors today are unable to ully assess the nature or extent
o any nancial stability risks that could be amplied or transmitted by the activities o these accounts.
In a separate account, an asset manager typically has discretion to select and manage assets on behal o a
large institutional investor or high net-worth individual under mandates dened in an investment manage-
ment agreement (IMA). The client retains direct and sole ownership o the assets under management, whichare typically held at an independent custodian on behal o the client. Because separate accounts are not
collective investment vehicles that pool together a variety o investors’ assets (and thus, there is no shared
risk or vulnerability to other shareholders’ redemptions), separate accounts are not subject to restrictions
under the 1940 Act, such as those relating to investment concentration or leverage. Rather, their ability to
take on leverage or to invest in various asset classes or concentrated positions is specied in the IMA and
thus is contractually agreed between the asset manager and the client.
In addition, advisers to separate accounts are regulated under the Investment Advisers Act o 1940, appli-
cable bank duciary regulations, and applicable state investment adviser regulations (or other similar
regulations). Private pension plans, which are oten separate account clients, are required to abide by guide-
lines established by the Department o Labor under the Employee Retirement Income Security Act (ERISA).
Although these regulators typically collect inormation about these advisers’ assets under management,
types o clients, and types o advisory activities, they do not routinely collect inormation about separate
account holdings, leverage, risk exposures, or liquidity. In addition, although securities supervisors peri-
odically examine asset managers that they regulate, including any separate accounts they manage, they
54 Insurer separate accounts, which include on-balance-sheet liabilities on the part o the oering insurance company, are not included in this analysis.
7/27/2019 Asset Management and Financial Stability
http://slidepdf.com/reader/full/asset-management-and-financial-stability 27/34
Asset Management and Financial Stability 2013 25
normally ocus their examinations on ensuring that the manager adheres to duciary obligations, investor
protection regulations, and contractual agreements such as the IMA.55
As a result o this regulatory ramework, data to analyze aggregate exposures and asset holdings o sepa-
rate accounts across asset management complexes are limited. Some private data providers gather data
on separate accounts, but asset managers provide these data only on a voluntary basis and these data are
inconsistent.
For a number o reasons, collecting additional data on leverage practices and risk exposures in separate
accounts could be useul or nancial stability monitoring. First, in some cases separate accounts are largely
“clones” o existing strategies o unds managed by the asset manager, with small adjustments. Thereore,
i the manager makes a shit in strategy in response to a nancial shock, these clone accounts can magniy
the impact o this strategy shit beyond the impact rom its managed unds. Thus, separate accounts can
potentially magniy the impacts rom herding behavior.
In other cases, separate accounts can contain highly bespoke strategies that diverge signicantly rom
registered und strategies. For example, to generate higher returns or investors that would like to take on
more risk than a pooled investment vehicle, a separate account manager might create a highly customized
strategy involving illiquid securities or additional leverage.56 These strategies can be idiosyncratic, and thus
tend to diversiy risk in the nancial system and mitigate nancial stability risks. However, i a number o
large separate accounts take similar positions, particularly i highly leveraged or in a concentrated relatively
illiquid market, those accounts could potentially help magniy or transmit nancial stability shocks.
Given the limitations o existing data, the potential ways that separate account exposures or asset sales
could aect markets are not adequately understood. Filling gaps in these data would allow or better
macroprudential monitoring o related risks.
Data gaps in securities lending and repo markets
As noted earlier, monitoring the reinvestment o cash collateral rom securities lending is important or
nancial stability purposes, but such monitoring is limited by a lack o data. Collecting transaction level andposition data on securities lending between large international nancial institutions, including the compo-
sition o the underlying cash collateral reinvestment assets, would improve regulators’ visibility into market
activities.57 Section 984 o the Dodd-Frank Act requires the SEC to adopt rules increasing the transparency
o inormation about securities lending available to broker-dealers and investors. Such a rulemaking could
ll some o the data gaps described earlier.
Similar concerns exist regarding the involvement o asset managers in repo activity. During a period o
market stress in which unding liquidity is drying up, rms with large repo books and an array o inter-
connections may have diculty unwinding clients’ investments quickly.58 Because such a situation could
dislocate markets and heighten re-sale risk, data on repo activity are critical to monitoring developments
that could indicate stress.59 Currently, many repo transactions can be monitored only indirectly.60 Although
55 National bank examinations o separate accounts ocus on a bank’s duciary duties to its customers, risks associated with the investment portolios o these accounts, and the overall risks posed, in aggregate, by investment concentrations in these accounts and similarly run collective investment vehicles(OCC, 2001).
56 In one o our industry interviews, an asset manager noted that it was able to use separate accounts to replicate a hedge und strategy that the managerdid not oer to its und investors.
57 Such an approach is consistent with the Financial Stability Board’s Workstream 5 policy ramework or addressing risks in repos and securities lending (FSB,2012 and 2013).
58 FSOC (2013), pp. 133-134.
59 Begalle, Martin, McAndrews, and McLaughlin (2013); Martin, Skeie, and von Thadden (2012).60 Tarullo (2013).
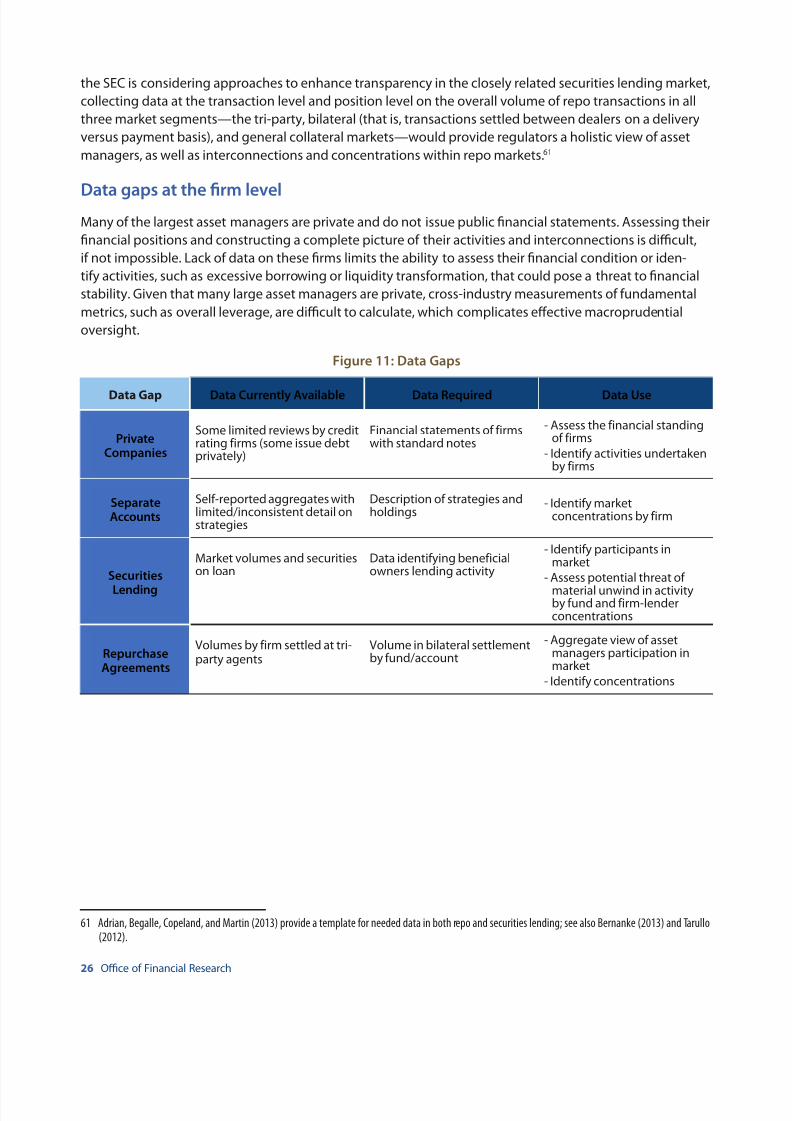
7/27/2019 Asset Management and Financial Stability
http://slidepdf.com/reader/full/asset-management-and-financial-stability 28/34
26 Oce o Financial Research
the SEC is considering approaches to enhance transparency in the closely related securities lending market,
collecting data at the transaction level and position level on the overall volume o repo transactions in all
three market segments—the tri-party, bilateral (that is, transactions settled between dealers on a delivery
versus payment basis), and general collateral markets—would provide regulators a holistic view o asset
managers, as well as interconnections and concentrations within repo markets.61
Data gaps at the frm levelMany o the largest asset managers are private and do not issue public nancial statements. Assessing their
nancial positions and constructing a complete picture o their activities and interconnections is dicult,
i not impossible. Lack o data on these rms limits the ability to assess their nancial condition or iden-
tiy activities, such as excessive borrowing or liquidity transormation, that could pose a threat to nancial
stability. Given that many large asset managers are private, cross-industry measurements o undamental
metrics, such as overall leverage, are dicult to calculate, which complicates eective macroprudential
oversight.
Figure 11: Data Gaps
Data Gap Data Currently Available Data Required Data Use
PrivateCompanies
Some limited reviews by creditrating irms (some issue debtprivately)
Financial statements o irmswith standard notes
- Assess the inancial standingo irms
- Identiy activities undertakenby irms
SeparateAccounts
Sel-reported aggregates withlimited/inconsistent detail onstrategies
Description o strategies andholdings
- Identiy marketconcentrations by irm
Securities
Lending
Market volumes and securitieson loan
Data identiying beneicialowners lending activity
- Identiy participants inmarket
- Assess potential threat o
material unwind in activityby und and irm-lenderconcentrations
RepurchaseAgreements
Volumes by irm settled at tri-party agents
Volume in bilateral settlementby und/account
- Aggregate view o assetmanagers participation inmarket
- Identiy concentrations
61 Adrian, Begalle, Copeland, and Martin (2013) provide a template or needed data in both repo and securities lending; see also Bernanke (2013) and Tarullo(2012).
7/27/2019 Asset Management and Financial Stability
http://slidepdf.com/reader/full/asset-management-and-financial-stability 29/34
Asset Management and Financial Stability 2013 27
Appendix: Asset Management Firms and Activities
Firm typesFigure 1 displays the major participants in the asset management industry. Three kinds o rms are
prominent:
• Banks. Banks oten have asset management divisions through which they oer depositors and other
customers’ duciary services such as investment unds, wealth management services, trust services,
and retirement products. These services may be oered through separate accounts or unds such
as bank common trust unds or collective investment unds. A bank’s investment management
activities are exempt rom SEC registration requirements unless the bank provides those services to
an SEC-registered investment company, such as a mutual und. In general, bank asset management
activities are o-balance sheet.
• Insurance companies. Insurance companies oten have asset management divisions that provide
investment management and other services, such as retirement plans and guaranteed payments
to clients. A number o insurance companies have acquired asset managers in recent years to
expand their asset management businesses. For example, Allianz acquired PIMCO and AXA acquired
AllianceBernstein. Insurance companies’ asset management activities are distinct rom their
on-balance sheet insurance activities, such as those in their general accounts or associated with
certain insurance separate accounts.
• Dedicated asset management companies. Dedicated asset management companies have two
characteristics: (1) their main business is asset management, and (2) they are not integrated divisions
o a bank or insurance company.62 Although dedicated asset management companies are not
regulated as bank holding companies by the Federal Reserve, many o them maintain a trust bank,regulated by the Oce o the Comptroller o the Currency or a state bank regulatory agency, to oer
collective investment unds to eligible clients or certain individual retirement account products, as
required under ERISA. Several are very large organizations involved in disparate businesses, servicing
many types o clients and oering services similar to those oered by banks. Some are publicly
traded, while others are privately held and do not provide publicly available, consolidated nancial
statements. Most dedicated asset management companies are registered with, and regulated by, the
SEC as investment advisers.
Fund types
There are our primary und types in the industry:• Registered investment companies are registered under the Investment Company Act o 1940 (1940
Act). They are required to abide by strict rules governing saekeeping and proper valuation o assets,
transactions with aliates, governance or und management, use o leverage, and availability o
62 Some dedicated asset management companies are autonomous subsidiaries o large nancial rms, such as PIMCO with respect to Allianz, and BlackRockwith respect to PNC. The assets o these subsidiaries are generally not included on the parent rm’s balance sheet and general management is delegatedto the subsidiary.

7/27/2019 Asset Management and Financial Stability
http://slidepdf.com/reader/full/asset-management-and-financial-stability 30/34
28 Oce o Financial Research
liquidity, among other requirements. Registered investment companies include mutual unds, ETFs,
closed-end unds, and unit investment trusts.
• Private unds, such as hedge unds and private equity unds, are excluded rom registration under
the 1940 Act, but advisers to these unds are generally required to register with the SEC or a state
securities regulator.
• Bank common and collective investment unds are similarly excluded rom rules under the 1940 Act,
but, as noted earlier, are oten subject to rules established by banking regulators.
• Separate accounts are accounts in which an asset manager selects assets on behal o large
institutional investors or high net-worth individuals under mandates dened in an investment
management agreement. Clients retain direct and sole ownership o assets under management.
Separate accounts are not specically regulated under the 1940 Act, the Securities Act o 1933, or
bank-specic regulations, although managers o those accounts are oten registered investment
advisers required to register with the SEC or a state securities regulator.63
63 O-balance sheet separate accounts oered by asset managers dier rom on-balance sheet separate accounts oered by insurance companies in thatthey generally do not have contracted manager liabilities. Insurance companies with asset management divisions oten oer both asset managementseparate accounts (o-balance sheet) as well as insurance separate accounts (on-balance sheet).

7/27/2019 Asset Management and Financial Stability
http://slidepdf.com/reader/full/asset-management-and-financial-stability 31/34
Asset Management and Financial Stability 2013 29
ReferencesAdam, Tim, and Andre Guettler. “The Use o Credit Deault Swaps by U.S. Fixed-Income Mutual Funds.” WorkingPaper No. 2011-01, Washington, D.C.: FDIC Center or Financial Research, November 19, 2010.
Adrian, Tobias, Brian Begalle, Adam Copeland, and Antoine Martin. “Repo and Securities Lending.” Sta Report no.
529, New York: Federal Reserve Bank o New York, December 2011. Revised February 2013.Bank o England. “Developments in the global securities lending market.” Quarterly Bulletin 51, no. 3 (2011):224-233.
Begalle, Brian J., Antoine Martin, James McAndrews, and Susan McLaughlin. “The Risk o Fire Sales in the Tri-PartyRepo Market.” Sta Report No. 616, New York: Federal Reserve Bank o New York, May 2013.
Bernanke, Ben S. “Monitoring the Financial System.” Speech at the 49th Annual Conerence on Bank Structure andCompetition sponsored by the Federal Reserve Bank o Chicago, Chicago, May 10, 2013.
Bhattacharya, Utpal, Jung Hoon Lee, and Veronika Krepely Pool. “Conficting Family Values in Mutual Fund
Families.” Journal of Finance 68, no. 1 (2013): 173-200.
Billio, Monica, Mila Getmansky, Andrew W. Lo, and Loriana Pelizzon. “Econometric Measures o Connectedness and
Systemic Risk in the Finance and Insurance Sectors.” MIT Sloan Research Paper No. 4774-10, Cambridge, Mass.: MIT,
November 1, 2011.
The Boston Consulting Group. “Global Asset Management 2013: Capitalizing on the Recovery.” Boston: BCG, 2013.https://www.bcgperspectives.com/content/articles/nancial_institutions_
global_asset_management_2013_capitalizing_recovery/ (accessed July 12, 2013).
Boyson, Nicole, Christo Stahel, and Rene Stulz. “Hedge Fund Contagion and Liquidity Shocks.” Journal of Finance
65, no. 5 (2010): 1789-1816.
Brady, Steanie, Ken Anadu, and Nathaniel Cooper. “The Stability o Prime Money Market Mutual Funds: Sponsor
Support rom 2007 to 2011.” Working Paper RPA 12-3, Boston: Federal Reserve Bank o Boston, August 13, 2012.
Brown, Keith C., W. V. Harlow, and Laura T. Starks. “O Tournaments and Temptations: An Analysis o Managerial
Incentives in the Mutual Fund Industry.” Journal of Finance 51, no. 1 (1996): 85-110.
Brunnermeier, Markus K., and Lasse H. Pedersen. “Market Liquidity and Funding Liquidity.” Review of Financial Studies 22, no. 6 (2009): 2201-2238.
Chen, Qi, Itay Goldstein, and Wei Jiang. “Payo Complementarities and Financial Fragility: Evidence rom MutualFund Outfows.” Journal of Financial Economics 97, (2010): 239-262.
Chevalier, Judith, and Glenn Ellison. “Risk Taking by Mutual Funds as a Response to Incentives.” Journal of Political Economy 105, no. 6 (1997): 1167-1200.
Committee o European Securities Regulators. CESR’s Guidelines on Risk Measurement and the Calculation of Global Exposure and Counterparty Risk for UCITS. Paris: CESR, July 28, 2010.
Coval, Joshua, and Erik Staord. “Asset re sales (and purchases) in equity markets.” Journal of Financial Economics 86, no. 2 (2007): 479-512.
Covitz, Daniel, Nellie Liang, and Gustavo Suarez. “The Evolution o a Financial Crisis: Collapse o the Asset-BackedCommercial Paper Market.” Journal of Finance 68, no. 3 (2013): 815-848.
Dasgupta, Amil, Andrea Prat, and Michela Verardo. “Institutional Trade Persistence and Long-Term Equity Returns.” Journal of Finance 66, no. 2 (2011): 635-653.
Financial Services Authority. Implementation of the Alternative Investment Fund Managers Directive. ConsultationPaper, London: FSA, November 14, 2012.
Financial Stability Board. Strengthening Oversight and Regulation of Shadow Banking. Consultative Document, FSB,
November 18, 2012.

7/27/2019 Asset Management and Financial Stability
http://slidepdf.com/reader/full/asset-management-and-financial-stability 32/34
30 Oce o Financial Research
Financial Stability Board. Strengthening Oversight and Regulation of Shadow Banking: Policy Framework for Addressing Shadow Banking Risks in Securities Lending and Repos and Policy Framework for Strengthening Oversight
and Regulation of Shadow Banking Entities. Consultative Documents, FSB, August 29, 2013.
Financial Stability Oversight Council. Authority to Require Supervision and Regulation of Certain Nonbank Financial
Companies. Final Rule and Interpretive Guidance, Federal Register 77, no. 70, April 11. Washington, D.C.: FSOC,2012a, 21637-21662.
Financial Stability Oversight Council. 2012 Annual Report. Washington, D.C.: FSOC, 2012b.Financial Stability Oversight Council. Proposed Recommendations Regarding Money Market Mutual Fund Reform.
Washington, D.C.: FSOC, November 2012, 2012c.
Financial Stability Oversight Council. 2013 Annual Report. Washington, D.C.: FSOC, 2013.
Gaspar, Jose-Miquel, Massimo Massa, and Pedro Matos. “Favoritism in Mutual Fund Families? Evidence on Strategic
Cross-Fund Subsidiation.” Journal of Finance 61, no. 1 (2006): 73-104.
Gennaioli, Nicola, Andrei Shleier, and Robert Vishny. “Neglected Risks, Financial Innovation, and Financial Fragility.” Journal of Financial Economics 104, no. 3 (2012): 453.
Grynbaum, Michael M. “Mortgage Crisis Forces the Closing o a Fund.” The New York Times, December 11, 2007.
Hau, Harald, and Sandy Lai. “The Role o Equity Funds in the Financial Crisis Propagation.” Research Paper No.
11-35, Geneva: Swiss Finance Institute, June 2, 2012.
Huang, Jennier, Clemens Sialm, and Hanjiang Zhang. “Risk Shiting and Mutual Fund Perormance.” Review of
Financial Studies 24, no. 8 (2011): 2515-2616.
Investment Company Institute. 2013 Investment Company Fact Book . Washington, D.C.: ICI, 2013a.
Investment Company Institute. Exchange-Traded Fund Data June 2013. Washington, D.C.: ICI, 2013b.
Jotikasthira, Chotibhak, Christian Lundblad, and Tarun Ramadorai. “Asset Fire Sales and Purchases and the
International Transmission o Funding Shocks.” Journal of Finance 67, no. 6 (2012): 2015-2050.
Keane, Frank M. “Securities Loans Collateralized by Cash: Reinvestment Risk, Run Risk, and Incentive Issues.” Federal
Reserve Bank o New York, Current Issues in Economics and Finance 19, no. 3 (2013).
Manconi, Alberto, Massimo Massa, and Ayako Yasuda. “The Role o Institutional Investors in Propagating the Crisis
o 2007–2008.” Journal of Financial Economics 104, no. 3 (2012): 491-518.
Martin, Antoine, David Skeie, and Ernst-Ludwig von Thadden. “Repo Runs.” Sta Report no. 444, New York: FederalReserve Bank o New York, April 2010, Revised January 2012.
Mitchell, Mark, Lasse H. Pedersen, and Todd Pulvino. “Slow Moving Capital.” American Economic Review 97, no. 2(2007): 215-220.
Oce o the Comptroller o the Currency. Short-Term Investment Funds. Final Rule, Federal Register 77, no. 70,October 9. Washington, D.C.: OCC, 2012, 61229-61238.
Oce o the Comptroller o the Currency. Comptroller’s Handbook: Investment Management Services. Washington,D.C.: OCC, 2001.
Raddatz, Claudio, and Sergio L. Schmukler. “On the International Transmission o Shocks: Micro-Evidence rom
Mutual Fund Portolios.” Journal of International Economics 88, no. 2 (2012): 357-374.
Schmidt, Lawrence D. W., Allan G. Timmermann, and Russ R. Wermers. “Runs on Money Market Mutual Funds.”Working paper, January 2, 2013.
Securities and Exchange Commission. Revisions of Guidelines to Form N-1A. Investment Company Act Release No.
18612, Federal Register 57, No. 55, March 20, 1992. Washington, D.C.: SEC, 1992, 9828-9829.
Securities and Exchange Commission. Mutual Funds and Derivative Instruments. Division o Investment
Management, September 26, 1994. Washington, D.C.: SEC, 1994.

7/27/2019 Asset Management and Financial Stability
http://slidepdf.com/reader/full/asset-management-and-financial-stability 33/34
Asset Management and Financial Stability 2013 31
Securities and Exchange Commission. Use of Derivatives by Investment Companies under the Investment Company Act of 1940. Concept Release, Federal Register 76, no. 173, September 7, 2011. Washington, D.C.: SEC, 2011,
55237-55255.
Securities and Exchange Commission. “OppenheimerFunds to Pay $35 Million to Settle SEC Charges or Misleading
Statements during Financial Crisis.” Press Release 2012-110, June 6, 2012. Washington, D.C.: SEC, 2012.
Securities and Exchange Commission. Money Market Fund Reform. Proposed Rule, Release No. 33-9408, IA-3616.
Washington, D.C.: SEC, 2013.Securities and Exchange Commission and Commodity Futures Trading Commission. Findings Regarding the Market Events of May 6, 2010. Washington, D.C.: SEC-CFTC, 2010. http://www.sec.gov/news/studies/2010/marketevents-report.pd (accessed January 15, 2013).
Sias, Richard W. “Institutional Herding.” The Review of Financial Studies 17, no. 1 (2004): 165-206.
Spatt, Chester S. “Conficts o Interest in Asset Management.” Speech at the Hedge Fund Regulation andCompliance Conerence, New York, May 12, 2005.
Tarullo, Daniel K. “Shadow Banking Ater the Financial Crisis.” Speech at the Federal Bank o San FranciscoConerence on Challenges in Global Finance: The Role o Asia, San Francisco, June 12, 2012.
Tarullo, Daniel K. “Dodd-Frank Implementation.” Testimony beore the Committee on Banking, Housing, and UrbanAairs, U.S. Senate, Washington, D.C., July 11, 2013.
Thomsen, Linda C. “Testimony Concerning the SEC’s Recent Actions With Respect to Auction Rate Securities.” Testimony beore the Committee on Financial Services, U.S. House o Representatives, Washington, D.C.,
September 18, 2008.
Wermers, Russ. “Mutual Fund Herding and the Impact on Stock Prices.” Journal of Finance 54, no. 2 (1999): 581-622.

7/27/2019 Asset Management and Financial Stability
http://slidepdf.com/reader/full/asset-management-and-financial-stability 34/34
Ofce o Financial Research
U.S. Department of Treasury
www.treasury.gov/or