Embed Size (px)
Citation preview
Asset Management and
Performance Indicators for Water Utilities
Erik Porse & Maureen KernerOWP at Sacramento State
US EPA Region 9 Environmental Finance Center (EFC)
Environmental Finance Center Network (EFCN)
California State Water Resources Control Board Training
March 2019
Environmental Finance Center Network (EFCN)
2
• Network of university-based centers across the U.S. building
local capacity to address environmental management needs
https://efcnetwork.org

The EPA Region 9 EFC
3
• Providing expertise and tools for financing environmental
and public health programs
• Water system management and funding
California
Arizona
Nevada
Hawaii
Pacific Islands
Tribal Lands

Assessing Water Utility Performance
4
Asset
Management
Governance
Financial
Capability
Operations
Utility
Performance
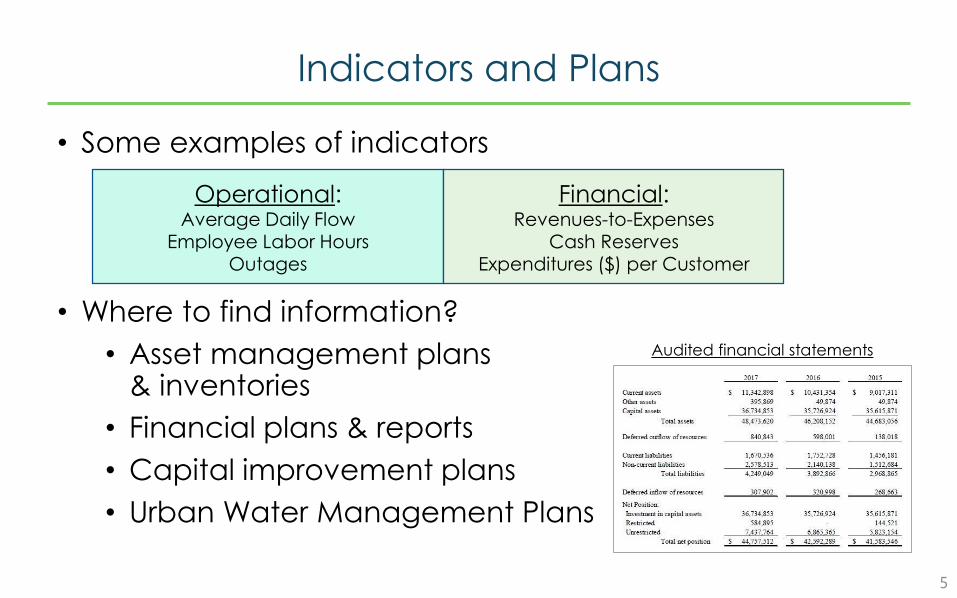
Indicators and Plans
5
• Some examples of indicators
• Where to find information?
• Asset management plans & inventories
• Financial plans & reports
• Capital improvement plans
• Urban Water Management Plans
Operational:Average Daily Flow
Employee Labor HoursOutages
Financial:Revenues-to-Expenses
Cash ReservesExpenditures ($) per Customer
Audited financial statements

Assessing Water Utility Performance
6
Financial
Capability
Utility
Performance
Asset
Management
Governance
Asset
Management
Operations

Asset Management

Asset Management for Water Systems
8
• A process for maintaining reliable system operations
• Outlined through plans
• Identified need, especially in small systems
Evaluate system needs:Infrastructure and management
(O&M, permit compliance, future buildouts)
Evaluate financial needs:Estimating costs and revenues
(component costs, staff and labor, funding options)
Includes technical, managerial, and financial aspects:

Some Terms
9
• Asset Inventory: Detailed data on components of a
system and condition
• Level of Service: Maintenance and replacement targets
to provide a reliable system for residents
Photo Credits: pxhere.com, Wikipedia, pcryl.com
An asset inventory is key to asset management and financial planning
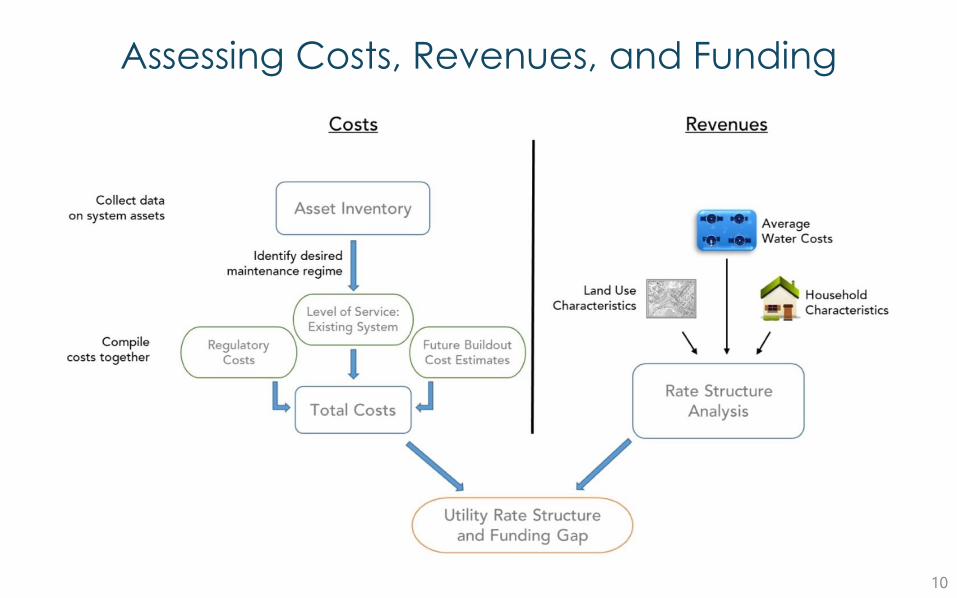
Assessing Costs, Revenues, and Funding
10

Collecting Data
11
Example of an Asset Inventory for a Water Treatment Plant
Source: State Water Board

Prioritizing Investments
12
• No “right” way to prioritize investments
Many Potential Factors:(source: EPA 2003)
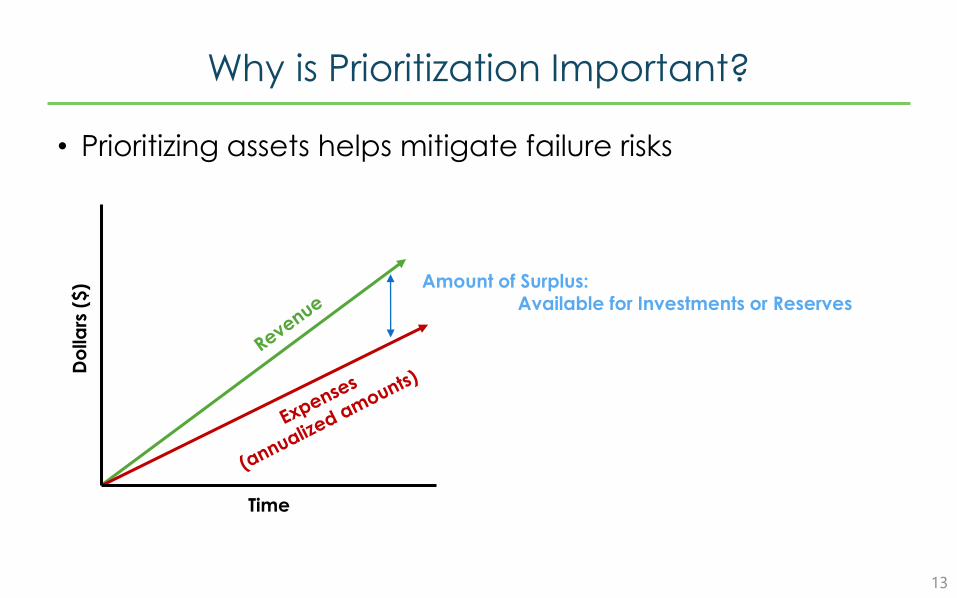
Why is Prioritization Important?
13
• Prioritizing assets helps mitigate failure risks
Time
Do
lla
rs (
$) Amount of Surplus:
Available for Investments or Reserves

Why is Prioritization Important?
14
• Prioritizing helps mitigate risk of failure
Time
Do
lla
rs (
$)
Need Reserves!
Big Equipment Failure

Prioritizing Based on Failure Risk
15
• Probability of Failure (POF): likelihood of an asset failing
• Consequence of Failure (COF): effects of an asset failing
Image Sources: NRCS, Flickr, Wikipedia
Asset 1: Pumps in station Asset 2: Concrete pipe Asset 3: Recycled water pump
Asset Effective Life Structural Condition
POF COF Rank
Pumps in station 30 years Excellent Low High Medium
Concrete water pipe 100 years Poor High Medium High
Recycled water pump 20 years Good Medium Low Low

Ranking Assets
16
• Prioritize investments based on criteria
Invest in This Asset First
Water Treatment Plant: Reordered List

Tools and Data for Asset Management
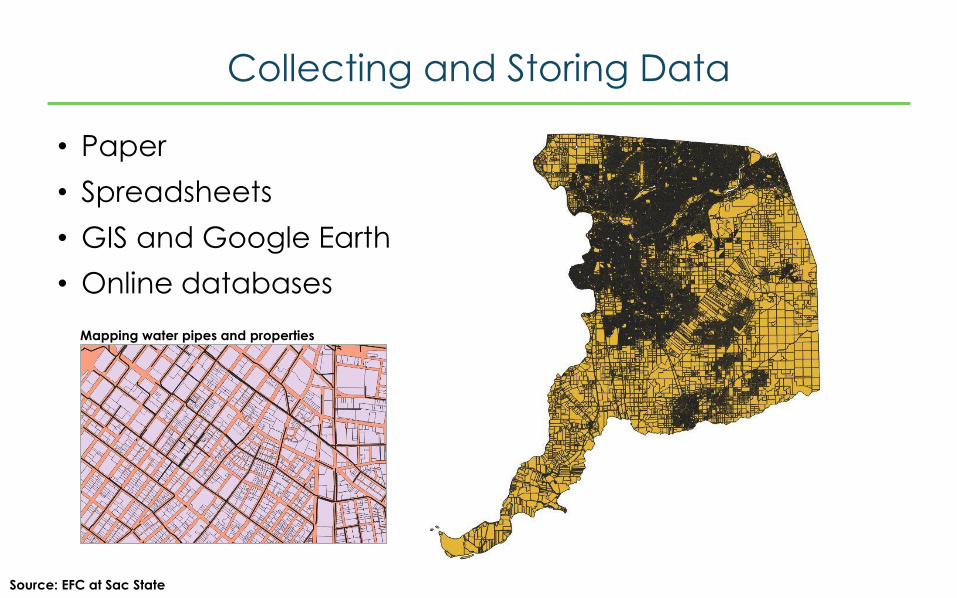
Collecting and Storing Data
• Paper
• Spreadsheets
• GIS and Google Earth
• Online databases
Source: EFC at Sac State
Mapping water pipes and properties

Asset Management Tools
• Paper
• Spreadsheets
• Commercial software
• Free software
EPA’s Check-Up Program for Small Systems (CUPSS) & Mobile Assistant

Assessing Water Utility Performance
21
Asset
Management
Governance
Financial
Capability
Utility
Performance
Financial
Capability
Operations

Financial Capability

Financial Capability
• Utilities: Is a utility maintaining
sufficient funds to operate
and renew systems?
• Customers: Can utility
customers afford to pay
current bills and future
upgrades?
Photo Credits: ASCE, infrastructurereportcard.com

Financial Capability Benchmarks
• Assessing financial capability includes both utilities and
communities
Source: NAPA & USEPA 2017, “Developing a New Framework for Community Affordability of Clean Water Services”
Utility: Capacity for maintaining reliability and managing funds
Possible indicators:
Bond ratings
Debt
Revenues and Expenses
Community: Ability to pay current and future rates required to maintain system
Possible indicators:
Unemployment rates
Median household income & household spending
Collection rates (property taxes or utility bills)
What are the best indicators for small systems?

Some Simple Financial Indicators

Concepts:Expenses
Revenues
Debt
Assets
Maintenance & renewal
Indicators:Operating ratio
Rate analysis
Debt service coverage ratio
Annualized costs
Reserves

Covering Costs
• Operating ratio (revenues-to-expenses)
• Provides a snapshot of ability to pay for operations
Operating Ratio =Operating Revenues
Operating Expenses
• Can be adjusted to account for long-term system
needs

Existing System Conditions
• Annual Replacement Costs, allocated over remaining life
28Source: State Water Board

Existing System Conditions
• Depreciation is accrued reduction in value of assets over
time
• Helps measure extent of deferred O&M, and expenses
Adjusted Operating Ratio =Operating Revenues
(Operating Expenses + Depreciation)
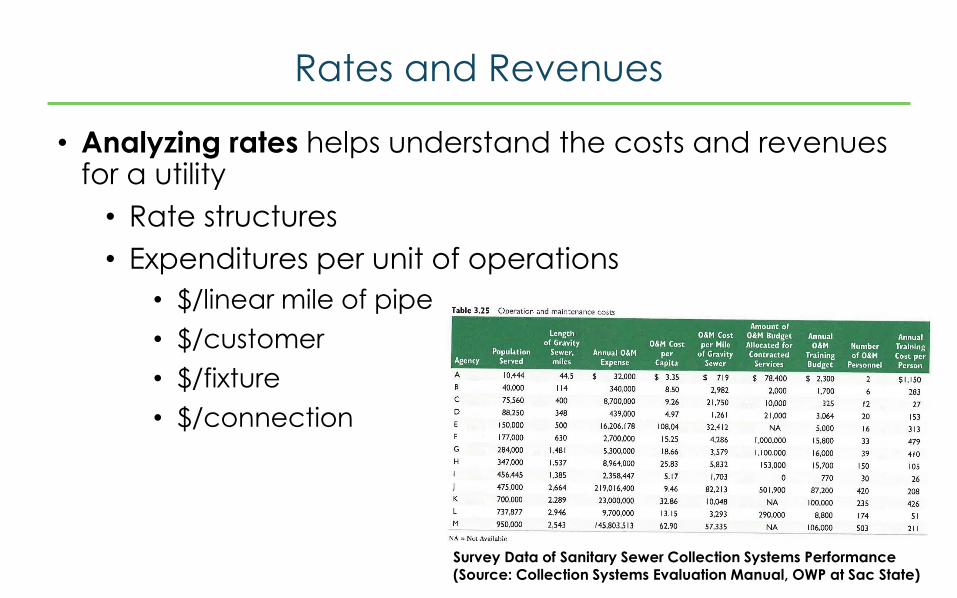
Rates and Revenues
• Analyzing rates helps understand the costs and revenues for a utility
• Rate structures
• Expenditures per unit of operations
• $/linear mile of pipe
• $/customer
• $/fixture
• $/connection
Survey Data of Sanitary Sewer Collection Systems Performance (Source: Collection Systems Evaluation Manual, OWP at Sac State)
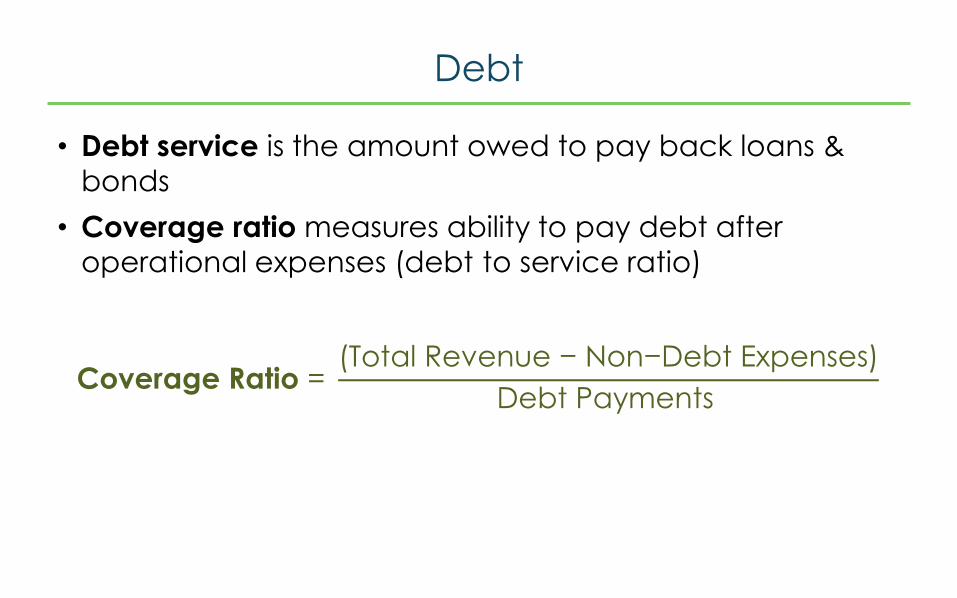
Debt
• Debt service is the amount owed to pay back loans &
bonds
• Coverage ratio measures ability to pay debt after
operational expenses (debt to service ratio)
Coverage Ratio =(Total Revenue − Non−Debt Expenses)
Debt Payments

Saving for that Rainy Day
• Reserves and cash-on-hand
• Cash-on-hand can be in terms of total, days, or
months
Example: Months of Cash on Hand
= Unrestricted Cash
Operational Costs per Month
“Unrestricted cash” can be spent on any expense

Example:
Operating Ratio
Rates Analysis
Debt Service Coverage Ratio

An Example: Hill Valley, CA
1885: Small water system
1955: Growing suburbs
1985: Built out city
2015: Futuristic solutionsCredit: Flickr, alanboar

Finding Information
35
• Annual reports
• Financial statements
• Accounting records

Covering Costs
Operating Ratio =Operating Revenues
Operating Expenses
=$44,200$20,900
= 2.11
=$44,200
$20,900 + $12,200= 1.33
Add Depreciation:

Analyzing Rates
Monthly Retail Water Rates

Paying Debt
Coverage Ratio =(Total Revenue − Non−Debt Expenses)
Debt Payments
=($45,500 − $20,900)
$3,500= 7.03

Summary
39
• No single metric provides a complete estimate of water utility performance
• Need better public data for small and large systems in California
Asset
Management
Governance
Financial
Capability
Operating
Indicators
Utility
Performance

Some Resources
40
• EPA (2003), Learner’s Guide “How to Conduct a Sanitary Survey of Small Water Systems”
• EPA (2004), “Taking Stock of Your Water System”
https://www.epa.gov/sites/production/files/2015-04/documents/epa816k03002.pdf
• EPA (2003), Asset Management: A Handbook for Small Water Systems
https://nepis.epa.gov/Exe/ZyPDF.cgi/2000261D.PDF?Dockey=2000261D.PDF
• New Mexico EFC (2006), “Asset Management: A Guide for Water and Wastewater Systems”
https://www.env.nm.gov/dwb/assistance/documents/AssetManagementGuide.pdf
• ANSI/AWWA G410-09, “Business Practices for Operation and Management”
• RCAP (2011), “The Basics of Financial Management for Small-community Utilities”
http://www.rcapsolutions.org/wp-content/uploads/2013/06/RCAP-Financial-Management-Guide.pdf
• RCAP (2011), “Formulate Great Rates”
https://rcap.org/wp-content/uploads/2012/03/Formulate-Great-Rates.pdf

More Information
41
• Environmental Finance Center Network
UNC: “Financial Benchmarking for Water Utilities”:
https://efc.sog.unc.edu/project/utility-financial-tools
EFC-Network provides technical assistancehttps://efcnetwork.org
• Rural Community Assistance Corporation (RCAC)
https://www.rcac.org

Links
EPA Region 9 Environmental Finance Center:http://www.efc.csus.edu
Office of Water Programs at Sacramento Statehttps://www.owp.csus.edu
@waterprograms
Contact
[email protected] | @researchcp
43