Embed Size (px)
Citation preview

H&S PSD
Asset Registry Plan and Conditions
Assessment Protocol
Advanced Asset Management Approaches for
Medium to Large Sized Drinking Water Utilities
Last Revised 3/22/16

2

3
Table of Contents Figures.................................................................................................................................................3 Tables ..................................................................................................................................................3
A. Introduction .............................................................................................................................4 B. Asset Registry Plan (ARP) Overview .....................................................................................4 C. Conditions Assessment Protocol (CAP) Overview ................................................................4
1. Probability of Failure ..................................................................................................... 5 2. Consequence of Failure.................................................................................................. 7
3. Criticality ....................................................................................................................... 7
4. Data Management .......................................................................................................... 8 5. Asset Management Team Approval ............................................................................... 9
D. Conclusion ....................................................................................................................................9
Appendix A – Asset Registry Plan and Crosswalk Tables ...............................................................10 Appendix B – Condition Ranking.....................................................................................................14
Figures Figure 1. Criticality Chart ............................................................................................................................................8
Tables Table 1. Expected Useful Life......................................................................................................................................6

4
A. Introduction
H&S Public Service District (PSD) has established an Asset Management (AM) process to provide the district with a systematic approach in classifying and identifying assets, gathering data, assigning names, and electronically storing assets physical and geographic information. The objective of the Asset Registry Plan and Conditions Assessment Protocol processes are to effectively communicate the processes that the PSD staff use in AM implementation. This allows for future data refinement and streamlines the decision making processes. This information is a crucial part of developing an Asset Management Plan (AMP) that will be used by the district as a tool to track the system’s operation and maintenance, the equipment condition, and to plan for future capital investment projects.
B. Asset Registry Plan (ARP) Overview
Assets are registered and tracked using two main systems, an Access database for maintenance tracking and a Geographic Information System (GIS) for asset location. These systems are complementary and may each contain information about the same asset. Assets are identified by physical location in the GIS and by a hierarchical ID in the Access database. The ID is based on division within the district (water, sewer, and office/shop) and by asset type. Assets are further grouped by name or locational zone for assets in the distribution system, and by treatment process for assets in the treatment train. A complete description of the ID scheme is given in Appendix A. The GIS is well developed and continues to be corrected and refined as GPS locations are obtained and as new assets are added.
C. Conditions Assessment Protocol (CAP) Overview
H&S PSD’s Condition Assessment Protocol (CAP) was developed to effectively and uniformly assess the probability of failure, consequence of failure, and criticality of assets comprising the PSD’s water system. This process will be completed when there is a change in asset status or during planned or unplanned maintenance of an asset.
CAP Steps 1. Probability of Failure
i. Condition Rating ii. Consumed Life
2. Consequence of Failure 3. Criticality 4. Data Management 5. Asset Management Team Approval

5
Exceptions: The Asset Management Team has determined that although all assets in the distribution system will be added to the asset registry and tracked in the GIS, they will not all undergo the full CAP at this time. Distribution assets currently excluded from the CAP are air releases, flushes (blowoffs) and meters.
Air releases: Assets will be considered run to fail as there is little associated maintenance to extend life cycle.
Flushes: Assets will be considered run to fail. The assets are not considered to be critical in day-to-day operations.
Meters: Assets are excluded from CAP process due to sheer number and redundancy of programs. All meters are tested and maintained following the Water Meter Testing Policy. Meters are tracked and maintenance is scheduled through the utility’s billing system, ASI.
1. Probability of Failure
Probability of failure (PoF) is the likelihood that an asset will fail, or no longer perform its function, in a given year. To determine PoF, the current condition of the asset and the age of the asset in relation to the expected useful life is considered.
𝑃𝑜𝐹 =𝐶𝑜𝑛𝑑𝑖𝑡𝑖𝑜𝑛 𝑅𝑎𝑡𝑖𝑛𝑔 + 𝐶𝑜𝑛𝑠𝑢𝑚𝑒𝑑 𝐿𝑖𝑓𝑒
2
See following sections for explanation of condition rating and consumed life calculations. PoF scores will range from 0 to 100% with 0 being a remote probability of failure and 100% being a near certainty of failure. PoF scores may exceed 100% if the asset is in service beyond its expected life.
i. Condition Rating
Condition Rating is determined using rating charts specific to each asset type (Appendix B). Staff will score each aspect of condition from 1 (excellent) to 5 (very poor). From these values, the condition rating of the asset is calculated.
𝐶𝑜𝑛𝑑𝑖𝑡𝑖𝑜𝑛 𝑅𝑎𝑡𝑖𝑛𝑔 = (𝑆𝑢𝑚 𝑜𝑓 𝐴𝑐𝑡𝑢𝑎𝑙 𝑆𝑐𝑜𝑟𝑒𝑠
𝑆𝑢𝑚 𝑜𝑓 𝑀𝑎𝑥𝑖𝑚𝑢𝑚 𝑃𝑜𝑠𝑠𝑖𝑏𝑙𝑒 𝑆𝑐𝑜𝑟𝑒) × 100
Condition ratings are on a 0 to 100 scale with 0 being excellent condition and 100 being very poor. Exceptions:
Water Lines: The condition ranking chart for water lines includes an assessment of the number of leaks per year. This cannot be calculated as this time because leak tracking in the GIS was just implemented in September 2015. The condition assessment will be based on pipe material only until at least a year of leak information has been collected.
6
Hydrants: Hydrants will be given a condition assessment as they are flushed following the flushing program schedule. Any hydrants that have not been inspected as part of the flushing program will be given a condition rating based on best professional judgement and the condition of similar hydrants that have been inspected.
Valves: Valves (in distribution system) will be grouped by size and installation date (estimated by the when the related project construction occurred) and given a condition rating based on consumed life only. It is not feasible to inspect and score each individual asset at this time. This strategy will be reconsidered as the asset management program matures.
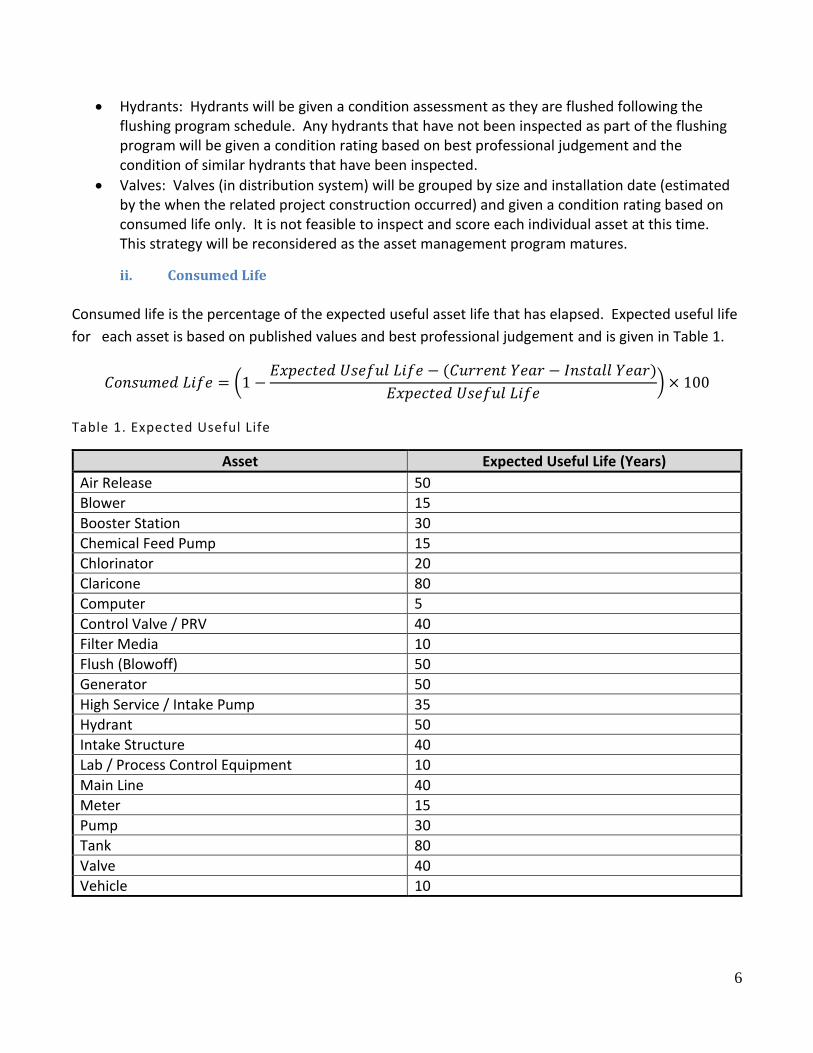
ii. Consumed Life
Consumed life is the percentage of the expected useful asset life that has elapsed. Expected useful life
for each asset is based on published values and best professional judgement and is given in Table 1.
𝐶𝑜𝑛𝑠𝑢𝑚𝑒𝑑 𝐿𝑖𝑓𝑒 = (1 −𝐸𝑥𝑝𝑒𝑐𝑡𝑒𝑑 𝑈𝑠𝑒𝑓𝑢𝑙 𝐿𝑖𝑓𝑒 − (𝐶𝑢𝑟𝑟𝑒𝑛𝑡 𝑌𝑒𝑎𝑟 − 𝐼𝑛𝑠𝑡𝑎𝑙𝑙 𝑌𝑒𝑎𝑟)
𝐸𝑥𝑝𝑒𝑐𝑡𝑒𝑑 𝑈𝑠𝑒𝑓𝑢𝑙 𝐿𝑖𝑓𝑒) × 100
Table 1. Expected Useful Life
Asset Expected Useful Life (Years)
Air Release 50
Blower 15
Booster Station 30
Chemical Feed Pump 15
Chlorinator 20
Claricone 80
Computer 5
Control Valve / PRV 40
Filter Media 10
Flush (Blowoff) 50
Generator 50
High Service / Intake Pump 35
Hydrant 50
Intake Structure 40
Lab / Process Control Equipment 10
Main Line 40
Meter 15
Pump 30
Tank 80
Valve 40
Vehicle 10

7
2. Consequence of Failure
Consequence of Failure (CoF) is the impact, real or hypothetical, to the system in the event of an asset’s failure. Personnel will use tables in Appendix B to assign values ranging from 1 (insignificant) to 5 (catastrophic) for impact to service, cost and ease of repair, and loss of service. CoF is then calculated using the following equation:
𝐶𝑜𝐹 =𝐼𝑚𝑝𝑎𝑐𝑡 𝑆𝑐𝑜𝑟𝑒 + 𝐶𝑜𝑠𝑡 𝑆𝑐𝑜𝑟𝑒 + 𝑆𝑒𝑟𝑣𝑖𝑐𝑒 𝑆𝑐𝑜𝑟𝑒
15× 100
CoF scores are on a 0 to 100 scale with 0 being insignificant and 100 being catastrophic. Exceptions:
Water Lines and Hydrants: CoF will be calculated using information from the GIS. Specific protocols for performing data analysis are in Appendix C.
Valves: Valves (in distribution system) will be given the same CoF score as the line they are located on. It was decided that the consequence of failure of a valve is directly correlated to the CoF of the line on which it is located.
3. Criticality
Criticality is a risk-based priority ranking using probability of failure and consequence of failure.
𝐶𝑟𝑖𝑡𝑖𝑐𝑎𝑙𝑖𝑡𝑦 = 𝐶𝑜𝐹 × 𝑃𝑜𝐹
Criticality is best understood when plotted as a scatter chart. Probability of failure on the x-axis and
Consequence of failure is plotted on the y-axis. Assets in the green quadrant are considered low risk
and need routine maintenance. Assets in the yellow quadrants are considered medium risk and need
aggressive monitoring. Assets in the red quadrant are considered high risk and need immediate
attention.

8
Figure 1. Criticality Chart
4. Data Management
Data is managed using the Access based asset management data base, the GIS and Excel spreadsheets.
All calculations are performed in an Excel spreadsheet. Tables are copied from Access or GIS in Excel
where CoF, PoF and Criticality are calculated and criticality is charted. It is expected that a new tab will
be added each time a critically assessment is completed. This will allow comparison of data over time.
For assets in the distribution system, such as water lines and hydrants, these scores can be joined to
the feature to allow easier visualization of the data using the same color scheme as the criticality chart.
Medium Risk Aggressive Monitoring
Medium Risk Aggressive Monitoring
High Risk Immediate Attention
Low Risk Routine Maintenance

9
5. Asset Management Team Approval
All data is gathered in conjunction with and presented to the asset management team for approval. If there is a discrepancy between calculated criticality values and best professional judgement, the data for that asset will be reviewed and adjusted if necessary.
D. Conclusion
H&S PSD developed this Asset Registry Plan and Conditions Assessment Protocol in an attempt to create
a uniform rating system to be consistently applied by staff when compiling, naming, reporting conditions
of and tracking assets. Our approach considers that not all assets fail at the same rate, have the same
likelihood of failure, or consequence of failure. These documents are included as an appendix to our
AMP to document our formal condition assessment protocol. We acknowledge these plans, processes,
and protocols may need to be revised as we refine our asset management program.
We are committed to making the most cost-effective renewal and replacement investments and
providing the highest-quality customer service possible. We understand this centers our O&M strategy
on those assets critical to the day-to-day operations and those that enable us to meet our Level of Service
(LOS) objectives.

10
Appendix A – Asset Registry Plan and
Crosswalk Tables
11
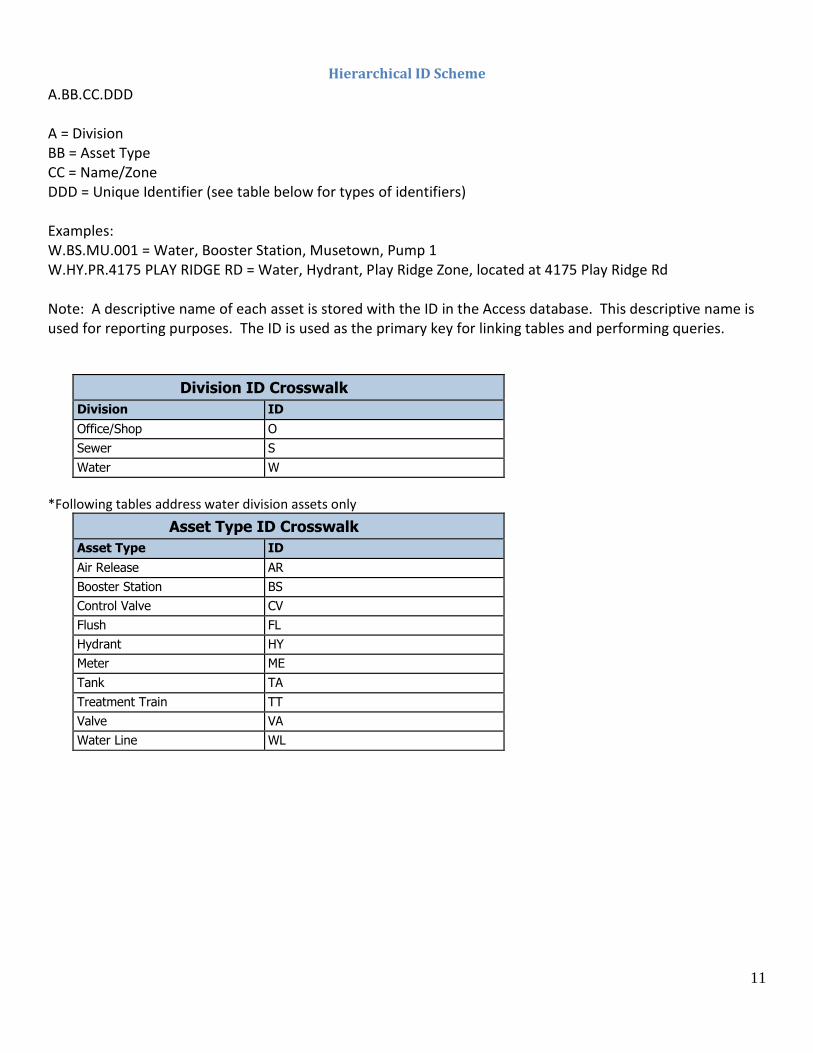
Hierarchical ID Scheme
A.BB.CC.DDD A = Division BB = Asset Type CC = Name/Zone DDD = Unique Identifier (see table below for types of identifiers) Examples: W.BS.MU.001 = Water, Booster Station, Musetown, Pump 1 W.HY.PR.4175 PLAY RIDGE RD = Water, Hydrant, Play Ridge Zone, located at 4175 Play Ridge Rd Note: A descriptive name of each asset is stored with the ID in the Access database. This descriptive name is used for reporting purposes. The ID is used as the primary key for linking tables and performing queries.
Division ID Crosswalk
Division ID
Office/Shop O
Sewer S
Water W
*Following tables address water division assets only
Asset Type ID Crosswalk
Asset Type ID
Air Release AR
Booster Station BS
Control Valve CV
Flush FL
Hydrant HY
Meter ME
Tank TA
Treatment Train TT
Valve VA
Water Line WL

12
Name/Zone ID Crosswalk
Name/Zone ID
Big Bend BB
Camp Binnie CB
Chemical Feed CF
Clarification CL
Core CO
Deer DE
Ridge RG
Dutch Run DU
Filtration FI
Finished Water FW
Griffith Hill GH
Grimes Run GR
Intake IN
Kanawha KA
Lonely Ridge LR
Mountsville MO
Musetown MU
New NE
Old Grove OG
Process Control PC
Play Ridge PR
Sunvalley SV
Rt 45 45
Transfer TR
Walk WA
Unique Identifier Type
Asset Type Identifier Type
Booster Station 3 Digit Sequential Number
Tank 3 Digit Sequential Number
Main Line *ObjectID (from GIS)
Treatment Train 3 Digit Sequential Number
Air Release Physical Address
Control Valve 3 Digit Sequential Number
Hydrant Physical Address
Flush Physical Address
Meter Serial Number
Valve Physical Address

13
Physical addresses are based on the 911 addressing standards, but are for internal use only. Assets are given a physical address after the coordinates are confirmed by GPS. Note: Water lines are difficult to ID due to their linear nature. Water lines are grouped by zone then referenced by ObjectID. This is a unique number automatically assigned by the GIS. Using this ObjectID, the main line can be searched for and viewed in the GIS. Water lines are broken into sections by original paper map page, line size and material type.

14
Appendix B – Condition Ranking

15
Condition Assessment – Buildings
Asset Name: _____________________________________________________________________________________________ Install Date: _________________
Condition Ranking - Circle best description for each row
Aspect 1 – Excellent 2 – Good 3 – Fair 4 – Poor 5 – Very Poor
Exterior Building
Condition
Great condition. No
delamination's (Siding, Roof,
Foundation, Doors and
Windows in pristine
condition).
Good condition. No visual
delamination (Siding, Roof,
Foundation, Doors and Windows
showing minimal wear).
Fair condition. Minor
delamination's (Siding, Roof,
Foundation, Doors and
Windows need adjustment).
Poor condition. Some visual
delamination's (Siding, Roof,
Foundation, Doors and Windows
not working).
Very Poor -Critical condition. Excessive
delamination's (Siding, Roof leaking,
Foundation, Doors and Windows
broken). Unsafe.
Interior Building
Condition
Great condition. No
delamination's (Walls, Ceiling
and Floors in pristine
condition).
Good condition. No visual
delamination (Walls, Ceiling and
Floors showing minimal wear).
Fair condition. Minor
delamination's (Repainting
needed, light bulbs need replaced
and windows or doors need
adjustment).
Poor condition. Some visual
delamination's (Windows or
doors inoperable, paint
peeling and electrical
components not working).
Very Poor -Critical condition.
Excessive delamination's (Windows
broken and doors unlockable).
Unsafe.
Consequence of Failure - Circle best description for each row
Aspect 1 – Insignificant 2 – Minor 3 – Moderate 4 – Major 5 - Catastrophic
Impact to
Service
0-5% of Customers without
Service
6-10% of Customers without Service 11-20% of Customers
without Service
21-40% of Customers without Service 41% or More of Customers without
Service
Cost and Ease of Repair
Low Cost and Can be Quickly
Repaired by Staff
Low Cost and Cannot be Quickly
Repaired Staff
High Cost and Can be
Quickly Repaired by Staff
High Cost and a Contractor would be
Required to Repair
High Cost (Require a Loan or Grant
and Potentially Rate Changes) and
a Contractor and Design are
Required to Repair
Loss of Service Can be out of Service indefinitely Can be Out of Service for more
than 1 Month
Can Be Out of Service for
more than 1 Week
Can be Out of Service for 1-2 Days Cannot be Out of Service for 8
Hours
Date Completed: _____________________________________________________________________________________________________________________________
Person Completing: ___________________________________________________________________________________________________________________________
Last Revised 9/29/15

16
Condition Assessment – Chemical Feed
Asset Name: _____________________________________________________________________________________________ Install Date: _________________
Condition Ranking - Circle best description for each row
Aspect 1 – Excellent 2 – Good 3 – Fair 4 – Poor 5 – Very Poor
Feed line leakage No detectable leakage Minor detectable
leakage
Moderate detectable leakage Considerable detectable leakage Heavy detectable leakage
Feed Pump Noise No unusual noises
detected
Slight whine/rattle detected Moderate whine/rattle detected, easily
heard over pump noise
Loud whine/rattle Disturbingly loud vibrations
during operation
Avg #Unplanned
Outages/Year
0/year 1/year 2/year 3/year More than 3/year
Consequence of Failure - Circle best description for each row
Aspect 1 – Insignificant 2 – Minor 3 – Moderate 4 – Major 5 - Catastrophic
Impact to
Service
0-5% of Customers without
Service
6-10% of Customers without Service 11-20% of Customers
without Service
21-40% of Customers without Service 41% or More of Customers without
Service
Cost and Ease of Repair
Low Cost and Can be Quickly
Repaired by Staff
Low Cost and Cannot be Quickly
Repaired Staff
High Cost and Can be
Quickly Repaired by Staff
High Cost and a Contractor would be
Required to Repair
High Cost (Require a Loan or Grant
and Potentially Rate Changes) and
a Contractor and Design are
Required to Repair
Loss of Service Can be out of Service indefinitely Can be Out of Service for more
than 1 Month
Can Be Out of Service for
more than 1 Week
Can be Out of Service for 1-2 Days Cannot be Out of Service for 8
Hours
Date Completed: _____________________________________________________________________________________________________________________________
Person Completing: ___________________________________________________________________________________________________________________________
Last Revised 9/29/15

17
Condition Assessment – Chlorinator
Asset Name: _____________________________________________________________________________________________ Install Date: _________________
Condition Ranking - Circle best description for each row
Aspect 1 – Excellent 2 – Good 3 – Fair 4 – Poor 5 – Very Poor
Condition of Chlorinator
Housing/ Body
No visible cracks or broken parts A few cracks or worn areas but still
serviceable Excessive amount of cracks in
housing and broken parts. Barely
serviceable
Avg # Unplanned
Outages/Year
0/year 1-2/year 3-5/year 6-10/year More than 10/year
Consequence of Failure - Circle best description for each row
Aspect 1 – Insignificant 2 – Minor 3 – Moderate 4 – Major 5 - Catastrophic
Impact to
Service
0-5% of Customers without
Service
6-10% of Customers without Service 11-20% of Customers
without Service
21-40% of Customers without Service 41% or More of Customers without
Service
Cost and Ease of Repair
Low Cost and Can be Quickly
Repaired by Staff
Low Cost and Cannot be Quickly
Repaired Staff
High Cost and Can be
Quickly Repaired by Staff
High Cost and a Contractor would be
Required to Repair
High Cost (Require a Loan or Grant
and Potentially Rate Changes) and
a Contractor and Design are
Required to Repair
Loss of Service Can be out of Service indefinitely Can be Out of Service for more
than 1 Month
Can Be Out of Service for
more than 1 Week
Can be Out of Service for 1-2 Days Cannot be Out of Service for 8
Hours
Date Completed: _____________________________________________________________________________________________________________________________
Person Completing: ___________________________________________________________________________________________________________________________
Last Revised 9/29/15

18
Condition Assessment – Clarifier
Asset Name: ________________________________________________________________________________________ Install Date: ______________
Condition Ranking - Circle best description for each row
Aspect 1 – Excellent 2 – Good 3 – Fair 4 – Poor 5 – Very Poor
Exterior Coating No chipping or visible thin spots
in exterior coating
Minor chipping or thin areas Moderate chipping and thin
area
Considerable chipping and thin
areas
Major areas of chipped or thin
exterior coating
Leaks No leaks have been detected. Minor leaks detected Moderate Leak Considerable Leak Major Leak
Consequence of Failure - Circle best description for each row
Aspect 1 – Insignificant 2 – Minor 3 – Moderate 4 – Major 5 - Catastrophic
Impact to
Service
0-5% of Customers without
Service
6-10% of Customers without Service 11-20% of Customers
without Service
21-40% of Customers without Service 41% or More of Customers without
Service
Cost and Ease of
Repair
Low Cost and Can be Quickly
Repaired by Staff
Low Cost and Cannot be Quickly
Repaired Staff
High Cost and Can be
Quickly Repaired by Staff
High Cost and a Contractor would be
Required to Repair
High Cost (Require a Loan or Grant
and Potentially Rate Changes) and
a Contractor and Design are
Required to Repair
Loss of Service Can be out of Service indefinitely Can be Out of Service for more
than 1 Month
Can Be Out of Service for
more than 1 Week
Can be Out of Service for 1-2 Days Cannot be Out of Service for 8
Hours
Date Completed: _______________________________________________________________________________________________________________
Person Completing: _____________________________________________________________________________________________________________
Last Revised 9/29/15

19
Condition Assessment – Filters
Asset Name: ___________________________________________________________________________________________ Install Date: ________________
Condition Ranking - Circle best description for each row
Aspect 1 – Excellent 2 – Good 3 – Fair 4 – Poor 5 – Very Poor
Visible Condition of Media No visible deposits or change in
media color
Minor visible deposits or change in
media color
Moderate deposits and
visible color change
Considerable visible deposits
or change in media color
Heavy deposits and visible color
change
Depth/Amount of Anthracite Coal as per
Manufacturer
18" 16" 14" 12" 10"
Depth/Amount of Silica
Sand as per
Manufacturer
9" 8" 6" 5" 4"
Filtered Water Turbidity Continually meets required level Occasionally doesn't meet
required level Frequently doesn't meet
required level
Flow Output Flow within 5% of expected output Flow within 10% of expected
output
Flow within 15% of expected
output
Flow within 40% of
expected output
Flow < 40% of expected output
Consequence of Failure - Circle best description for each row
Aspect 1 – Insignificant 2 – Minor 3 – Moderate 4 – Major 5 - Catastrophic
Impact to
Service
0-5% of Customers without
Service
6-10% of Customers without Service 11-20% of Customers
without Service
21-40% of Customers without Service 41% or More of Customers without
Service
Cost and Ease of Repair
Low Cost and Can be Quickly
Repaired by Staff
Low Cost and Cannot be Quickly
Repaired Staff
High Cost and Can be
Quickly Repaired by Staff
High Cost and a Contractor would be
Required to Repair
High Cost (Require a Loan or Grant
and Potentially Rate Changes) and
a Contractor and Design are
Required to Repair
Loss of Service Can be out of Service indefinitely Can be Out of Service for more
than 1 Month
Can Be Out of Service for
more than 1 Week
Can be Out of Service for 1-2 Days Cannot be Out of Service for 8
Hours
Date Completed: ___________________________________________________________________________________________________________________________
Person Completing: _________________________________________________________________________________________________________________________
Last Revised 9/29/15

20
Condition Assessment – Generators
Asset Name: Date Purchased:
Condition Ranking - Circle best description for each row
Aspect 1 – Excellent 2 – Good 3 – Fair 4 – Poor 5 – Very Poor
Number of Exercises
12 + per year 8 - 11 per year 4 - 7 per year 1 -3 per year 0 per year
Avg #Unplanned
Outages/Year
0 per Year 1 - 2 per year 3 - 5 per year 6 - 10 per year > 10 per year
Preventative
Maintenance Performed
According to manufacturer’s
recommendations
75% of the time 50 % of the time 25% of the time. Never
Consequence of Failure - Circle best description for each row
Aspect 1 – Insignificant 2 – Minor 3 – Moderate 4 – Major 5 - Catastrophic
Impact to
Service
0-5% of Customers without
Service
6-10% of Customers without Service 11-20% of Customers
without Service
21-40% of Customers without Service 41% or More of Customers without
Service
Cost and Ease of Repair
Low Cost and Can be Quickly
Repaired by Staff
Low Cost and Cannot be Quickly
Repaired Staff
High Cost and Can be
Quickly Repaired by Staff
High Cost and a Contractor would be
Required to Repair
High Cost (Require a Loan or Grant
and Potentially Rate Changes) and
a Contractor and Design are
Required to Repair
Loss of Service Can be out of Service indefinitely Can be Out of Service for more
than 1 Month
Can Be Out of Service for
more than 1 Week
Can be Out of Service for 1-2 Days Cannot be Out of Service for 8
Hours
Date Completed: _____________________________________________________________________________________________________________________________
Person Completing: ___________________________________________________________________________________________________________________________
Last Revised 9/29/15

21
Condition Assessment – Hydrants
Asset Name: _____________________________________________________________________________________________ Install Date: _________________
Condition Ranking - Circle best description for each row
Aspect 1 – Excellent 2 – Good 3 – Fair 4 – Poor 5 – Very Poor
Paint Condition Great condition Good Condition Moderate condition, chip in
paint
Paint chipped, dulled, thin in
areas
Poor condition, chipped or
faded paint.
Leaking No visible leaking Minor leaking from hose or
pumper nozzle.
Moderate leaking from hose or
pumper nozzle
Considerable leaking from hose
or pumper nozzle
Extensive leaking from hose or
pumper nozzle
Operation Fully operational Slight resistance when
opening or closing
Moderate resistance in stem
when opening or closing
Considerable resistance in stem
when opening or closing
Unable to open or close
Missing or defective
items such as caps,
misaligned nozzles,
rounded operating nuts
None Rounded operating nut Missing cap and/or rounded
operating nut
Defective items, missing items,
rounded nuts
Missing parts, misaligned
nozzles, rounded operating
nuts, considerable deficiency
Consequence of Failure - Circle best description for each row
Aspect 1 – Insignificant 2 – Minor 3 – Moderate 4 – Major 5 - Catastrophic
Impact to
Service
0-50
Structures within 1,000 ft.
50-100
Structures within 1,000 ft.
100-150
Structures within 1,000 ft.
150-200
Structures within 1,000 ft.
>200
Structures within 1,000 ft.
Cost and Ease of Repair
Low Cost and Can be Quickly
Repaired by Staff
Low Cost and Cannot be Quickly
Repaired Staff
High Cost and Can be
Quickly Repaired by Staff
High Cost and a Contractor would be
Required to Repair
High Cost (Require a Loan or Grant
and Potentially Rate Changes) and
a Contractor and Design are
Required to Repair
Loss of Service Next nearest hydrant
<1,000 ft.
Next nearest hydrant
1,000 – 2,000 ft.
Next nearest hydrant
2,000 to 3,000 ft.
Next nearest hydrant
3,000 to 4,000 ft.
Next nearest hydrant
>4,000 ft.
Date Completed: _____________________________________________________________________________________________________________________________
Person Completing: ___________________________________________________________________________________________________________________________
Last Revised 10/20/15
22
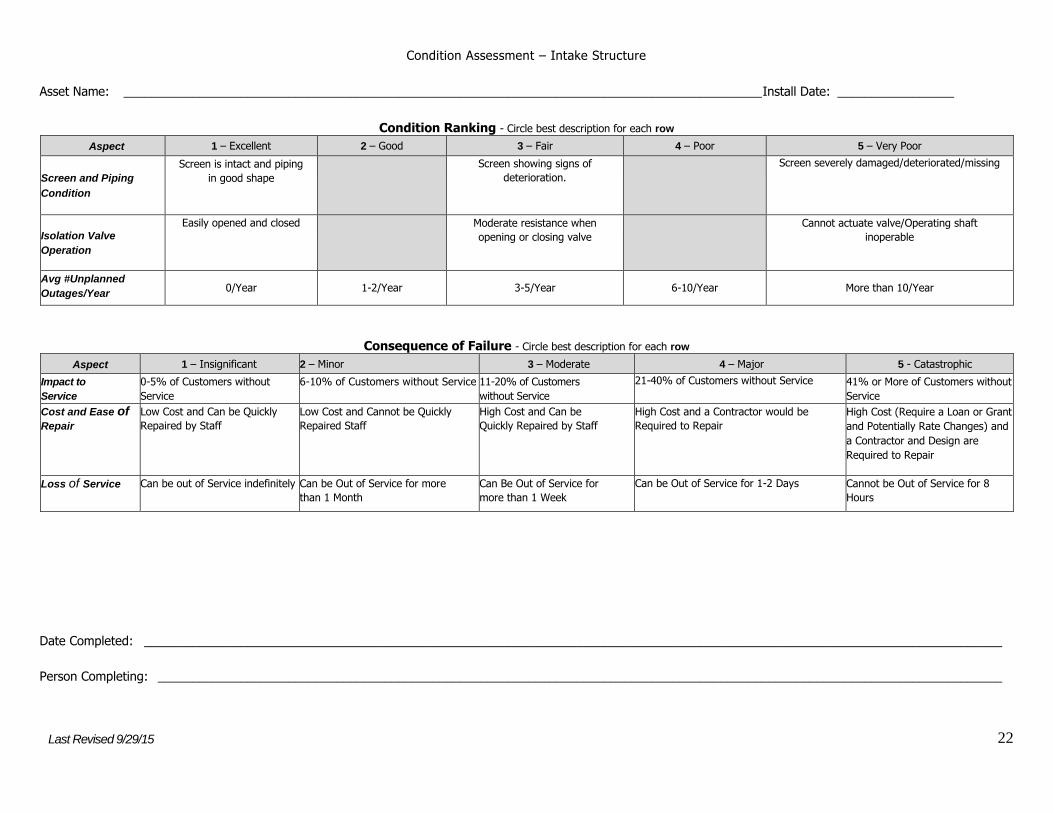
Condition Assessment – Intake Structure
Asset Name: _____________________________________________________________________________________________ Install Date: _________________
Condition Ranking - Circle best description for each row
Aspect 1 – Excellent 2 – Good 3 – Fair 4 – Poor 5 – Very Poor
Screen and Piping
Condition
Screen is intact and piping
in good shape Screen showing signs of
deterioration. Screen severely damaged/deteriorated/missing
Isolation Valve
Operation
Easily opened and closed Moderate resistance when
opening or closing valve Cannot actuate valve/Operating shaft
inoperable
Avg #Unplanned
Outages/Year 0/Year 1-2/Year 3-5/Year 6-10/Year More than 10/Year
Consequence of Failure - Circle best description for each row
Aspect 1 – Insignificant 2 – Minor 3 – Moderate 4 – Major 5 - Catastrophic
Impact to
Service
0-5% of Customers without
Service
6-10% of Customers without Service 11-20% of Customers
without Service
21-40% of Customers without Service 41% or More of Customers without
Service
Cost and Ease of Repair
Low Cost and Can be Quickly
Repaired by Staff
Low Cost and Cannot be Quickly
Repaired Staff
High Cost and Can be
Quickly Repaired by Staff
High Cost and a Contractor would be
Required to Repair
High Cost (Require a Loan or Grant
and Potentially Rate Changes) and
a Contractor and Design are
Required to Repair
Loss of Service Can be out of Service indefinitely Can be Out of Service for more
than 1 Month
Can Be Out of Service for
more than 1 Week
Can be Out of Service for 1-2 Days Cannot be Out of Service for 8
Hours
Date Completed: _____________________________________________________________________________________________________________________________
Person Completing: ___________________________________________________________________________________________________________________________
Last Revised 9/29/15

23
Condition Assessment – Lab / Operational Equipment
Asset Name: _____________________________________________________________________________________________ Install Date: _________________
Condition Ranking - Circle best description for each row
Aspect 1 – Excellent 2 – Good 3 – Fair 4 – Poor 5 – Very Poor
Preventative
Maintenance
Performed
According to manufacturer’s
recommendations
75% of the time 50 % of the time 25% of the time. Never
Consequence of Failure - Circle best description for each row
Aspect 1 – Insignificant 2 – Minor 3 – Moderate 4 – Major 5 - Catastrophic
Impact to
Service
0-5% of Customers without
Service
6-10% of Customers without Service 11-20% of Customers
without Service
21-40% of Customers without Service 41% or More of Customers without
Service
Cost and Ease of Repair
Low Cost and Can be Quickly
Repaired by Staff
Low Cost and Cannot be Quickly
Repaired Staff
High Cost and Can be
Quickly Repaired by Staff
High Cost and a Contractor would be
Required to Repair
High Cost (Require a Loan or Grant
and Potentially Rate Changes) and
a Contractor and Design are
Required to Repair
Loss of Service Can be out of Service indefinitely Can be Out of Service for more
than 1 Month
Can Be Out of Service for
more than 1 Week
Can be Out of Service for 1-2 Days Cannot be Out of Service for 8
Hours
Date Completed: _____________________________________________________________________________________________________________________________
Person Completing: ___________________________________________________________________________________________________________________________
Last Revised 9/29/15

24
Condition Assessment – PRVs
Asset Name: _____________________________________________________________________________________________ Install Date: _________________
Condition Ranking - Circle best description for each row
Aspect 1 – Excellent 2 – Good 3 – Fair 4 – Poor 5 – Very Poor
Number of repair/rebuilds 0 Repairs/Rebuild per year 1 Repairs/Rebuilds per year 2 Repairs/Rebuilds per year
High Downstream Pressure Normal operating Pressure Minor increase in downstream
pressure
Moderate increase in
downstream pressure
Considerable increase in
downstream pressure
Major increase in downstream
pressure, pipe breaking,
customer complaints
Vault Vault and access hatch in
new condition
Minor cracks and pinholes in
concrete, rust on access hatch
Moderate damage to concrete and
rust on access hatch
Considerable damage to
concrete and rust on
access hatch
Cracks in concrete, visible signs
of water infiltration into the
vault, and/or missing or
damaged beyond repair access
hatch
Avg #Unplanned
Outages/Year
0/Year 1-2/Year 3-5/Year 6-10/Year More than 10/Year
Consequence of Failure - Circle best description for each row
Aspect 1 – Insignificant 2 – Minor 3 – Moderate 4 – Major 5 - Catastrophic
Impact to
Service
0-5% of Customers without
Service
6-10% of Customers without Service 11-20% of Customers
without Service
21-40% of Customers without Service 41% or More of Customers without
Service
Cost and Ease of Repair
Low Cost and Can be Quickly
Repaired by Staff
Low Cost and Cannot be Quickly
Repaired Staff
High Cost and Can be
Quickly Repaired by Staff
High Cost and a Contractor would be
Required to Repair
High Cost (Require a Loan or
Grant and Potentially Rate
Changes) and a Contractor and
Design are Required to Repair
Loss of Service Can be out of Service indefinitely Can be Out of Service for more
than 1 Month
Can Be Out of Service for
more than 1 Week
Can be Out of Service for 1-2 Days Cannot be Out of Service for 8
Hours
Date Completed: _____________________________________________________________________________________________________________________________
Person Completing: ___________________________________________________________________________________________________________________________
Last Revised 9/29/15

25
Condition Assessment – Pumps
Asset Name: _____________________________________________________________________________________________ Install Date: _________________
Condition Ranking - Circle best description for each row
Aspect 1 – Excellent 2 – Good 3 – Fair 4 – Poor 5 – Very Poor
Motor Hours Run <10,000 hours 10,000 < 50,000 hours 50,000 < 100,000 hours 100,000 < 200,000 hours >200,000 hours
Vibration No unusual vibration
detectable
Minor vibration detected Moderate vibration Considerable vibration Major vibration
Temperature No unusual temperature
detected
Minimal heat from casing
using hand
Heat detected by hand Heat detected by hand is uncomfortable
to the touch
Heat too high to assess by hand
Noise No unusual noises
detected
Slight whine/rattle detected Moderate whine/rattle detected,
easily heard over pump noise
Loud whine/rattle Disturbingly loud vibrations
during operation
Leaking seals No visible sign of leaking
seals
Minor leaking seals Moderate leaking seals Considerable leaking seals Major leaking seals
Avg #Unplanned
Outages/Year
0/Year 1-2/Year 3-5/Year 6-10/Year More than 10/Year
Flow Output Flow within 5% of duty
point
Flow within 10% of duty point Flow within 20% of duty point Flow within 40% of duty point Flow > 40% of duty point
Consequence of Failure - Circle best description for each row
Aspect 1 – Insignificant 2 – Minor 3 – Moderate 4 – Major 5 - Catastrophic
Impact to
Service
0-5% of Customers without
Service
6-10% of Customers without Service 11-20% of Customers
without Service
21-40% of Customers without Service 41% or More of Customers without
Service
Cost and Ease of Repair
Low Cost and Can be Quickly
Repaired by Staff
Low Cost and Cannot be Quickly
Repaired Staff
High Cost and Can be
Quickly Repaired by Staff
High Cost and a Contractor would be
Required to Repair
High Cost (Require a Loan or Grant
and Potentially Rate Changes) and
a Contractor and Design are
Required to Repair
Loss of Service Can be out of Service indefinitely Can be Out of Service for more
than 1 Month
Can Be Out of Service for
more than 1 Week
Can be Out of Service for 1-2 Days Cannot be Out of Service for 8
Hours
Date Completed: _____________________________________________________________________________________________________________________________
Person Completing: ___________________________________________________________________________________________________________________________
Last Revised 9/29/15

26
Condition Assessment – Tanks
Asset Name: Install Date:
Condition Ranking - Circle best description for each row
Aspect 1 – Excellent 2 – Good 3 – Fair 4 – Poor 5 – Very Poor
Fencing and
Gate
The site is secure Security devices have minor damage,
but no unauthorized personnel can
enter
Moderate damage allowing
unauthorized personnel to
enter.
Considerable damage to security
devices
No security, site is exposed to
threat
Exterior Coating No chipping or visible thin spots
in exterior coating
Minor chipping or thin areas Moderate chipping and thin
area
Considerable chipping and thin
areas
Major areas of chipped or thin
exterior coating
Leaks No leaks have been detected. Minor leaks detected Moderate Leak Considerable Leak Major Leak
Concrete
Ringwall
No Cracks or visible structural
damage to exposed concrete
Minor cracking or visible damage Moderate cracking or visible
damage
Considerable cracking and visible
damage
Major cracking and visible
damage to concrete
Grout Ring No visual defects Minor cracks, thin areas, or
missing sections of grout
Moderate cracks, thin areas,
or missing sections
Considerable cracks, thin areas, or
missing sections
Major cracks, thin areas, or
missing sections of grout
Storage Capacity At least 20% growth available At least 15% growth available At least 10% growth available At least 5% growth available 0% growth available
Consequence of Failure - Circle best description for each row
Aspect 1 – Insignificant 2 – Minor 3 – Moderate 4 – Major 5 - Catastrophic
Impact to
Service
0-5% of Customers without
Service
6-10% of Customers without Service 11-20% of Customers
without Service
21-40% of Customers without Service 41% or More of Customers without
Service
Cost and Ease of Repair
Low Cost and Can be Quickly
Repaired by Staff
Low Cost and Cannot be Quickly
Repaired Staff
High Cost and Can be
Quickly Repaired by Staff
High Cost and a Contractor would be
Required to Repair
High Cost (Require a Loan or
Grant and Potentially Rate
Changes) and a Contractor and
Design are Required to Repair
Loss of Service Can be out of Service indefinitely Can be Out of Service for more
than 1 Month
Can Be Out of Service for
more than 1 Week
Can be Out of Service for 1-2 Days Cannot be Out of Service for 8
Hours
Date Completed: _____________________________________________________________________________________________________________________________
Person Completing: ___________________________________________________________________________________________________________________________
Last Revised 9/29/15
27
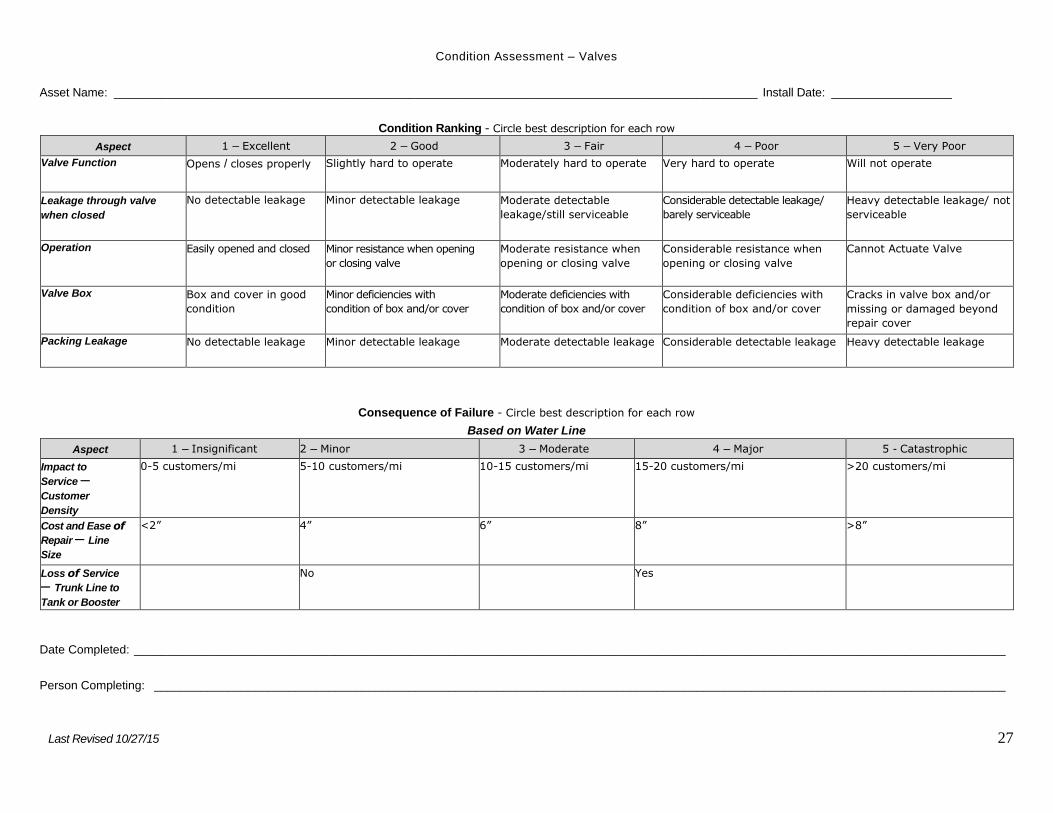
Condition Assessment – Valves
Asset Name: ________________________________________________________________________________________________ Install Date: __________________
Condition Ranking - Circle best description for each row
Aspect 1 – Excellent 2 – Good 3 – Fair 4 – Poor 5 – Very Poor
Valve Function Opens / closes properly Slightly hard to operate Moderately hard to operate Very hard to operate Will not operate
Leakage through valve
when closed
No detectable leakage Minor detectable leakage Moderate detectable
leakage/still serviceable
Considerable detectable leakage/
barely serviceable
Heavy detectable leakage/ not
serviceable
Operation Easily opened and closed Minor resistance when opening
or closing valve
Moderate resistance when
opening or closing valve
Considerable resistance when
opening or closing valve
Cannot Actuate Valve
Valve Box Box and cover in good
condition
Minor deficiencies with
condition of box and/or cover
Moderate deficiencies with
condition of box and/or cover
Considerable deficiencies with
condition of box and/or cover
Cracks in valve box and/or
missing or damaged beyond
repair cover
Packing Leakage No detectable leakage Minor detectable leakage Moderate detectable leakage Considerable detectable leakage Heavy detectable leakage
Consequence of Failure - Circle best description for each row
Based on Water Line
Aspect 1 – Insignificant 2 – Minor 3 – Moderate 4 – Major 5 - Catastrophic
Impact to
Service – Customer
Density
0-5 customers/mi 5-10 customers/mi 10-15 customers/mi 15-20 customers/mi >20 customers/mi
Cost and Ease of
Repair – Line
Size
<2” 4” 6” 8” >8”
Loss of Service
– Trunk Line to
Tank or Booster
No Yes
Date Completed: __________________________________________________________________________________________________________________________________
Person Completing: _______________________________________________________________________________________________________________________________
Last Revised 10/27/15

28
Condition Assessment – Vehicles
Asset Name: Purchase Date:
Condition Ranking - Circle best description for each row
Aspect 1 – Excellent 2 – Good 3 – Fair 4 – Poor 5 – Very Poor
Mileage <10,000 miles 10,000 < 50,000 miles 50,000 < 100,000 miles 100,000 < 200,000 miles >200,000 miles
Body No visible sign rust or damage Minor rust or damage Moderate rust or damage Considerable rust or damage Major rust or damage
Avg # Mechanical
Issues/Year
0/year 1-2/year 3-5/year 6-10/year More than 10/year
Preventative
Maintenance Performed According to manufacturer’s
recommendations
75% of the time 50 % of the time 25% of the time. Never
Consequence of Failure - Circle best description for each row
Aspect 1 – Insignificant 2 – Minor 3 – Moderate 4 – Major 5 - Catastrophic
Impact to
Service
0-5% of Customers without
Service
6-10% of Customers without Service 11-20% of Customers
without Service
21-40% of Customers without Service 41% or More of Customers without
Service
Cost and Ease of Repair
Low Cost and Can be Quickly
Repaired by Staff
Low Cost and Cannot be Quickly
Repaired Staff
High Cost and Can be
Quickly Repaired by Staff
High Cost and a Contractor would be
Required to Repair
High Cost (Require a Loan or
Grant and Potentially Rate
Changes) and a Contractor and
Design are Required to Repair
Loss of Service Can be out of Service indefinitely Can be Out of Service for more
than 1 Month
Can Be Out of Service for
more than 1 Week
Can be Out of Service for 1-2 Days Cannot be Out of Service for 8
Hours
Date Completed: _____________________________________________________________________________________________________________________________
Person Completing: ___________________________________________________________________________________________________________________________
Last Revised 9/29/15

Condition Assessment – Water Lines
Asset Name: _________________________________________________________________________________________ Install Date: ________________
Condition Ranking - Circle best description for each row
Aspect 1 – Excellent 2 – Good 3 – Fair 4 – Poor 5 – Very Poor
Pipe Material PVC or Ductile Iron Asbestos Concrete Cast Iron
Number of Leaks per Year 0 Leaks/year 1-2 leaks/year 3-5 leaks/year > 5 and < 10 leaks/
year
> 10 leaks/year
Consequence of Failure - Circle best description for each row
Aspect 1 – Insignificant 2 – Minor 3 – Moderate 4 – Major 5 - Catastrophic
Impact to
Service – Customer
Density
0-5 customers/mi 5-10 customers/mi 10-15 customers/mi 15-20 customers/mi >20 customers/mi
Cost and Ease of
Repair – Line
Size
<2” 4” 6” 8” >8”
Loss of Service
– Trunk Line to
Tank or Booster
No Yes
Date Completed: _______________________________________________________________________________________________________________________
Person Completing: _____________________________________________________________________________________________________________________
Last Revised 10/20/15


![[MS-RRP]: Windows Remote Registry Protocol · The Windows Remote Registry Protocol is a remote procedure call (RPC)–based client/server information, see [C706] section 13.1.2.1](https://img.pdfslide.net/doc/110x75/5fd13efa0c5299645e185c2e/ms-rrp-windows-remote-registry-protocol-the-windows-remote-registry-protocol.jpg)