Embed Size (px)
Citation preview

Data, Data EverywhereKey Steps to Integrating Systems
for Improved Decision Making
Herbert Higginbotham
Accenture Transit & Tolling Services
Los Angeles, CA

Copyright © 2014 Accenture. All rights reserved. 2
Meeting the needs of increasing
ridership
Accommodating service and
speed advancements
Improving state of good repair
(SOGR)
Increasing operating efficiencies
Addressing rising resource
costs.
Supporting sustainability
Ensuring safety and security
Transit Challenges
What do we have?
Lots of Systems & Data
But low levels of
integration or utility
Copyright © 2014 Accenture. All rights reserved. 3
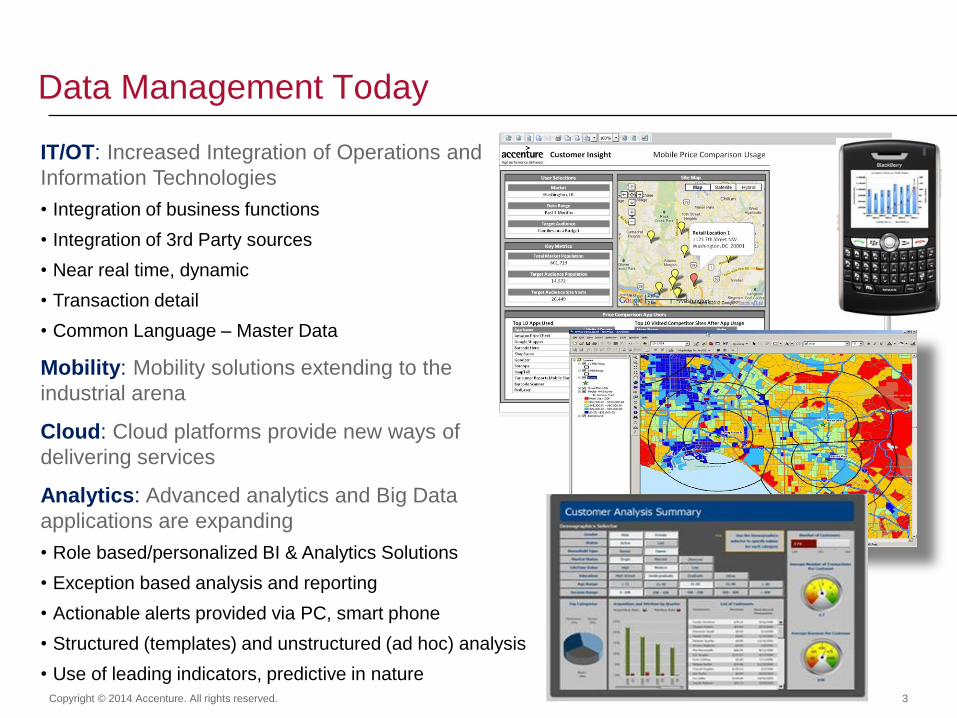
IT/OT: Increased Integration of Operations and
Information Technologies
• Integration of business functions
• Integration of 3rd Party sources
• Near real time, dynamic
• Transaction detail
• Common Language – Master Data
Mobility: Mobility solutions extending to the
industrial arena
Cloud: Cloud platforms provide new ways of
delivering services
Analytics: Advanced analytics and Big Data
applications are expanding
• Role based/personalized BI & Analytics Solutions
• Exception based analysis and reporting
• Actionable alerts provided via PC, smart phone
• Structured (templates) and unstructured (ad hoc) analysis
• Use of leading indicators, predictive in nature
Data Management Today

Copyright © 2014 Accenture. All rights reserved. 4
Operations Transparency
Inventory Management
Maintenance Planning & Scheduling
Compliance & Safety
Retirement & Disposal
Incident
Management
Scheduling &
Dispatch
Demand Planning &
Forecasting
Fare & Revenue
Management
Procurement & Contracting
Customer Management
Human Resources
Finance & Budget
Data Hub/
Warehouse
Predictive
Analytics
Telematics &
Remote MonitoringCloud
Services
GIS
CAD
Service
Management
Resource
Management
Data &
Analytics
GIS &
Spatial
Mobility
& Cloud
Integrated real-time
visibility for better transit
decisions
BIM & Aerials
Dashboards &
Performance
Field
Force
Asset & Work
Management

Copyright © 2014 Accenture. All rights reserved. 5
Building a Transit Agency on Operations Transparency
A four-step process designed to align the organization’s data, technology,
processes, and people with an overall vision for seamless and transparent transit
operations.
1. Awareness of
interdependent data for
operations visibility
2. Integrated framework to
collect, manage, analyze
data
3. Standardization of
processes & controls
4. A culture change at every
level of the organization

Copyright © 2014 Accenture. All rights reserved. 6
Case StudyLarge US Passenger Rail Operator
Project Scope
• Enterprise transformation of Operations, Finance and Materials
Management components of the business
o Define standard process model
o EAM, ERP, and Business Analytics capabilities
How Accenture Helped
• Standardized business model
• Single integrated EAM tool set to provide Operations Transparency
• Integrated back office financial and materials management capabilities
o Integration to ERP and GIS
o Integration to track geometry car through Optram
• Integrated demand and supply planning processes
Benefits
• Increase fleet utilization
• Reduce maintenance backlog (through increased productivity)
• Reduce overall inventory / improve service parts positioning
• Improve on-time performance
• Increase visibility to maintenance events to make smarter decisions
• Improved labor utilization – track labor to specific work
• Achieved greater compliance to FRA inspections
• Gained $5M in reimbursable work done for others

Copyright © 2014 Accenture. All rights reserved. 7
Information
Sources
Data Integration &
Standardization & Consolidation
Information
Domains
Presentation &
Delivery
Client Reporting
Environments
Enterprise
Applications
Published Reports &
Dashboards
External
SystemsData
Extracts
StagingData
Integration
(ODS)
Data
Marts
Web
Analytic Applications
& Models
Executives
Managers &
Analysts
Statisticians
Prompted & Ad-Hoc
Reporting
3rd Party Data
Providers / Partners
•Unstructured
•Minimal
Validation
•Structured
•Standardized•Structured for
ease of use
and rqmts
Collecting and Organizing Your Data

Copyright © 2014 Accenture. All rights reserved. 8
“Siloed”
(Multiple Data Stores)
Focused on data marts /
warehouses/reports created and supported
based on the needs of specific functions
Unique development and support
processes tailored to the needs of each
function
Unique technology environment chosen to
support only the specific needs of the
function
Project based organizations created to
develop and support the solutions
Data stores are fed by multiple source
systems
Some common development and support
processes
Limited sharing of technology environment
Project based organizations created to
develop and support the solutions
Enterprise solution focused on centralized
data warehouse created to meet all reporting
and analytic needs
Common development and support
processes
Shared technology environment chosen to
support the needs of the enterprise
Centralized organizations created to develop
and support the solutions
“Distributed”
(Source systems feed multiple
Departmental Datastores)
“Centralized”
(Enterprise Warehouse Environment)
Enterprise Data Warehouse
Enterprise
Data Warehouse
Inventory
System of
Record
Sales
Pricing
Finance
Inventory
Operations
Production
Business User
Pricing
HR
Finance
Sales
Inventory
System of
Record
Sales
Pricing
Finance
Storage
Inventory
Operations
Production
Business User
Operations
HR
Finance
Sales
Pricing
Business User
Inventory
System of
Record
Sales
Pricing
Finance
Risl
Storage
Production
Insurance
Sales
Evolving Your Data Management

Copyright © 2014 Accenture. All rights reserved. 9
Case Study:
OT Data Model for Transit

Copyright © 2014 Accenture. All rights reserved. 10
Independent Federated BalancedSelective
DistributionUnified
Functional areas operate with
complete autonomy while
maintaining global standards
to meet specific enterprise
requirements.
Functional areas control a
majority of their business
and technology operations
with limited coordination
from the enterprise.
Responsibility and
ownership are shared
equally among the
different functional areas
and the enterprise.
Data Governance provides
a point of control and
decision making but
functional areas own
selective decisions and
activities.
Data Governance provides
a single point of control
and decision making, with
functional areas having
little or no responsibility.
Functional Enterprise
DGDG DGDG
Evolving Your Data Governance
Direction around whether data governance will have a functional or enterprise POV will help
dictate the scope and reach of processes controlled by the data governance organization.

Copyright © 2014 Accenture. All rights reserved. 11
Case Study:
OT Business Process Model for Transit

Copyright © 2014 Accenture. All rights reserved. 12
Case Study:
OT Framework Aligned to Agency Vision and Goals
Financial,
Human &
Material
Asset
Management
Fixed/
Engineering
Assets
Management
Rolling/
Mobile/
Mechanical
Asset
Management
Transport-
ation
Management
Integrated Resource and Asset Information
(Location, Condition, Activity, Costs)
Right-Time
Dashboard
& Reporting
Decision
Support
Tools
Investment
Planning &
Forecasting
Operational
Transparency• Leverage integration among
departmental functions
• Create Enterprise Data Model
supporting a Service & Event
Centric Approach
• Revamp business processes in
various departments throughout
the organization
• Modernize and integrate
business systems to an
organization-wide solution
• Provided one accurate view of
enterprise information for
management decision making
and cost sharing with federal,
state, and local agencies
• Utilize a Value Realization
Framework to quantify results
and monitor the program
ILLUSTRATIVE
The EAM for Transportation Value Realization Framework

Copyright © 2014 Accenture. All rights reserved. 13
The Vision: How Will We Operate In the Future?
OT Dashboard
Real-Time Data Sources
Integrated Data
Warehouse
Maintenance
Shop
Receive Alert
Perform Service
Capture Data and
Update Records
!Field and Depot Crews
• 20 Year Forecast
• 5 Year Operating and
Capital Budget
OT Dashboard
• Real-time and historical scorecard and
KPIs
• Operations and Capital Planning
measures
Headquarters
OT Dashboard
Engine Terminal
Facility 1
Facility 2
OT Dashboard
Capital
Construction
OT Dashboard
Procurement, Logistics
and Materials
Management
Rail Control
Center
OT Dashboard

Copyright © 2014 Accenture. All rights reserved. 14
The Result: Integrated Data For Improved Analysis and
Decision Making
Asset Management KPIs
Dynamic Geographic Analysis
Finance and Accounting Dashboard
Real-time Equipment Monitoring

Copyright © 2014 Accenture. All rights reserved. 15
Before you begin…
• Document the vision (WHAT)
• Develop a clear business case (WHY)
• Establish a framework for transformation (HOW)
“We will collect, organize, and share
our data to produce integrated, real-time
information for better agency decision
making.”
Along the way…
• Socialize the journey
• Pilot foundational capabilities – score quick wins
• Change management and executive leadership
Key Success Factors for your Data Transformation

Herbert Higginbotham
Accenture Transit and Tolling Services
310-726-2009
To learn more about how to optimize and integrate your transit data and
technology, contact:
Thank You!