Embed Size (px)
Citation preview
Chris Piech and Mehran Sahami Handout #9
CS 106A April 27, 2020
Assignment #3: Images and Graphics Due: 1:30pm (Pacific Daylight Time) on Wednesday, May 6th
Based on problems by Nick Bowman, Sonja Johnson-Yu, Kylie Jue, Nick Parlante, Eric Roberts, and the current CS106A staff.
This assignment consists of two sets of programs to give you practice with images and
graphics, respectively, in Python. You can download the starter code for this project under
the “Assignments” tab on the CS106A website. The starter project will provide Python
files for you to write your programs in.
The assignment is broken up into two parts. The first part of the assignment focuses on
image manipulation, including a sandcastle (warm-up) problem as well as a longer program
to write.
In the second part of the assignment you’ll get the chance to create one short and one larger
program that draw graphics. That way you can create your own pictures rather than just
manipulating images as you did in the first part of this assignment.
The handout for this assignment is on the longer side, but don’t be intimidated by its length!
It is long because it’s designed to give you step-by-step instructions for implementing
several cool algorithms!
Setup: Installing Pillow
Before you get started on the assignment, make sure that you have run through the Pillow
installation instructions, which can be found in the “Image Reference” handout on the
CS106A website. If you cannot get Pillow installed successfully, please come to LaIR or
post on Ed for help.
Part 1: Images
1. “Sandcastle” (warm-up) problem: Finding forest fires.
We’re going to start by writing a function called highlight_fires (in the file
forestfile.py) that highlights the areas where a forest fire is active. You’re given a
satellite image of Greenland’s 2017 fires (photo credit: Stef Lhermitte, Delft University of
Technology). Your job is to detect all of the “sufficiently red” pixels in the image, which
are indicative of where fires are burning in the image. As we did in class with the
“redscreening” example, we consider a pixel “sufficiently red” if its red value is greater
than or equal to the average of the pixel’s three RGB values times some intensity threshold.
In this case, we have provided you with an appropriate intensity threshold of 1.05 via a
constant named INTENSITY_THRESHOLD in the file forestfire.py. Note that this
is a different intensity threshold value than we used in class for the “redscreening” example,
as different applications often require different intensity threshold.
When you detect a “sufficiently red” pixel in the original image, you set its red value to
255 and its green and blue values to 0. This will highlight the pixel by making it entirely
red. For all other pixels (i.e., those that are not “sufficiently red”), you should convert them
to their grayscale equivalent, so that we can more easily see where the fire is originating
– 2 –
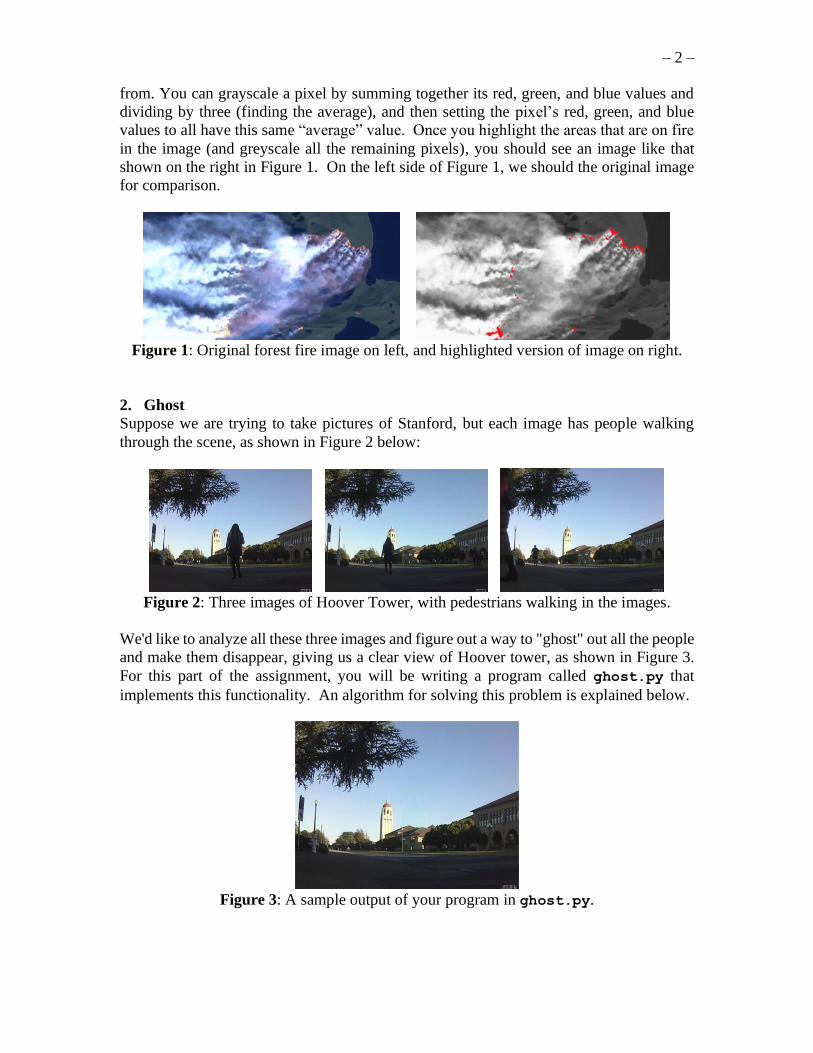
from. You can grayscale a pixel by summing together its red, green, and blue values and
dividing by three (finding the average), and then setting the pixel’s red, green, and blue
values to all have this same “average” value. Once you highlight the areas that are on fire
in the image (and greyscale all the remaining pixels), you should see an image like that
shown on the right in Figure 1. On the left side of Figure 1, we should the original image
for comparison.
Figure 1: Original forest fire image on left, and highlighted version of image on right.
2. Ghost
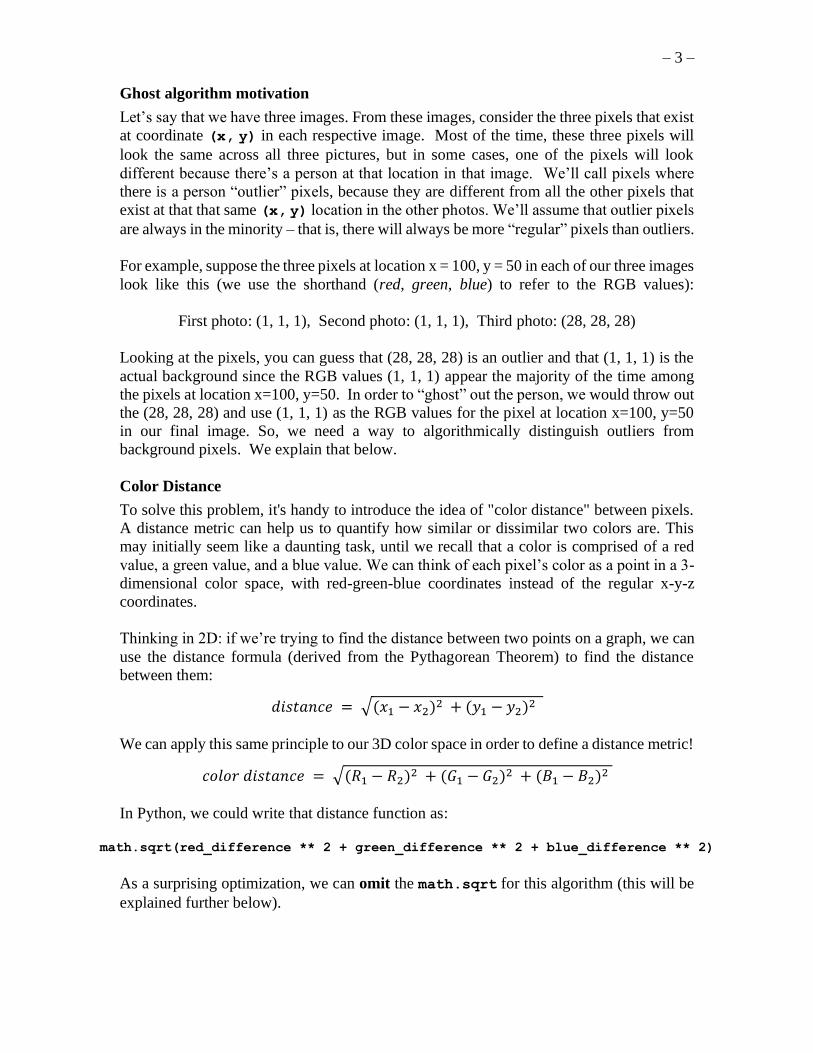
Suppose we are trying to take pictures of Stanford, but each image has people walking
through the scene, as shown in Figure 2 below:
Figure 2: Three images of Hoover Tower, with pedestrians walking in the images.
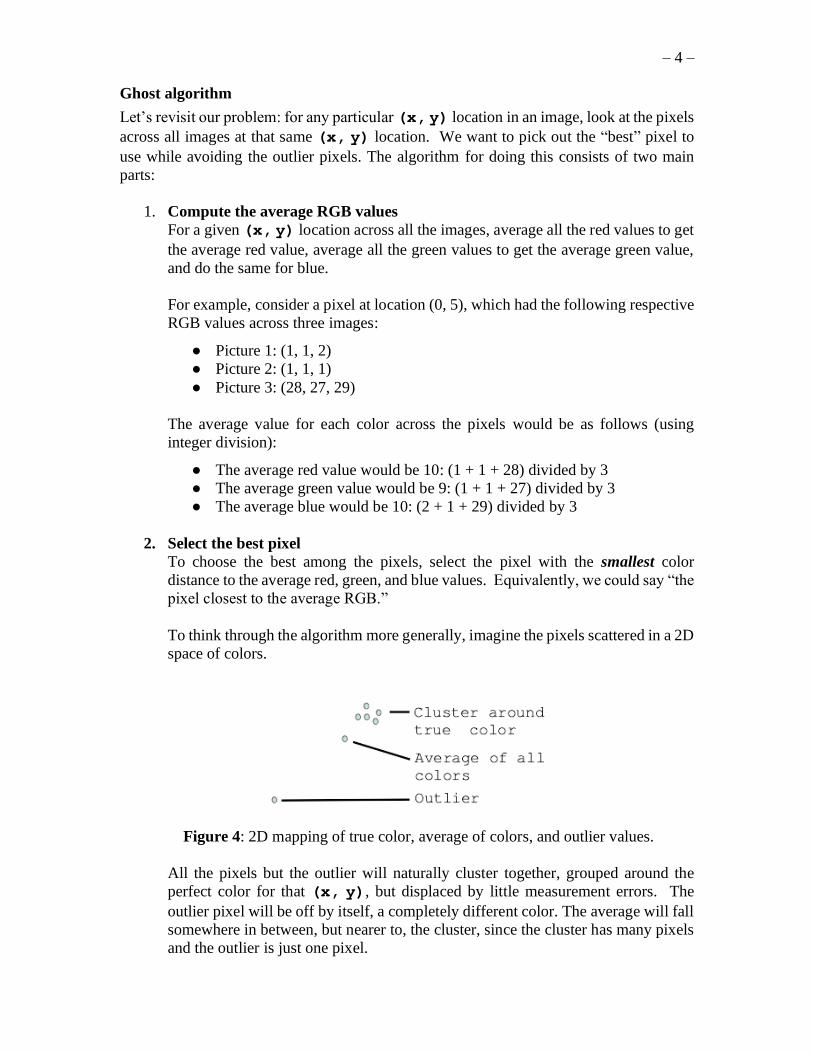
We'd like to analyze all these three images and figure out a way to "ghost" out all the people
and make them disappear, giving us a clear view of Hoover tower, as shown in Figure 3.
For this part of the assignment, you will be writing a program called ghost.py that
implements this functionality. An algorithm for solving this problem is explained below.
Figure 3: A sample output of your program in ghost.py.
– 3 –
Ghost algorithm motivation
Let’s say that we have three images. From these images, consider the three pixels that exist
at coordinate (x, y) in each respective image. Most of the time, these three pixels will
look the same across all three pictures, but in some cases, one of the pixels will look
different because there’s a person at that location in that image. We’ll call pixels where
there is a person “outlier” pixels, because they are different from all the other pixels that
exist at that that same (x, y) location in the other photos. We’ll assume that outlier pixels
are always in the minority – that is, there will always be more “regular” pixels than outliers.
For example, suppose the three pixels at location x = 100, y = 50 in each of our three images
look like this (we use the shorthand (red, green, blue) to refer to the RGB values):
First photo: (1, 1, 1), Second photo: (1, 1, 1), Third photo: (28, 28, 28)
Looking at the pixels, you can guess that (28, 28, 28) is an outlier and that (1, 1, 1) is the
actual background since the RGB values (1, 1, 1) appear the majority of the time among
the pixels at location x=100, y=50. In order to “ghost” out the person, we would throw out
the (28, 28, 28) and use (1, 1, 1) as the RGB values for the pixel at location x=100, y=50
in our final image. So, we need a way to algorithmically distinguish outliers from
background pixels. We explain that below.
Color Distance
To solve this problem, it's handy to introduce the idea of "color distance" between pixels.
A distance metric can help us to quantify how similar or dissimilar two colors are. This
may initially seem like a daunting task, until we recall that a color is comprised of a red
value, a green value, and a blue value. We can think of each pixel’s color as a point in a 3-
dimensional color space, with red-green-blue coordinates instead of the regular x-y-z
coordinates.
Thinking in 2D: if we’re trying to find the distance between two points on a graph, we can
use the distance formula (derived from the Pythagorean Theorem) to find the distance
between them:
𝑑𝑖𝑠𝑡𝑎𝑛𝑐𝑒 = √(𝑥1 − 𝑥2)2 + (𝑦1 − 𝑦2)2
We can apply this same principle to our 3D color space in order to define a distance metric!
𝑐𝑜𝑙𝑜𝑟 𝑑𝑖𝑠𝑡𝑎𝑛𝑐𝑒 = √(𝑅1 − 𝑅2)2 + (𝐺1 − 𝐺2)2 + (𝐵1 − 𝐵2)2
In Python, we could write that distance function as:
math.sqrt(red_difference ** 2 + green_difference ** 2 + blue_difference ** 2)
As a surprising optimization, we can omit the math.sqrt for this algorithm (this will be
explained further below).
– 4 –
Ghost algorithm
Let’s revisit our problem: for any particular (x, y) location in an image, look at the pixels
across all images at that same (x, y) location. We want to pick out the “best” pixel to
use while avoiding the outlier pixels. The algorithm for doing this consists of two main
parts:
1. Compute the average RGB values
For a given (x, y) location across all the images, average all the red values to get
the average red value, average all the green values to get the average green value,
and do the same for blue.
For example, consider a pixel at location (0, 5), which had the following respective
RGB values across three images:
● Picture 1: (1, 1, 2)
● Picture 2: (1, 1, 1)
● Picture 3: (28, 27, 29)
The average value for each color across the pixels would be as follows (using
integer division):
● The average red value would be 10: (1 + 1 + 28) divided by 3
● The average green value would be 9: (1 + 1 + 27) divided by 3
● The average blue would be 10: (2 + 1 + 29) divided by 3
2. Select the best pixel
To choose the best among the pixels, select the pixel with the smallest color
distance to the average red, green, and blue values. Equivalently, we could say “the
pixel closest to the average RGB.”
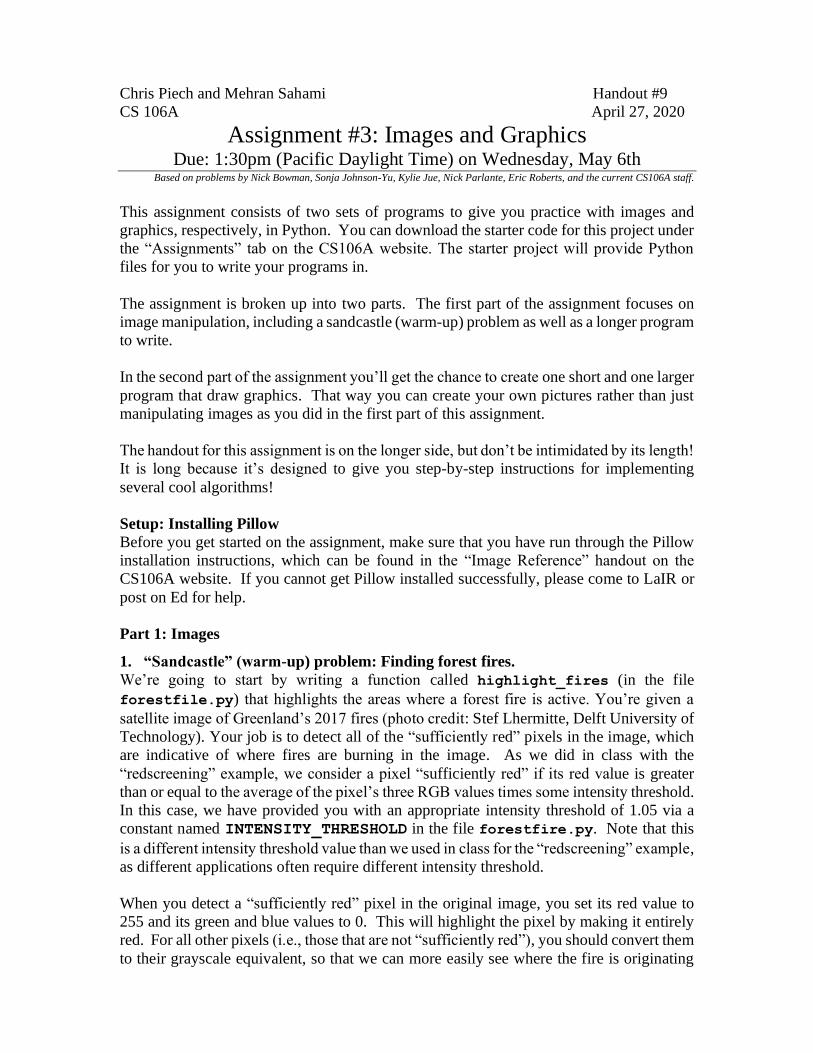
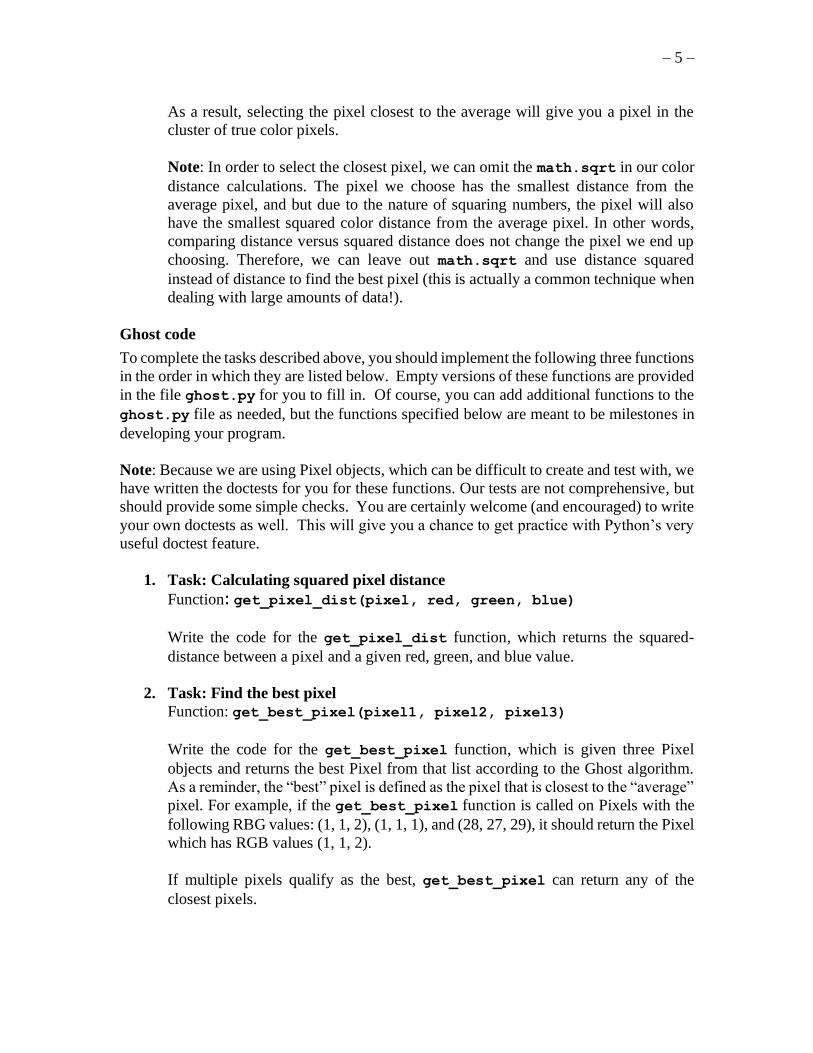
To think through the algorithm more generally, imagine the pixels scattered in a 2D
space of colors.
Figure 4: 2D mapping of true color, average of colors, and outlier values.
All the pixels but the outlier will naturally cluster together, grouped around the
perfect color for that (x, y), but displaced by little measurement errors. The
outlier pixel will be off by itself, a completely different color. The average will fall
somewhere in between, but nearer to, the cluster, since the cluster has many pixels
and the outlier is just one pixel.
– 5 –
As a result, selecting the pixel closest to the average will give you a pixel in the
cluster of true color pixels.
Note: In order to select the closest pixel, we can omit the math.sqrt in our color
distance calculations. The pixel we choose has the smallest distance from the
average pixel, and but due to the nature of squaring numbers, the pixel will also
have the smallest squared color distance from the average pixel. In other words,
comparing distance versus squared distance does not change the pixel we end up
choosing. Therefore, we can leave out math.sqrt and use distance squared
instead of distance to find the best pixel (this is actually a common technique when
dealing with large amounts of data!).
Ghost code
To complete the tasks described above, you should implement the following three functions
in the order in which they are listed below. Empty versions of these functions are provided
in the file ghost.py for you to fill in. Of course, you can add additional functions to the
ghost.py file as needed, but the functions specified below are meant to be milestones in
developing your program.
Note: Because we are using Pixel objects, which can be difficult to create and test with, we
have written the doctests for you for these functions. Our tests are not comprehensive, but
should provide some simple checks. You are certainly welcome (and encouraged) to write
your own doctests as well. This will give you a chance to get practice with Python’s very
useful doctest feature.
1. Task: Calculating squared pixel distance
Function: get_pixel_dist(pixel, red, green, blue)
Write the code for the get_pixel_dist function, which returns the squared-
distance between a pixel and a given red, green, and blue value.
2. Task: Find the best pixel
Function: get_best_pixel(pixel1, pixel2, pixel3)
Write the code for the get_best_pixel function, which is given three Pixel
objects and returns the best Pixel from that list according to the Ghost algorithm.
As a reminder, the “best” pixel is defined as the pixel that is closest to the “average”
pixel. For example, if the get_best_pixel function is called on Pixels with the
following RBG values: (1, 1, 2), (1, 1, 1), and (28, 27, 29), it should return the Pixel
which has RGB values (1, 1, 2).
If multiple pixels qualify as the best, get_best_pixel can return any of the
closest pixels.
– 6 –
3. Task: Create a ghost image
Function: create_ghost(image1, image2, image3)
This is the function that solves the whole problem and should make use of the other
functions you wrote to solve sub-tasks. The main function we provide for you,
which you should not modify, does the housekeeping of loading the image objects,
and then calls create_ghost to do the real work. It will then display the image
returned by your create_ghost function. You can assume that all three images
passed into this function are the same size (have the same height and width).
Remember that your function should create a new (blank) image of the same size
as the images passed into the function and the appropriately set the pixels in this
new image to create the “ghost” effect.
For a helpful reminder about the SimpleImage functions you have available, you
can use the Image Reference handout (available on the CS106A webpage).
Ghost Decomposition
If you decide to define helper functions while completing the above functions, you should
write function header comments explaining what these helper functions do. However,
doctests are not required.
How to run your code
The ghost.py program takes one “command line” argument, which is the name of the
folder that contains the image files you would like to run the Ghost algorithm on. A
command line argument is just something that you type on the terminal command line after
the name of the program you want to run. For example, to run the ghost.py program
using the images in the “hoover” directory, you would type:
On the PC: py ghost.py hoover
On the Mac: python3 ghost.py hoover
Running the program on the "hoover" files from the Terminal like this will print out the
names of the images from that directory that your program is being run on. It should (after
you write your solution), then display the image returned by your create_ghost
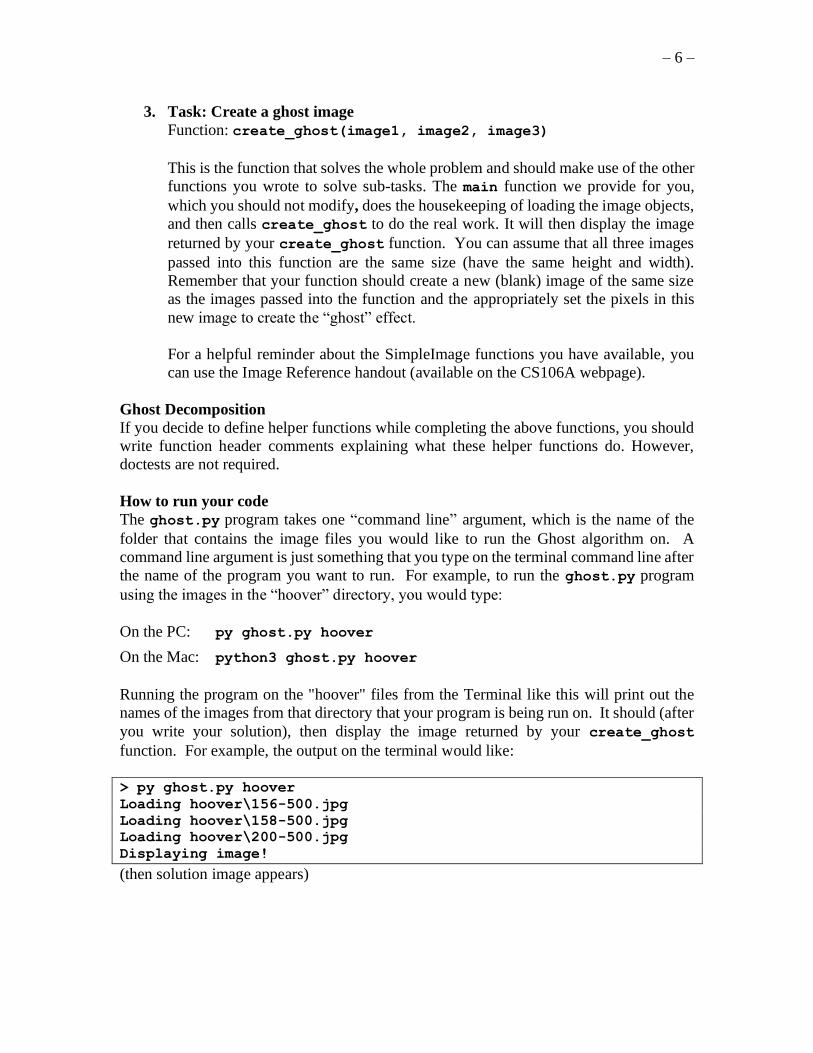
function. For example, the output on the terminal would like:
> py ghost.py hoover
Loading hoover\156-500.jpg
Loading hoover\158-500.jpg
Loading hoover\200-500.jpg
Displaying image!
(then solution image appears)
– 7 –
Additional test cases
In addition to the hoover directory, we have provided image of other places on the
Stanford where you can apply the ghost program! Each set of pictures is in its own folder,
which are: clock-tower
math-corner
monster
Look at the individual images inside each folder to get a feel for the data. Your code should
work for all of these image folders. To try the different places, you can run the following
commands in a Terminal (use “python3” instead of “py” if you are on a Mac).
Clock Tower – a medium-sized case (Takes a few seconds to run) py ghost.py clock-tower
Math Corner – a large-sized case (Takes a few seconds to run) py ghost.py math-corner
Monster – an extra-large-sized case (Can takes up to a minute to run, so be patient) py ghost.py monster
Note that your resulting image for the “monster” data set may appear to have part of a
bicycle wheel still apparent in the middle of the image. That’s actually expected to happen
given the images that we’ve provided. Think about why that is happening here!
Part 2: Graphics
1. Pyramid
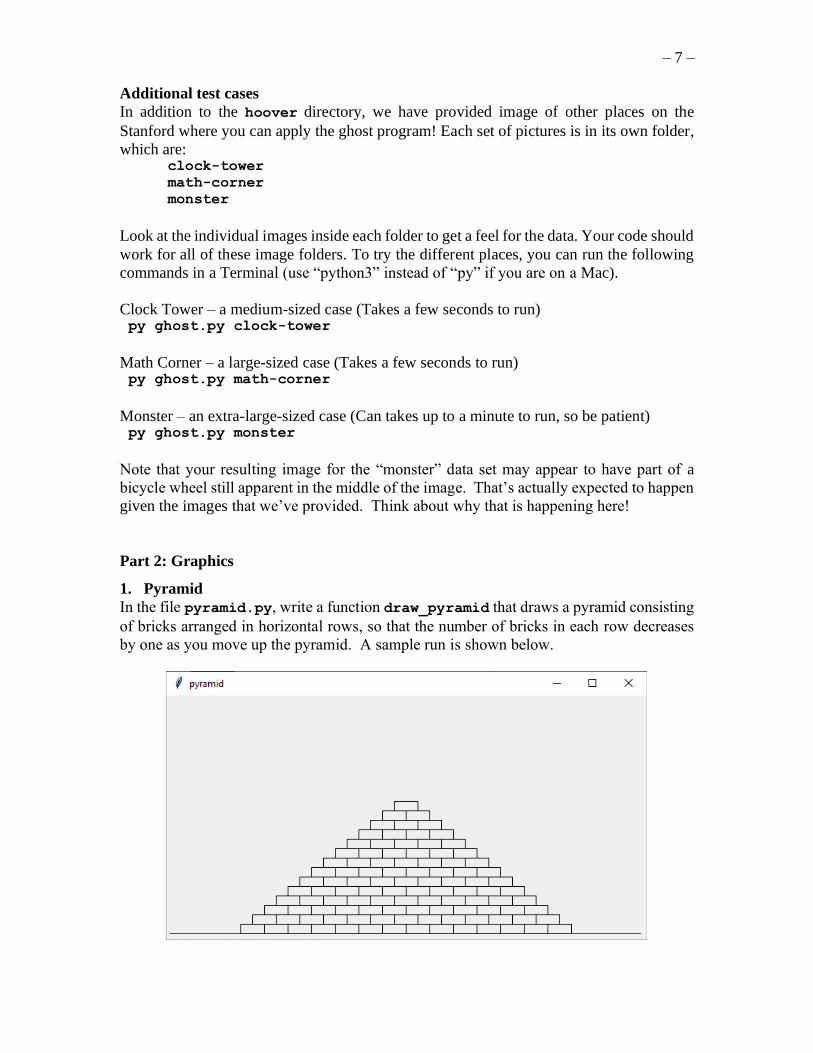
In the file pyramid.py, write a function draw_pyramid that draws a pyramid consisting
of bricks arranged in horizontal rows, so that the number of bricks in each row decreases
by one as you move up the pyramid. A sample run is shown below.
– 8 –
The pyramid should be centered at the bottom of the drawing canvas and should use
constants for the following parameters:
BRICK_WIDTH The width of each brick (30 pixels)
BRICK_HEIGHT The height of each brick (12 pixels)
BRICKS_IN_BASE The number of bricks in the base (14)
The numbers in parentheses show the values for this diagram, but you must be able to
change those values in your program.
Note that in the picture above, there is a blue line at the bottom of the canvas. You do not
need to draw that line. It is automatically drawn by the starter code we give you to show
you where the bottom on the drawing canvas is (since it doesn’t correspond to the bottom
of the graphics window).
You should write your code in the following stages:
1. Task: Drawing a single brick
Function: draw_brick(canvas, x, y, width, height)
Write the code for a draw_brick function, that draws a single brick (rectangle) on
the graphics canvas. The coordinates of brick’s upper left-hand corner are specified
by the parameters x, y and the brick drawn should be width pixels wide and
height pixels high. Yes, this may be a very short function—we just want to make
sure you get this right before you move on.
2. Task: Drawing the pyramid
Function: draw_pyramid(canvas)
Write the code for a draw_pyramid function, that draws a complete pyramid as
specified in the problem description above.
Note that you can add additional helper functions that are used by your draw_pyramid
function beyond the draw_brick function.
2. Quilt
You will be writing a program in the file quilt.py that draws a quilt out of a patchwork
of repeated patterns. In this file, we provide a main function for you that takes in some
command line arguments (similar to the Ghost program) that give you the flexiblity to test
different parts of your program separately and gradually build things up.
The Quilt
The quilt drawing is made of three different "patch" drawings: bars, eye, and bowtie. Each
patch type is drawn by its own function, and these functions are the first three parts of the
project. Below, we specify some milestones in developing your assignment. You can feel
free to add additional functions to the quilt.py file as needed, but the functions specified
below are meant to be milestones in developing your program.
– 9 –
1. Task: Drawing bars
Function: draw_bars(canvas, x, y, width, height, num_lines)
Write the code for the draw_bars function, that draws a rectangle and then a series
vertical bars (see examples below) on the graphics canvas.
You should draw a rectangle on the passed in canvas with the rectangle’s upper left-
hand corner specified by the parameters x, y and the rectangle drawn should be width
pixels wide and height pixels high. You can make the rectangle light blue by adding
the optional named parameter outline='lightblue' when calling the
create_rectangle function. Note that all of the patches we draw will have this
light blue border rectangle, marking their outer edge.
Then, draw num_lines black vertical lines on the canvas. The first line should be on
the left edge of the patch, covering the left side of the border rectangle. The last line
should be at the right edge, covering the right side of the border rectangle. All the other
lines should be evenly spaced between the two sides. You can assume that num_lines
is guaranteed to be at least 2.
Testing your bars
When you run your quilt.py program from the command line, you can specify the
first command line argument as -bars. In that case, the main function calls your
draw_bars function, passing in the values of width, height, and num_bars as the
numbers you typed on the command line. Here is a command line to run the program
to draw the bars patch, 300 pixels wide, 200 pixels high, and with num_bars passed
the value 10:
py quilt.py -bars 300 200 10
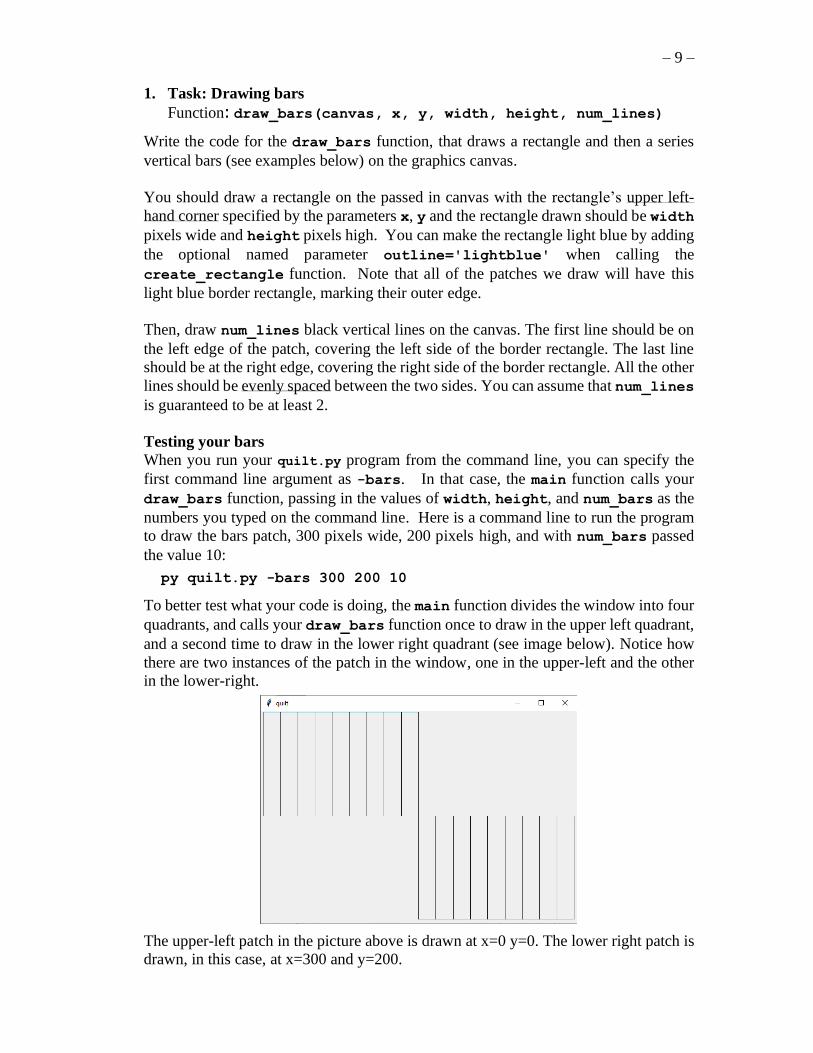
To better test what your code is doing, the main function divides the window into four
quadrants, and calls your draw_bars function once to draw in the upper left quadrant,
and a second time to draw in the lower right quadrant (see image below). Notice how
there are two instances of the patch in the window, one in the upper-left and the other
in the lower-right.
The upper-left patch in the picture above is drawn at x=0 y=0. The lower right patch is
drawn, in this case, at x=300 and y=200.
– 10 –
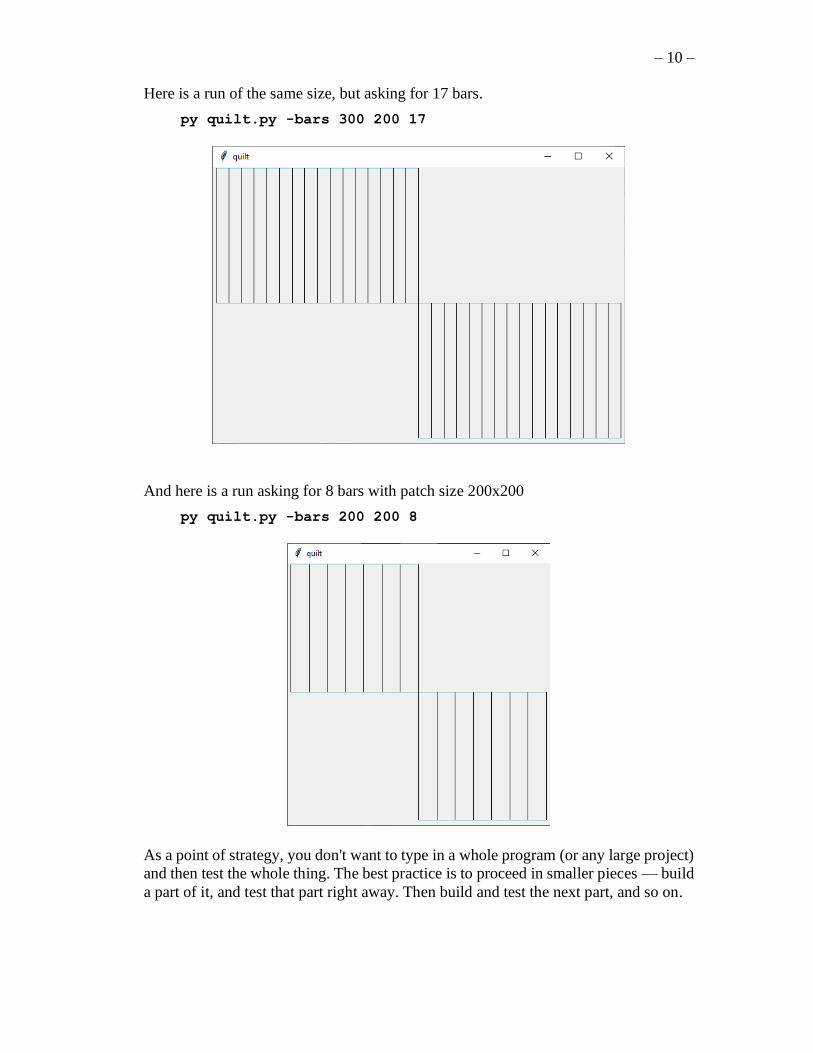
Here is a run of the same size, but asking for 17 bars.
py quilt.py -bars 300 200 17
And here is a run asking for 8 bars with patch size 200x200
py quilt.py -bars 200 200 8
As a point of strategy, you don't want to type in a whole program (or any large project)
and then test the whole thing. The best practice is to proceed in smaller pieces — build
a part of it, and test that part right away. Then build and test the next part, and so on.
– 11 –
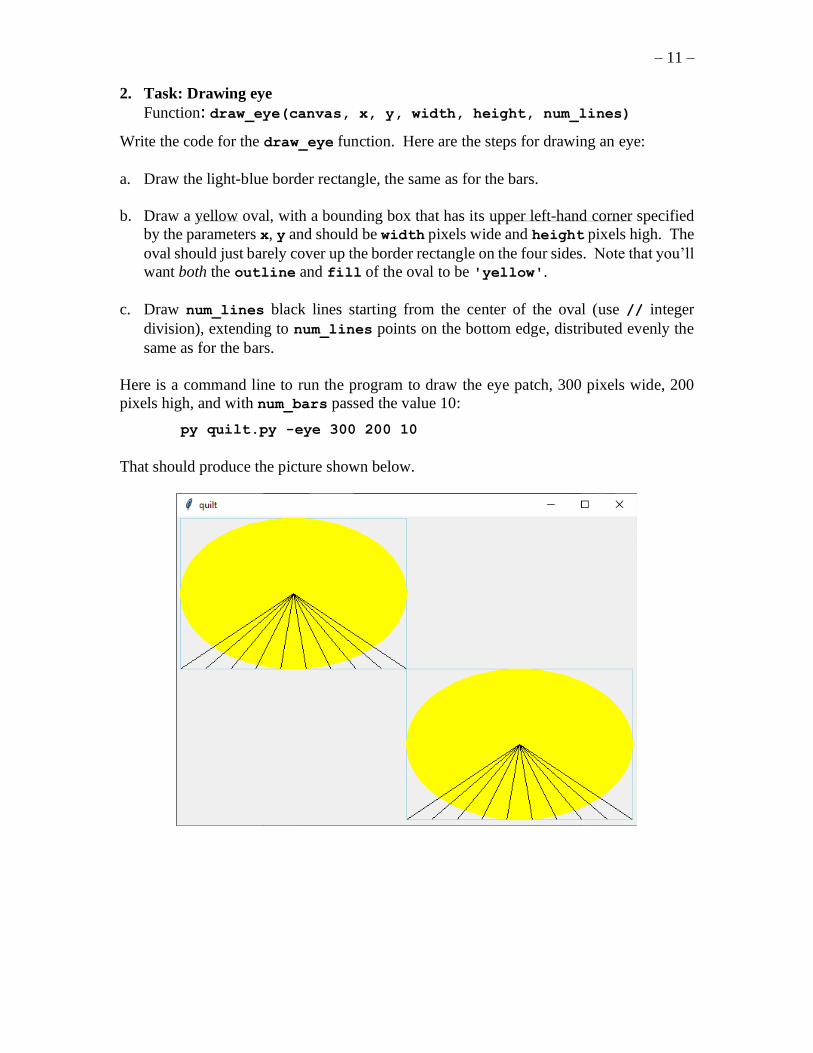
2. Task: Drawing eye
Function: draw_eye(canvas, x, y, width, height, num_lines)
Write the code for the draw_eye function. Here are the steps for drawing an eye:
a. Draw the light-blue border rectangle, the same as for the bars.
b. Draw a yellow oval, with a bounding box that has its upper left-hand corner specified
by the parameters x, y and should be width pixels wide and height pixels high. The
oval should just barely cover up the border rectangle on the four sides. Note that you’ll
want both the outline and fill of the oval to be 'yellow'.
c. Draw num_lines black lines starting from the center of the oval (use // integer
division), extending to num_lines points on the bottom edge, distributed evenly the
same as for the bars.
Here is a command line to run the program to draw the eye patch, 300 pixels wide, 200
pixels high, and with num_bars passed the value 10:
py quilt.py -eye 300 200 10
That should produce the picture shown below.
– 12 –
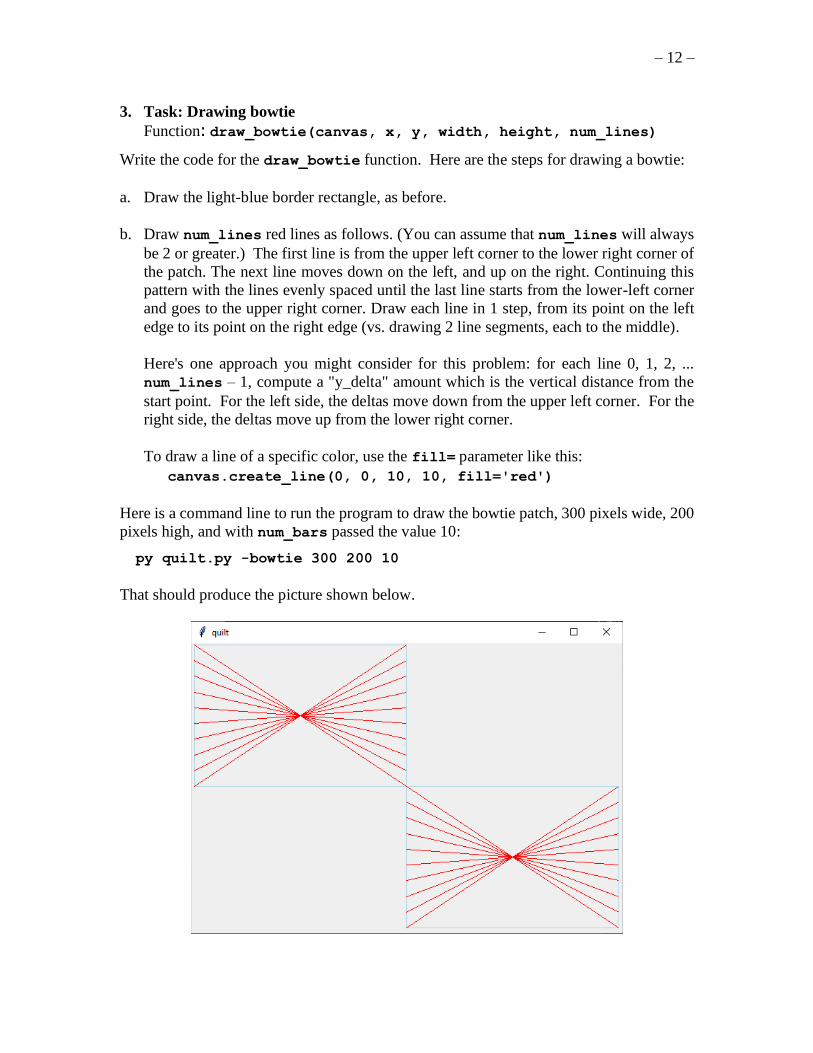
3. Task: Drawing bowtie
Function: draw_bowtie(canvas, x, y, width, height, num_lines)
Write the code for the draw_bowtie function. Here are the steps for drawing a bowtie:
a. Draw the light-blue border rectangle, as before.
b. Draw num_lines red lines as follows. (You can assume that num_lines will always
be 2 or greater.) The first line is from the upper left corner to the lower right corner of
the patch. The next line moves down on the left, and up on the right. Continuing this
pattern with the lines evenly spaced until the last line starts from the lower-left corner
and goes to the upper right corner. Draw each line in 1 step, from its point on the left
edge to its point on the right edge (vs. drawing 2 line segments, each to the middle).
Here's one approach you might consider for this problem: for each line 0, 1, 2, ...
num_lines – 1, compute a "y_delta" amount which is the vertical distance from the
start point. For the left side, the deltas move down from the upper left corner. For the
right side, the deltas move up from the lower right corner.
To draw a line of a specific color, use the fill= parameter like this:
canvas.create_line(0, 0, 10, 10, fill='red')
Here is a command line to run the program to draw the bowtie patch, 300 pixels wide, 200
pixels high, and with num_bars passed the value 10:
py quilt.py -bowtie 300 200 10
That should produce the picture shown below.
– 13 –
Milestone: Being able to draw all three patches Build and debug your code until it can draw all three patch types correctly for various sizes
and values of num_lines.
Quilting Bee The last part uses decomposition to build the whole quilt. The draw_quilt function is
passed in a canvas of a specified width and height. The quilt will be made of an n-by-
n grid of sub-rectangles, each the same size. We'll call the width and height of each sub-
rectangle the sub_width and sub_height.
You should compute the sub_width and sub_height for the quilt. For example, if the
overall canvas is 800 pixels wide and n is 11, the sub_width is 88 (i.e., 800 divided by
11, rounding down is 88). Use the integer division // operator to do this computation.
You have seen how to write a nested y/x loop to go over all the pixels in an image. In this
case we want a nested loop over the row/col numbers of the patches (e.g., row=0 is the top
row of patches, row=1 is the next row of patches and so on). Those nested loops would
look something like this:
# loop over rows and columns of patches
for row in range(n):
for col in range(n):
# Draw one patch of the grid of patches
To draw the whole quilt, some of the questions you’ll need to answer (in your code)
include:
• What is the x,y pixel coordinate of upper left corner of the patch at row,col?
• What is its width and height?
• What do you do to draw a patch there?
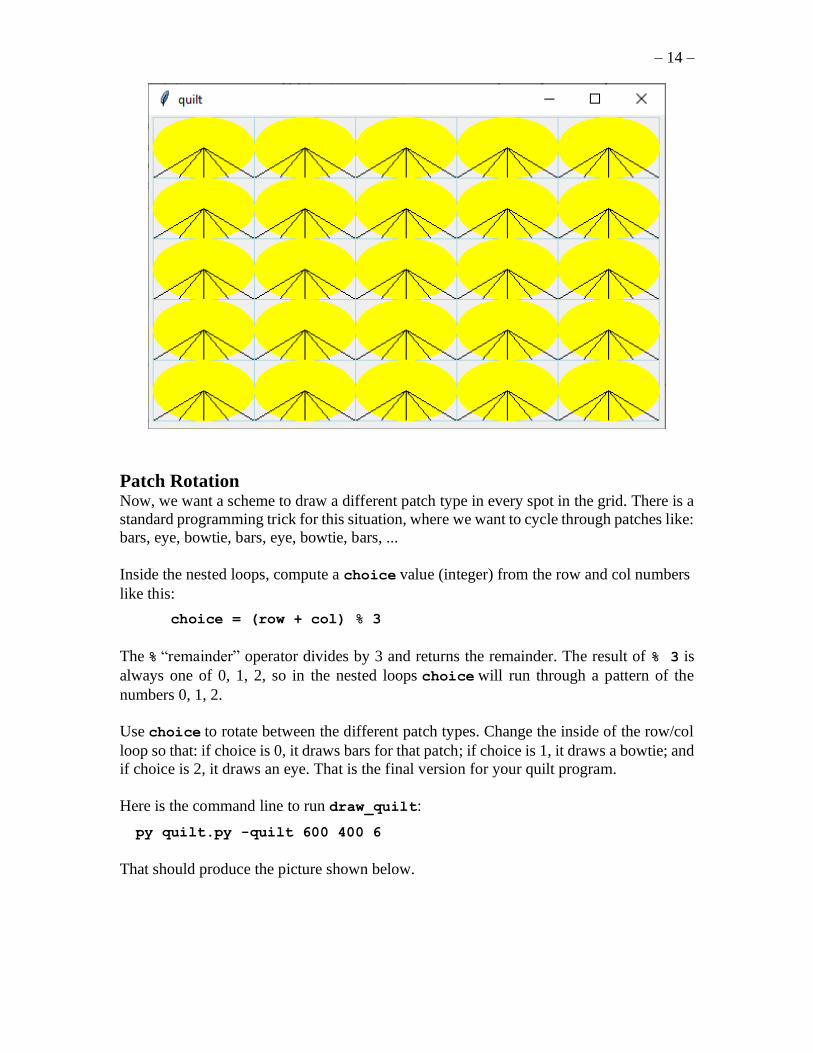
Milestone: Eye test Inside the row/col loop (an example of which we gave you above), call draw_eye to draw
an eye for every patch in the quilt to test that the row/col logic is working. Below is the
command line to call your draw_quilt function, here creating a 500 x 300 canvas with n
of 5. That creates 5 x 5 patches, and each patch also uses num_lines of 5 (you should use
the value n for two things here: the number of patches, and the internal value num_lines
of each patch).
py quilt.py -quilt 500 300 5
That should produce the picture shown below.
– 14 –
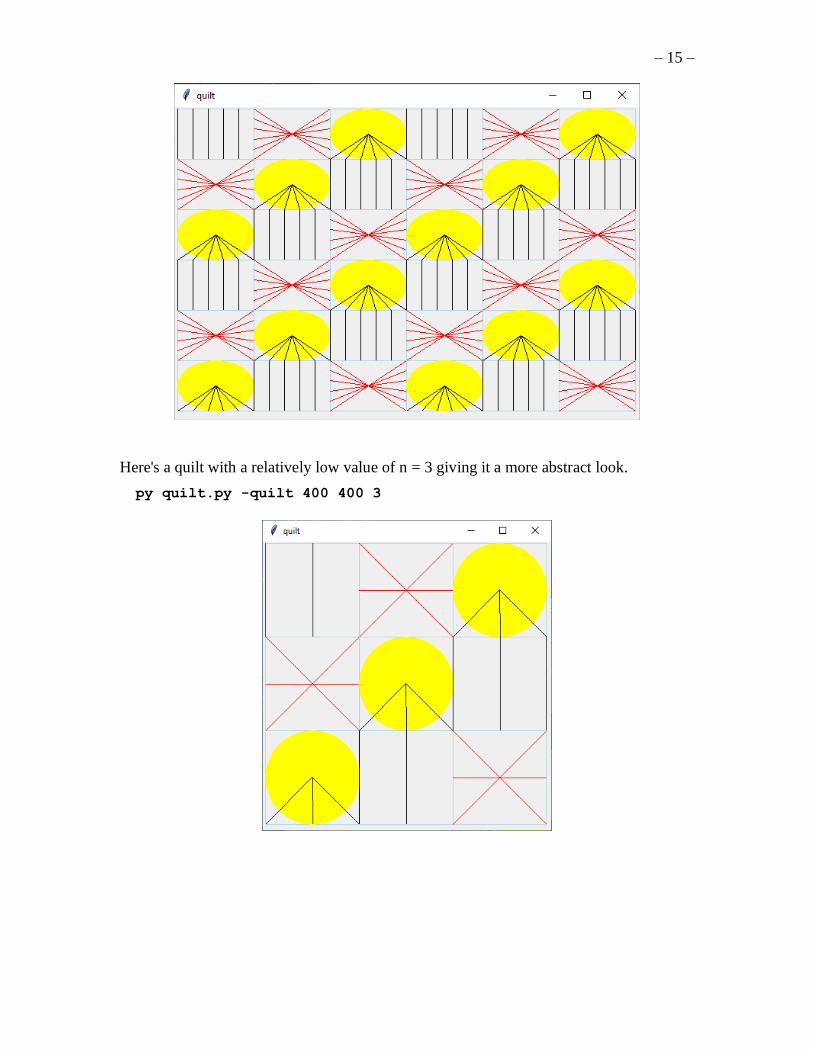
Patch Rotation Now, we want a scheme to draw a different patch type in every spot in the grid. There is a
standard programming trick for this situation, where we want to cycle through patches like:
bars, eye, bowtie, bars, eye, bowtie, bars, ...
Inside the nested loops, compute a choice value (integer) from the row and col numbers
like this:
choice = (row + col) % 3
The % “remainder” operator divides by 3 and returns the remainder. The result of % 3 is
always one of 0, 1, 2, so in the nested loops choice will run through a pattern of the
numbers 0, 1, 2.
Use choice to rotate between the different patch types. Change the inside of the row/col
loop so that: if choice is 0, it draws bars for that patch; if choice is 1, it draws a bowtie; and
if choice is 2, it draws an eye. That is the final version for your quilt program.
Here is the command line to run draw_quilt:
py quilt.py -quilt 600 400 6
That should produce the picture shown below.
– 15 –
Here's a quilt with a relatively low value of n = 3 giving it a more abstract look.
py quilt.py -quilt 400 400 3
– 16 –
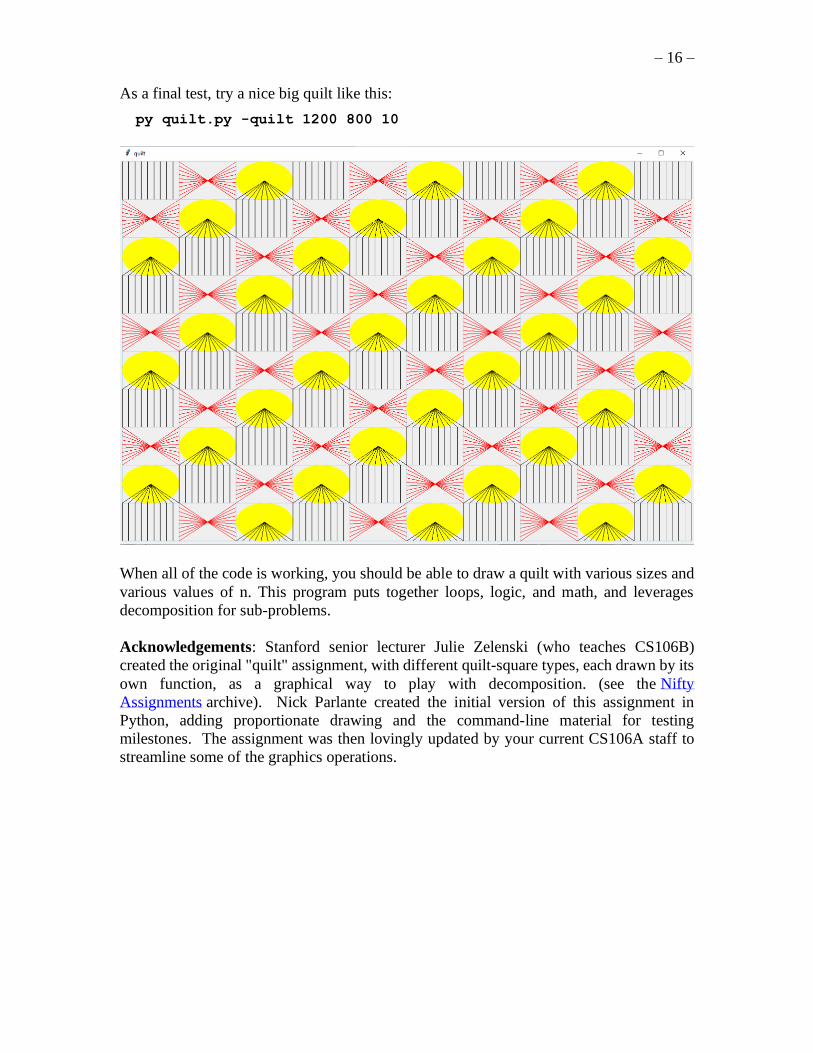
As a final test, try a nice big quilt like this:
py quilt.py -quilt 1200 800 10
When all of the code is working, you should be able to draw a quilt with various sizes and
various values of n. This program puts together loops, logic, and math, and leverages
decomposition for sub-problems.
Acknowledgements: Stanford senior lecturer Julie Zelenski (who teaches CS106B)
created the original "quilt" assignment, with different quilt-square types, each drawn by its
own function, as a graphical way to play with decomposition. (see the Nifty
Assignments archive). Nick Parlante created the initial version of this assignment in
Python, adding proportionate drawing and the command-line material for testing
milestones. The assignment was then lovingly updated by your current CS106A staff to
streamline some of the graphics operations.