Embed Size (px)
Citation preview
Assisted Descriptor Selection Based on Visual Comparative Data Analysis
Sebastian Bremm' and Tatiana von Landesberger' ·2 and Jürgen Bernard' and Tobias Schreck '
[Technische Universität Darmstadt. Germany 2Fraunhofer Institute for Computer Graphics Research. Darmstadt, Gerl11any
Abstract
Exploration and selection of data descriptors representing objects using a set of features are important components in many data analysis tasks. Usually, for a given dataset, an optimal data description does not exist, as the suitable data representation is strongly use case dependent. Many solutions for selecting a stt.itable data description have been proposed. In most instances, they require data labels and often are black box approaches. Non-expert users have diffzcullies 10 cmnprehend Ihe coherency of i/lplll, parameters, and OlllpUI of Ihese algorilhm.\'. Alternative approaches, interactive systems for visual feature selection, overburden the user with an overwhelming set of options and data views. Therefore, it is essential to offer the users a guidance in this analytical process. In this paper, we present a novel systemfor data description selection, whichfacilitates the user's access to the dala allal)'sis process. As .lillding 01' sllilable dala descriplioll consisls 01' several sIeps, lI'e supporl Ill e user with guidance. Dur system combines automatic data analysis with interactive visualizations. By this, the system provides a recommendation for suitable data descriptor selections. II supports the comparison of data descriptors with differing dimensionality for unlabeled data. We propose specialized scores and interactive views for descriptor comparison. The visualization techniques are scatterplot-based and grid-based. For the latter case, we apply Selj-Organizing Maps as adaptive grids which are weil suitedfor large multi-dimensional data sets. As an example, we demonstrate the usability of our system on a real-world biochemical application..
1. Introduction
Exploration of and search in large data sets are important tasks in various appli cation domains such as biology, finance , architecture, music, or emergency management. These applications handle objects of various types including molecules , music files , videos, im ages, 3D models , etc .
The analytical tasks in these areas are usually supported by efficient clustering and data retrieval aigorith ills relying on the calculation of object silllilarity. Although various methods for measuring data similarity ex ist, descriptors of data elements (i.e., multi -dimensional feature vectors, or feature sets) is commonly used in many applications. Data descriptors represent objects by an-dimensional vector of nUlllerical values (i.e. , features) . The simi larity between objects is then calculated applying vector distance measures. The results are used as input to data analysis algorithms inte-
grated in the application. The quality of the data descriptors has a major impact on the analytical results, therefore a lot 01" attention is given to finding suitable da ta descripri on .
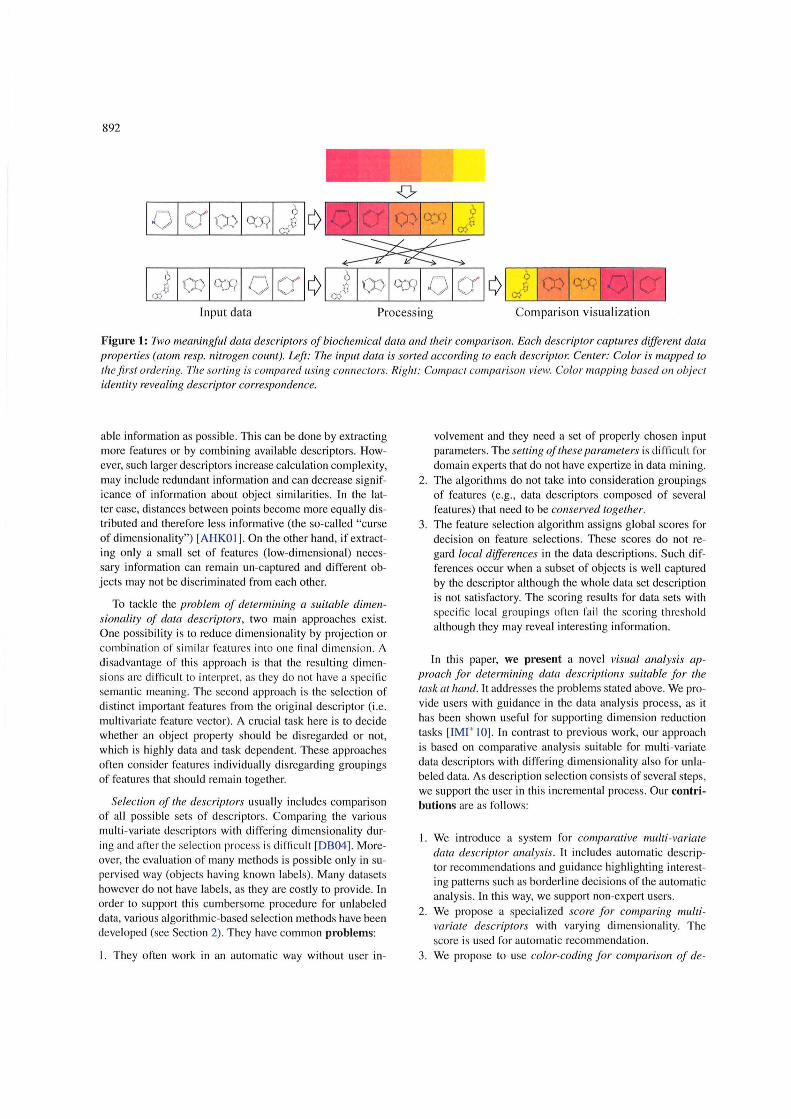
Determination of suitable data description is highly data and use case dependent. It should capture the relevant information from the input objects. Usually, the objects can be represented by descriptors in several ways, each capturing different data properties (see Figure I for an illustration). Which one is used in the analytical task, depends highly on the current task and semantics of the descriptor. For exam pie, in biochemistry, the analyst may concentrate on aromatic properties of the lllolecules or on the ir fragment complexity. Finding an optimal data description (i.e., a multi variate feature vector) is not a trivial task, in particular for unlabeled data. On one hand, adescriptor with higher dimensionality can be calculated in order to capture as much avail -
892
Input data Process ing Comparison visualization
Figure 1: Two meaningful dala descriptors oJ biochemical data emd their comparison. Each descriptor captures different data proper/ies (atom resp. nitrogen count). Left: The input data is sorted according to each descriptor. Center: Color is mapped to fh efirsf ordering. Th e sorfin g is cOlllpared llsing connecfors. Righf: Compacf comparison view. Color mapping based on obj ec f identity revealing descriptor corresponclence.
able information as possible. This can be done by extracting more features or by combining available descriptors. However, such larger descriptors increase calculation complexity, may include redundant information and can decrease significance of information about object simi larities. In the latter case, distances between points become more equally di stributed and therefore less informative (the so-called "curse of dimensionality") [AHKO I]. On the other hand, if extracting on ly a small set of features (low-dimensional) necessary information can remain un-captured and different objects may not be discriminated from each other.
To tackle the problem oJ determining a suitable dimensionality oJ data descriptors, two main approaches exist. One possibility is to reduce dimensionality by proj ection or combinati on of similar features into one final dimension. A di sadvantage of thi s approach is that the resulting dimensions are diffieult to interpret, as they do not have a specific semantic meaning. The second approach is the selection of distinct important features from the original descriptor (i .e. multivariate feature vector). A crucial task here is to decide whether an object property should be di sregarded or not, which is highly data and task dependent. These approaches often consider features individually disregarding groupings of features that should remain together.
Selection oJ the descriptors usually includes comparison of all possible sets of deseriptors. Comparing the various multi -variate descriptors with differing dimensionality during and after the seleet ion proeess is difficult [DB04]. Moreover, the evaluation of many methods is possible only in supervised way (objects hav ing known labels). Many datasets however do not have labels, as they are costly to provide. In order to support thi s cumbersome procedure for unlabeled data , various algorithmic-based selection methods have been developed (see Seetion 2). They have common problems:
I. They often work in an automatie way without user in-
volvement and they need a set of properly chosen input parameters. The setting oJ these parameters is di fficu ll for domain experts that do not have expertize in data mining.
2. The algorithms do not take into consideration groupings of features (e.g., data descriptors composed of several features) that need to be conserved together.
3. The feature seleetion algorithm assigns global scores for deeision on feature selections. These scores do not regard local differences in the data descriptions . Such differenees oeeur when a subset of objects is weil captured by the deseriptor although the whole data set deseription is not satisfactory. The seoring results for data sets with spec ifi c local groupin gs orten fail the scoring threshold although they may reveal interesting information.
In this paper, we present a novel visual analysis approach Jor cletermining data descriptions suitable Jor the task at hand. It addresses the problems stated above. We provide users with guidanee in the data analysis proeess, as it has been shown useful for supporting dimension reduetion tasks [IMI* 10]. In contrast to previous work, our approach is based on eomparative analysis suitable for multi -variate data deseriptors with differing dimensionality also fo r unlabeled data. As deseription seleetion consists of several steps, we support the user in thi s ineremental proeess . Our contributions are as folIows:
I. We introduee a system for cOll1parative multi-variate data descriptor analysis. It inelLldes automatie deseriptor reeommendations and guidanee highlighting interesting patterns such as borderline deeisions of the automatie analysis. In this way, we support non-expert users.
2. We propose a speeia li zed score Jor comparing multivariate descriptors with varying dimensionality. The score is used for automatie reeommendation.
3. We propose to use color-coding Jor comparison oJ de-
scriptors. The color coding provides data comparison in one single view (see Figure I for an illustration) .
4. We develop dedicated visualizations for comparison of multi-dimensional data descriptors. These techniques are based on low-dimensional data presentation (scatterplotbased and grid-based) using color as comparison attribute. For large data sets, we employ adaptive grids with e1ustering properties - Self-Organizing Maps. These views allow for spotting overall similar descriptors and locally similar object groups in heterogeneous data sets.
We apply our techniques on real-world (biochemistry) and synthetic data sets demonstrating their usefulness.
The paper structure: Section 2 presents related work on algorithmic feature selection, data visualization and their interactive combination. It also introduces the Self-Organizing Map algorithm. Section 3 depicts our approach. It introduces the process as a whole, and then describes each part in more detail. Section 4 explains further aspects of our approach. Section 5 discusses color map choices. Section 6 shows applications of our approach on real data. Finally, Section 7 coneludes and outlines future work.
2. Related Work
Finding an appropriate description for complex data types such as music [MM05), 3D objects [BKSS07), time series [Keo06), graphs [vLGS09) or biochemistry [BMGR04) data is a recent topic in various research areas. This description can be used for example in various data analysis , classifi cati on or search scenarios. Note that in this paper, we assurne un classified da ta in an exploralory analysis scenario.
The choice of relevant data descriptions (i.e., feature sets) is usually supported by feature selection algorithms (see Section 2. 1). For exploration of the descriptors, interactive vi sual representations are used (see Section 2.2). Recent Vi sual Analysis tools combine both approaches in order to exploit their advantages (see Section 2.3).
2.1. Automatie Dimensionality Reduction
Data descriptors consist of a set of features (numeric values) represenling cOlllplex dala lypes. However. finding a proper descriptor is achallenge. Low dimensionality may lead to under-representation of the objects, and high-dimensional descriptors may suffer from problems such as "curse of di mensionality", where the distances between near and far objects converge [AHKOI , BGRS99). To tackle this problem, two main algorithmic approaches have been proposed: l) di mension reduction and 2) feature selection . They often consider dimensions individually, di sregarding possible semantic groupings of dimensions.
Dimension reduclion techniques create an abstract reduced data description by projection 01' transformation of the original features into lower dimensional space. Examples are
893
PCA [10102), MDS [BG97], Sammon's mapping [ECOl ) or spectral e1ustering [NJWOI ). The reslllting dimensions have no direct equivalence to the original dimensions. Therefore, the output dimensions are hard to interpret directly.
Feature selection approaches identify a set of meaningFul fealures as subset of lhe in pul dimensionality. The fi nal descriptor is built by interactive refi nemenl of feature se\ecli ons. These approaehes can be c1assifi ed aecording to the applied evaluati on criteri on into filter and wrapper approaches [KJ97). Filter methods rely on an evaluation of the properties of every feature individually. If a certain criterion (e.g., entropy of distances [DCSL02]) is ful fi lied. the feature is selected as relevant [KR92, Kon94,AD91 ). Wrapper methods extend feature selection process with an additional step e.g., e1ustering. The e1ustering results of the selected feature sets are evaluated to determine their relevance. However, the compari son of the results is difficult owing to vari able number of resulting clusters and differences in the underlying feature space dimensionality [DB04).
Thc usagc 01' algorilhilli e approaehes solely is di ('fjeult 1'01'
non-expert users as they need setting of, possibly extensive, Illimber of input parameters and work in a black-box manner.
2.2. Visualization of High Dimensional Data
Finding appropriate parameters for various data analysis al gorithills is crucial, but c1i fficull for users who are not ex perts in data mining techniques (e.g., engineers or biologists). Using an interactive visuali zation, the user can steer the analysis process more intuitively. Often matrices of different feature representations are usecl for comparing high dimensional data. Wilkinson et al. [WAG06) show an overview of the descriptor space by visualizing scatterplotts for all pairs of input dimensions. Sips et al. [SNLH09) extend this approach by showing scatterplot matrices where each di splayed axis is a combination of input features . Alternatively, an interactive visualization of a confusion matrix can be used to build combination models [TLKT09, KLTHIO).
Visualization of high-dimensional data can be supported by a Self-Organizing Map (SOM). It is a neural network al gorithm that combines dimension reduction, e1ustering and layout of the data [Ves99, KohOI ). The dimension reduction is achieved by a projection of multivariate input data onto a low dimensional grid of prototypes (the map) in a way that it approximately preserves the topological properties of the data set (i .e. , two data points that are e10se in original space are usually e10se in the lower dimensional space) . The algorithm can handle large data sets and offers good clustering results. A SOM result can easily be visualized using the SOM grid by showing the reference prototypes (e.g., using multidimensional visualization techniques) 01' the nearest member to the prototype [Ves99).
894
2.3. Visual Analytics Approaches for Dimensionality Reduction
Integration of user feedback in the analysis process is crucial when use case dependent parameter adjustment and result evaluation are requi red. Many approaches interactively combining automatic calculations with visualization in the area of feature selection have been proposed. Choo et al. [CLKPIOI prcscntcd a framcwork for data classification combining matrix with parallel coordinates. A scatterplot shows the resulting projection of a Linear Oiscriminant Analysis [Fuk90) wh ich is ileral ively re fin ed during lhe cl assifi cation process. Usually, dimension reduction methods focus on preserving structures of the high dimensional space. Johansson and Johansson enable the user to rank the importance of those structures by interactive steering of quality metrics [J109). Tatu et al. [TAE*09) proposed analytica l mcthods to find and filtcr importanl Slructll res to redllce the complexity of the resulting vi sualization . The OimStiller [IMI' IO) framework supports the whole process of feature selection . Additionally, the user gets guidance in every step of the pipeline, e.g., regarding parameter choice. It however focuses on dimension reduetion only for individual features and does not consider local similarities .
Building upon these approaches, we propose a strategy where the user can decide on the level of process automation from a fully automatic up to a step by step assisted workflow.
3. Approach
Our approach aims at finding suilable descriptors of a given dataset. The input consists of severalmultivariate descriptors each potenti ally with a different dimensionality. The output is a subset of independent descriptors suitable for the use case at hand. In the work fl ow, the descriptors are compared pair wise ('or findin g groups 0 (' similar unes and lhereby lu choose representatives among them. It supports the scalability of our approach w.r.t. the input dimensionality.
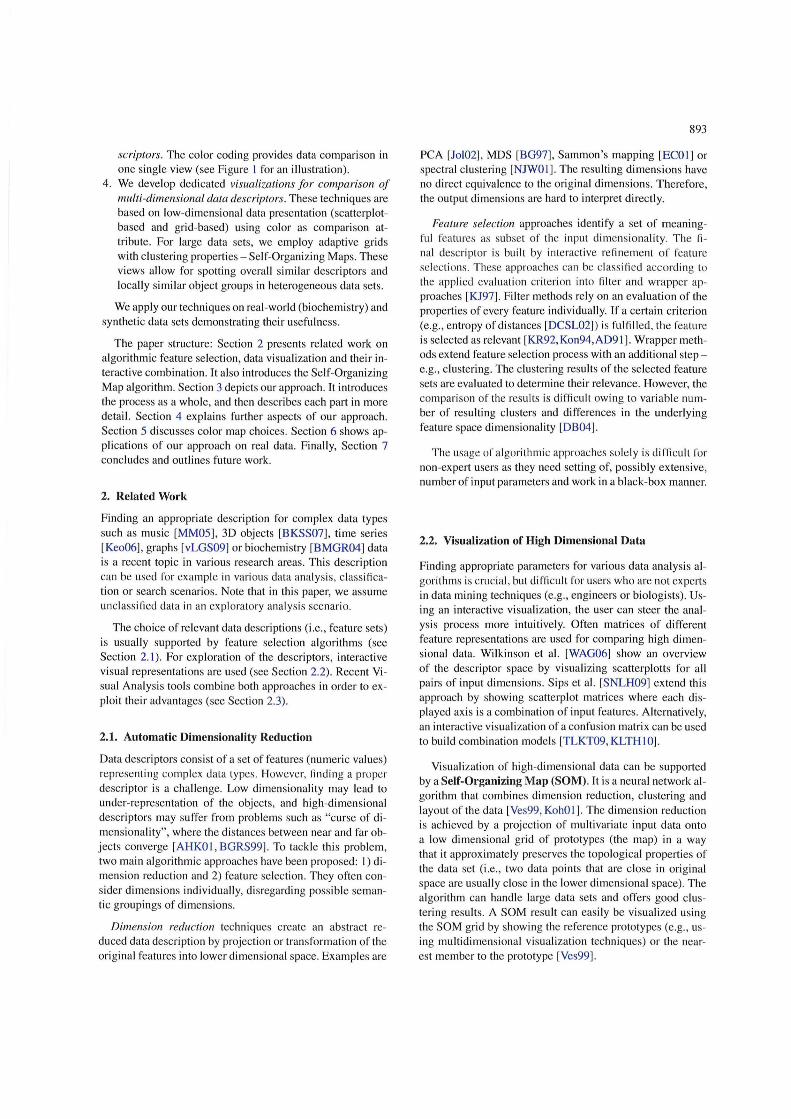
, Figure 2: Schema of the descriptor selection process. Every step (blue) encompasses automatie data processing and visualization part. The input consists of many descriptors for one dala seI. Th ese are compared alld jillered resulling in a proposed set of independent descriptors. This is an interactive, guided analysis process. Feedback loops allow the user LO rejil/.e resull.\· Oll demand.
In order to adapt the algorithms to a given use case and improve result specificilY, the user is involved in the process. We offer guidance to ease the analysis for non-expert users. We have developed a dedicated pipeline supporting the data
cJescriptor finding process (see Figure 2). This pipe line consists of several steps that are supported by both algorithmic and visual means (see Sections 3.1- 3.4). Every step of the pipeline supports visualization and is interactively steerable. By combining the automatic and visualization functions, the resullS can be iteratively refined by the anal yst.
First, the input data (a set of descriptors) can be explored using dedicated visualizations. They support the sealability w.r.t. the number of input data items. For large data sets, visual clustering using SOM is employed. Then, a pairwise comparison of the descriptors shows both global and loeal simil ariti es between them. These reslJlts are llsed for filterin g of simi lar dcscriptors. Thc fin al recommendation step shows an overview of results of automatie pre-proeessing, reeommendations and offers the user the possibility to interactively refine lhe resulls. The analysl receives addiliunal guidance by the highlighting of interesting or eritieal patterns. Feedback loops all ow the user to interactively refine the resllits.
3.1. Basis Visualization of the Descriptors
At the beginning of the analysis, it is important to get an overview of the input data set. When ehoosing the visualization design, we focused on its re-usability in the whole workfl ow. Il eases the eorrespondence of the representati ons and possibility to compare the data across displays.
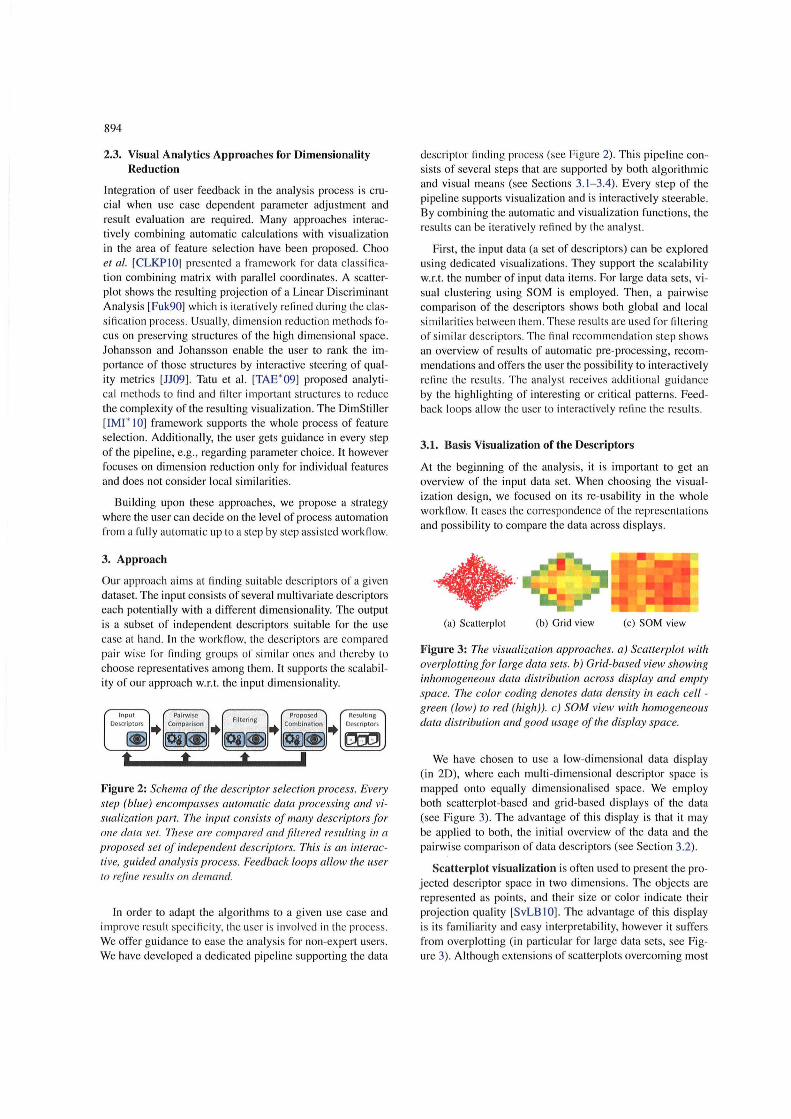
(a) Scatterplot (b) Grid view (c) SOM view
Figure 3: The visualization approach es. a) Scatterplot with overplotting for large data sets. b) Grid-based view showing inhomogeneous data distribution ac ross display and empty space. The color coding denotes data density in each cell -green (low) to red (high)). c) SOM view with homogeneous data distribution and good usage of the display space.
We have chosen to use a low-dimensional data display (in 20), where each multi-dimensional descriptor space is mapped onto equally dimensionali sed space. We employ both scatterplot-based and grid-based displays of the data (see Figure 3). The advantage of this display is that it may be applied to both, the initial overview of the data and the pairwise comparison of data descriptors (see Section 3.2).
Scatterplot visualization is often used to present the projected descriptor space in two dimensions. The objects are represented as points, and the ir size or color indicate the ir projection quality [SvLB I 0). The advantage of this di splay is its fam iliarity and easy interpretability, however it suffers from overplotting (in particular for large data sets, see Figure 3). Although extensions of scatterplots overcoming most
of these shortcomings exist, thi s problem still prevails for large complex data sets.
In order to overcome the overplotting problem in scatterplots, we propose a grid-based data Yisualization. A simple approach would be to overlay a regular grid upon the scatterplot and color-code the data density in each grid cel!. This approach is suitable, if the objects are equally distributed in space. However, in case of heterogeneous data distribution, important information might be lost (owing to high data density) and parts of the di splay might remain unused (empty cells) . We address this issue by using an adaptive grid. We propose to use a Self-Organizing Map (SOM) (see Section 2.2 for more information). This combines dimensionality reduction with a grid-based visualization. It adapts to the density of objects in high dimensional space and therefore offers a more detailed overview of the data space (see Figure 3).
3.2. Pairwise Comparison of Descriptors
The fi rst step of the pipeline is (he com pari son of the inpul descriptors fo r fin ding redundanl in formati on. Identifying correlated descriptors is a common technique in this respect. However, it often needs class labels or is restricted to equally dimensioned descriptors. Our approach is able to handle unlabeled heterogeneous multi-dimensional input descriptors. We propose a new score and dedicated views for comparing the descriptor similarity.
3.2.1. Automatie Pairwise Descriptor Comparison
Our proposed simil arity score relies on nearest neighbor relations of objects in the two descriptor spaces (see Equation I). The score is a sum of normalized neighborhood distance distorti ons over all data objects and is an extension of the projection precision score presented in [SvLB I 0] and applies also to descriptors with variable dimensionality.
Let the I different input descriptors spanning input descriptor spaces D , , ... ,D, with the dimensionality MOl , .. ,MO'. Let 07" , ... ,0R" be the n input obj ects described
in the space Da, a E 1, .. ,1. Let further dO,, (Ox,Oy) be the
distance of two objects Ox, Oy in Da. Let J& be a sorted list of the k nearest neighbors of Ox in Da. The similarity of two descriptors s(D" ,Db)' a,b E I, ... ,1 is defi ned as fo li ows:
3.2.2. Visualization of the Pairwise Descriptor Comparison
The vi sualization of the descriptor comparison builds upon the visuali zations of the data presented in Section 3. 1. The low dimensional visualization re lies on topology preservati on property of dimension reduction algorithms. From a
895
variety of approaches, a selection containing PCA, Kernel PCA, MDS, Sammons Mapping and SOM is considered.
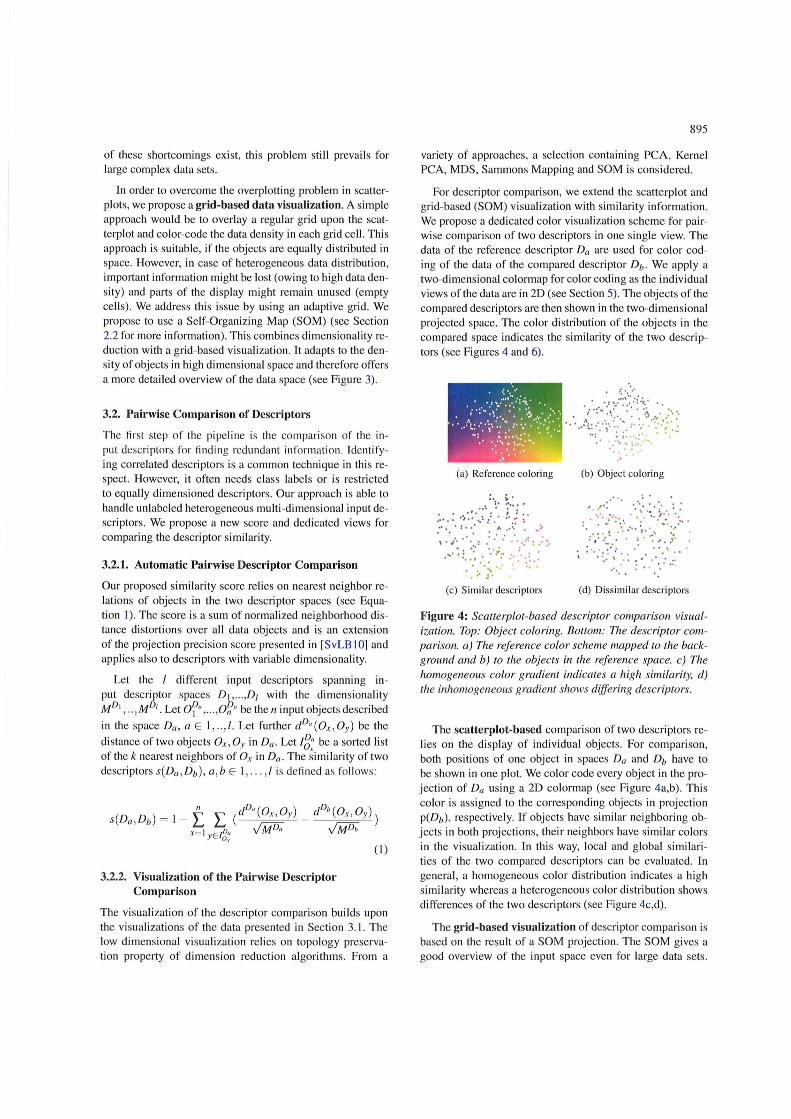
For descri ptor comparison, we extend the scatterplot and grid-based (SOM) visualization with similarity information. We propose a dedicated color vi sualization scheme fo r pairwise comparison of two descriptors in one single view. The data of the reference descriptor Da are used fo r color coding of the data of the compared descriptor Db . We apply a two-dimensional colormap for color coding as the individual views of the data are in 2D (see Section 5). The objects of the compared descriptors are then shown in the two-dimensional projected space. The color di stribution of the objects in the compared space indicates the similarity of the two descriptors (see Figures 4 and 6).
.' (a) Reference coloring (b) Object coloring
(c) Similar descriptors (d) Dissimi lar descriptors
Figure 4: Scatterplot-based descriptor comparison visualization. Top: Object coloring. Bottom: The descriptor comparison. a) The reference color scheme mapped to the background and b) to the objects in the reference space. c) The homogeneous color gradient indicates a high similarity, d) the inhomogeneous gradient shows differing descriptors.
The scatterplot-based comparison of two descriptors relies on the displ ay of individual objects. For comparison, both positions of one object in spaces Da and Db have to be shown in one plot. We color code every object in the projection of Da using a 2D colormap (see Figure 4a,b). This color is ass igned to the corresponding objects in projection P(Db), respectively. If objects have similar neighboring objects in both proj ections, their neighbors have similar colors in the visualization. In this way, local and global similarities of the two compared descriptors can be evaluated. In general, a homogeneous color di stribution indicates a high simil arity whereas a heterogeneous color di stribution shows di fferences of the two descriptors (see Figure 4c,d).
The grid-based Yisualization of descriptor comparison is based on the result of a SOM projection. The SOM gives a good overview of the input space even for large data sets.
896
In analogy to the scatterplot view, we use a two-dimensional colormap to indicate the ne ighborhood coherency. The color mapping is based on a coloring of the reference grid using a two-dimensional colormap (see Section 5 for details) and object correspondenee between grids. In the compared grid, the color of eaeh cell C;OIllP is determined by the color
of an corresponding eell C~t.r in the reference grid. However, in SOM view, objects from one compared cell may belong to several cells in the reference grid. In our approach,
C~t.r is determined by the position of the majority of objects OC;OIllP E C,COIllP in ere! (see Figure 5 for an illustration) .
In Section 4, we present further extension of this technique e.g., to visualize the cell distances.
Figure 5: Schema oJthe SOM cOlllparison coloring. LeJt: An unambiguous color assignment, where all cell membersJrom the compared SOM are groupul in one cell oJthe reJerence SOM. Right: The color assignment using majority principle - the cell color is used where the most elements are situated.
~. \ . .;:a .r- ' ,, "':" 1'1 IIJ
".- 'Mf!! ·~:,· :·t " ' .. " ~ I j~~J r
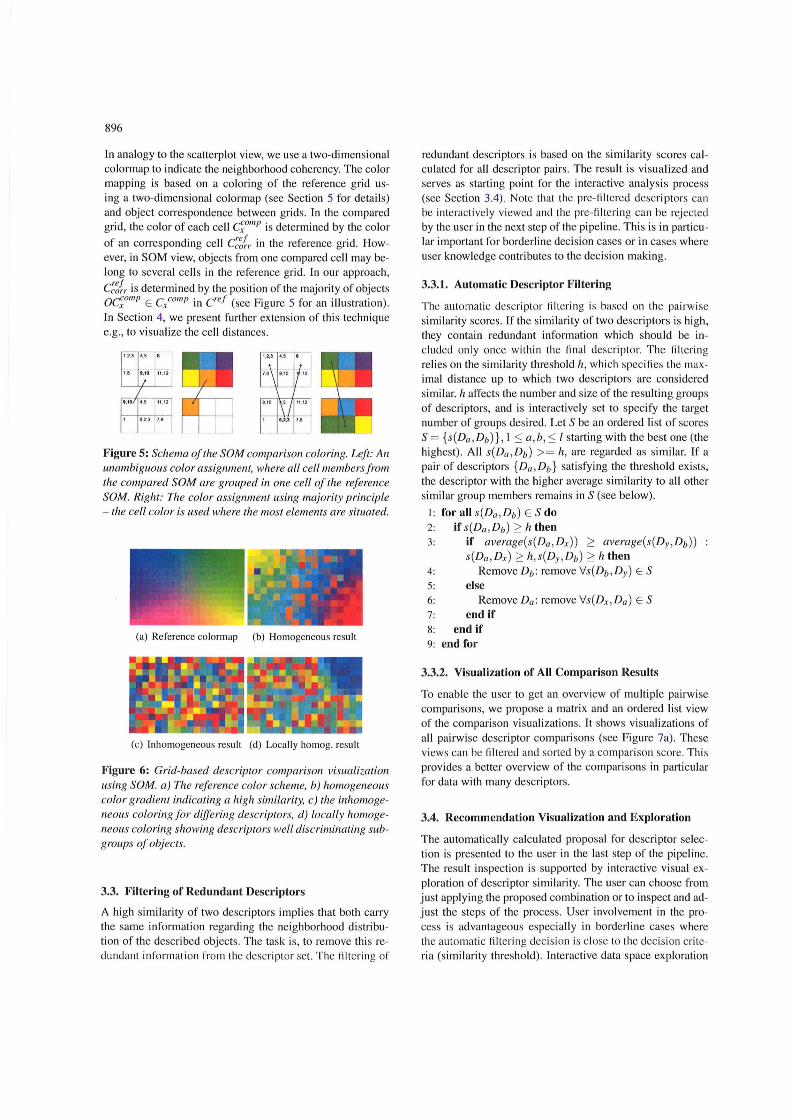
(a) Reference colormap (h) Homogeneous result
(c) Inhomogeneous result (d) Locally homog. result
Figure 6: Grid-based descriptor comparison visuaUzation using SOM. a) The reJerence color scheme, b) homogeneous color gradient indicating a high sitnilarity, c) the inhomogeneous coloring Jor differing descriptors, d) locally homogeneous coloring showing descriptors weil discriminating subgraups oJ objects.
3.3. Filtering of Redundant Deseriptors
A high similarity of two descriptors implies that both carry the same information regarding the neighborhood di stribution of the described objects. The task is, to remove thi s redundant in formation fro m thc dcseriptor sct. Thc fi ltcring 01'
redundant descriptors is based on the simi larity scores calculated for all descriptor pairs. The result is visualized and serves as starting point for the interactive analysis process (see Section 3.4). Notc that thc prc- filtercd dcseriptors ca n be interactively viewed ancl the pre- ft ltering can be rejected by the user in the next step of the pipe line. This is in particular important for borderline decision cases or in cases where user knowledge contributes to the dec ision making .
3.3.1. Automatie Deseriptor Filtering
The automatie deseriptor filtering is based on the pairwise simi larity scores. If the similarity of two deseriptors is high, they eontain redundant information which should be ineluded only onee within the final deseriptor. The filtering relies on the similarity threshold h, which speeifi es the maximal distance up to which two descriptors are considered similar. h affects the number and size of the resulting groups of descriptors, and is interactively set to specify the target number of groups desired. Let S be an ordered list of scores S = {s(Da ,Db)} , I S a,b , S I starting with the best one (the highest) . All s(Da ,Db) >= h, are regarded as similar. If 'I pair of descriptors {Da , Db} satisfying the threshold exists, the descriptor with the higher average simi larity to '111 other simi lar group members remains in S (see below) .
I : for all s(Da ,Db) E Sdo 2: if s(Da ,Db) ;:: h then 3: if average(s(Da ,Dx)) ;:: average(s(Dy,Db))
s(Da,Dx) ;:: h,s(Dv, Db ) ;:: h then 4: Remove Db: remove 'iS( Db ,Dy) E S 5: else 6: Remove Da: remove 'is(Dx, Da) E S 7: end if 8: end if 9: end for
3.3.2. Visualization of All Comparison ResuIts
To enable the user to get an overview of multiple pairwise comparisons, we propose 'I matrix and an ordered list view of the comparison visuali zations. It shows visuali zations of all pairwise descriptor comparisons (see Figure 7a). These views ean be ftltered and sorted by a eomparison score. Thi s provides a better overview of the eomparisons in particular for data with many descriptors.
3.4. Reeommendation Visualization and Exploration
The automatically calculated proposal for deseriptor seleeti on is presented to the user in the last step of the pipeline. The result inspection is supported by interactive visual exploration of descriptor similarity. The user can choose from just applying the proposed eombination or to inspect and adjust the steps of the process. User involvement in the process is advantageous especially in borderline eases where the automatie ftltering decision is el ose to the decision eriteria (similarity threshold). Interactive data spaee exploration
897
(a) Descriptor comparison matrix (b) Result view
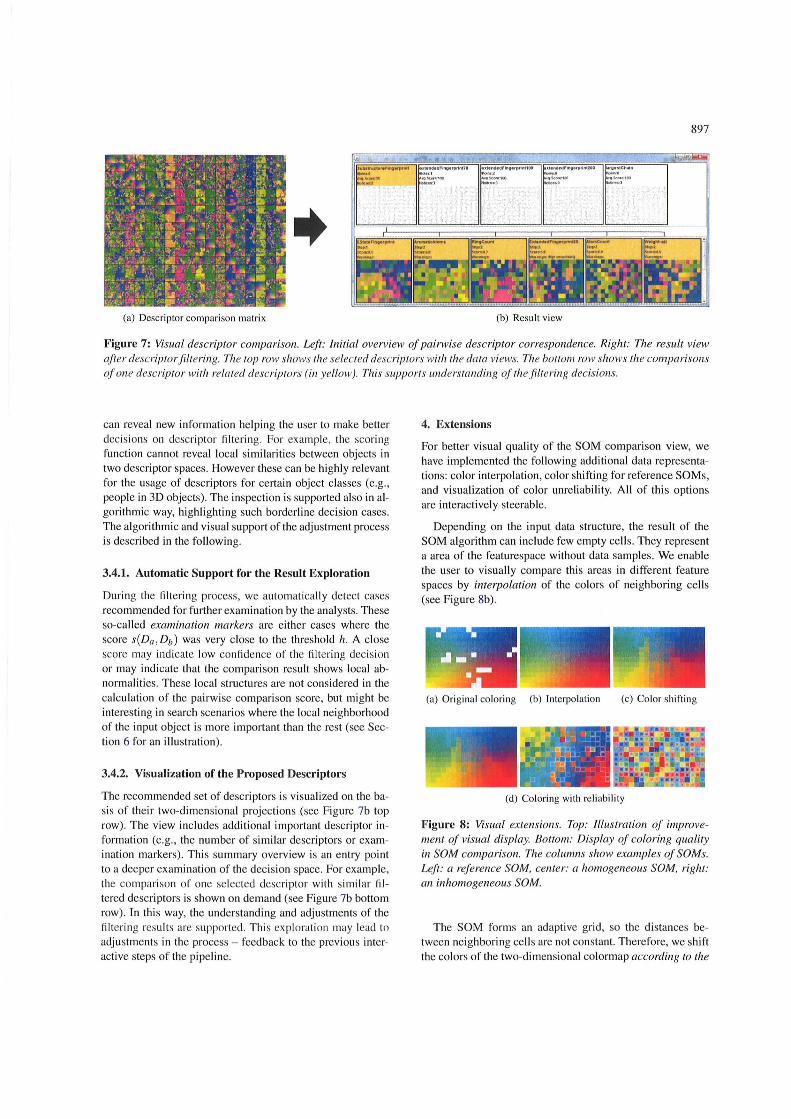
Figure 7: Visual descriptor comparison. Left: Initial overview of pairwise descriptor correspondence. Right: The result view after descriptor jiltering. The top row shows the se lee ted descriptors with the data views. The bottom row shows the comparisolls of one descriptor wilh related descriptors (in yellow). This supports unders!a1l.ding of the jiltering decisions.
can reveal new information helping the user to make better decisions on descriptor fillering. For example, the scoring function cannot reveal local similarities between objects in two descriptor spaces. However these can be highly relevant for the usage of descriptors for celtain object elasses (e.g., people in 3D objects). The inspection is supported also in al gorithmic way, highlighting such borderline decision cases . The algorithmic and visual support of the adjustment process is described in the following.
3.4.1. Automatie Support for the Result Exploration
Ollring the filtering process, we automatically detect cases recommended for further examination by the analysts. These so-ca lied examination markers are either cases where the score s(Da ,Db ) was very elose to the threshold h. A elose score may indicale low conridence of the filtering decision or may indicate that the comparison result shows local abnormalities. These local strllctures are not considered in the calclilation of the pairwise comparison score, but might be interesting in search scenarios where the local neighborhood of the input object is more important than the rest (see Section 6 for an illustration) .
3.4.2. Visualization of the Proposed Descriptors
The recommended set of descriptors is visllalized on the basis of their two-dimensional projections (see Figure 7b top row). The view incllldes additional important descriptor information (e.g., the number of similar descriptors or examination markers). This summary overview is an entry point to a deeper examination of the decision space. For example, the compari son of one se lected descriptor with simil ar filtered descriptors is shown on demand (see Figure 7b bottom row). In this way, the understanding and adjustments of the filtering results are supported. This ex ploration may lead to adjustments in the process - feedback to the previous interactive steps of the pipeline.
4. Extensions
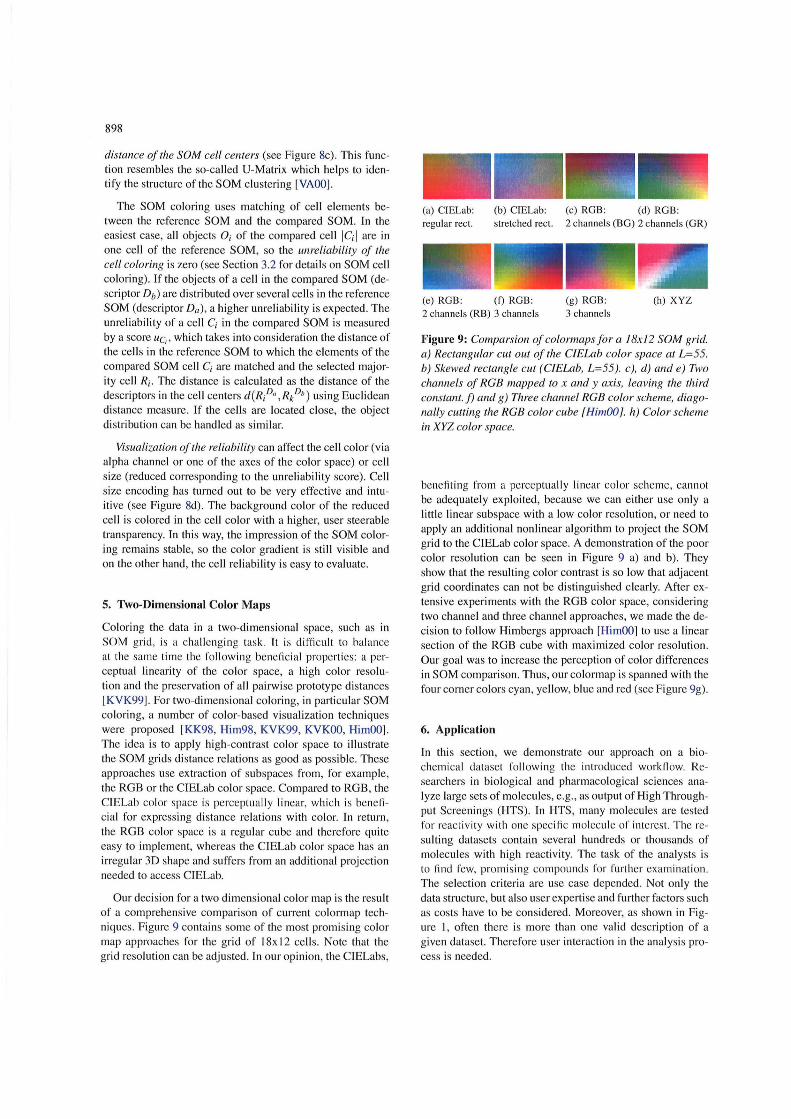
For better visual quality of the SOM comparison view, we have implemented the following additional data representations: color interpolation, color shifting for reference SOMs, and visualization of color unreliability. All of this options are interactively steerable.
Depending on the input data structure, the result of the SOM algorithm can inelude few empty cells. They represent a area of the featurespace without data sampIes . We enable the user to visually compare this areas in different feature spaces by interpolation of the colors of neighboring cells (see Figure 8b).
(a) Original coloring (b) Interpolation (c) Color shifting
(d) Coloring with reliabitity
Figure 8: Visual extensions. Top : Illustration of improvemenl of visual display. BOllom.: Display of coloring quality in SOM comparison. The columns show examples of SOMs. Left : a ref erence SOM, center: a homogeneous SOM, right: an inhomogeneous SOM.
The SOM forms an adaptive grid , so the distances between neighboring cells are not constant. Therefore, we shift the colors of the two-dimensional colormap according to the
898
distance of the SOM ceil centers (see Figure 8c). This function resembles the so-called U-Matrix which helps to identify the structure of the SOM c1ustering [VAOO).
The SOM coloring uses matching of cell elements between the reference SOM and the compared SOM. In the easiest case, all objects Oi of the compared cell ICd are in one cell of the reference SOM, so the unreliability of the ceil coloring is zero (see Section 3.2 for details on SOM cell coloring). If the objects of a cell in the compared SOM (descriptor Db ) are distributed over several cells in the reference SOM (descriptor Da), a higher unreliability is expected. The unreliability of a cell Ci in the compared SOM is measured by a score uc" which takes into consideration the distance of the cells in the reference SOM to which the elements of the compared SOM cell Ci are matched and the selected majority cell Ri . The distance is ca1culated as the di stance of the descriptors in the cell centers d(Ri Da, Rk D,, ) using Euclidean distance measure. If the cells are located c1ose, the object distribution can be handled as similar.
Visualization ofthe reliability can affect the cell color (via alpha channel or one of the axes of the color space) or cell size (reduced corresponding to the unreliability score). Cell size encoding has turned out to be very effective and intuitive (see Figure 8d). The background color of the reduced cell is colored in the cell color with a higher, user steerable transparency. In this way, the impression of the SOM coloring remains stable, so the color gradient is still visible and on the other hand, the cell reliability is easy to evaluate.
5. Two-Dimensional Color Maps
Coloring the data in a two-dimensional space, such as in SOM grid, is achallengi ng task . Tl is difficult to balance at the same time the foll owing benericial properties : a perceptual linearity of the color space, a high color resolution and the preservation of all pairwise prototype distances [KVK99]. For two-dimensional coloring, in particular SOM coloring, a number of color-based visualization techniques were proposed [KK98, Him98, KVK99, KVKOO, HimOO]. The idea is to apply high-contrast color space to illustrate the SOM grids distance relations as good as possible. These approaches use extraction of subspaces from , for example, the RGB or the CIELab color space. Compared to RGB , the CIELab color space is perceptuall y linear, which is beneficial for expressing distance re lations with color. In return, the RGB color space is a regular cube and therefore quite easy to implement, whereas the CIELab color space has an irregular 3D shape and suffers from an additional projection needed to access CIELab.
Our decision for a two dimensional color map is the result of a comprehensive compari son of current colormap techniques. Figure 9 contains some of the most promising color map approaches for the grid of l8x 12 cells. Note that the grid resolution can be adjusted. In our opinion, the CIELabs,
(a) CIELab: regular reet.
(b) CIELab: (e) RGB : (d) RGB: stretehed reet. 2 ehannels (BG) 2 ehannels (GR)
(e) RGB: (f) RGB: 2 ehannels (RB) 3 ehannels
(g) RGB: 3 ehannels
(h) XYZ
Figure 9: Comparsion of colormapsfor a 18x l2 SOM grid. a) Rectangular cut out of the CIELab color space at L=55. b) Skewed rectangle cut (CIELab, L=55). c), d) and e) Two channels of RGB mapped to x and y axis, leaving the third constant. f) and g) Three channel RGB color scheme, diagonally cutting the RGB color cu be {HimOO}. h) Color scheme in XYZ color space.
bene fiting from a perceptually linear color scheme, canno! be adequately exploited, because we can either use on ly a little linear subspace with a low color resolution, or need to apply an additional nonlinear algorithm to project the SOM grid to the CIELab color space. A demonstration of the poor color resolution can be seen in Figure 9 a) and b) . They show that the resulting color contrast is so low that adjacent grid coordinates can not be distinguished c1early. After extensive experiments with the RGB color space, considering two channel and three channel approaches, we made the decision to follow Himbergs approach [HimOO] to use a linear section of the RGB cube with maximized color resolution . Our goal was to increase the perception of color differences in SOM comparison. Thus, our colormap is spanned with the four corner colors cyan, ye llow, blue and red (see Figure 9g).
6. Application
In this section, we demonstrate our approach on a biochemieal dalasel fo ll ow ing lhe introduced workfl ow. Researchers in biologieal and pharmacologieal scienees anaIyze large sets of molecules, e.g., as output of High Throughput Screenings (HTS). In HTS, many molecules are tested for reaeriviry wirh one speeifi e mol eeul e of interes t. The resulting datasets contain several hundreds or thousands of molecules with high reactivity. The task of the analysts is to find few, pro1l1ising compounds for further exam in at ion. The selection criteria are use case depended. Not only the data structure, but also user expertise and further fae tors such as eosts have to be eonsidered. Moreover, as shown in Figure I, often there is more than one valid description of a given dataset. Therefore user interaction in the analysis process is needed.
The dataset contains 9989 molecules, described by 18 standard pharmacophore descriptors , divided into two groups. The first group cunsists ur 11 bas ic, I-D Quantitative Structure-Activity Relationship (QSAR) descriptors for, e.g., fragment complexity or the number of hydrogen-bond donors [BST04). The second is a set of so called fingerprints, binary descriptors c1ass ifying whether the described molecule fulfill s certain conditi ons 0 1' not. The group consists 01'7 fingerpr ints with a dimensionality from 26 to 400.
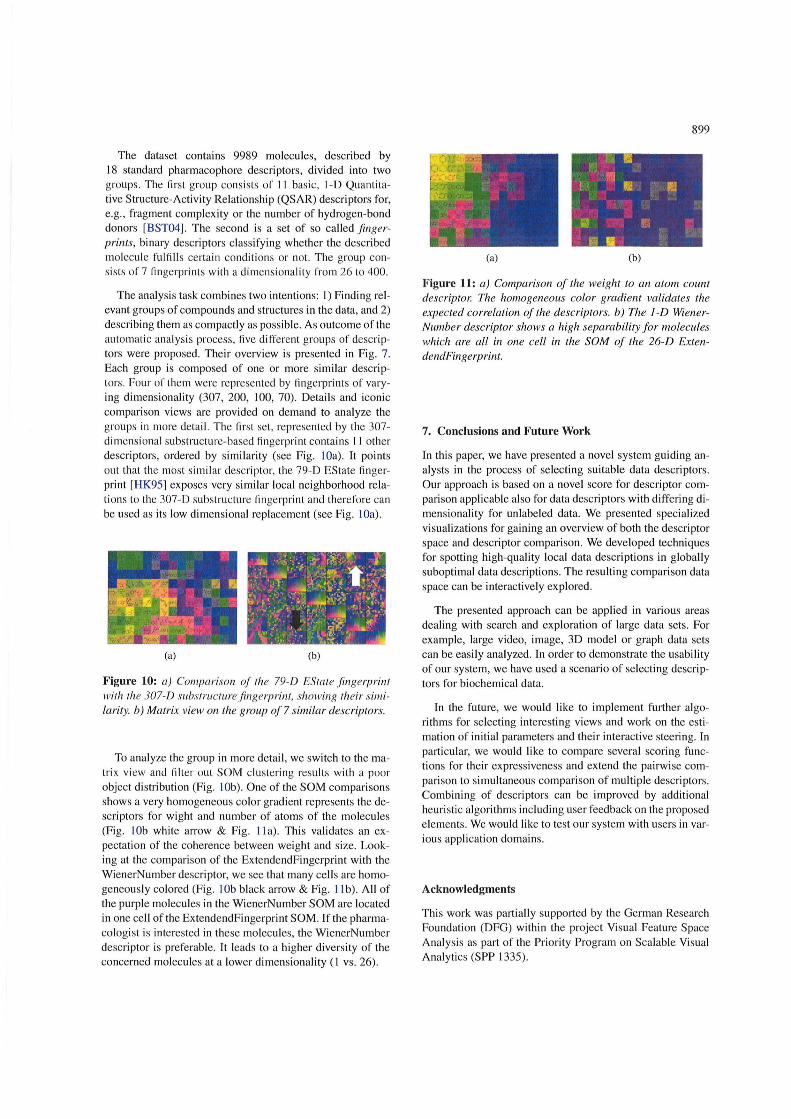
The analysis task combines two intentions: I) Finding relevant groups of compounds and structures in the data, and 2) describing them as compactly as possible. As outcome of the automati e analysis process, five different groups of descriptors were proposed. Their overview is presented in Fig. 7. Eaeh group is composed of one or more similar descriptors. Four of them were represented by fingerprints of varying dimensionality (307, 200, 100, 70). Details and iconie eomparison views are provided on demand to analyze the groups in more detai 1. The fi rst set, represented by the 307-dimensional substrueture-based fi ngerprint eontains 11 other descriptors, ordered by simi larity (see Fig. lOa) . It points out that the most si mil ar clescriptor, the 79-D EState fingerprint [HK95) exposes very similar local neighborhood relati uns tu the 307- D substructure fin gerprint and theref'ure can be usecl as its low dimensional replacement (see Fig. lOa).
(a) (b)
Figure 10: a) Comparison 0/ fh e 79-D ESlate fingerprint lVith the 307-D .I'ub.l'tructure fing erprint, .I'hm ving their .I'illlilarity. b) Matrix view on the group 0/7 similar descriptors.
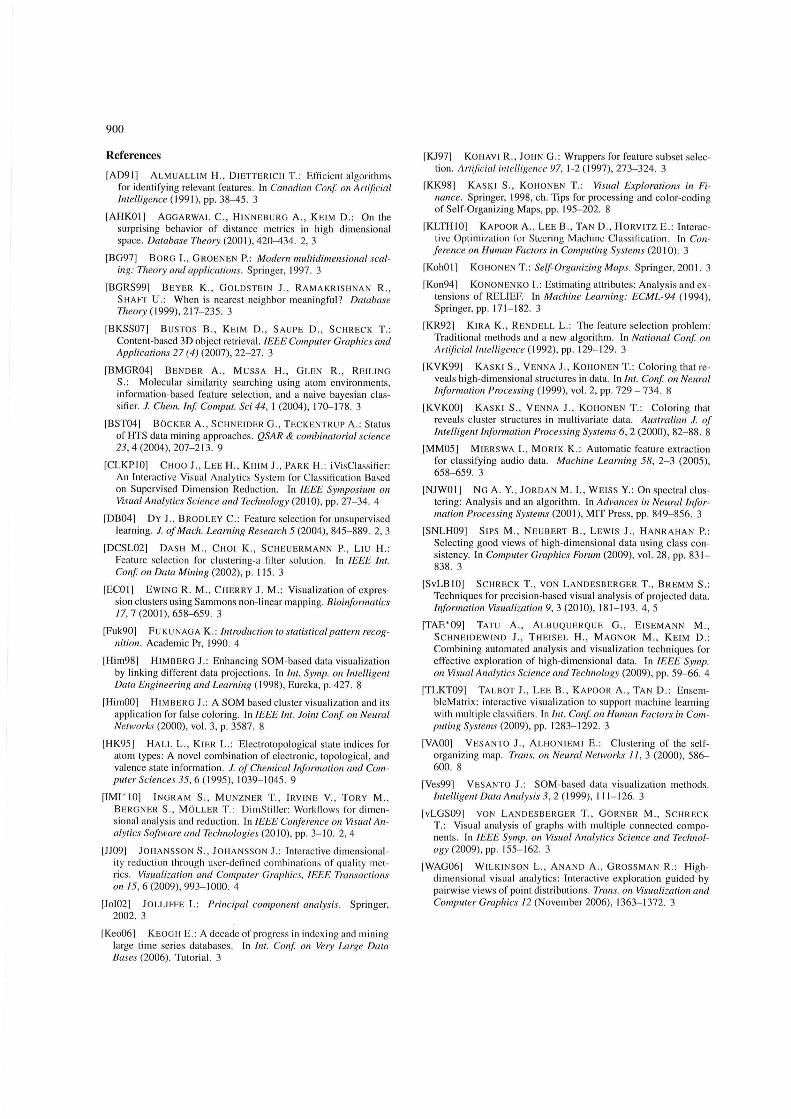
To analyze the group in more detail , we switch to the matri x view and filte r uut SOM c1ustering results with a puur object distribution (Fig. lOb). One of the SOM comparisons shows a very homogeneous co lor gradient represents the descriptors for wight and number of atoms of the molecules (Fig. lOb white arrow & Fig. Il a). This validates an expectation of the coherence between weight and size. Looking at the comparison of the ExtendendFingerprint with the WienerNumber descriptor, we see that many cells are homogeneously colored (Fig. lOb bl ack arrow & Fig. Il b) . All of the purple molecules in the WienerNumber SOM are located in one cell of the ExtendendFingerprint SOM. If the pharmacologist is interested in these molecules, the WienerNumber descriptor is preferable. It leads to a higher diversity of the concerned molecules at a lower dimensionality ( I vs. 26).
899
(a) (b)
Figure 11: a) Comparison 0/ the weight to an atom count descriptor. The hom.ogeneous color gradient validates the expected correlation 0/ the descriptors. b) The l -D WienerNumber descriptor shows a high separability /or molecules whieh are all in one eell in the SOM 0/ the 26-D ExtendendFingerprint.
7. Conclusions and Future Work
In thi s paper, we have presented a novel system guiding analysts in the process of selecting suitable data descriptors . Our approach is based on a novel score for descriptor comparison applicable also for data descriptors wi th differing dimensionality far unlabeled data. We presented specialized visualizations for gaining an overview of both the deseriptor space and descriptor comparison. We developed techniques for spotting high-quality local data descriptions in globally suboptimal data descriptions. The resulting comparison data space can be interactively explored.
The presented approach can be applied in various areas dealing with search and exploration of large data sets. For example, large video, image, 3D model or graph data sets can be easily analyzed. In order to demonstrate the usability of our system, we have used a scenario of selecting descriptors for biochemical data.
In the future, we would like to implement further algorithms for selecting interesting views and work on the esti mation of initial parameters and their interactive steering. In particular, we would like to compare several scoring functions for their expressiveness and extend the pairwise comparison to simultaneous comparison of multiple descriptors. Combining of descriptors can be improved by additional heuristic algorithms inc1uding user feedback on the proposed elements . We would li ke to test our system with users in various appli eation domains.
Acknowledgments
Thi s work was pmtially suppolted by the German Research Foundation (DFG) within the project Vi sual Feature Space Analysis as part of the Priority Program on Scalable Visual Analytics (SPP 1335).
900
References
[AD91] ALMUALLIM H., DIETTERICH T.: Effic ient algorithms for identi fy ing relevant features. In Canadian Con! on Artificial In telligence (199 1), pp. 38-45. 3
[AHKOI] AGGARWAL C ., HINNEBURG A. , KE IM D.: On the surprising behavior of distance metrics in high dimensional space. Database Theory (200 I), 420-434. 2, 3
[BG97] BORG 1. , GROENEN P.: Modern multidimensional scaling: Theory and applications . Springer, 1997. 3
[BGRS99] BEYER K., GOLDSTE IN J ., RAMAKRISHNAN R. , SHAFT U.: When is nearest neighbor meaningful? Database Theory (1999), 2 17-235. 3
[BKSS07] BUSTOS B., KEIM D. , SAUPE D. , SCHRECK T. : Content-based 3D object retrieval. IEEE Computer Graphics and Applications 27 (4) (2007), 22-27. 3
[BMGR04] BENDER A., M USSA H. , GLEN R. , REILING S.: Molecular similarity searching using atom environments, in formation-based feature se lection, and a naive bayesian classifier. J. Chem. In! Comput. Sei 44, I (2004), 170- 178. 3
[BST04] BÖCKER A., SCHNEIDER G., TECKENTRU P A.: Status ofHTS data mining approaches. QSA R & combinatorial science 23,4 (2004), 207-2 13. 9
[CLKPIO] CHOO J ., LEE H. , KIHM J ., PARK H.: iVisClass ifier: An Interact ive Visua l Analyti cs System for Class ification Based on Supervised Dimension Reduction. In IEEE SYlilposium on Visual Analytics Science and Technology (20 10), pp. 27-34.4
[DB04] DY J., BRODLEY C. : Feature selection for unsupervised learning. J. of Mach. Learning Research 5 (2004), 845-889. 2,3
rDCSL021 DASH M., CHOI K., SCHEUERMANN P. , L1u H.: Feature se lection for cl ustering-a filter so luti on. In IEEE Int. Con! on Data Mining (2002), p. 11 5. 3
rECOI] EW ING R . M ., CHERRY J. M.: Visualization ofexpression clusters using Sam mons non-linear mapping. Bioinformatics 17,7 (200 1), 658-659. 3
[Fuk90] FUKUNAGA K.: Introductionto statisticalpallern recognition. Academic Pr, 1990. 4
rHim98] HIMB ERG 1.: Enhanc ing SOM-based data visualization by linking different data projections. In Im. Symp. on Intelligent Data Engineering and Learning ( 1998), Eureka, p. 427. 8
rHimOO] HIMBERG J.: A SOM based cluster visuali zation and its application for false coloring. In IEEE Int. Joint Con! on Neural Networb' (2000) , vo!. 3, p. 3587. 8
[HK95] HALL L., K I ER L. : Electrotopological state indices fo r atom types: A novel combination of electronic, topologieal, and valence state in format ion. J. ofChemicallnformation and COIllputer Sciences 35, 6 ( 1995), 1039- 1045. 9
rIMI ' IO] I NGRA M S., M UNZNER T. , IRVI NE V., TORY M ., BERGNER S. , MÖLL ER T. : DimStiller: Workflows for dimensional analysis and reduction. In IEEE COllference on Visual Allalytics Software and Technologie.l· (20 I 0), pp. 3-10. 2, 4
[JJ091 JOHANSSON S. , JOHANSSON 1.: Interactive dimensional ity reduetion lhrough user-defi ned eOlllbinations of qualily metries. Visualization and Computer Graphics, IEEE Transactions Oll 15, 6 (2009), 993-1000. 4
[JoI02] JOLLIFFE 1.: Principal cOlllponent analysis. Springer, 2002. 3
[Keo06] KEOGH E.: A decade ofprogress in indexing and mining large time series databases. In Illt. Con! on Very Large Data Bases (2006). Tutoria!. 3
rKJ97] KOHAV I R., JOI-IN G.: Wrappers for feature subset selee-tion. Arti/icial intellifience Y7, 1-2 (1997) , 273-324. 3
[KK98] KASKI S., KOI-IONEN T.: Visual Explorations in FilIance. Springer, 1998, eh. Tips for processing and color-coding of Self-Organizing Maps, pp. 195-202. 8
[KLTHIO] KAPOOR A. , LEE B., TAN D., HORVITZ E .: Interacti ve Optimizatiun f'ur Stccring Machinc Class ilication. In Confe rellce Oll Human Factors in Computing Systems (20 I 0) . 3
[KohOI] KOHO NEN T.: Selj-Organizing Maps. Springer, 2001. 3
[Kon94] KONONENKO 1.: Estimating attributes: Analysis and extensions of RELIEF. In Machine Leaming: ECML-94 (1994) , Springer, pp. 171 - 182. 3
rKR92j KIRA K., RE NDE LL L. : The feature selection problem: Traditional methods and a new algorithm. In National Con! on Artificial fntelligence (1992), pp. 129- 129 . 3
[KVK99] KASKI S., VENN A 1., KOHONEN T.: Coloring that reveals high-dimensional structures in data. In Int. Con! on Neural Information PlVcessing (1999), vo!. 2, pp. 729 - 734. 8
[KVKOO] KASKI S., VENNA J. , KOHONEN T.: Coloring that reveals cluster structures in multivariate data. Australian J. of Intelligellt lnformation PlVcessing Systems 6, 2 (2000) , 82-88. 8
[MM051 MI ERSWA 1. , MORIK K.: Automatic fea ture extraction for classify ing audio data. Machine Learning 58, 2-3 (2005), 658-659. 3
[NJWOI] No A. Y. , JORDAN M. 1. , W EISS Y.: On spectral clustering: Analys is and an algorithm. In AdvlInces in NeurolInformation Processing Systems (200 I), MIT Press, pp. 849-856. 3
[SNLH09] SIPS M., NEU ßERT B. , LEWIS J ., HANRAI-IAN P.: Selecting good views of high-dimensional data using class cunsistency. In Computer Graphics Forum (2009) , vo!. 28, pp. 831-838. 3
[SvLB IO] SCHRECK T. , VON LANDESBERG ER T., BREMM S.: Techniques for precision-based visual analysis of projected data. Information Visualization 9, 3 (2010),181 - 193. 4,5
rTAE*09] TATU A., ALBUQUERQUE G. , E ISEMANN M., SCHNEIDEWIND J ., TH EISEL H. , M AGNOR M. , KEIM D.: Combining automated analysis and visualization techniques for effective exploration of high-dimensional data. In IEEE Symp. on Visual Analytics Seience lind Techllology (2009), pp. 59-66. 4
rTLKT09] TALBOT 1. , LEE B. , KAPOOR A. , TAN D.: EnsembleMatrix: interactive visuali zation to support machine 1earn ing with multiple class ifiers . In/nt. Conf. on Human Factors in COI1lputing Systems (2009), pp. 1283- 1292. 3
rVAOOl VESANTO J., ALHONIEMI E.: Clustering of the selforganizing map. Trans. on Neural Networks 11 , 3 (2000) , 586-600. 8
[Ves99] VESANTO J .: SOM-based data visua li zation methods. Intelligent Data Analysis 3, 2 (1999), 111 - 126.3
rvLGS091 VON LA NDESBE RGER T. , GÖRNER M ., SCHRECK T.: Visual analysis of graphs with multiple connected components. In IEEE Symp. on Visual Analytics Seience (md Techllology (2009), pp. 155- 162. 3
rWAG06] WILKIN SON L., ANAND A., GROSSMAN R.: Highdimensional visual analytics: Interactive exploration guided by pairwise views of point distributions. Trans. on Visualization and Computer Graphics 12 (November 2006), 1363-1372. 3