Embed Size (px)
Citation preview

Assisted reproductive technology in Australia and New Zealand 2011
UNSW Medicine National Perinatal Epidemiology and Statistics UnitNever Stand Still

The University of New South Wales Australia
Assisted reproductive technology in Australia and New Zealand 2011
Alan Macaldowie Yueping A Wang
Georgina M Chambers Elizabeth A Sullivan
August 2013

The National Perinatal Epidemiology and Statistics Unit (NPESU) aims to provide national information and statistics in reproductive and perinatal health.
© Copyright UNSW 2013
Enquiries relating to copyright should be addressed to the National Perinatal Epidemiology and Statistics Unit, Level 2 McNevin Dickson Building, Gate 6, Avoca Street, Randwick Hospitals Campus Randwick, NSW 2031, Australia
This publication used to be part of the assisted reproduction technology series of Australian Institute of Health and Welfare. A complete list of the series is available from the NPESU website <http://npesu.unsw.edu.au/>.
ISBN 978-0-7334-3349-8
Suggested citation Macaldowie A, Wang YA, Chambers GM & Sullivan EA 2013. Assisted reproductive technology in Australia and New Zealand 2011. Sydney: National Perinatal Epidemiology and Statistics Unit, the University of New South Wales.
Any enquiries about or comments on this publication should be directed to: National Perinatal Epidemiology and Statistics Unit Level 2 McNevin Dickson Building Gate 6 Avoca Street Randwick Hospitals Campus Randwick NSW 2031 Australia T +61 (2) 93821014 F +61 (2) 93821025 E [email protected] Published by the University of New South Wales Cover design and printing by Print Post Plus (P3), R53772 http://www.p3.unsw.edu.au Cover image courtesy of Katrina Christ Photographer
Please note that there is the potential for minor revisions of data in this report. Please check the online version at <http://npesu.unsw.edu.au/> for any amendments.
iii
Contents Acknowledgments.............................................................................................................................. iv
Abbreviations and symbols ............................................................................................................... v
Summary .............................................................................................................................................. vi
1 Introduction .................................................................................................................................... 1
2 Overview of ART treatment in 2011 .......................................................................................... 4
3 Autologous and donation/recipient cycles in 2011 ................................................................. 5
3.1 Overview of autologous and recipient cycles ..................................................................... 6
3.2 Autologous fresh cycles ....................................................................................................... 10
3.3 Autologous thaw cycles ....................................................................................................... 18
3.4 Donation and recipient cycles ............................................................................................. 27
4 Pregnancy and birth outcomes following autologous and recipient embryo transfer cycles in 2011 ................................................................................................................................ 34
4.1 Clinical pregnancies .............................................................................................................. 34
4.2 Deliveries ................................................................................................................................ 36
4.3 Perinatal outcomes of babies ............................................................................................... 39
5 Other cycle types, procedures and treatment complications in 2011................................. 44
5.1 Gestational surrogacy cycles ............................................................................................... 44
5.2 GIFT cycles ............................................................................................................................. 44
5.3 Assisted hatching .................................................................................................................. 44
5.4 Preimplantation genetic diagnosis ..................................................................................... 45
5.5 Ovarian hyperstimulation syndrome ................................................................................. 45
6 Donor sperm insemination cycles in 2011 .............................................................................. 46
7 Trends in ART treatment and outcomes: 2007–2011 ............................................................ 48
8 Women undertaking autologous treatment in 2011............................................................. 51
9 Cumulative success rates for women undertaking autologous treatment 2009–2011 .... 54
Appendix A: Contributing fertility clinics .................................................................................... 58
Appendix B: Data used in this report ............................................................................................. 61
Appendix C: ANZARD2.0 data items ............................................................................................. 63
Glossary ................................................................................................................................................ 67
References ............................................................................................................................................ 70
List of tables ........................................................................................................................................ 71
List of figures ...................................................................................................................................... 74

iv
Acknowledgments The Australian and New Zealand Assisted Reproduction Database (ANZARD), funded by the Fertility Society of Australia (FSA), is a collaborative effort between the National Perinatal Epidemiology and Statistics Unit (NPESU) and fertility centres in Australia and New Zealand. The NPESU is a formally affiliated unit of the University of New South Wales (UNSW) within the School of Women’s and Children’s Health.
A number of organisations and people make the publication of this annual report possible. Firstly, we would like to thank all staff in the fertility centres for their efforts in compiling the data and providing additional information when requested. A complete list of all contributing fertility clinics can be found in Appendix A. We also thank Dr Clare Boothroyd, Associate Professor Mark Bowman, Professor Michael Chapman, Dr Lyndon Hale, Professor Robert Norman, Professor Cindy Farquhar and Mr Keith Harrison for peer reviewing the report. We would like to acknowledge the support of the NPESU by the UNSW. We also acknowledge the financial support of the FSA for the compilation of ANZARD and the preparation of this report.
The NPESU produced this report independently with no influence from the funding body.

v
Abbreviations and symbols ANZARD Australian and New Zealand Assisted Reproduction Database
ART assisted reproductive technology
DET double embryo transfer
DI donor sperm insemination
FSA Fertility Society of Australia
FSH follicle stimulating hormone
GIFT gamete intrafallopian transfer
ICSI intracytoplasmic sperm injection
IVF in vitro fertilisation
NPESU National Perinatal Epidemiology and Statistics Unit
OHSS ovarian hyperstimulation syndrome
OPU oocyte pick-up
PGD preimplantation genetic diagnosis
SET single embryo transfer
SLK statistical linkage key
UNSW University of New South Wales
WHO World Health Organization
Symbols – not applicable

vi
Summary Use of assisted reproductive technology treatment There were 66,347 assisted reproductive technology (ART) treatment cycles performed in Australia and New Zealand in 2011 (61,158 and 5,189 respectively), representing an increase of 8.3% for Australia and a decrease of 1.8% for New Zealand on 2010. Women used their own oocytes or embryos (autologous) in 95.1% of treatments, and 33.7% of all cycles used frozen/thawed embryos.
There were 34,490 women who undertook autologous ART treatment in Australia and New Zealand in 2011. On average, 1.9 cycles per woman were undertaken in Australia compared with 1.4 cycles per woman in New Zealand.
Women’s age The average age of women undergoing autologous cycles was 36, and ranged from 14 to 54. In contrast, the average age of women undergoing ART treatment using donor oocytes or embryos was approximately five years older (40.8, ranging from 20 to 54). The proportion of autologous cycles undertaken by women aged 40 or older continued to increase, with 26.5% in 2011 compared with 22.8% in 2007.
Treatment outcomes and number of babies
Of the 66,347 initiated cycles, 23.1% resulted in a clinical pregnancy, and 17.5% in a live delivery (the birth of at least one liveborn baby). There were 12,443 liveborn babies following ART treatments in 2011 (11,148 in Australia and 1,295 in New Zealand). Almost three-quarters of the liveborn babies (76.2%) were full-term singletons of normal birthweight.
There was a higher live delivery rate in younger women. For women aged under 30, the live delivery rate was 26.6% for autologous fresh cycles and 22.9% for autologous thaw cycles. For women aged over 44, the live delivery rate was 1.2% and 5.0% for autologous fresh and thaw cycles respectively.
Multiple births A continuing trend in ART treatment in Australia and New Zealand has been the reduction in the rate of multiple deliveries, with a decrease from 10.0% in 2007 to 6.9% (7.1% for Australia and 5.8% for New Zealand) in 2011. This was achieved by clinicians and patients shifting to single embryo transfer, with the proportion increasing from 63.7% in 2007 to 73.2% in 2011. Importantly, this decrease in the multiple delivery rate was achieved while clinical pregnancy rates remained stable at about 23.0% per initiated cycle.
Cumulative success rates
Since 2009, the Australian and New Zealand Assisted Reproduction Database has included data items that make it possible to follow a woman from her first fresh ART treatment cycle through subsequent fresh and thaw cycles. For women who undertook their first autologous fresh cycle between 2009 and 2011, the cumulative live delivery rate was 21.1% after the first cycle, increasing to 31.1% after two cycles, 36.0% after three cycles, 38.6% after four cycles, and 40.0% after five cycles. The cumulative live delivery rate did not increase markedly with additional treatments after five cycles.
Assisted reproductive technology in Australia and New Zealand 2011 1
1 Introduction It is estimated that about 9% of couples at any given time experience infertility, representing the source of much personal suffering to millions around the world (Boivin et al. 2007). The medical definition of infertility is usually defined as the failure to achieve a clinical pregnancy after 12 or more months of regular unprotected sexual intercourse (Zegers-Hochschild et al. 2009). Infertility is increasingly being overcome through advancements in fertility treatment, in particular assisted reproductive technologies (ARTs). ARTs have evolved over the last three decades into a suite of mainstream medical interventions that have resulted in the birth of more than 5 million children worldwide (ICMART 2012). The most recent national estimates indicate that 4.1% of all women who gave birth in Australia in 2010 received some form of ART treatment (Li et al. 2012).
The purpose of this annual report is to inform clinicians, researchers, government and the community about ART treatment and the resulting pregnancy outcomes; to provide an ongoing mechanism for monitoring of ART treatment practices, success rates and perinatal outcomes; and to provide information for national and international comparisons.
The Fertility Society of Australia (FSA), in collaboration with the University of New South Wales (UNSW), is committed to providing informative annual statistics on ART treatments and is pleased to present the 2011 annual report on the use of ART in Australia and New Zealand.
Treatments covered in this report ART is a group of procedures that involve the in vitro (outside of body) handling of human oocytes (eggs) and sperm or embryos for the purposes of establishing a pregnancy (Zegers-Hochschild et al. 2009). A typical fresh in vitro fertilisation (IVF) cycle, involves the following five steps:
1. Controlled ovarian hyperstimulation during which an ovarian stimulation regimen, typically follicle stimulating hormone (FSH) is administered to a woman over a number of days to induce the maturation of multiple oocytes.
2. Oocyte pick-up (OPU) where mature oocytes are aspirated from ovarian follicles. 3. Fertilisation of the collected oocytes by incubating them with sperm (from the woman’s
partner or donor) over a few hours in the laboratory. 4. Embryo maturation during which a fertilised oocyte is cultured for 2–3 days to form a
cleavage embryo (6–8 cells) or 5–6 days to create a blastocyst (60–100 cells). 5. Transfer of one or more fresh embryos into the uterus in order for a pregnancy to occur. Treatment may be discontinued at any stage during a treatment cycle due to a number of reasons including inadequate or excessive ovarian stimulation, failed fertilisation, inadequate embryo growth or patient choice.
Over the last three decades, ART has evolved to encompass complex ovarian hyperstimulation protocols and numerous variations to the typical fresh IVF treatment cycle described above. Some of these variations include:
• intracytoplasmic sperm injection (ICSI), when a single sperm is injected directly into the oocyte
2 Assisted reproductive technology in Australia and New Zealand 2011
• assisted hatching, when the outer layer of the embryo, the zona pellucida, is either thinned or perforated in the laboratory to aid ‘hatching’ of the embryo
• gamete intrafallopian transfer (GIFT), when mature oocytes and sperm are placed directly into a woman’s fallopian tubes so that fertilisation may take place in vivo (inside the body). While once popular, this procedure now accounts for only a very small percentage of ART cycles
• preimplantation genetic diagnosis (PGD), when one or more cells are removed from the embryo and analysed for chromosomal disorders or genetic diseases before embryo transfer
• donor/recipient arrangements, when donor oocytes from a woman are used to create embryos for transfer to another (recipient) woman
• cryopreservation and storage of embryos that are not transferred in the initial fresh treatment cycle. Once thawed or warmed, the embryos can be transferred in subsequent treatment cycles. Cryopreservation techniques include both the traditional slow freezing method and a newer technique called ‘vitrification’. Vitrification can be used to cryopreserve gametes and embryos, and uses an ultra-rapid temperature change with exposure to higher concentrations of cryoprotectants
• surrogacy arrangements, where a woman, known as the ‘gestational carrier’, agrees to carry a child for another person or couple, known as the ‘intended parent(s)’, with the intention that the child will be raised by the intended parent(s).
Along with ART, a number of other fertility treatments are undertaken in Australia and New Zealand. Artificial insemination is one such treatment by which sperm are placed into the female genital tract (for example, intracervical or intrauterine), and can be used with controlled ovarian hyperstimulation or in natural cycles. Artificial insemination can be undertaken using a partner’s sperm, or donated sperm, also known as ‘donor sperm insemination’ (DI).
Data used in this report This report provides information on ART and DI treatments and the resulting pregnancy and birth outcomes. Also included is an analysis of trends in ART treatments and outcomes in the five years from 2007 to 2011.
As a joint initiative of the NPESU at UNSW and FSA, the Australian and New Zealand Assisted Reproduction Database (ANZARD) was upgraded in 2009 to accommodate new ART treatment types and to transform ANZARD from a cycle-based data collection to a woman-based data collection (ANZARD2.0). A more detailed description of ANZARD2.0 can be found in Appendices B and C. The expanded treatment information in the collection includes data fields for oocyte/embryo vitrification, and duration of oocytes and embryos in storage. The upgrade to a woman-based data collection was achieved by introducing a statistical linkage key (SLK) that links successive treatment cycles undertaken by one woman. The SLK is a combination of the first two letters of a woman’s first name, the first two letters of her surname and her date of birth. The SLK enables the number of women undergoing treatment across time to be reported. For the first time, the 2011 annual report presents cumulative success rates for women who started their first autologous fresh cycle during 2009 to 2011.
The 2011 data presented in this report were supplied by all 37 fertility centres (72 fertility clinics in Australia and 7 fertility clinics in New Zealand), and compiled into ANZARD2.0.
Assisted reproductive technology in Australia and New Zealand 2011 3
Note: The 2007 and 2008 ANZARD data have been updated to correct the previously reported misclassification error of cleavage and blastocyst transfer. In this report, the numbers and percentages of cleavage embryo and blastocyst transfer cycles for 2007 and 2008 are different from previous annual reports.
Structure of this report This report has nine chapters, including this introductory chapter (Chapter 1).
Chapter 2—‘Overview of ART treatment in 2011’, provides an outline of the numbers and outcomes of all ART treatments undertaken in Australia and New Zealand.
Chapter 3—‘Autologous and donation/recipient cycles in 2011’, presents data on the number of cycles, cycle types, and the outcomes of treatment in terms of discontinued treatment, clinical pregnancies and deliveries.
Chapter 4—‘ Pregnancy and birth outcomes following autologous and recipient embryo transfer cycles in 2011’, presents data on the outcomes of clinical pregnancies and deliveries following autologous and recipient cycles including a description of perinatal outcomes.
Chapter 5—‘Other cycle types, procedures and treatment complications in 2011’, includes information on cycles, procedures and complications that do not fit into the chapters already described.
Chapter 6—‘Donor sperm insemination cycles in 2011’, presents data on DI cycles and their outcomes, including a description of pregnancy and perinatal outcomes.
Chapter 7—‘Trends in ART treatment and outcomes: 2007–2011’, presents trends in ART treatments during the last five years of data collection in Australia and New Zealand.
Chapter 8—‘Women undertaking autologous treatment in 2011’, presents information on the number of women undergoing ART treatment in 2011.
Chapter 9—‘Cumulative success rates for women undertaking autologous treatment 2009-2011’, presents information on the pregnancies and live deliveries per women for a cohort of women who undertook their first autologous fresh cycle during 2009 to 2011.
Appendices—Appendix A lists the contributing fertility clinics. Appendix B provides an overview of the ANZARD2.0 data collection that was used to prepare this report. Appendix C provides a detailed list of the data items in the collection.

4 Assisted reproductive technology in Australia and New Zealand 2011
2 Overview of ART treatment in 2011 There were 66,347 ART treatment cycles reported from Australian and New Zealand clinics in 2011 (Table 1). Of these, 92.2% (61,158) were from Australian clinics and 7.8% (5,189) were from New Zealand clinics. The number of ART treatment cycles in 2011 increased by 7.4% from the 61,774 cycles in 2010, with an 8.3% increase in Australia and 1.8% decrease in New Zealand. In 2011, the number of ART treatment cycles represented 12.9 cycles per 1,000 women of reproductive age (15–44 years) in Australia, compared with 5.7 cycles per 1,000 women of reproductive age in New Zealand (Australian Bureau of Statistics 2013; Statistics New Zealand 2012).
More than 95% of cycles in 2011 were autologous cycles (where a woman intended to use, or used her own oocytes or embryos). Of the 63,064 autologous cycles, 40,696 (64.5%) were fresh cycles and 22,368 (35.5%) were frozen/thaw cycles. Other treatment cycles accounted for small proportions: 2.7% were oocyte recipient cycles, 0.5% were embryo recipient cycles, 1.4% were oocyte donation cycles and 0.3% were surrogacy arrangement cycles (Table 1).
Of all ART treatments in 2011, 23.1% (15,319) resulted in a clinical pregnancy and 17.5% (11,640) in a live delivery (Table 1). Of these clinical pregnancies, 13,790 (90%) were from Australian clinics and 1,529 (10%) from New Zealand clinics. There were 12,623 babies born (including 12,443 liveborn) following ART treatment in 2011. Of these, 11,314 (89.6%) were from Australian clinics and 1,309 (10.4%) from New Zealand clinics. Of the liveborn babies, 76.2% (9,477) were singletons at term (gestational age of 37–41 weeks) with normal birthweight (≥ 2,500 grams). The multiple delivery rate was 6.9%.
Table 1: Number of initiated ART treatment cycles by treatment type, Australia and New Zealand, 2011
Number of initiated ART
cycles
Per cent of treatment
types
Number of clinical
pregnancies
Number of live
deliveries
Number of
liveborn babies
Number of liveborn
singletons at term
with normal
birthweight
Autologous 63,064 95.1 14,747 11,219 11,992 9,162
Fresh 40,696 61.3 9,100 6,928 7,417 5,606
Thaw 22,368 33.7 5,647 4,291 4,575 3,556
Oocyte recipient 1,776 2.7 452 336 363 247
Embryo recipient 358 0.5 85 63 65 52
Oocyte donation 961 1.4 – – – –
GIFT(a) 11 0.0 1 1 1 1
Surrogacy arrangement cycles 177 0.3 34 21 22 15
Intended parent cycles(b) 46 0.1 – – – –
Gestational carrier cycles(c) 131 0.2 34 21 22 15
Total 66,347 100.0 15,319 11,640 12,443 9,477
(a) GIFT cycles were classified separately from autologous cycles. (b) A cycle undertaken by a person or couple who intends to raise a child that will be, or is intended to be, carried by a gestational carrier
during pregnancy. (c) A cycle undertaken by a woman who carries, or intends to carry, a pregnancy on behalf of the intended parents with an agreement that the
child will be raised by the intended parent(s).

Assisted reproductive technology in Australia and New Zealand 2011 5
3 Autologous and donation/recipient cycles in 2011
This chapter presents data on initiated autologous cycles, oocyte donation cycles and oocyte/embryo recipient cycles. Surrogacy cycles and GIFT cycles are presented separately in Chapter 5.
An autologous cycle is defined as an ART treatment cycle in which a woman intends to use, or uses her own oocytes.
A donation cycle is defined as an ART treatment cycle in which a woman intends to donate, or donates her oocytes to others. A donation cycle may result in the donation of either oocytes or embryos to a recipient woman. The use of donor sperm does not influence the donor status of the cycle.
A recipient cycle is defined as an ART treatment cycle in which a woman receives oocytes or embryos from another woman.
Autologous and donor/recipient cycles can involve the use of, or intended use of, either fresh or frozen/thawed embryos.
6 Assisted reproductive technology in Australia and New Zealand 2011
3.1 Overview of autologous and recipient cycles
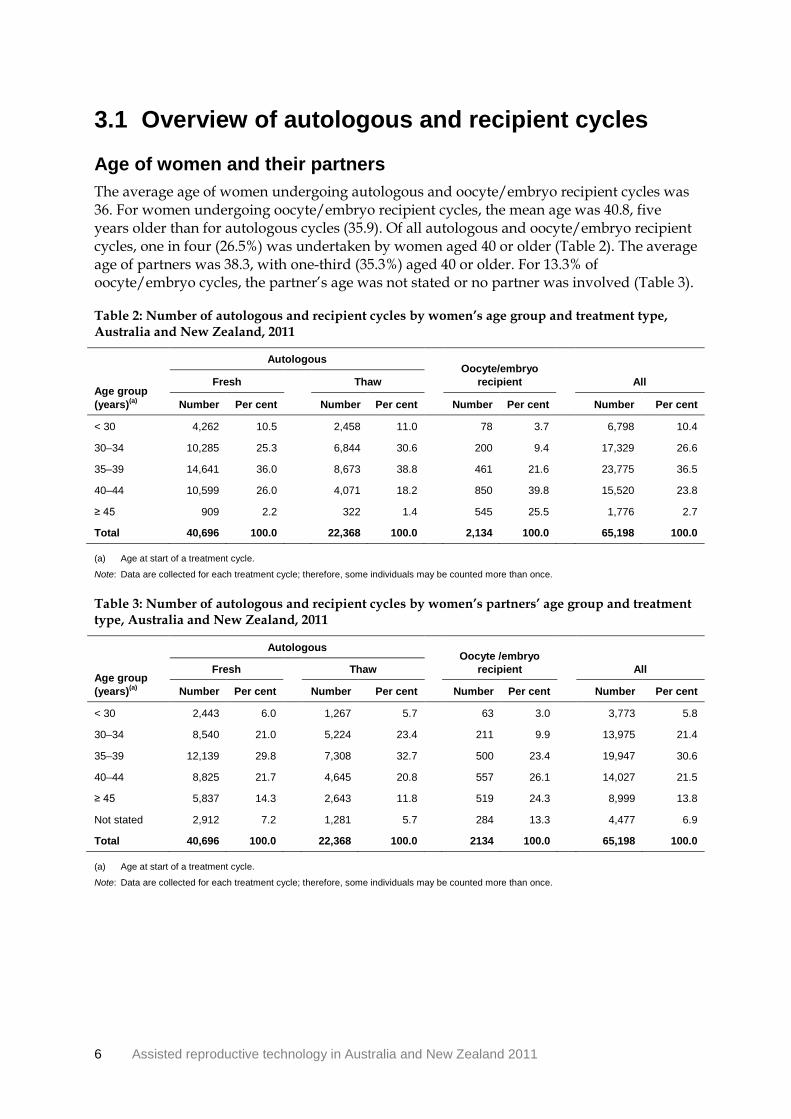
Age of women and their partners The average age of women undergoing autologous and oocyte/embryo recipient cycles was 36. For women undergoing oocyte/embryo recipient cycles, the mean age was 40.8, five years older than for autologous cycles (35.9). Of all autologous and oocyte/embryo recipient cycles, one in four (26.5%) was undertaken by women aged 40 or older (Table 2). The average age of partners was 38.3, with one-third (35.3%) aged 40 or older. For 13.3% of oocyte/embryo cycles, the partner’s age was not stated or no partner was involved (Table 3).
Table 2: Number of autologous and recipient cycles by women’s age group and treatment type, Australia and New Zealand, 2011
Age group (years)(a)
Autologous Oocyte/embryo
recipient
All Fresh Thaw
Number Per cent Number Per cent Number Per cent Number Per cent
< 30 4,262 10.5
2,458 11.0
78 3.7
6,798 10.4
30–34 10,285 25.3
6,844 30.6
200 9.4
17,329 26.6
35–39 14,641 36.0
8,673 38.8
461 21.6
23,775 36.5
40–44 10,599 26.0
4,071 18.2
850 39.8
15,520 23.8
≥ 45 909 2.2
322 1.4
545 25.5
1,776 2.7
Total 40,696 100.0
22,368 100.0
2,134 100.0 65,198 100.0
(a) Age at start of a treatment cycle.
Note: Data are collected for each treatment cycle; therefore, some individuals may be counted more than once.
Table 3: Number of autologous and recipient cycles by women’s partners’ age group and treatment type, Australia and New Zealand, 2011
Age group (years)(a)
Autologous Oocyte /embryo
recipient
All Fresh Thaw
Number Per cent Number Per cent Number Per cent Number Per cent
< 30 2,443 6.0
1,267 5.7
63 3.0
3,773 5.8
30–34 8,540 21.0
5,224 23.4
211 9.9
13,975 21.4
35–39 12,139 29.8
7,308 32.7
500 23.4
19,947 30.6
40–44 8,825 21.7
4,645 20.8
557 26.1
14,027 21.5
≥ 45 5,837 14.3
2,643 11.8
519 24.3
8,999 13.8
Not stated 2,912 7.2
1,281 5.7
284 13.3
4,477 6.9
Total 40,696 100.0 22,368 100.0 2134 100.0 65,198 100.0
(a) Age at start of a treatment cycle.
Note: Data are collected for each treatment cycle; therefore, some individuals may be counted more than once.

Assisted reproductive technology in Australia and New Zealand 2011 7
Parity Parity is the number of previous pregnancies of 20 weeks or more gestation experienced by a woman. A woman who has had no previous pregnancies of 20 or more weeks gestation is called ‘nulliparous’. A woman who has had at least one previous pregnancy of 20 weeks or more gestation is described as ‘parous’.
Of the 65,198 initiated autologous and recipient cycles undertaken in 2011, 64.1% were undertaken by nulliparous women. Of autologous cycles (fresh and thaw), 63.9% were undertaken by nulliparous women, compared with 69.3% for oocyte/embryo recipient cycles (Table 4).
Table 4: Number of autologous and recipient cycles by parity and treatment type, Australia and New Zealand, 2011
Parity
Autologous Oocyte/embryo
recipient
All Fresh Thaw
Number Per cent Number Per cent Number Per cent Number Per cent
Nulliparous 27,916 68.6
12,369 55.3
1,478 69.3
41,763 64.1
Parous 8,190 20.1
7,130 31.9
512 24.0
15,832 24.3
Not stated 4,590 11.3
2,869 12.8
144 6.7
7,603 11.7
Total 40,696 100.0 22,368 100.0 2,134 100.0 65,198 100.0
Note: Data are collected for each treatment cycle; therefore, some individuals may be counted more than once.
Cause of infertility Causes of infertility may be known to relate to either the woman or her male partner, or both, or may be unexplained. The reported causes of infertility are based on clinical diagnosis by the treating clinician. However, the diagnostic definitions may vary among fertility centres.
Of the 65,198 initiated autologous and recipient cycles, 22.5% reported male infertility factors as the only cause of infertility; 28.5% reported only female infertility factors; 14.3% reported combined male–female factors; 22.7% reported unexplained infertility; and 11.7% were not stated.
8 Assisted reproductive technology in Australia and New Zealand 2011
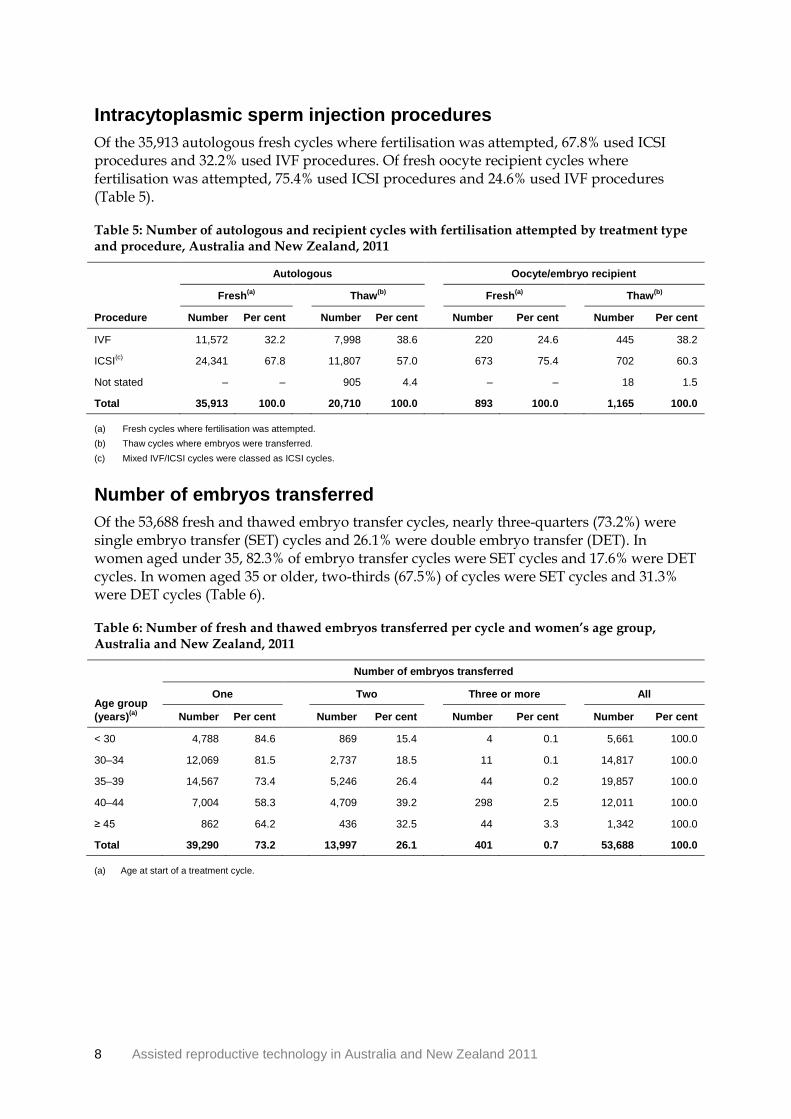
Intracytoplasmic sperm injection procedures Of the 35,913 autologous fresh cycles where fertilisation was attempted, 67.8% used ICSI procedures and 32.2% used IVF procedures. Of fresh oocyte recipient cycles where fertilisation was attempted, 75.4% used ICSI procedures and 24.6% used IVF procedures (Table 5).
Table 5: Number of autologous and recipient cycles with fertilisation attempted by treatment type and procedure, Australia and New Zealand, 2011
Procedure
Autologous
Oocyte/embryo recipient
Fresh(a)
Thaw(b)
Fresh(a)
Thaw(b)
Number Per cent Number Per cent Number Per cent Number Per cent
IVF 11,572 32.2
7,998 38.6
220 24.6
445 38.2
ICSI(c) 24,341 67.8
11,807 57.0
673 75.4
702 60.3
Not stated – –
905 4.4
– –
18 1.5
Total 35,913 100.0 20,710 100.0 893 100.0 1,165 100.0
(a) Fresh cycles where fertilisation was attempted. (b) Thaw cycles where embryos were transferred. (c) Mixed IVF/ICSI cycles were classed as ICSI cycles.
Number of embryos transferred Of the 53,688 fresh and thawed embryo transfer cycles, nearly three-quarters (73.2%) were single embryo transfer (SET) cycles and 26.1% were double embryo transfer (DET). In women aged under 35, 82.3% of embryo transfer cycles were SET cycles and 17.6% were DET cycles. In women aged 35 or older, two-thirds (67.5%) of cycles were SET cycles and 31.3% were DET cycles (Table 6).
Table 6: Number of fresh and thawed embryos transferred per cycle and women’s age group, Australia and New Zealand, 2011
Age group (years)(a)
Number of embryos transferred
One
Two
Three or more
All
Number Per cent Number Per cent Number Per cent Number Per cent
< 30 4,788 84.6
869 15.4
4 0.1
5,661 100.0
30–34 12,069 81.5
2,737 18.5
11 0.1
14,817 100.0
35–39 14,567 73.4
5,246 26.4
44 0.2
19,857 100.0
40–44 7,004 58.3
4,709 39.2
298 2.5
12,011 100.0
≥ 45 862 64.2
436 32.5
44 3.3
1,342 100.0
Total 39,290 73.2 13,997 26.1 401 0.7 53,688 100.0
(a) Age at start of a treatment cycle.

Assisted reproductive technology in Australia and New Zealand 2011 9
Stage of embryo development Of the 53,688 embryo transfer cycles, 57.7% involved the transfer of day 5–6 embryos (blastocysts) with the remainder day 2–3 embryos (cleavage embryos). Of autologous cycles, blastocyst transfers made up 64.1% of thaw cycles compared with 53.5% of fresh cycles (Table 7).
Table 7: Number of embryo transfer cycles by treatment type and stage of embryo development, Australia and New Zealand, 2011
Type and procedure
Autologous
Oocyte/embryo recipient
Fresh
Thaw
Fresh
Thaw
Number Per cent Number Per cent Number Per cent Number Per cent
Cleavage embryo 14,448 46.5
7,433 35.9
345 45.4
497 42.7
Blastocyst 16,605 53.5
13,277 64.1
415 54.6
668 57.3
Total 31,053 100.0 20,710 100.0 760 100.0 1,165 100.0
Transfer of cryopreserved embryos Embryos created in a fresh cycle can be cryopreserved by either slow freezing or ultra-rapid (vitrification) methods. Slow frozen and vitrified embryos can be thawed/warmed and then transferred in subsequent cycles.
Of the 21,875 frozen/thawed embryo transfer cycles, almost half (49.2%) involved the transfer of vitrified embryos. Nearly three-quarters (73.1%) of frozen/thawed blastocyst transfer cycles had vitrified blastocysts transferred. By comparison, 7.2% of frozen/thawed cleavage embryo transfer cycles used vitrified embryos (Table 8).
Table 8: Number of embryo transfer cycles by freezing method and stage of embryo development, Australia and New Zealand, 2011
Type and procedure
Autologous
Oocyte/embryo recipient
Cleavage embryo
Blastocyst Cleavage embryo
Blastocyst
Number Per cent Number Per cent Number Per cent Number Per cent
Slow frozen 6,904 92.9
3,511 26.4
454 91.3
241 36.1
Vitrification(a) 529 7.1
9,766 73.6
41 8.2
425 63.6
Not stated – –
– –
2 0.4
2 0.3
Total 7,433 100.0 13,277 100.0 497 100.0 668 100.0
(a) Ultra-rapid cryopreservation.
10 Assisted reproductive technology in Australia and New Zealand 2011
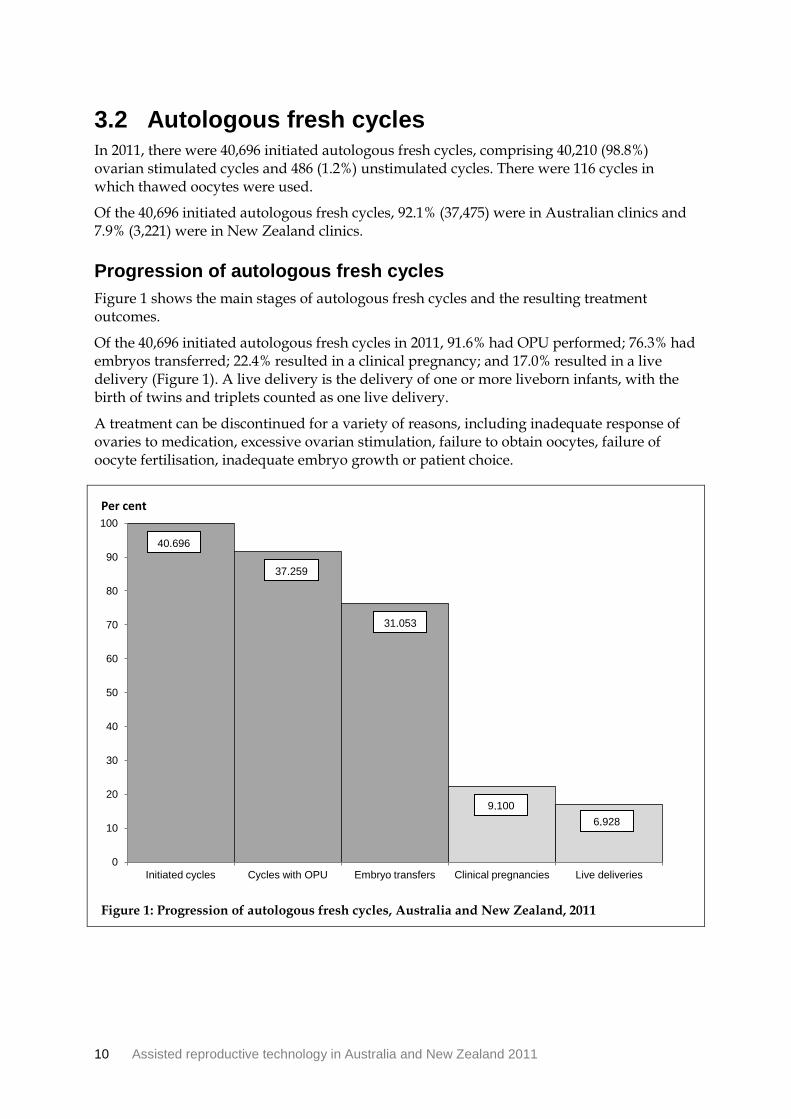
3.2 Autologous fresh cycles In 2011, there were 40,696 initiated autologous fresh cycles, comprising 40,210 (98.8%) ovarian stimulated cycles and 486 (1.2%) unstimulated cycles. There were 116 cycles in which thawed oocytes were used.
Of the 40,696 initiated autologous fresh cycles, 92.1% (37,475) were in Australian clinics and 7.9% (3,221) were in New Zealand clinics.
Progression of autologous fresh cycles Figure 1 shows the main stages of autologous fresh cycles and the resulting treatment outcomes.
Of the 40,696 initiated autologous fresh cycles in 2011, 91.6% had OPU performed; 76.3% had embryos transferred; 22.4% resulted in a clinical pregnancy; and 17.0% resulted in a live delivery (Figure 1). A live delivery is the delivery of one or more liveborn infants, with the birth of twins and triplets counted as one live delivery.
A treatment can be discontinued for a variety of reasons, including inadequate response of ovaries to medication, excessive ovarian stimulation, failure to obtain oocytes, failure of oocyte fertilisation, inadequate embryo growth or patient choice.
Figure 1: Progression of autologous fresh cycles, Australia and New Zealand, 2011
0
10
20
30
40
50
60
70
80
90
100
Initiated cycles Cycles with OPU Embryo transfers Clinical pregnancies Live deliveries
Per cent
40,696
37,259
31,053
9,100 6,928

Assisted reproductive technology in Australia and New Zealand 2011 11
Clinical pregnancies and live deliveries by women’s age Maternal age is one of the key factors associated with the outcomes of autologous fresh cycles. The highest live delivery rate per embryo transfer cycle was in women aged under 30 (34.6%). The rate declined with advancing women’s age, with a rate of 9.3% for women aged 40–44 and 1.9% for women aged 45 or older (Table 9).
Table 9: Outcomes of autologous fresh cycles by women’s age group, Australia and New Zealand, 2011
Age group (years)(a)
Stage/outcome of treatment < 30 30–34 35–39 40–44 ≥ 45 All
Initiated cycles 4,262 10,285 14,641 10,599 909 40,696
Cycles with OPU 3,934 9,577 13,508 9,448 792 37,259
Embryo transfer cycles 3,275 8,259 11,413 7,541 565 31,053
Clinical pregnancies 1,361 3,191 3,325 1,197 26 9,100
Live deliveries 1,133 2,607 2,478 699 11 6,928
Live deliveries per initiated cycle (%) 26.6 25.3 16.9 6.6 1.2 17.0
Live deliveries per embryo transfer cycle (%) 34.6 31.6 21.7 9.3 1.9 22.3
Live deliveries per clinical pregnancy (%) 83.2 81.7 74.5 58.4 42.3 76.1
(a) Age at start of a treatment cycle.
12 Assisted reproductive technology in Australia and New Zealand 2011
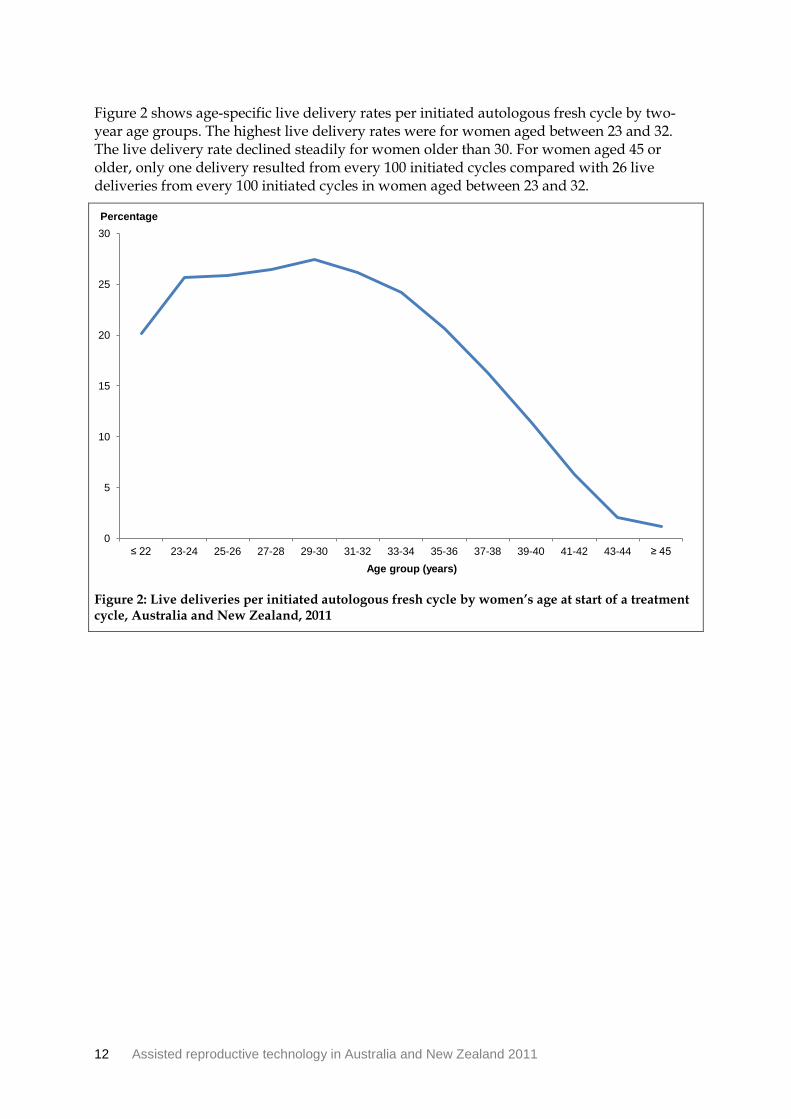
Figure 2 shows age-specific live delivery rates per initiated autologous fresh cycle by two-year age groups. The highest live delivery rates were for women aged between 23 and 32. The live delivery rate declined steadily for women older than 30. For women aged 45 or older, only one delivery resulted from every 100 initiated cycles compared with 26 live deliveries from every 100 initiated cycles in women aged between 23 and 32.
Figure 2: Live deliveries per initiated autologous fresh cycle by women’s age at start of a treatment cycle, Australia and New Zealand, 2011
0
5
10
15
20
25
30
≤ 22 23-24 25-26 27-28 29-30 31-32 33-34 35-36 37-38 39-40 41-42 43-44 ≥ 45
Percentage
Age group (years)

Assisted reproductive technology in Australia and New Zealand 2011 13
Clinical pregnancies and live deliveries by cause of infertility Cycles reported with male factor as the only cause of infertility had higher rates of clinical pregnancy and live delivery than cycles that reported female factor-only infertility (Table 10).
Table 10: Outcomes of autologous fresh cycles by cause of infertility, Australia and New Zealand, 2011
Cause of infertility Initiated cycles
(number)
Embryo transfer cycles per
initiated cycle (per cent)
Clinical pregnancies per
initiated cycle (per cent)
Live deliveries per initiated
cycle (per cent)
Male factor only 9,252 80.6 25.0 19.5
Female factor 11,639 73.2 21.6 16.3
Tubal disease only 1,678 79.2 22.3 17.1
Endometriosis only 2,327 79.8 23.7 18.1
Other female factor only 6,176 69.2 20.5 15.5
Combined female factor 1,458 72.5 21.7 16.0
Combined male—female factors 6,205 75.4 23.3 18.2
Unexplained 9,201 78.1 22.6 17.2
Not stated 4,399 73.1 17.0 11.7
Total 40,696 76.3 22.4 17.0

14 Assisted reproductive technology in Australia and New Zealand 2011
Clinical pregnancies and live deliveries by number of embryos transferred Overall, 68.7% of autologous fresh embryo transfer cycles were SET cycles, 30.3% were DET cycles and 1.0% had three or more embryos transferred. In women aged under 35, three or more embryos transferred accounted for less than 0.1% of embryo transfer cycles. This increased to 3.4% in women aged 40 or older.
Overall, the live delivery rate was 23.9% for SET cycles and 19.1% for DET cycles (Table 11). Of embryo transfer cycles in women aged under 35, the live delivery rate was slightly higher for SET cycles than DET cycles (32.9% and 30.3% respectively). Of embryo transfer cycles in women aged 35 or older, the live delivery rate was lower for SET cycles than DET cycles (21.6% and 22.1% respectively for women aged 35 to 39, and 7.5% and 10.1% respectively for women aged 40 or older).
Table 11: Outcomes of autologous fresh embryo transfer cycles by women’s age and number of embryos transferred, Australia and New Zealand, 2011
Stage/outcome of treatment
Age group (years)(a)
< 35
35–39
≥ 40
All
SET(b) DET(c) SET(b) DET(c) SET(b) DET(c) SET(b) DET(c)
Embryo transfer cycles 9,482 2,042
7,760 3,621
4,089 3,742
21,331 9,405
Clinical pregnancies 3,784 765
2,230 1,087
526 650
6,540 2,502
Live deliveries 3,120 618
1,674 800
306 378
5,100 1,796
Clinical pregnancies per embryo transfer cycle (%) 39.9 37.5
28.7 30.0
12.9 17.4
30.7 26.6
Live deliveries per embryo transfer cycle (%) 32.9 30.3 21.6 22.1 7.5 10.1 23.9 19.1
(a) Age at start of a treatment cycle. (b) SET: single embryo transfer. (c) DET: double embryo transfer.

Assisted reproductive technology in Australia and New Zealand 2011 15
Clinical pregnancies and live deliveries by stage of embryo development Overall, the rates of clinical pregnancy and live delivery were higher in blastocyst transfer cycles than in cleavage stage embryo transfer cycles regardless of a woman’s age (Table 12). The live delivery rate for blastocyst transfer cycles was 10.5 percentage points higher than for cleavage stage embryo transfer cycles.
Table 12: Outcomes of autologous fresh embryo transfer cycles by women’s age and stage of embryo development, Australia and New Zealand, 2011
Stage/outcome of treatment
Age group (years)(a)
< 35
35–39
≥ 40
All
CL(b) BL(c) CL(b) BL(c) CL(b) BL(c) CL(b) BL(c)
Embryo transfer cycles 4,479 7,055
5,279 6,134
4,690 3,416
14,448 16,605
Clinical pregnancies 1,440 3,112
1,253 2,072
585 638
3,278 5,822
Live deliveries 1,163 2,577
916 1,562
334 376
2,413 4,515
Clinical pregnancies per embryo transfer cycle (%) 32.2 44.1
23.7 33.8
12.5 18.7
22.7 35.1
Live deliveries per embryo transfer cycle (%) 26.0 36.5 17.4 25.5 7.1 11.0 16.7 27.2
(a) Age at start of a treatment cycle. (b) CL: cleavage embryo. (c) BL: blastocyst.

16 Assisted reproductive technology in Australia and New Zealand 2011
Live deliveries among fertility centres The live delivery rate per initiated autologous fresh cycle varied among the 35 fertility centres that performed at least 30 autologous fresh treatment cycles in 2011. This variation is measured using quartiles that rank a centre’s live delivery rate within the top and bottom 25% or the middle 50% of centres. There were eight or nine centres in each quartile.
The live delivery rate per initiated autologous fresh cycle ranged from 3.6% to 25.9% among fertility centres. The middle 50% of fertility centres (second and third quartiles) had live delivery rates between 14.5% and 20.5% (Table 13).
These data should be interpreted with caution because of the small number of women who underwent autologous fresh treatments in some centres coupled with potential variation in patient characteristics that may influence the live delivery rate of an individual centre.
Table 13: Live delivery rate of autologous fresh cycles by women’s age group among fertility centres, Australia and New Zealand, 2011
Age group (years)(a)
Live deliveries per initiated autologous fresh cycle (per cent)
Overall First quartile Second quartile Third quartile Fourth quartile
< 35 25.7% 29.7–36.8 24.0–29.6 19.7–23.9 4.8–19.6
35–39 16.9% 21.6–25.7 17.2–21.5 14.0–17.1 3.7–13.9
≥ 40 6.2% 8.0–13.0 6.0–7.9 4.3–5.9 0.0–4.2
All 17.0% 20.6–25.9 17.2–20.5 14.5–17.1 3.6–14.4
(a) Age at start of a treatment cycle.

Assisted reproductive technology in Australia and New Zealand 2011 17
There was also variation in the outcomes of autologous fresh cycles by number of embryos transferred and stage of embryo development. Figure 3 shows the median live delivery rate and interquartile range among the 35 fertility centres that performed autologous fresh cleavage stage embryo or blastocyst transfers. For example, 50% of the clinics that performed single blastocyst transfers achieved a live delivery rate between 22.0% and 34.3%.
These data should be interpreted with caution because of the small number of patients who underwent autologous fresh cleavage embryo or blastocyst transfers in some centres coupled with potential variation in patient characteristics which may influence the live delivery rate of an individual centre. A woman’s age, parity, cause of infertility and embryo quality may influence whether one or two embryos are transferred, and whether embryos are transferred at the cleavage or blastocyst stage.
Figure 3: Live deliveries per autologous fresh embryo transfer cycle by number of embryos transferred and stage of embryo development among fertility centres, Australia and New Zealand, 2011
0
5
10
15
20
25
30
35
40
Single cleavage embryo transfer
Double cleavage embryo transfer
Single blastocyst transfer
Double blastocyst transfer
Percentage
75th percentile
Median
25th percentile

18 Assisted reproductive technology in Australia and New Zealand 2011
3.3 Autologous thaw cycles There were 22,368 autologous thaw cycles reported in 2011 (Figure 4). Of these, 93% (20,805) were in Australian clinics and 7% (1,563) in New Zealand clinics.
Progression of autologous thaw cycles Figure 4 shows the main stages of autologous thaw cycles and the resulting treatment outcomes.
Of the 22,368 initiated autologous thaw cycles, 92.6% had embryos transferred, 25.2% resulted in a clinical pregnancy and 19.2% resulted in a live delivery (Figure 4). Almost 1 in 13 initiated autologous thaw cycles did not progress to embryo transfer, principally due to non-viability following thawing of cryopreserved (frozen) embryo(s).
The rate of live deliveries per initiated cycle was higher for autologous thaw cycles than for autologous fresh cycles in 2011 (19.2% and 17.0% respectively) (Figures 1 and 4).
Figure 4: Progression of autologous thaw cycles, Australia and New Zealand, 2011
0
10
20
30
40
50
60
70
80
90
100
Initiated cycles Embryo transfers Clinical pregnancies Live deliveries
Percentage
22,368
20,710
5,647
4,291
Assisted reproductive technology in Australia and New Zealand 2011 19
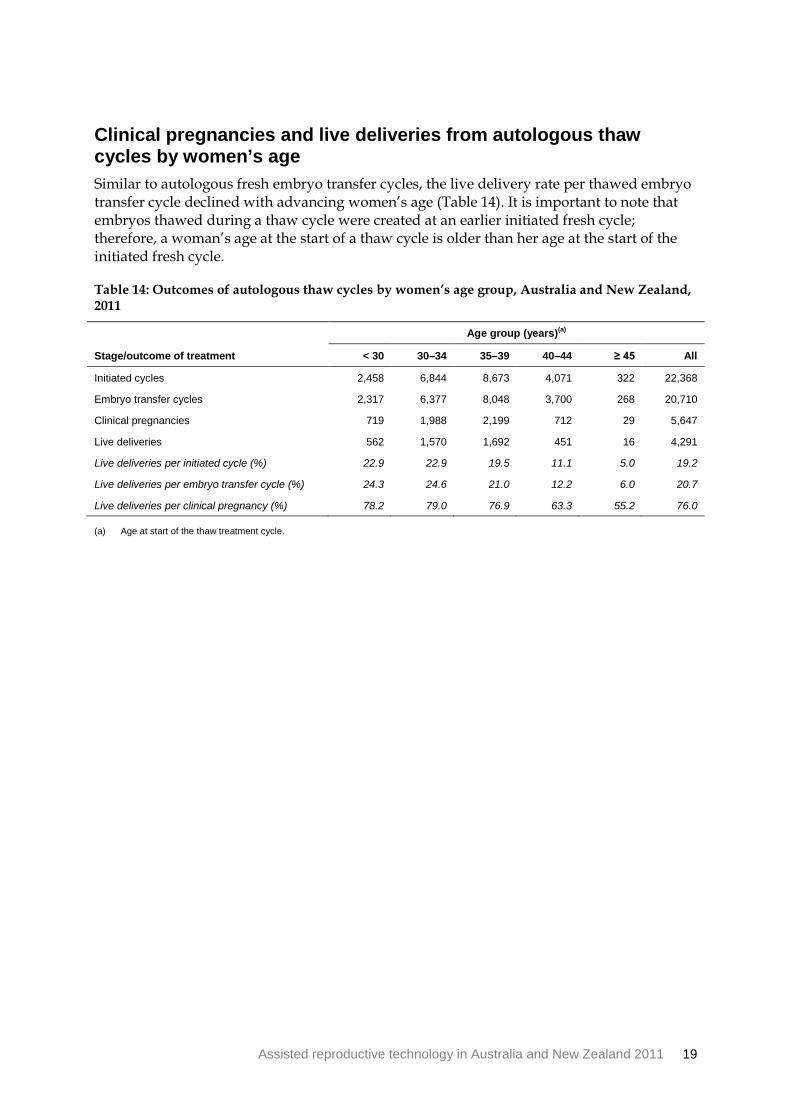
Clinical pregnancies and live deliveries from autologous thaw cycles by women’s age Similar to autologous fresh embryo transfer cycles, the live delivery rate per thawed embryo transfer cycle declined with advancing women’s age (Table 14). It is important to note that embryos thawed during a thaw cycle were created at an earlier initiated fresh cycle; therefore, a woman’s age at the start of a thaw cycle is older than her age at the start of the initiated fresh cycle.
Table 14: Outcomes of autologous thaw cycles by women’s age group, Australia and New Zealand, 2011
Stage/outcome of treatment
Age group (years)(a)
< 30 30–34 35–39 40–44 ≥ 45 All
Initiated cycles 2,458 6,844 8,673 4,071 322 22,368
Embryo transfer cycles 2,317 6,377 8,048 3,700 268 20,710
Clinical pregnancies 719 1,988 2,199 712 29 5,647
Live deliveries 562 1,570 1,692 451 16 4,291
Live deliveries per initiated cycle (%) 22.9 22.9 19.5 11.1 5.0 19.2
Live deliveries per embryo transfer cycle (%) 24.3 24.6 21.0 12.2 6.0 20.7
Live deliveries per clinical pregnancy (%) 78.2 79.0 76.9 63.3 55.2 76.0
(a) Age at start of the thaw treatment cycle.

20 Assisted reproductive technology in Australia and New Zealand 2011
Figure 5 shows age-specific live delivery rates per initiated autologous thaw cycle by two-year age groups. The highest live delivery rates were for women in their mid-20s to mid-30s. The live delivery rate declined steadily for women aged 35 and older. For women aged 45 or older, 5% of initiated autologous thaw cycles resulted in a live delivery, which is higher than the live delivery rate per initiated autologous fresh cycle in this age group (1.2%) (Figures 2 and 5).
Figure 5: Live deliveries per initiated autologous thaw cycle by women’s age at start of the thaw treatment cycle, Australia and New Zealand, 2011
0
5
10
15
20
25
30
≤ 22 23-24 25-26 27-28 29-30 31-32 33-34 35-36 37-38 39-40 41-42 43-44 ≥ 45
Percentage
Age group (years)

Assisted reproductive technology in Australia and New Zealand 2011 21
Clinical pregnancies and live deliveries by cause of infertility Cycles reported with male factor as the only cause of infertility had a higher rate of live delivery per initiated cycle (20.5%) than those with female factor-only infertility (18.5%) (Table 15).
Table 15: Outcomes of autologous thaw cycles by cause of infertility, Australia and New Zealand, 2011
Cause of infertility Initiated cycles
(number)
Embryo transfer cycles
per initiated cycle
(per cent)
Clinical pregnancies per
initiated cycle (per cent)
Live deliveries per initiated
cycle (per cent)
Male factor only 5,200 92.5 26.3 20.5
Female factor 5,949 91.7 24.9 18.5
Tubal disease only 1,012 92.1 25.3 19.6
Endometriosis only 1,161 92.7 25.3 18.9
Other female factor only 3,102 91.6 24.9 17.9
Combined female factor 674 90.4 23.9 18.8
Combined male–female factors 2,761 93.2 25.7 19.7
Unexplained 5,275 93.1 27.4 20.9
Not stated 3,183 93.0 20.0 15.0
Total 22,368 92.6 25.2 19.2

22 Assisted reproductive technology in Australia and New Zealand 2011
Clinical pregnancies and live deliveries by number of embryos transferred Overall, of the 20,710 embryo transfer cycles, 80.0% were SET cycles, 19.6% were DET cycles and 0.4% transferred three or more embryos. In women aged under 40, three or more frozen/thawed embryos were transferred in less than 0.1% of embryo transfer cycles, compared with 1.5% in women aged 40 or older.
The overall live delivery rates for SET and DET in autologous thaw cycles were 20.7% and 21.1% respectively. For cycles in women aged under 40, the live delivery rate was higher for DET than for SET. For cycles in women aged ≥ 40, the live delivery rate was slightly lower for DET than for SET (Table 16).
Table 16: Outcomes of autologous thaw embryo transfer cycles by women’s age and number of embryos transferred, Australia and New Zealand, 2011
Stage/outcome of treatment
Age group (years)(a)
< 35
35–39
≥ 40
All
SET(b) DET(c) SET(b) DET(c) SET(b) DET(c) SET(b) DET(c)
Embryo transfer cycles 7,182 1,507
6,533 1,503
2,852 1,057
16,567 4,067
Clinical pregnancies 2,181 525
1,754 443
528 201
4,463 1,169
Live deliveries 1,722 409
1,361 330
341 120
3,424 859
Clinical pregnancies per embryo transfer cycle (%) 30.4 34.8
26.8 29.5
18.5 19.0
26.9 28.7
Live deliveries per embryo transfer cycle (%) 24.0 27.1 20.8 22.0 12.0 11.4 20.7 21.1
(a) Age at start of a treatment cycle. (b) SET: single embryo transfer. (c) DET: double embryo transfer.

Assisted reproductive technology in Australia and New Zealand 2011 23
Clinical pregnancies and live deliveries by stage of embryo development The rates of clinical pregnancy and live delivery were higher for blastocyst transfer cycles than for cleavage embryo transfer cycles, regardless of a woman’s age (Table 17). The rate of live delivery for blastocyst transfer cycles was 59.3% higher than for cleavage stage embryo transfer cycles.
Table 17: Outcomes of autologous thaw embryo transfer cycles by women’s age and stage of embryo development, Australia and New Zealand, 2011
Stage/outcome of treatment
Age group (years)(a)
< 35
35–39
≥ 40
All
CL(b) BL(c) CL(b) BL(c) CL(b) BL(c) CL(b) BL(c)
Embryo transfer cycles 2,728 5,966
2,902 5,146
1,803 2,165
7,433 13,277
Clinical pregnancies 638 2,069
613 1,586
228 513
1,479 4,168
Live deliveries 522 1,610
464 1,228
131 336
1,117 3,174
Clinical pregnancies per embryo transfer cycle (%) 23.4 34.7
21.1 30.8
12.6 23.7
19.9 31.4
Live deliveries per embryo transfer cycle (%) 19.1 27.0 16.0 23.9 7.3 15.5 15.0 23.9
(a) Age at start of a treatment cycle. (b) CL: cleavage embryo. (c) BL: blastocyst.
24 Assisted reproductive technology in Australia and New Zealand 2011
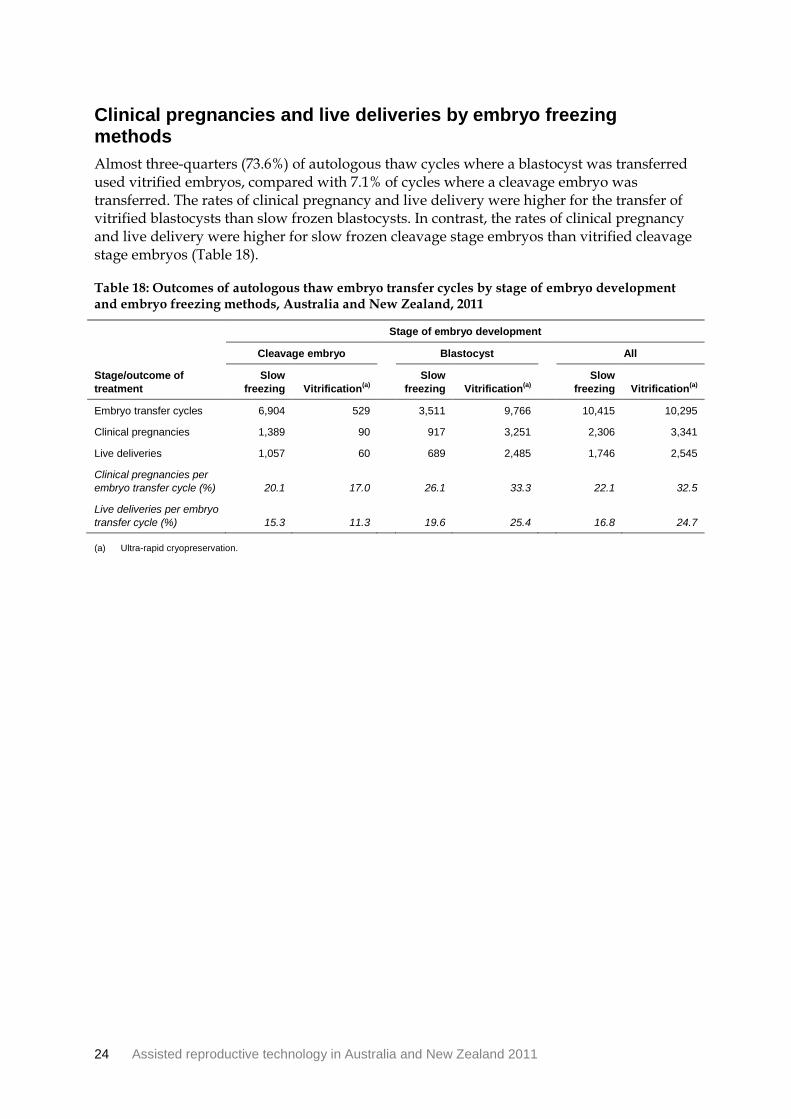
Clinical pregnancies and live deliveries by embryo freezing methods Almost three-quarters (73.6%) of autologous thaw cycles where a blastocyst was transferred used vitrified embryos, compared with 7.1% of cycles where a cleavage embryo was transferred. The rates of clinical pregnancy and live delivery were higher for the transfer of vitrified blastocysts than slow frozen blastocysts. In contrast, the rates of clinical pregnancy and live delivery were higher for slow frozen cleavage stage embryos than vitrified cleavage stage embryos (Table 18).
Table 18: Outcomes of autologous thaw embryo transfer cycles by stage of embryo development and embryo freezing methods, Australia and New Zealand, 2011
Stage/outcome of treatment
Stage of embryo development
Cleavage embryo Blastocyst All
Slow freezing Vitrification(a)
Slow freezing Vitrification(a)
Slow freezing Vitrification(a)
Embryo transfer cycles 6,904 529
3,511 9,766
10,415 10,295
Clinical pregnancies 1,389 90
917 3,251
2,306 3,341
Live deliveries 1,057 60
689 2,485
1,746 2,545
Clinical pregnancies per embryo transfer cycle (%) 20.1 17.0
26.1 33.3
22.1 32.5
Live deliveries per embryo transfer cycle (%) 15.3 11.3 19.6 25.4 16.8 24.7
(a) Ultra-rapid cryopreservation.
Assisted reproductive technology in Australia and New Zealand 2011 25
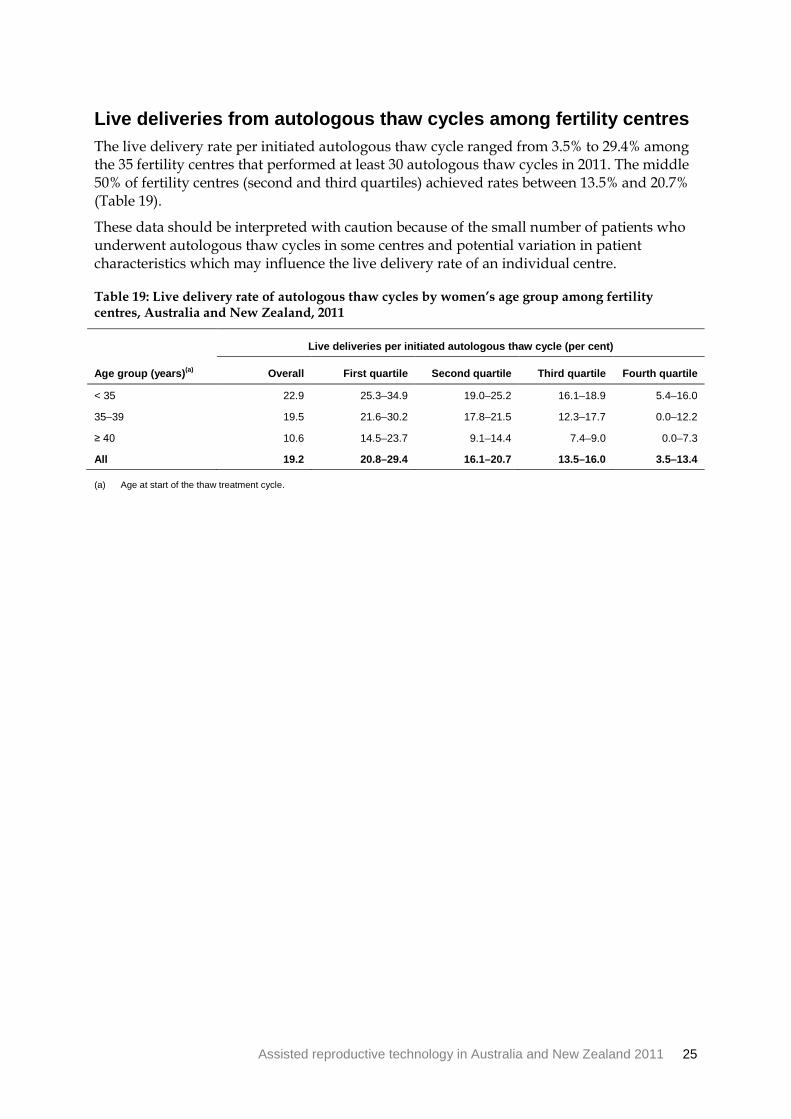
Live deliveries from autologous thaw cycles among fertility centres The live delivery rate per initiated autologous thaw cycle ranged from 3.5% to 29.4% among the 35 fertility centres that performed at least 30 autologous thaw cycles in 2011. The middle 50% of fertility centres (second and third quartiles) achieved rates between 13.5% and 20.7% (Table 19).
These data should be interpreted with caution because of the small number of patients who underwent autologous thaw cycles in some centres and potential variation in patient characteristics which may influence the live delivery rate of an individual centre.
Table 19: Live delivery rate of autologous thaw cycles by women’s age group among fertility centres, Australia and New Zealand, 2011
Age group (years)(a)
Live deliveries per initiated autologous thaw cycle (per cent)
Overall First quartile Second quartile Third quartile Fourth quartile
< 35 22.9 25.3–34.9 19.0–25.2 16.1–18.9 5.4–16.0
35–39 19.5 21.6–30.2 17.8–21.5 12.3–17.7 0.0–12.2
≥ 40 10.6 14.5–23.7 9.1–14.4 7.4–9.0 0.0–7.3
All 19.2 20.8–29.4 16.1–20.7 13.5–16.0 3.5–13.4
(a) Age at start of the thaw treatment cycle.
26 Assisted reproductive technology in Australia and New Zealand 2011
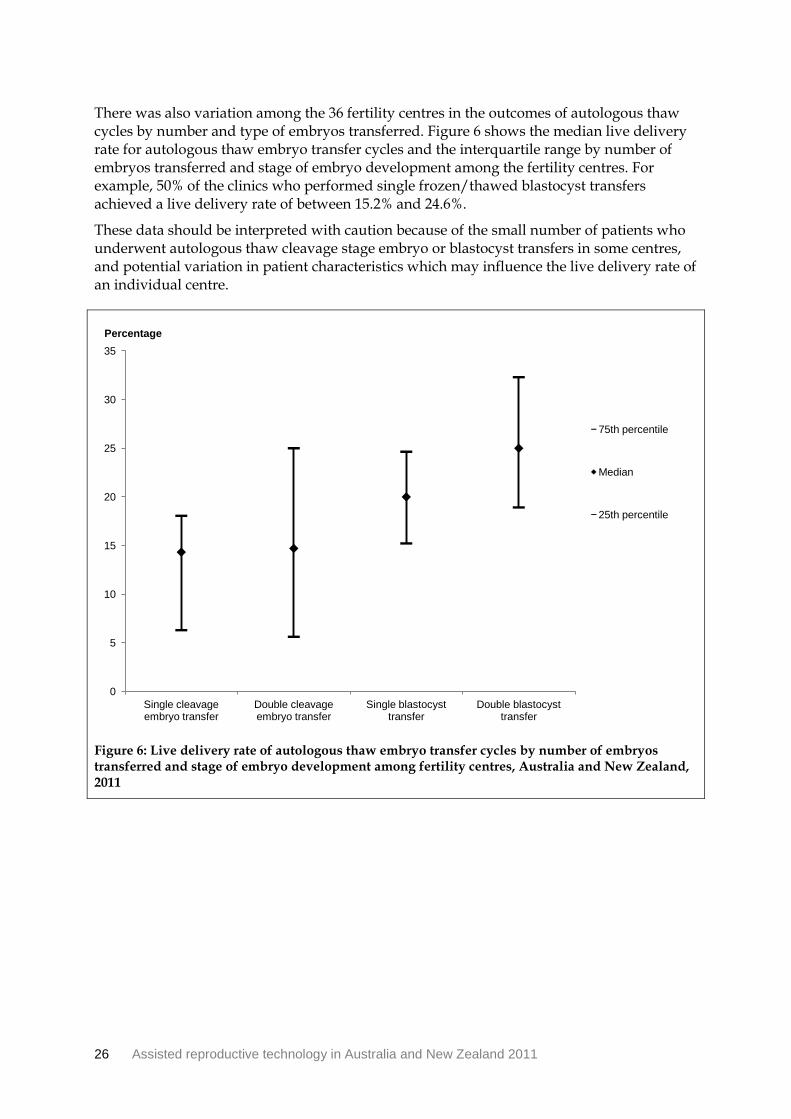
There was also variation among the 36 fertility centres in the outcomes of autologous thaw cycles by number and type of embryos transferred. Figure 6 shows the median live delivery rate for autologous thaw embryo transfer cycles and the interquartile range by number of embryos transferred and stage of embryo development among the fertility centres. For example, 50% of the clinics who performed single frozen/thawed blastocyst transfers achieved a live delivery rate of between 15.2% and 24.6%.
These data should be interpreted with caution because of the small number of patients who underwent autologous thaw cleavage stage embryo or blastocyst transfers in some centres, and potential variation in patient characteristics which may influence the live delivery rate of an individual centre.
Figure 6: Live delivery rate of autologous thaw embryo transfer cycles by number of embryos transferred and stage of embryo development among fertility centres, Australia and New Zealand, 2011
0
5
10
15
20
25
30
35
Single cleavage embryo transfer
Double cleavage embryo transfer
Single blastocyst transfer
Double blastocyst transfer
Percentage
75th percentile
Median
25th percentile

Assisted reproductive technology in Australia and New Zealand 2011 27
3.4 Donation and recipient cycles A donation cycle is defined as an ART treatment cycle in which a woman intends to donate, or donates her oocytes to another woman. A donation cycle may result in either oocytes or embryos being donated to a recipient woman. A recipient cycle is defined as an ART treatment cycle in which a woman receives oocytes or embryos. The use of donor sperm does not alter the donor status of the cycle.
In 2011, donation and recipient cycles accounted for 4.7% (3,095) of all treatment cycles in Australia and New Zealand. There were 961 initiated cycles where the intention was to donate oocytes, consisting of 831 (86.5%) cycles in Australia and 130 (13.5%) in New Zealand. There were 2,134 oocyte/embryo recipient cycles (Table 1), including 1,907 cycles in Australia and 227 cycles in New Zealand.
Oocyte donation cycles Of the 961 cycles in Australia and New Zealand where the intention was to donate oocytes to a recipient, 40 (4.1%) cycles were cancelled before OPU, and a further 13 did not result in oocytes being donated.
The average age of women donating oocytes was 32.9 years, with 42.8% of cycles in women aged 35 or older (Table 20).
Table 20: Number of oocyte donation cycles by donor’s age group, Australia and New Zealand, 2011
Age group (years)(a) Initiated cycles
(number)
Cycles with OPU performed
(number)
Cycles with OPU performed
(per cent)
Cycles with oocytes donated
(number)
Cycles with oocytes donated
(per cent)
< 30 239 225 94.1 224 93.7
30–34 311 303 97.4 294 94.5
35–39 343 330 96.2 327 95.3
≥ 40 68 63 92.6 63 92.6
Total 961 921 95.8 908 94.5
(a) Donor’s age at start of a treatment cycle.
28 Assisted reproductive technology in Australia and New Zealand 2011
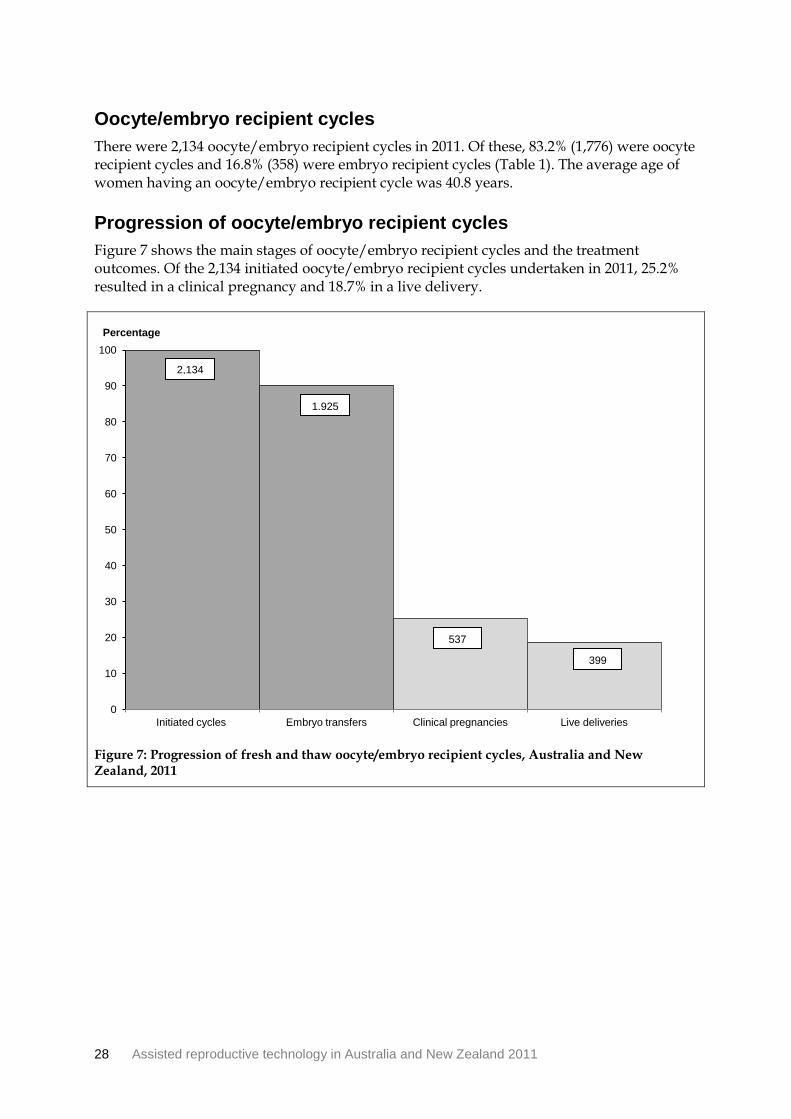
Oocyte/embryo recipient cycles There were 2,134 oocyte/embryo recipient cycles in 2011. Of these, 83.2% (1,776) were oocyte recipient cycles and 16.8% (358) were embryo recipient cycles (Table 1). The average age of women having an oocyte/embryo recipient cycle was 40.8 years.
Progression of oocyte/embryo recipient cycles Figure 7 shows the main stages of oocyte/embryo recipient cycles and the treatment outcomes. Of the 2,134 initiated oocyte/embryo recipient cycles undertaken in 2011, 25.2% resulted in a clinical pregnancy and 18.7% in a live delivery.
Figure 7: Progression of fresh and thaw oocyte/embryo recipient cycles, Australia and New Zealand, 2011
0
10
20
30
40
50
60
70
80
90
100
Initiated cycles Embryo transfers Clinical pregnancies Live deliveries
Percentage
2,134
1,925
537
399
Assisted reproductive technology in Australia and New Zealand 2011 29
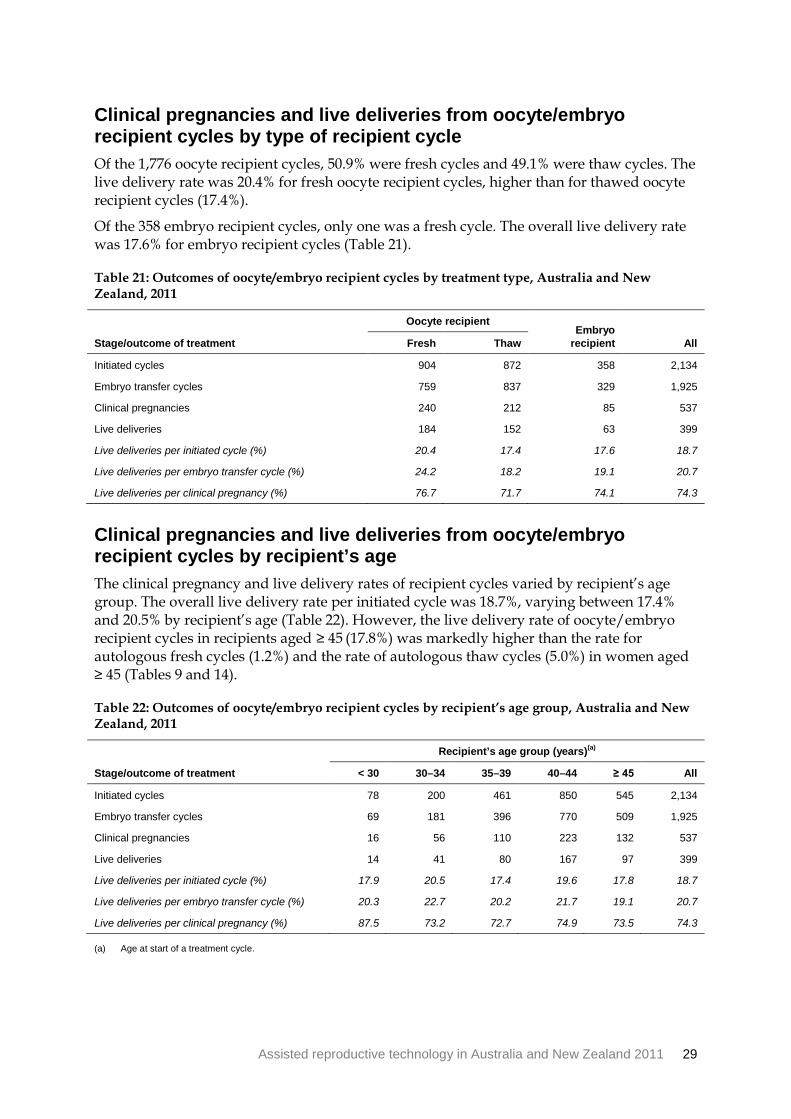
Clinical pregnancies and live deliveries from oocyte/embryo recipient cycles by type of recipient cycle Of the 1,776 oocyte recipient cycles, 50.9% were fresh cycles and 49.1% were thaw cycles. The live delivery rate was 20.4% for fresh oocyte recipient cycles, higher than for thawed oocyte recipient cycles (17.4%).
Of the 358 embryo recipient cycles, only one was a fresh cycle. The overall live delivery rate was 17.6% for embryo recipient cycles (Table 21).
Table 21: Outcomes of oocyte/embryo recipient cycles by treatment type, Australia and New Zealand, 2011
Stage/outcome of treatment
Oocyte recipient Embryo
recipient All Fresh Thaw
Initiated cycles 904 872 358 2,134
Embryo transfer cycles 759 837 329 1,925
Clinical pregnancies 240 212 85 537
Live deliveries 184 152 63 399
Live deliveries per initiated cycle (%) 20.4 17.4 17.6 18.7
Live deliveries per embryo transfer cycle (%) 24.2 18.2 19.1 20.7
Live deliveries per clinical pregnancy (%) 76.7 71.7 74.1 74.3
Clinical pregnancies and live deliveries from oocyte/embryo recipient cycles by recipient’s age The clinical pregnancy and live delivery rates of recipient cycles varied by recipient’s age group. The overall live delivery rate per initiated cycle was 18.7%, varying between 17.4% and 20.5% by recipient’s age (Table 22). However, the live delivery rate of oocyte/embryo recipient cycles in recipients aged ≥ 45 (17.8%) was markedly higher than the rate for autologous fresh cycles (1.2%) and the rate of autologous thaw cycles (5.0%) in women aged ≥ 45 (Tables 9 and 14).
Table 22: Outcomes of oocyte/embryo recipient cycles by recipient’s age group, Australia and New Zealand, 2011
Recipient’s age group (years)(a)
Stage/outcome of treatment < 30 30–34 35–39 40–44 ≥ 45 All
Initiated cycles 78 200 461 850 545 2,134
Embryo transfer cycles 69 181 396 770 509 1,925
Clinical pregnancies 16 56 110 223 132 537
Live deliveries 14 41 80 167 97 399
Live deliveries per initiated cycle (%) 17.9 20.5 17.4 19.6 17.8 18.7
Live deliveries per embryo transfer cycle (%) 20.3 22.7 20.2 21.7 19.1 20.7
Live deliveries per clinical pregnancy (%) 87.5 73.2 72.7 74.9 73.5 74.3
(a) Age at start of a treatment cycle.
30 Assisted reproductive technology in Australia and New Zealand 2011
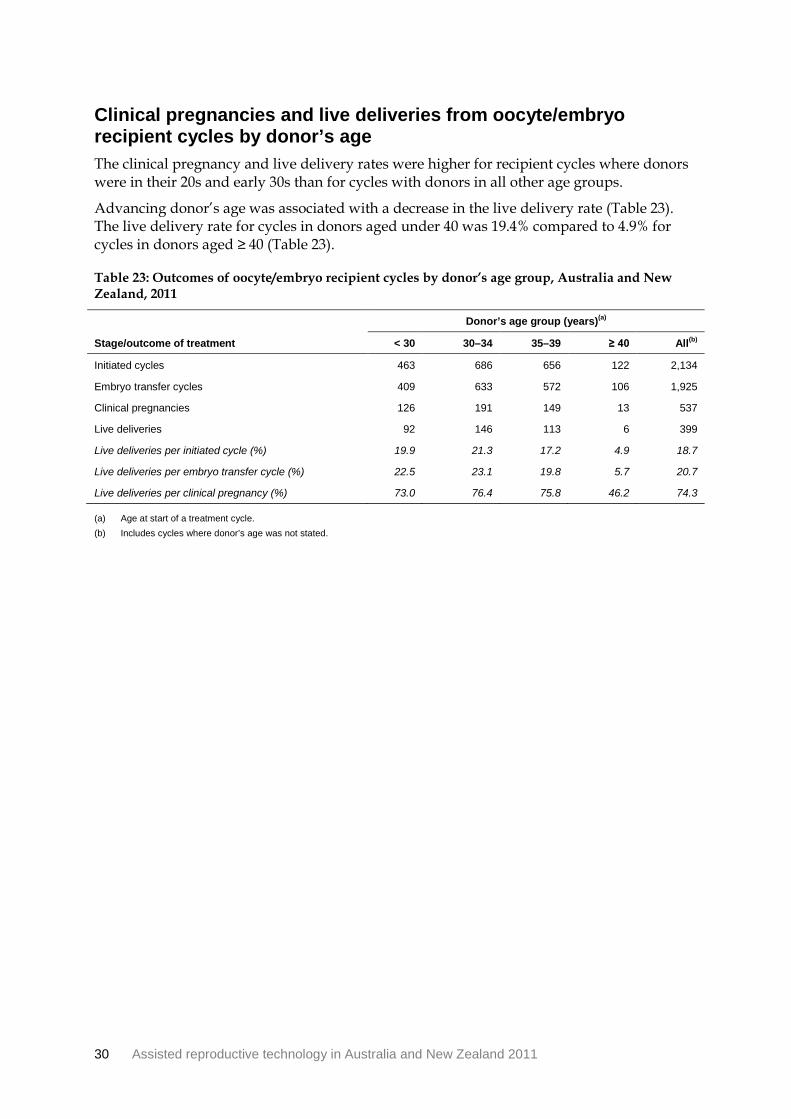
Clinical pregnancies and live deliveries from oocyte/embryo recipient cycles by donor’s age The clinical pregnancy and live delivery rates were higher for recipient cycles where donors were in their 20s and early 30s than for cycles with donors in all other age groups.
Advancing donor’s age was associated with a decrease in the live delivery rate (Table 23). The live delivery rate for cycles in donors aged under 40 was 19.4% compared to 4.9% for cycles in donors aged ≥ 40 (Table 23).
Table 23: Outcomes of oocyte/embryo recipient cycles by donor’s age group, Australia and New Zealand, 2011
Donor’s age group (years)(a)
Stage/outcome of treatment < 30 30–34 35–39 ≥ 40 All(b)
Initiated cycles 463 686 656 122 2,134
Embryo transfer cycles 409 633 572 106 1,925
Clinical pregnancies 126 191 149 13 537
Live deliveries 92 146 113 6 399
Live deliveries per initiated cycle (%) 19.9 21.3 17.2 4.9 18.7
Live deliveries per embryo transfer cycle (%) 22.5 23.1 19.8 5.7 20.7
Live deliveries per clinical pregnancy (%) 73.0 76.4 75.8 46.2 74.3
(a) Age at start of a treatment cycle. (b) Includes cycles where donor’s age was not stated.

Assisted reproductive technology in Australia and New Zealand 2011 31
Clinical pregnancies and live deliveries from oocyte/embryo recipient cycles by number of embryos transferred Of the 1,925 oocyte/embryo recipient cycles where embryos were transferred, 72.3% were SET, 27.3% were DET and 8 cycles (0.4%) transferred three or more embryos.
The overall live delivery rate per oocyte/embryo recipient cycle where embryos were transferred was 27.4% for SET cycles and 29.7% for DET cycles. For cycles in recipients aged under 40, the live delivery rate was similar for SET and DET cycles. For cycles in recipients aged ≥ 40, the live delivery rate was higher for DET cycles compared to SET cycles (23.1% and 19.9% respectively) (Table 24).
Table 24: Outcomes of oocyte/embryo recipient cycles by recipient’s age and number of embryos transferred, Australia and New Zealand, 2011
Stage/outcome of treatment
Age group (years)(a)
< 35
35–39
≥ 40
All
SET(b) DET(c) SET(b) DET(c) SET(b) DET(c) SET(b) DET(c)
Embryo transfer cycles 193 57
274 122
925 346
1,392 525
Clinical pregnancies 54 18
71 39
256 99
381 156
Live deliveries 42 13
56 24
184 80
282 117
Clinical pregnancies per embryo transfer cycle (%) 28.0 31.6
25.9 32.0
27.7 28.6
27.4 29.7
Live deliveries per embryo transfer cycle (%) 21.8 22.8 20.4 19.7 19.9 23.1 20.3 22.3
(a) Age at start of a treatment cycle. (b) SET: single embryo transfer. (c) DET: double embryo transfer.

32 Assisted reproductive technology in Australia and New Zealand 2011
Clinical pregnancies and live deliveries from oocyte/embryo recipient cycles by stage of embryo development The live delivery rate per oocyte/embryo recipient cycle with embryos transferred was higher for blastocyst transfer cycles than cleavage embryo transfer cycles regardless of recipient’s age. Overall, the difference in live delivery rates for cleavage stage embryo and blastocyst transfer cycles was 7.1 percentage points (16.7% and 23.8% respectively) (Table 25).
Table 25: Outcomes of oocyte/embryo recipient cycles by recipient’s age and stage of embryo development, Australia and New Zealand, 2011
Stage/outcome of treatment
Age group (years)(a)
< 35
35–39
≥ 40
All
CL(b) BL(c) CL(b) BL(c) CL(b) BL(c) CL(b) BL(c)
Embryo transfer cycles 106 144
176 220
560 719
842 1,083
Clinical pregnancies 18 54
43 67
133 222
194 343
Live deliveries 16 39
30 50
95 169
141 258
Clinical pregnancies per embryo transfer cycle (%) 17.0 37.5
24.4 30.5
23.8 30.9
23.0 31.7
Live deliveries per embryo transfer cycle (%) 15.1 27.1 17.0 22.7 17.0 23.5 16.7 23.8
(a) Age at start of a treatment cycle. (b) CL: cleavage embryo. (c) BL: blastocyst.

Assisted reproductive technology in Australia and New Zealand 2011 33
Clinical pregnancies and live deliveries from oocyte/embryo recipient cycles by stage of embryo development and embryo freezing methods Almost two-thirds of oocyte/embryo recipient thaw cycles where a blastocyst was transferred used vitrified embryos, compared with just over 8% of cycles where a cleavage embryo was transferred. Overall, the difference in the live delivery rate of oocyte/embryo recipient thaw cycles was 8.1 percentage points for slow frozen and vitrified embryos (15.3% and 23.4% respectively) (Table 26).
Table 26: Outcomes of oocyte/embryo recipient thaw cycles by stage of embryo development and embryo freezing methods, Australia and New Zealand, 2011
Stage/outcome of treatment
Stage of embryo development
Cleavage embryo Blastocyst All
Slow freezing Vitrification
Slow freezing Vitrification
Slow freezing Vitrification
Embryo transfer cycles 454 41
241 425
695 466
Clinical pregnancies 93 12
55 137
148 149
Live deliveries 69 7
37 102
106 109
Clinical pregnancies per embryo transfer cycle (%) 20.5 29.3
22.8 32.2
21.3 32.0
Live deliveries per embryo transfer cycle (%) 15.2 17.1 15.4 24.0 15.3 23.4
34 Assisted reproductive technology in Australia and New Zealand 2011
4 Pregnancy and birth outcomes following autologous and recipient embryo transfer cycles in 2011
4.1 Clinical pregnancies
Clinical pregnancies overview Of the 53,688 autologous and recipient embryo transfer cycles undertaken in Australian and New Zealand fertility centres, 15,284 resulted in a clinical pregnancy. Of these, 13,760 (90.0%) were reported from fertility centres in Australia and 1,524 (10.0%) from New Zealand centres. Clinical pregnancies that resulted from other cycles are described in Chapter 5.
Of the 15,284 clinical pregnancies, over three-quarters (77.0%) resulted in a delivery and 22.1% resulted in early pregnancy loss (less than 20 weeks gestation and less than 400 grams birthweight). The outcomes of 135 (0.9%) clinical pregnancies were not known because women could not be followed up or contacted by fertility centres.
Nearly three-quarters (74.5%) of clinical pregnancies followed SET, while one-quarter followed DET (25.0%). Just 0.5% of clinical pregnancies followed the transfer of three or more embryos.
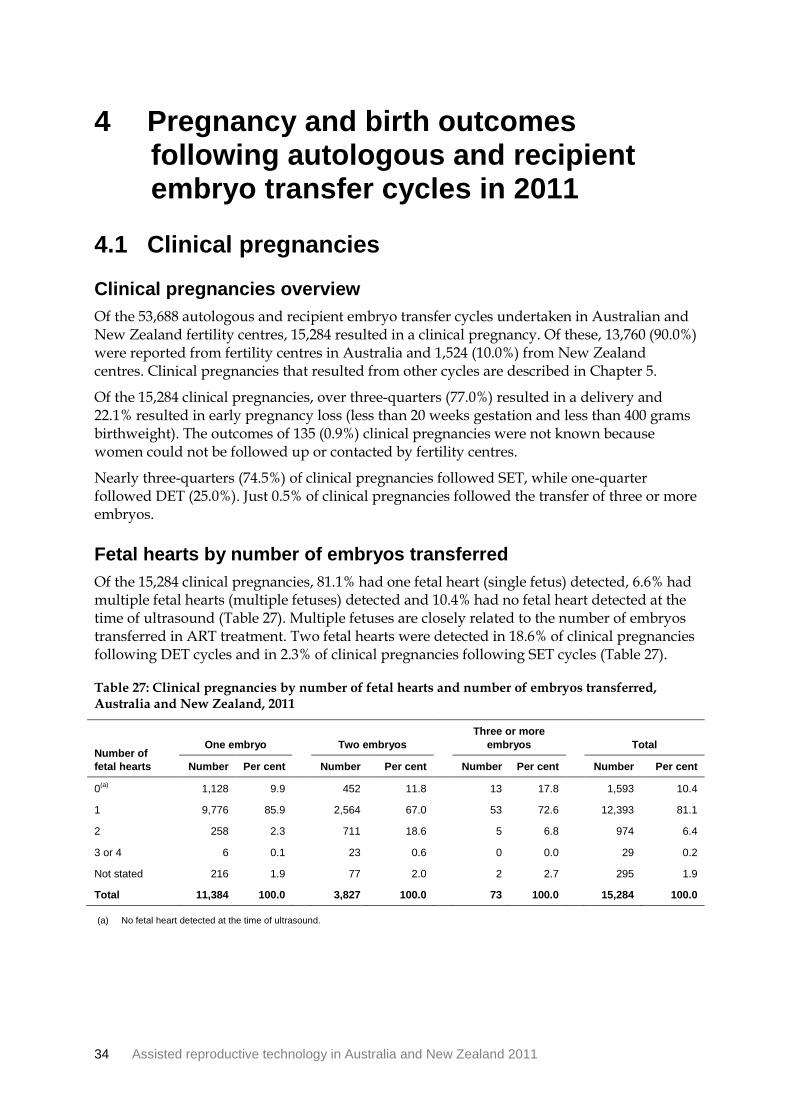
Fetal hearts by number of embryos transferred Of the 15,284 clinical pregnancies, 81.1% had one fetal heart (single fetus) detected, 6.6% had multiple fetal hearts (multiple fetuses) detected and 10.4% had no fetal heart detected at the time of ultrasound (Table 27). Multiple fetuses are closely related to the number of embryos transferred in ART treatment. Two fetal hearts were detected in 18.6% of clinical pregnancies following DET cycles and in 2.3% of clinical pregnancies following SET cycles (Table 27).
Table 27: Clinical pregnancies by number of fetal hearts and number of embryos transferred, Australia and New Zealand, 2011
Number of fetal hearts
One embryo
Two embryos
Three or more embryos
Total
Number Per cent Number Per cent Number Per cent Number Per cent
0(a) 1,128 9.9
452 11.8
13 17.8
1,593 10.4
1 9,776 85.9
2,564 67.0
53 72.6
12,393 81.1
2 258 2.3
711 18.6
5 6.8
974 6.4
3 or 4 6 0.1
23 0.6
0 0.0
29 0.2
Not stated 216 1.9
77 2.0
2 2.7
295 1.9
Total 11,384 100.0 3,827 100.0 73 100.0 15,284 100.0
(a) No fetal heart detected at the time of ultrasound.

Assisted reproductive technology in Australia and New Zealand 2011 35
Early pregnancy loss There were 3,380 early pregnancy losses (less than 20 weeks gestation and less than 400 grams birthweight) following embryo transfers, representing 22.1% of clinical pregnancies (Table 28).
Pregnancies following SET result in a lower rate of early pregnancy loss (20.8%) and higher delivery rate (78.3%) than pregnancies following DET and three or more embryos (Table 28).
Table 28: Early pregnancy losses by pregnancy outcome and number of embryos transferred, Australia and New Zealand, 2011
Pregnancy outcome
Number of embryos transferred
One
Two
Three or more
All
Number Per cent Number Per cent Number Per cent
Number Per cent
Early pregnancy loss 2,373 20.8
974 25.5
33 45.2
3,380 22.1
Miscarriage 2,170 19.1
867 22.7
30 41.1
3,067 20.1
Termination 72 0.6
27 0.7
0 0.0
99 0.6
Ectopic 131 1.2
80 2.1
3 4.1
214 1.4
Delivery 8,914 78.3
2,815 73.6
40 54.8
11,769 77.0
Not stated 97 0.9
38 1.0
0 0.0
135 0.9
Total 11,384 100.0 3,827 100.0 73 100.0 15,284 100.0
36 Assisted reproductive technology in Australia and New Zealand 2011
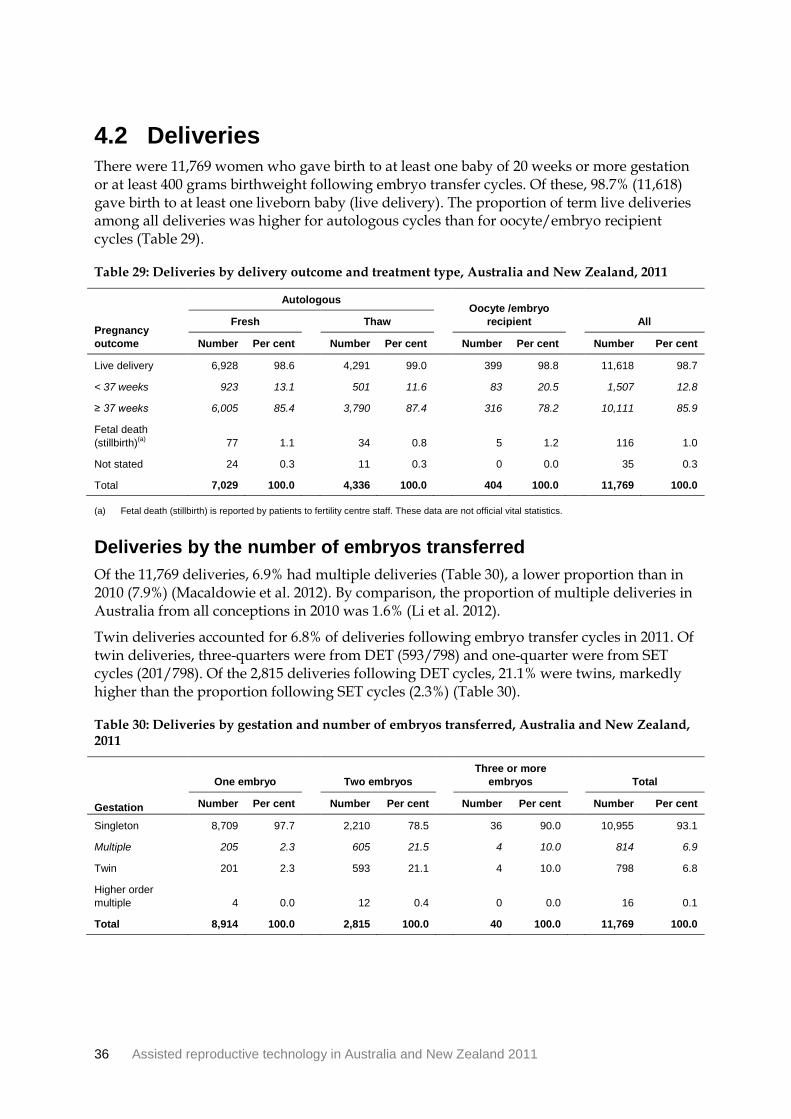
4.2 Deliveries There were 11,769 women who gave birth to at least one baby of 20 weeks or more gestation or at least 400 grams birthweight following embryo transfer cycles. Of these, 98.7% (11,618) gave birth to at least one liveborn baby (live delivery). The proportion of term live deliveries among all deliveries was higher for autologous cycles than for oocyte/embryo recipient cycles (Table 29).
Table 29: Deliveries by delivery outcome and treatment type, Australia and New Zealand, 2011
Pregnancy outcome
Autologous
Oocyte /embryo recipient
All Fresh
Thaw
Number Per cent Number Per cent Number Per cent Number Per cent
Live delivery 6,928 98.6
4,291 99.0
399 98.8
11,618 98.7
< 37 weeks 923 13.1
501 11.6
83 20.5
1,507 12.8
≥ 37 weeks 6,005 85.4
3,790 87.4
316 78.2
10,111 85.9
Fetal death (stillbirth)(a) 77 1.1
34 0.8
5 1.2
116 1.0
Not stated 24 0.3
11 0.3
0 0.0
35 0.3
Total 7,029 100.0 4,336 100.0 404 100.0 11,769 100.0
(a) Fetal death (stillbirth) is reported by patients to fertility centre staff. These data are not official vital statistics.
Deliveries by the number of embryos transferred Of the 11,769 deliveries, 6.9% had multiple deliveries (Table 30), a lower proportion than in 2010 (7.9%) (Macaldowie et al. 2012). By comparison, the proportion of multiple deliveries in Australia from all conceptions in 2010 was 1.6% (Li et al. 2012).
Twin deliveries accounted for 6.8% of deliveries following embryo transfer cycles in 2011. Of twin deliveries, three-quarters were from DET (593/798) and one-quarter were from SET cycles (201/798). Of the 2,815 deliveries following DET cycles, 21.1% were twins, markedly higher than the proportion following SET cycles (2.3%) (Table 30).
Table 30: Deliveries by gestation and number of embryos transferred, Australia and New Zealand, 2011
Gestation
One embryo
Two embryos
Three or more embryos
Total
Number Per cent Number Per cent Number Per cent Number Per cent
Singleton 8,709 97.7
2,210 78.5
36 90.0
10,955 93.1
Multiple 205 2.3
605 21.5
4 10.0
814 6.9
Twin 201 2.3
593 21.1
4 10.0
798 6.8
Higher order multiple 4 0.0
12 0.4
0 0.0
16 0.1
Total 8,914 100.0 2,815 100.0 40 100.0 11,769 100.0

Assisted reproductive technology in Australia and New Zealand 2011 37
Deliveries by maternal age The average age of women at the time of delivery was 35.1. This is five years older than the average age (30) of women who gave birth in Australia in 2010 (Li et al. 2012).
Women aged 40 or older had a lower proportion (5.1%) of multiple deliveries compared with women aged under 35 (7.3%) and women aged 35–39 (7.2%). Of deliveries following DET, the proportion of multiple deliveries was higher for women aged under 35 (29.6%) compared with women aged 35–39 (22.4%) and women aged 40 or older (10.5%) (Table 31).
Table 31: Deliveries by gestation and maternal age group, Australia and New Zealand, 2011
Gestation
Age group (years)(a)
< 35
35–39 ≥ 40
SET(b) DET(c) All(d) SET(b) DET(c) All(d) SET(b) DET(c) All(d)
Number
Singleton 4,248 642 4,892
3,314 878 4,197
1,147 690 1,866
Multiple 117 270 388
71 254 325
17 81 101
Twin 114 265 380
70 249 319
17 79 99
Higher order multiple 3 5 8
1 5 6
0 2 2
Total 4,365 912 5,280
3,385 1,132 4,522
1,164 771 1,967
Per cent
Singleton 97.3 70.4 92.7
97.9 77.6 92.8
98.5 89.5 94.9
Multiple 2.7 29.6 7.3
2.1 22.4 7.2
1.5 10.5 5.1
Twin 2.6 29.1 7.2
2.1 22.0 7.1
1.5 10.2 5.0
Higher order multiple 0.1 0.5 0.2
0.0 0.4 0.1
0.0 0.3 0.1
Total 100.0 100.0 100.0 100.0 100.0 100.0 100.0 100.0 100.0
(a) Age at time of delivery. (b) SET: single embryo transfer. (c) DET: double embryo transfer. (d) Included three or more embryos.

38 Assisted reproductive technology in Australia and New Zealand 2011
Caesarean section Almost half (49.5%) of deliveries following embryo transfer cycles were by caesarean section (Table 32). This is a markedly higher rate than for all deliveries in Australia in 2010 (31.6%) (Li et al. 2012). The higher rate of caesarean section following ART treatment may be related to the fact that women were five years older on average and that there were more multiple births following ART treatment.
The caesarean section rate increased with advancing women’s age at delivery: 38.8% of women aged less than 30 years had a caesarean section compared with 76.3% of women aged 45 years or older (Table 32).
The caesarean section rate varied by plurality, with 47.3% for singleton deliveries, 78.8% for twin deliveries and 100% for triplet deliveries.
Table 32: Deliveries by method of delivery and maternal age group, Australia and New Zealand, 2011
Method of delivery
Age group (years)(a)
< 30 30–34 35–39 40–44 ≥ 45 Total
Number
Caesarean section 517 1,745 2,299 1,128 135 5,824
Other 812 2,188 2,198 651 42 5,891
Not stated 4 14 25 11 0 54
Total 1,333 3,947 4,522 1,790 177 11,769
Per cent
Caesarean section 38.8 44.2 50.8 63.0 76.3 49.5
Other 60.9 55.4 48.6 36.4 23.7 50.1
Not stated 0.3 0.4 0.6 0.6 0.0 0.5
Total 100.0 100.0 100.0 100.0 100.0 100.0
(a) Age at time of delivery.
Assisted reproductive technology in Australia and New Zealand 2011 39
4.3 Perinatal outcomes of babies The babies described in this section were those born at 20 weeks or more gestational age or at least 400 grams birthweight following autologous and recipient embryo transfer cycles. The outcomes of babies born from other cycles are described in Chapter 5.
There were 12,599 babies born to women who had autologous and recipient embryo transfer cycles— 89.6% (11,294) were reported from fertility centres in Australia and 10.4% (1,305) from fertility centres in New Zealand. Of the 12,599 babies, 87.0% were singletons, 12.7% were twins and 0.4% were triplets. There were 12,420 liveborn babies (98.6%). The birth status was not reported for 0.3% of babies.
Sex distribution in liveborn babies There were 6,446 (51.9%) liveborn male babies, 5,936 (47.8%) liveborn female babies and 38 (0.3%) liveborn babies where sex was not stated. For the 12,382 liveborn babies where the baby’s sex was stated, the sex ratio was 108.6 male babies for every 100 female babies, higher than the ratio for all Australian liveborn babies born in 2010 (104.8) (Li et al. 2012). The difference in sex ratio between ART liveborn babies and all Australian liveborn babies is likely related to the ART procedures as sex selection is not permitted in Australia.
Liveborn babies following cleavage embryo transfers had a sex ratio of 96.8 male babies for every 100 female babies. In comparison, liveborn babies following blastocyst transfers had a sex ratio of 114.6 male babies for every 100 female babies. In comparison, in 2010, liveborn babies following cleavage embryo transfers had a sex ratio of 100.1 male babies for every 100 female babies, and liveborn babies following blastocyst transfers had a sex ratio of 114.3 male babies for every 100 female babies (Macaldowie et al. 2012).
40 Assisted reproductive technology in Australia and New Zealand 2011
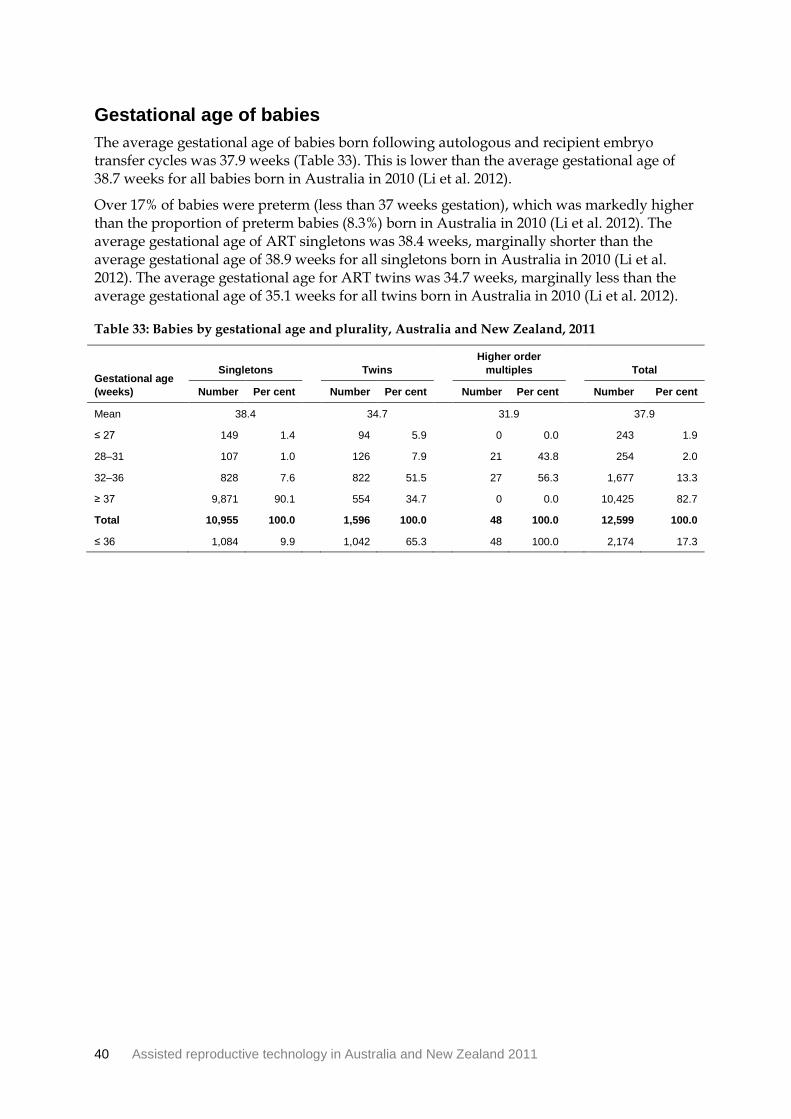
Gestational age of babies The average gestational age of babies born following autologous and recipient embryo transfer cycles was 37.9 weeks (Table 33). This is lower than the average gestational age of 38.7 weeks for all babies born in Australia in 2010 (Li et al. 2012).
Over 17% of babies were preterm (less than 37 weeks gestation), which was markedly higher than the proportion of preterm babies (8.3%) born in Australia in 2010 (Li et al. 2012). The average gestational age of ART singletons was 38.4 weeks, marginally shorter than the average gestational age of 38.9 weeks for all singletons born in Australia in 2010 (Li et al. 2012). The average gestational age for ART twins was 34.7 weeks, marginally less than the average gestational age of 35.1 weeks for all twins born in Australia in 2010 (Li et al. 2012).
Table 33: Babies by gestational age and plurality, Australia and New Zealand, 2011
Gestational age (weeks)
Singletons
Twins
Higher order multiples
Total
Number Per cent Number Per cent Number Per cent Number Per cent
Mean 38.4
34.7
31.9
37.9
≤ 27 149 1.4
94 5.9
0 0.0
243 1.9
28–31 107 1.0
126 7.9
21 43.8
254 2.0
32–36 828 7.6
822 51.5
27 56.3
1,677 13.3
≥ 37 9,871 90.1
554 34.7
0 0.0
10,425 82.7
Total 10,955 100.0
1,596 100.0
48 100.0
12,599 100.0
≤ 36 1,084 9.9
1,042 65.3
48 100.0
2,174 17.3

Assisted reproductive technology in Australia and New Zealand 2011 41
Figure 8 shows the distribution of gestational age for singletons and twins born to women who had autologous and recipient embryo transfer cycles in 2011. Singletons following SET cycles had a lower proportion of preterm birth (9.4%) than singletons following DET cycles (11.7%). The overall proportions of preterm singletons (9.9%) and twins (65.3%) born to women who had embryo transfer cycles in 2011 were higher than the overall proportions of preterm singletons and twins born in Australia in 2010 (6.7% and 56.7% respectively) (Li et al. 2012).
Figure 8: Number of babies born following embryo transfer cycles by gestational age, Australia and New Zealand, 2011
0
500
1,000
1,500
2,000
2,500
≤ 20 21 22 23 24 25 26 27 28 29 30 31 32 33 34 35 36 37 38 39 40 41 ≥ 42
Number of babies
Gestational age (weeks)
SET singleton DET singleton
SET twin DET twin
Preterm < 37 weeks
Very preterm < 32 weeks

42 Assisted reproductive technology in Australia and New Zealand 2011
Birthweight of liveborn babies The average birthweight for liveborn babies to women who had autologous and recipient embryo transfer cycles was 3,207 grams. More than 13% of these babies were low birthweight (less than 2,500 grams) (Table 34).
The average birthweight was 3,342 grams and 2,316 grams for liveborn ART singletons and twins respectively. These were lower than the mean birthweight of all liveborn singletons (3,401 grams) and twins (2,390 grams) in Australia in 2010 (Li et al. 2012). Low birthweight was reported for 6.1% of liveborn singletons following SET, lower than the 7.9% of those following DET.
Table 34: Liveborn babies by birthweight group and plurality, Australia and New Zealand, 2011
Birthweight (grams)
Singletons Twins
Higher order
multiples
Total(c) SET(a) DET(b)
Number
< 1,000 47 12
54
2
115
1,000–1,499 40 20
111
19
190
1,500–1,999 97 36
208
12
355
2,000–2,499 338 104
505
11
961
2,500–2,999 1,350 366
489
2
2,215
3,000–3,499 3,122 780
142
0
4,051
3,500–3,999 2,559 598
21
0
3,190
≥ 4,000 962 225
2
0
1,193
Not stated 91 32
27
0
150
Total 8,606 2,173
1,559
46
12,420
< 2,500 522 172
878
44
1,621
Per cent
< 1,000 0.5 0.6
3.5
4.3
0.9
1,000–1,499 0.5 0.9
7.1
41.3
1.5
1,500–1,999 1.1 1.7
13.3
26.1
2.9
2,000–2,499 3.9 4.8
32.4
23.9
7.7
2,500–2,999 15.7 16.8
31.4
4.3
17.8
3,000–3,499 36.3 35.9
9.1
0.0
32.6
3,500–3,999 29.7 27.5
1.3
0.0
25.7
≥ 4,000 11.2 10.4
0.1
0.0
9.6
Not stated 1.1 1.5
1.7
0.0
1.2
Total 100.0 100.0
100.0
100.0
100.0
< 2,500 6.1 7.9 56.3 95.7 13.1
(a) SET: single embryo transfer. (b) DET: double embryo transfer. (c) Included singletons following transfer of three or more embryos.

Assisted reproductive technology in Australia and New Zealand 2011 43
Perinatal mortality Perinatal mortality is a summary measure of fetal deaths (stillbirths) and neonatal deaths (defined as the death of liveborn infants within 28 days of birth).
There were 182 reported perinatal deaths, including 143 fetal deaths and 39 neonatal deaths. The perinatal mortality rate in 2011 was 14.4 deaths per 1,000 births (Table 35), which was higher than the rate of 9.3 per 1,000 births for all births in Australia in 2010 (Li et al. 2012). Singletons had a lower perinatal mortality rate (12.0 deaths per 1,000 births) compared with multiples (30.4 deaths per 1,000 births) (Table 35).
These data should be interpreted with caution because of the small numbers and potential variability in case reporting, which is compounded by the self-reported nature of ART birth outcome data. In 2011, information relating to pregnancy outcomes was not stated for 0.9% of clinical pregnancies.
Table 35: Perinatal mortality of babies by type of death and plurality, Australia and New Zealand, 2011
Birth outcome Singletons Multiples Total
Number
Fetal death (stillbirth) 106 37 143
Neonatal death 26 13 39
Perinatal death(a) 132 50 182
All births 10,955 1,644 12,599
All live births 10,815 1,605 12,420
Rate(b)
Fetal deaths per 1,000 births 9.7 22.5 11.4
Neonatal deaths per 1,000 live births 2.4 8.1 3.1
Perinatal deaths per 1,000 births 12.0 30.4 14.4
(a) Perinatal deaths are reported by patients to fertility centre staff. These data are not official vital statistics.
(b) Fetal and perinatal mortality rates were calculated using all births (live births and fetal deaths) as the denominator. The neonatal mortality rate was calculated using live births as the denominator.
Note: The birth status was not reported for 36 babies.

44 Assisted reproductive technology in Australia and New Zealand 2011
5 Other cycle types, procedures and treatment complications in 2011
5.1 Gestational surrogacy cycles Gestational surrogacy is an arrangement where a woman, known as the ‘gestational carrier’, agrees to carry a child for another person or couple, known as the ‘intended parent(s)’, with the intention that the child will be raised by the intended parent(s). The oocytes and/or sperm used to create the embryo(s) in the surrogacy cycle can be either from the intended parents or from a donor(s).
There were 177 gestational surrogacy cycles in 2011, including 131 gestational carrier cycles and 46 cycles undertaken by intended parents. Among the 131 gestational carrier cycles, 34 (26.0%) resulted in a clinical pregnancy and 21 (16.0%) resulted in a delivery. Of all 23 babies born to gestational carriers (21 singletons and one set of twins), 22 were liveborn and one singleton’s outcome was unknown.
5.2 GIFT cycles Gamete intrafallopian transfer (GIFT) is an ART treatment where mature oocytes and sperm are placed directly into a woman’s fallopian tubes. The use of GIFT has been declining in Australia and New Zealand in recent years. In 2011, there were 11 GIFT cycles that resulted in one singleton pregnancy and one liveborn baby.
5.3 Assisted hatching Assisted hatching is an ART procedure where the outer layer of the embryo, the zona pellucida, is either thinned or perforated in the laboratory to aid ‘hatching’ of the embryo.
There were 2,733 assisted hatching cycles reported in 2011. Of these, 2,475 (90.6%) had embryos transferred, resulting in 719 (26.3%) clinical pregnancies and 539 (19.7%) live deliveries. There were 585 births following assisted hatching cycles, including 504 singletons, 78 twins and 3 triplets.

Assisted reproductive technology in Australia and New Zealand 2011 45
5.4 Preimplantation genetic diagnosis Preimplantation genetic diagnosis (PGD) is a procedure in which one or more cells are removed from the embryo and analysed for chromosomal disorders or genetic diseases before embryo transfer. In 2011, PGD was performed in 1,182 cycles, representing 2.0% of cycles in which embryos were created or thawed. Most PGD cycles (908/1,182) were fresh cycles (Table 36).
Of the 1,182 PGD cycles, 65.7% (777) had embryos transferred and resulted in 262 (22.2%) clinical pregnancies and 210 (17.8%) live deliveries.
Table 36: Number of cycles with PGD by type of embryo, Australia and New Zealand, 2011
Stage of treatment
Type of embryo Number of cycles with
embryo created/thawed Number of cycles with
PGD PGD per cycle with embryo
fertilised/thawed (%)
Fresh 35,077 908 2.6
Thawed 23,200 274 1.2
Total 58,277 1,182 2.0
5.5 Ovarian hyperstimulation syndrome Ovarian hyperstimulation syndrome (OHSS) is a complication of controlled ovarian hyperstimulation where excessive follicles are produced with high levels of oestrogen secretion.
Cases of OHSS that require hospitalisation are reported by patients and clinicians, and validated against hospital records by fertility centre staff. There were 229 OHSS cases reported in 2011 that were admitted to hospital. It is possible this information is under-reported as there is no nationally agreed definition for OHSS.
A higher number of oocytes retrieved at OPU is associated with OHSS (Table 37).
Table 37: Number of cycles with OPU performed and OHSS by number of oocytes collected, Australia and New Zealand, 2011
Number of oocytes collected
None 1–4 5–9 10–14 15–19 ≥ 20 All
Cycles with OHSS 0 3 27 40 56 103 229
Cycles with OPU 756 9,142 13,655 8,507 3,895 2,390 38,345
OHSS per OPU cycle (%) 0.0 0.0 0.2 0.5 1.4 4.3 0.6
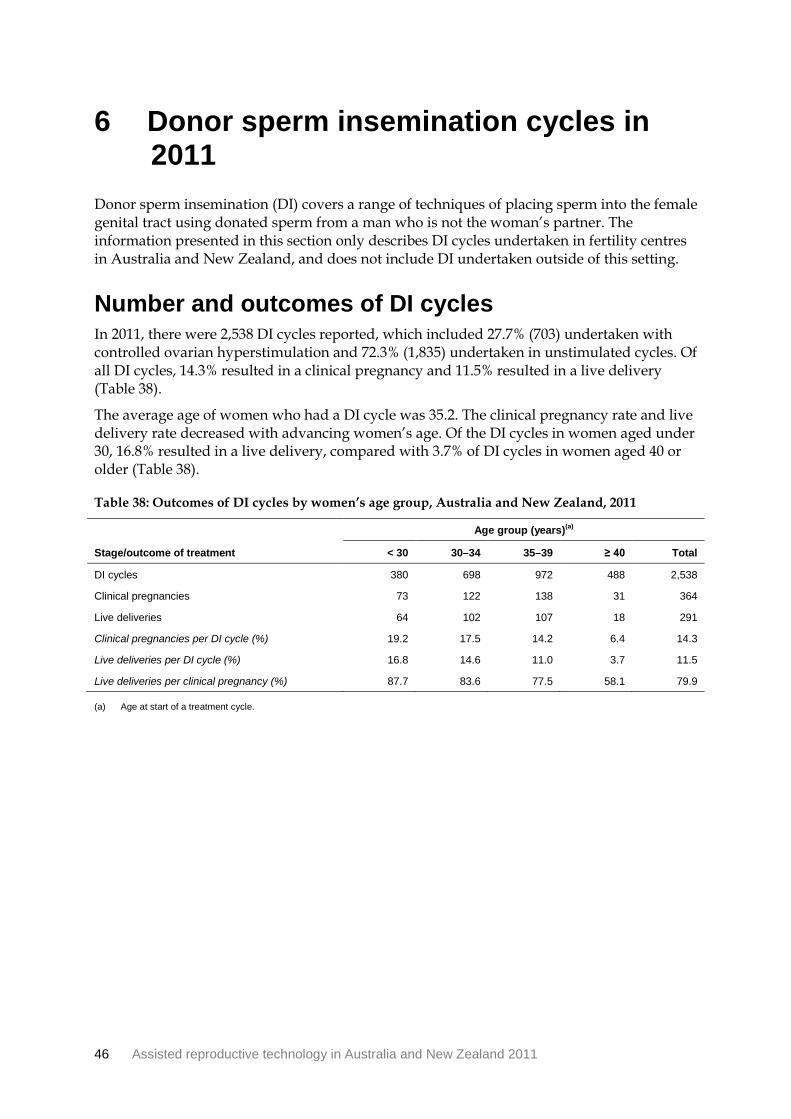
46 Assisted reproductive technology in Australia and New Zealand 2011
6 Donor sperm insemination cycles in 2011
Donor sperm insemination (DI) covers a range of techniques of placing sperm into the female genital tract using donated sperm from a man who is not the woman’s partner. The information presented in this section only describes DI cycles undertaken in fertility centres in Australia and New Zealand, and does not include DI undertaken outside of this setting.
Number and outcomes of DI cycles In 2011, there were 2,538 DI cycles reported, which included 27.7% (703) undertaken with controlled ovarian hyperstimulation and 72.3% (1,835) undertaken in unstimulated cycles. Of all DI cycles, 14.3% resulted in a clinical pregnancy and 11.5% resulted in a live delivery (Table 38).
The average age of women who had a DI cycle was 35.2. The clinical pregnancy rate and live delivery rate decreased with advancing women’s age. Of the DI cycles in women aged under 30, 16.8% resulted in a live delivery, compared with 3.7% of DI cycles in women aged 40 or older (Table 38).
Table 38: Outcomes of DI cycles by women’s age group, Australia and New Zealand, 2011
Stage/outcome of treatment
Age group (years)(a)
< 30 30–34 35–39 ≥ 40 Total
DI cycles 380 698 972 488 2,538
Clinical pregnancies 73 122 138 31 364
Live deliveries 64 102 107 18 291
Clinical pregnancies per DI cycle (%) 19.2 17.5 14.2 6.4 14.3
Live deliveries per DI cycle (%) 16.8 14.6 11.0 3.7 11.5
Live deliveries per clinical pregnancy (%) 87.7 83.6 77.5 58.1 79.9
(a) Age at start of a treatment cycle.

Assisted reproductive technology in Australia and New Zealand 2011 47
Clinical pregnancies following DI cycles Of the 364 clinical pregnancies following DI cycles, 81.0% resulted in a delivery, 17.6% ended in early pregnancy loss (including 17.0% miscarriages, 0.3% ectopic/heterotopic pregnancies and 0.3% terminations/reductions), and 1.4% were unknown pregnancy outcomes. Of the 295 deliveries, 279 (94.6%) were singleton deliveries and 16 (5.4%) were multiple deliveries including one set of triplets.
Perinatal outcomes of babies There were 312 babies born to women who had DI treatment, including 307 liveborn babies and five stillborn babies. Of these liveborn babies, 43 (14.0%) were born preterm (less than 37 weeks gestation). The mean birthweight of liveborn babies following DI treatment was 3,290 grams. This was higher than the mean birthweight (3,207 grams) of liveborn babies following embryo transfer cycles. Thirty liveborn babies (9.8%) were born with low birthweight (less than 2,500 grams).

48 Assisted reproductive technology in Australia and New Zealand 2011
7 Trends in ART treatment and outcomes: 2007–2011 This section includes autologous cycles, donation/recipient cycles, surrogacy cycles and GIFT cycles undertaken in Australia and New Zealand from 2007 to 2011. It does not include DI cycles.
ART treatment and outcomes In 2011, 42,629 initiated fresh ART treatment cycles were undertaken in Australia and New Zealand. This is an increase of 9.8% on 2010 and an increase of 19.9% on 2007 (Table 39). Between 2007 and 2011, the pregnancy and live delivery rates per initiated fresh cycle ranged from 21.9% to 23.8% and from 16.7% to 18.3% respectively (Table 39).
Table 39: Number of fresh cycles by stage/outcome of treatment, Australia and New Zealand, 2007 to 2011
Stage/outcome of treatment 2007 2008 2009 2010 2011
Initiated cycles(a) 35,566 39,309 45,400 38,796 42,629
Embryo transfers 27,240 30,112 34,765 29,775 31,837
Clinical pregnancies 8,355 9,047 10,501 9,236 9,346
Live deliveries 6,498 6,935 8,009 7,014 7,117
Clinical pregnancies per initiated cycle (%) 23.5 23.0 23.1 23.8 21.9
Live deliveries per initiated cycle (%) 18.3 17.6 17.6 18.1 16.7
(a) Included autologous cycles, oocyte donation cycles, oocyte/embryo recipient cycles, GIFT cycles, and surrogacy cycles.
In comparison, 23,718 autologous thaw cycles was reported in 2011, an increase of 3.2% on 2010 and an increase of 11.6% on 2007 (Table 40). The live delivery rate following thaw cycles have increased from 15.9% in 2007 to 19.1% in 2011 (Table 40).
Table 40: Number of thaw cycles by stage/outcome of treatment, Australia and New Zealand, 2007 to 2011
Stage/outcome of treatment 2007 2008 2009 2010 2011
Initiated cycles(a) 21,251 22,620 25,141 22,978 23,718
Embryo transfers 19,380 20,533 22,555 20,805 21,974
Clinical pregnancies 4,460 4,936 5,474 5,516 5,973
Live deliveries 3,376 3,698 4,118 4,155 4,523
Clinical pregnancies per initiated cycle (%) 21.0 21.8 21.8 24.0 25.2
Live deliveries per initiated cycle (%) 15.9 16.3 16.4 18.1 19.1
(a) Included autologous cycles, oocyte/embryo recipient cycles, and surrogacy cycles.

Assisted reproductive technology in Australia and New Zealand 2011 49
Multiple gestation deliveries The decline in multiple gestation deliveries resulting from ART treatment continued in 2011. The proportion of multiple deliveries decreased from 10.0% in 2007 to 6.9% in 2011 (Table 41). The decline is primarily the result of increasing uptake of SET (Table 44).
Table 41: Number of deliveries following ART treatment by gestation, Australia and New Zealand, 2007 to 2011
Gestation
2007
2008
2009
2010
2011
Number Per
cent Number Per
cent Number Per
cent Number Per
cent Number Per
cent
Singleton 8,990 90
9,880 91.6
11,272 91.8
10,382 92.1
10,977 93.1
Multiple 994 10.0
903 8.4
1,006 8.2
890 7.9
815 6.9
Twin 978 9.8
879 8.2
987 8
874 7.8
799 6.8
Higher order multiple 16 0.2
24 0.2
19 0.2
16 0.1
16 0.1
Total(a) 9,984 100 10,783 100 12,278 100 11,272 100 11,792 100
(a) Includes cycles in which gestation was unknown.
Women’s age for autologous cycles While the majority of autologous cycles undertaken between 2007 and 2011 were in women aged 30 to 40, the proportion of autologous cycles in women aged 40 and older increased from 21.4% in 2007 to 25.3% in 2011. The average age of women having autologous cycles increased from 35.5 in 2007 to 35.9 in 2011 (Table 42).
Table 42: Number of fresh and thaw autologous cycles by women’s age group, Australia and New Zealand, 2007 to 2011
Age group (years)(a)
2007
2008
2009
2010
2011
Number Per
cent Number Per
cent Number Per
cent Number Per
cent Number Per
cent
Mean 35.5
35.7
35.8
35.8
35.9
< 30 6,021 11.2
6,373 10.8
7,303 10.9
6,469 11
6,720 10.7
30–34 15,376 28.6
16,154 27.5
17,979 26.7
15,641 26.7
17,129 27.2
35–39 20,799 38.7
22,572 38.4
25,953 38.6
22,224 37.9
23,314 37.0
40–44 10,680 19.9
12,663 21.6
14,853 22.1
13,194 22.5
14,670 23.3
≥ 45 819 1.5
977 1.7
1,141 1.7
1,046 1.8
1,231 2.0
Not stated 1 0
1 0
0 0
0 0
0 0.0
Total 53,696 100 58,740 100 67,229 100 58,574 100 63,064 100
(a) Age at start of a treatment cycle.

50 Assisted reproductive technology in Australia and New Zealand 2011
Types of ART treatment and stage of embryo development In Australia and New Zealand, the proportion of ART treatment cycles that used ICSI continued to increase, from 57.2% of cycles in 2007 to 63.2% in 2011 (Table 43). The number and proportion of blastocyst transfer cycles increased from 33.7% in 2007 to 57.7% in 2011 (Table 43).
Table 43: Number of embryo transfer cycles by treatment type, Australia and New Zealand, 2007 to 2011
2007
2008
2009
2010
2011
Treatment type/procedure Number
Per cent Number
Per cent Number
Per cent Number
Per cent Number
Per cent
Fertilisation procedure
IVF 18,774 40.4
19,761 39.1
21,790 38
18,237 36.1
18,873 35.1
ICSI 26,611 57.2
29,864 59
34,489 60.2
31,564 62.4
34,006 63.2
Not stated 1,128 2.4
944 1.9
1,028 1.8
769 1.5
922 1.7
Stage of embryo development
Cleavage stage 30,846 66.3
29,352 58.0
28,780 50.2
24,200 47.9
22,760 42.3
Blastocyst 15,667 33.7 21,217 42.0 28,527 49.8 26,370 52.1 31,041 57.7
Note: The 2007 and 2008 ANZARD data have been updated to correct the previously reported misclassification error of cleavage and blastocyst transfer. The numbers and percentages of cleavage embryo and blastocyst transfer cycles for 2007 and 2008 are different from previous annual reports.
Number of embryos transferred per embryo transfer cycle There has been an ongoing shift in ART practice to SET cycles in Australia and New Zealand. In 2007, the proportion of SET cycles accounted for 63.7% of embryo transfer cycles and by 2011 this proportion had increased to 73.2% (Table 44).
Table 44: Proportion of embryo transfer cycles by number of embryos transferred, Australia and New Zealand, 2007 to 2011
Number of embryos transferred 2007 2008 2009 2010 2011
One embryo 63.7 67.8 69.7 69.6 73.2
Two embryos 35.7 31.6 29.6 29.5 26.0
Three or more embryos 0.6 0.6 0.7 0.8 0.7
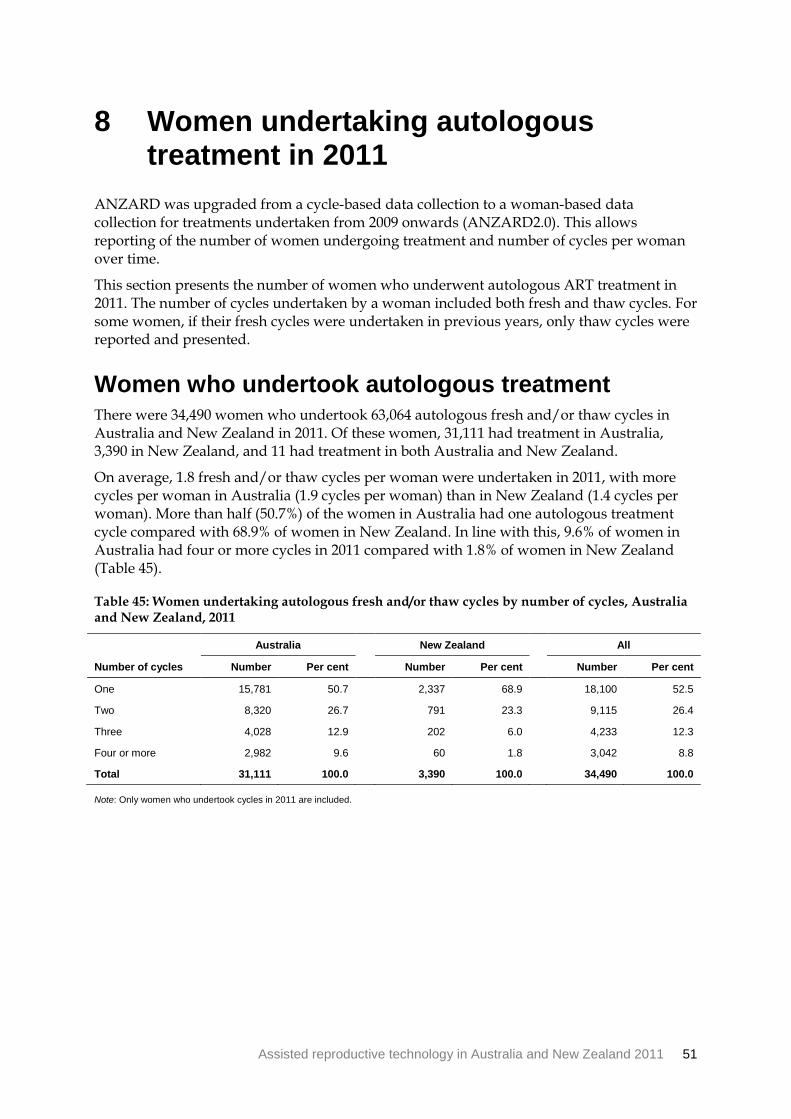
Assisted reproductive technology in Australia and New Zealand 2011 51
8 Women undertaking autologous treatment in 2011 ANZARD was upgraded from a cycle-based data collection to a woman-based data collection for treatments undertaken from 2009 onwards (ANZARD2.0). This allows reporting of the number of women undergoing treatment and number of cycles per woman over time.
This section presents the number of women who underwent autologous ART treatment in 2011. The number of cycles undertaken by a woman included both fresh and thaw cycles. For some women, if their fresh cycles were undertaken in previous years, only thaw cycles were reported and presented.
Women who undertook autologous treatment There were 34,490 women who undertook 63,064 autologous fresh and/or thaw cycles in Australia and New Zealand in 2011. Of these women, 31,111 had treatment in Australia, 3,390 in New Zealand, and 11 had treatment in both Australia and New Zealand.
On average, 1.8 fresh and/or thaw cycles per woman were undertaken in 2011, with more cycles per woman in Australia (1.9 cycles per woman) than in New Zealand (1.4 cycles per woman). More than half (50.7%) of the women in Australia had one autologous treatment cycle compared with 68.9% of women in New Zealand. In line with this, 9.6% of women in Australia had four or more cycles in 2011 compared with 1.8% of women in New Zealand (Table 45).
Table 45: Women undertaking autologous fresh and/or thaw cycles by number of cycles, Australia and New Zealand, 2011
Number of cycles
Australia
New Zealand
All
Number Per cent Number Per cent Number Per cent
One 15,781 50.7
2,337 68.9
18,100 52.5
Two 8,320 26.7
791 23.3
9,115 26.4
Three 4,028 12.9
202 6.0
4,233 12.3
Four or more 2,982 9.6
60 1.8
3,042 8.8
Total 31,111 100.0 3,390 100.0 34,490 100.0
Note: Only women who undertook cycles in 2011 are included.

52 Assisted reproductive technology in Australia and New Zealand 2011
Women who undertook autologous fresh cycles There were 40,696 fresh cycles undertaken by 28,053 women in Australia and New Zealand in 2011, an average of 1.5 fresh cycles per woman. Younger women had fewer fresh cycles with about 78% of women aged under 30 having only one autologous fresh cycle. This partly reflects the higher success rate per initiated fresh autologous cycle among younger women, and the fact that younger women tend to have more cryopreserved embryos available for subsequent thaw cycles. Less than 1% of women aged under 30 had four or more cycles. This proportion increased to 5.6% for women aged 40 to 44 and 7.4% for women aged 45 or older (Table 46).
Table 46: Women undertaking autologous fresh cycles by number of cycles, Australia and New Zealand, 2011
Age group (years)(a)
Number of cycles < 30 30–34 35–39 40–44 ≥ 45 All
Number
One 2,676 5,728 6,852 3,658 280 19,194
Two 630 1,555 2,317 1,590 108 6,200
Three 112 362 706 637 48 1,865
Four or more 18 117 277 347 35 794
Total 3,436 7,762 10,152 6,232 471 28,053
Per cent
One 77.9 73.8 67.5 58.7 59.4 68.4
Two 18.3 20.0 22.8 25.5 22.9 22.1
Three 3.3 4.7 7.0 10.2 10.2 6.6
Four or more 0.5 1.5 2.7 5.6 7.4 2.8
Total 100.0 100.0 100.0 100.0 100.0 100.0
(a) Age at start of first autologous fresh cycle in 2011.

Assisted reproductive technology in Australia and New Zealand 2011 53
Women who undertook autologous thaw cycles There were 22,368 thaw cycles undertaken by 15,063 women in Australia and New Zealand in 2011, representing an average of 1.5 thaw cycles per woman. The proportion of women who had only one thaw cycle increased from 65.4% for women aged under 30 to 81.5% in women aged 45 or older (Table 47). A higher proportion of younger women had two or more thaw cycles, while a higher proportion of older women underwent two or more fresh cycles (Tables 46 and 47).
Table 47: Women undertaking autologous thaw cycles by number of cycles, Australia and New Zealand, 2011
Age group (years)(a)
Number of cycles < 30 30–34 35–39 40–44 ≥ 45 All
Number
One 1,101 3,018 3,799 1,965 203 10,086
Two 396 1,082 1,338 542 33 3,391
Three 127 323 440 171 11 1,072
Four or more 60 175 189 88 2 514
Total 1,684 4,598 5,766 2,766 249 15,063
Per cent
One 65.4 65.6 65.9 71.0 81.5 67.0
Two 23.5 23.5 23.2 19.6 13.3 22.5
Three 7.5 7.0 7.6 6.2 4.4 7.1
Four or more 3.6 3.8 3.3 3.2 0.8 3.4
Total 100.0 100.0 100.0 100.0 100.0 100.0
(a) Age at start of first autologous thaw cycle in 2011.

54 Assisted reproductive technology in Australia and New Zealand 2011
9 Cumulative success rates for women undertaking autologous treatment 2009–2011
Previous chapters in this report have measured the outcomes of ART treatment on a per cycle basis. A limitation of this measurement is that it does not account for the potential need for multiple ART cycles to achieve a live birth. In contrast, cumulative success (clinical pregnancy and live delivery) rates are a longitudinal measure of ART treatment outcomes over a number of treatment cycles or over a specific time period, and provide more comprehensive information on the efficacy of ART treatment than cycle-based measures.
This chapter presents the cumulative success rates for a cohort of women who started their first autologous fresh ART treatment cycle during 2009–2011. Women in this cohort were followed from the start of their first fresh cycle through subsequent fresh and thaw cycles until 31 December 2011 or delivery of a liveborn baby before 31 October 2012. Women without a live delivery following an ART treatment cycle during 2009–2011 might or might not have returned for subsequent treatment cycles during this period. These women might have had additional treatment cycles after 2011 and their treatment information and resulting outcomes will be captured in subsequent annual reports. Therefore, in this dynamic cohort of women undergoing their first autologous fresh ART treatment during 2009–2011, the cumulative success rates may increase over time as more women return for treatment at a later date
The cumulative clinical pregnancy rate was calculated using total number of clinical pregnancies following fresh and frozen/thawed embryo transfer cycles divided by total number of women. The cumulative live delivery rate was calculated using total number of live deliveries following either fresh or frozen/thawed embryo transfer cycles divided by total number of women.
The following example demonstrates how the cumulative live delivery rate is calculated.
• There are 120 women who undertake their first fresh cycle. Of these, 36 women have live delivery and 84 women do not. The cumulative live delivery rate after the first cycle is 30.0% (36/120).
• If 80 of the remaining 84 women undertake their second fresh or thaw cycle, and 12 women have a live delivery and 68 women do not, the cumulative live delivery rate after two cycles is 40.0% ((36+12)/120).
• If 60 of the remaining 68 women undertake their third fresh or thaw cycle, and 8 women have a live delivery and 52 women do not, the cumulative live delivery rate after three cycles is 46.7% ((36+12+8)/120).
• If 45 of the remaining 52 women undertake their fourth fresh or thaw cycle, and 5 women have a live delivery and 40 women do not, the cumulative live delivery rate after four cycles is 50.8% ((36+12+8+5)/120).
Continuing the above calculation, the cumulative live delivery rate can be measured after five, six or even ten cycles. Note, that the above example only considers live deliveries following ART treatment. It does not include live deliveries following other fertility

Assisted reproductive technology in Australia and New Zealand 2011 55
treatment or spontaneous conception. For example, women who did not return for ART treatment and may then have conceived spontaneously and had a live delivery will not be captured in this data.
Number of cycles by women’s age group For cycles where the SLK was available during 2009–2011, 44,668 women in Australia and New Zealand undertook their first autologous fresh cycle (Table 48). By the end of 2011, 100,820 cycles were undertaken by these women, giving an average of 2.3 cycles per woman. It is important to note that these only included cycles undertaken during 2009–2011.
More than 90% of women had less than five cycles during the three year period.
Table 48: Number of cycles by women’s age group, Australia and New Zealand, 2009–2011
Age group (years)(a)
Number of cycles < 30 30–34 35–39 40–44 ≥ 45 All
Number
One 3,280 6,339 6,698 3,165 288 19,770
Two 1,722 3,315 4,046 2,019 127 11,229
Three 844 1,731 2,244 1,207 51 6,077
Four 461 947 1,253 669 38 3,368
Five 240 482 679 397 16 1,814
Six 130 258 388 219 10 1,005
Seven 61 160 212 140 5 578
Eight 42 107 112 88 4 353
Nine 23 51 78 56 2 210
Ten or more 24 48 102 88 2 264
Total 6,827 13,438 15,812 8,048 543 44,668
Per cent
One 48.0 47.2 42.4 39.3 53.0 44.3
Two 25.2 24.7 25.6 25.1 23.4 25.1
Three 12.4 12.9 14.2 15.0 9.4 13.6
Four 6.8 7.0 7.9 8.3 7.0 7.5
Five 3.5 3.6 4.3 4.9 2.9 4.1
Six 1.9 1.9 2.5 2.7 1.8 2.2
Seven 0.9 1.2 1.3 1.7 0.9 1.3
Eight 0.6 0.8 0.7 1.1 0.7 0.8
Nine 0.3 0.4 0.5 0.7 0.4 0.5
Ten or more 0.4 0.4 0.6 1.1 0.4 0.6
Total 100.0 100.0 100.0 100.0 100.0 100.0
(a) Age at start of first autologous fresh cycle.
Note: Some women may return for additional treatments after 2011, so the number of subsequent treatment cycles may increase over time.

56 Assisted reproductive technology in Australia and New Zealand 2011
Cumulative pregnancy and live delivery rates The overall cumulative pregnancy rate was 54.5% (Table 49). Women aged less than 30 and 30–34 had higher cumulative pregnancy rates (64.3% and 66.1% respectively) than older women. For women aged 45 or older, the cumulative pregnancy rate was 3.5%.
Similarly, the cumulative live delivery rate decreased with advancing women’s age from over 50% for women aged less than 35, to 40.7% for women aged 35–39, 16.4% for women aged 40–44 and 1.7% for women aged 45 or older (Table 49).
Table 49: Cumulative pregnancy and live delivery rates by women’s age group, Australia and New Zealand, 2009–2011
Age group (years)(a)
Number of cycles < 30 30–34 35–39 40–44 ≥ 45 All
Number of women 6,827 13,438 15,812 8,048 543 44,668
Number of pregnancies 4,391 8,883 8,676 2,363 19 24,332
By fresh embryo transfer 3,139 6,514 6,438 1,843 18 17,952
By thawed embryo transfer 1,252 2,369 2,238 520 1 6,380
Number of live deliveries 3,582 7,222 6,443 1,323 9 18,579
By fresh embryo transfer 2,598 5,349 4,786 1,036 8 13,777
By thawed embryo transfer 984 1,873 1,657 287 1 4,802
Cumulative pregnancy rate 64.3 66.1 54.9 29.4 3.5 54.5
Cumulative live delivery rate 52.5 53.7 40.7 16.4 1.7 41.6
(a) Age at start of first autologous fresh cycle.
Note: Some women may return for subsequent treatment after 2011, so the cumulative pregnancy and live delivery rates may increase over time.
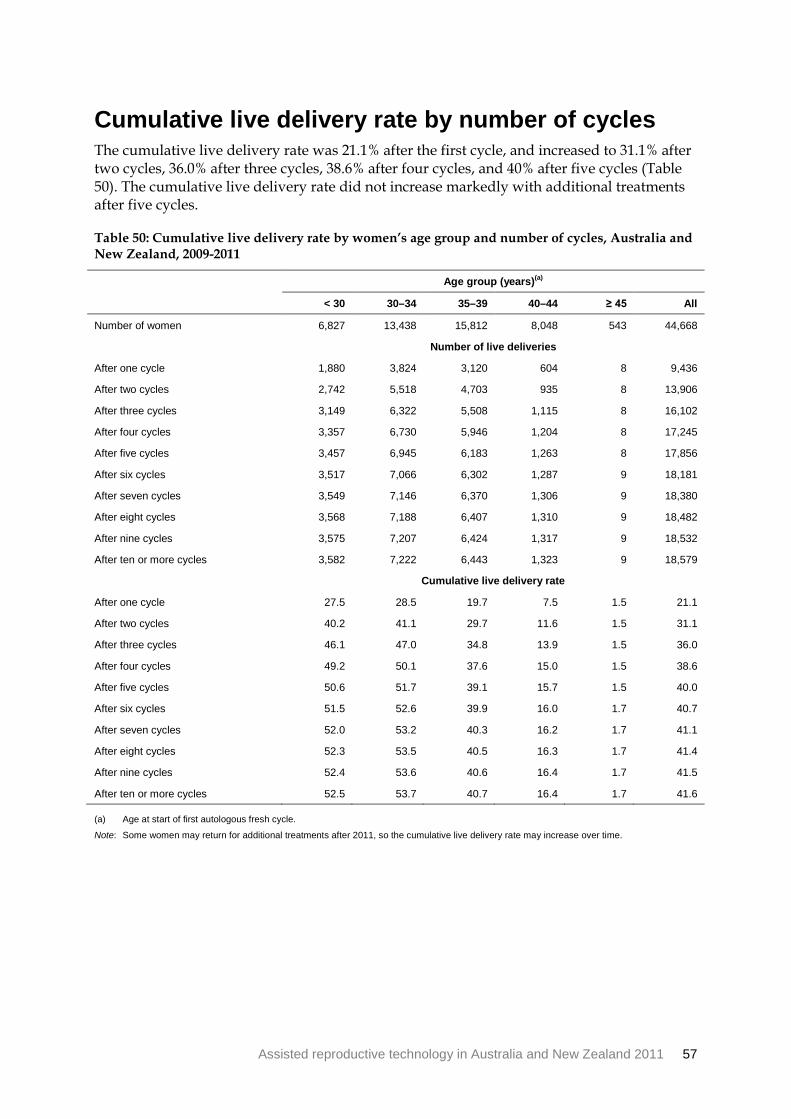
Assisted reproductive technology in Australia and New Zealand 2011 57
Cumulative live delivery rate by number of cycles The cumulative live delivery rate was 21.1% after the first cycle, and increased to 31.1% after two cycles, 36.0% after three cycles, 38.6% after four cycles, and 40% after five cycles (Table 50). The cumulative live delivery rate did not increase markedly with additional treatments after five cycles.
Table 50: Cumulative live delivery rate by women’s age group and number of cycles, Australia and New Zealand, 2009-2011
Age group (years)(a)
< 30 30–34 35–39 40–44 ≥ 45 All
Number of women 6,827 13,438 15,812 8,048 543 44,668
Number of live deliveries
After one cycle 1,880 3,824 3,120 604 8 9,436
After two cycles 2,742 5,518 4,703 935 8 13,906
After three cycles 3,149 6,322 5,508 1,115 8 16,102
After four cycles 3,357 6,730 5,946 1,204 8 17,245
After five cycles 3,457 6,945 6,183 1,263 8 17,856
After six cycles 3,517 7,066 6,302 1,287 9 18,181
After seven cycles 3,549 7,146 6,370 1,306 9 18,380
After eight cycles 3,568 7,188 6,407 1,310 9 18,482
After nine cycles 3,575 7,207 6,424 1,317 9 18,532
After ten or more cycles 3,582 7,222 6,443 1,323 9 18,579
Cumulative live delivery rate
After one cycle 27.5 28.5 19.7 7.5 1.5 21.1
After two cycles 40.2 41.1 29.7 11.6 1.5 31.1
After three cycles 46.1 47.0 34.8 13.9 1.5 36.0
After four cycles 49.2 50.1 37.6 15.0 1.5 38.6
After five cycles 50.6 51.7 39.1 15.7 1.5 40.0
After six cycles 51.5 52.6 39.9 16.0 1.7 40.7
After seven cycles 52.0 53.2 40.3 16.2 1.7 41.1
After eight cycles 52.3 53.5 40.5 16.3 1.7 41.4
After nine cycles 52.4 53.6 40.6 16.4 1.7 41.5
After ten or more cycles 52.5 53.7 40.7 16.4 1.7 41.6
(a) Age at start of first autologous fresh cycle.
Note: Some women may return for additional treatments after 2011, so the cumulative live delivery rate may increase over time.

58 Assisted reproductive technology in Australia and New Zealand 2011
Appendix A: Contributing fertility clinics
Australian Capital Territory Canberra Fertility Centre, Deakin (Dr Martyn Stafford-Bell)
ISIS Fertility, Barton (Dr Nicole Sides)
Genea—Canberra, Deakin (Associate Professor Mark Bowman)
New South Wales Demeter Laboratories, Liverpool (Dr David Knight)
Fertility East, Bondi Junction (Dr Joel Bernstein)
Fertility First, Hurstville (Dr Anne Clark)
IVF Australia—Hunter, New Lambton Heights (Dr Steven Raymond, Dr Andrew Hedges)
IVF Australia—Central Coast, Gosford (Dr Malcolm Tucker)
IVF Australia—East, Maroubra (Dr Graeme Hughes)
IVF Australia—North, Greenwich (Dr Frank Quinn)
IVF Australia—Southern Sydney, Kogarah (Dr Andrew Kan)
IVF Australia—West, Westmead (Associate Professor Peter Illingworth)
Next Generation Fertility, Parramatta (Dr Kim Matthews)
Reproductive Medicine Albury, Albury (Dr Scott Giltrap)
Royal Hospital for Women, Randwick (Dr Stephen Steigrad)
Genea, Sydney (Associate Professor Mark Bowman)
Genea—Coffs Harbour, Coffs Harbour (Associate Professor Mark Bowman)
Genea—Illawarra, Wollongong (Associate Professor Mark Bowman
Genea—Lismore, Lismore (Associate Professor Mark Bowman)
Genea—Liverpool, Liverpool (Associate Professor Mark Bowman)
Genea—Newcastle, Merewether (Associate Professor Mark Bowman)
Genea—Northwest, Baulkham Hills (Associate Professor Mark Bowman)
Genea—Orange, Orange (Associate Professor Mark Bowman)
Genea—RPAH, Camperdown (Associate Professor Mark Bowman)
Westmead Fertility Centre, Westmead (Dr Howard Smith)
Northern Territory Repromed Darwin, Tiwi (Dr Richard Henshaw)

Assisted reproductive technology in Australia and New Zealand 2011 59
Queensland Assisted Conception Australia, Greenslopes (Dr Clare Boothroyd)
Cairns Fertility Centre, Cairns (Dr John Yovich)
City Fertility Centre, Brisbane (Dr Ashish Das)
City Fertility Centre Southside, Robina (Dr Ashish Das)
City Fertility Centre Southside, Sunnybank (Dr Ashish Das)
Coastal IVF, Maroochydore (Dr Paul Stokes)
Fertility Solutions Sunshine Coast, Nambour (Dr James Orford)
Fertility Solutions Bundaberg, Bundaberg (Dr James Orford)
IVF Caboolture, Caboolture (Dr James Moir)
IVF Sunshine Coast, Birtinya (Dr James Moir)
Life Fertility Centre, Spring Hill (Dr Glenn Sterling)
Monash IVF Gold Coast, Southport (Dr Irving Korman)
Monash IVF Queensland, Sunnybank (Dr Bruce Dunphy)
Monash IVF Rockhampton, Rockhampton (Professor Gab Kovacs)
Monash IVF Townsville, Townsville (Professor Gab Kovacs)
QFG Cairns, Cairns (Dr Robert Miller)
QFG Gold Coast, Benowa (Dr Andrew Cary)
QFG Mackay, North Mackay (Dr Lance Herron)
QFG Toowoomba IVF, Toowoomba (Dr John Esler)
QFG Townsville, Hyde Park (Dr Ron Chang)
Queensland Fertility Group, Brisbane (Dr David Molloy)
The Wesley/Monash IVF Services, Auchenflower (Dr John Allan)
South Australia City Fertility Centre Adelaide, Henly Beach (Dr Marcin Stankiewicz)
Fertility SA, Adelaide (Dr Jodie Semmler)
Flinders Reproductive Medicine, Bedford Park (Dr Enzo Lombardi)
Repromed, Dulwich (Associate Professor Kelton Tremellen)
Tasmania Genea—Launceston, Launceston (Associate Professor Mark Bowman)
TasIVF, Hobart (Dr Bill Watkins)

60 Assisted reproductive technology in Australia and New Zealand 2011
Victoria Ballarat IVF, Wendouree (Dr Russell Dalton)
City Fertility Centre Melbourne, Melbourne (Dr David Wilkinson)
Melbourne IVF, East Melbourne (Dr Lyndon Hale)
Monash IVF Hawthorn, Hawthorn Hospital, Richmond (Dr Peter Lutjen)
Monash IVF, Bendigo (Dr Mark Jalland)
Monash IVF Clayton, Clayton (Dr Peter Lutjen)
Monash IVF Casterton, Casterton (Professor David Healy)
Monash IVF Geelong, Geelong (Professor Gab Kovacs)
Monash IVF Sale, Sale (Associate Professor Luk Rombauts)
Monash IVF Sunshine, St Albans (Dr Gareth Weston)
Reproductive Services, Parkville (Dr Lyndon Hale)
Western Australia Concept Fertility Centre, Subiaco (Dr Rob Mazzucchelli)
Fertility North, Joondalup (Dr Vince Chapple)
Fertility Specialists South, Attadale (Dr Roger Hart)
Fertility Specialists WA, Claremont (Dr Roger Hart)
Hollywood Fertility Centre, Hollywood (Dr Simon Turner)
PIVET Medical Centre, Leederville (Dr John Yovich)
The Keogh Institute for Medical Research, Nedlands (Dr Bronwyn Stuckey)
New Zealand Fertility Associates, Auckland (Dr Mary Birdsall)
Fertility Associates Hamilton, Hamilton (Dr VP Singh)
Fertility Associates Wellington, Wellington (Dr Andrew Murray)
Fertility Plus, Auckland (Dr Barry Lowe)
Repromed Auckland, Auckland (Dr Guy Gudex)
Repromed Christchurch, Christchurch (Dr Greg Phillipson)
The Otago Fertility Services, Dunedin (Associate Professor Wayne Gillett)

Assisted reproductive technology in Australia and New Zealand 2011 61
Appendix B: Data used in this report The data presented in this report are supplied by 37 fertility centres in Australia and New Zealand and are compiled into ANZARD2.0. ANZARD2.0 includes autologous treatment cycles, treatment involving donated oocytes or embryos and treatment involving surrogacy arrangements. ANZARD2.0 collects data on the use of ART techniques such as ICSI, oocyte/embryo freezing methods, PGD and cleavage/blastocyst transfers. In addition to ART procedures, ANZARD2.0 also collects data on artificial insemination cycles using donated sperm from fertility centres. The outcomes of pregnancies, deliveries and babies born following ART and DI treatments are also maintained in ANZARD2.0. This includes the method of birth, birth status, birthweight, gestational age, plurality, perinatal mortality and selected information on maternal morbidity.
This report presents information on ART and DI treatment cycles that took place in fertility clinics in Australia and New Zealand in 2011, and the resulting pregnancies and births. The babies included in this report were conceived through treatment cycles undertaken in 2011, and were born in either 2011 or 2012.
Data validation Most fertility centres have computerised data information management systems and are able to provide NPESU with high quality data. All data processed by NPESU undergo a validation process, with data queries being followed up with fertility centre staff. In 2011, information relating to pregnancy and birth outcomes was not provided for 0.9% of clinical pregnancies.
The Reproductive Technology Accreditation Committee of FSA also plays a role in ensuring the quality of ANZARD2.0 data by validating selected records against clinic files in their annual inspections.
Data presentation Data presented in Chapters 2 to 7 are for treatment cycles and not women. It is possible for an individual woman to undergo more than one treatment cycle in a year or experience more than one pregnancy. This means that information reported about patient characteristics in Chapters 2 to 7, such as age, parity and cause of infertility, is based on calculations in which individuals may be counted more than once.
The rates of clinical pregnancy and live delivery in Chapters 2 to 7 were measured per initiated cycle. Where the number of initiated cycles was not available, the rates were calculated per embryo transfer cycle.
Where applicable, percentages in tables have been calculated including the ‘Not stated’ category. Throughout the report, for totals, percentages may not add up to 100.0 and, for subtotals, they may not add up to the sum of the percentages for the categories. This is due to rounding error.

62 Assisted reproductive technology in Australia and New Zealand 2011
Data limitations Follow-up of pregnancy and birth outcomes is limited because the ongoing care of pregnant patients is often carried out by non-ART practitioners. The method of follow-up varies by fertility centres and includes follow-up with the patient or clinician or the use of routine data sourced from a health department. In a small proportion of cases this information is not available. For pregnancies in which there is successful follow-up, data are limited by the self-reported nature of the information. Fertility centre staff invest great effort in validating such information by obtaining medical records from clinicians or hospitals.
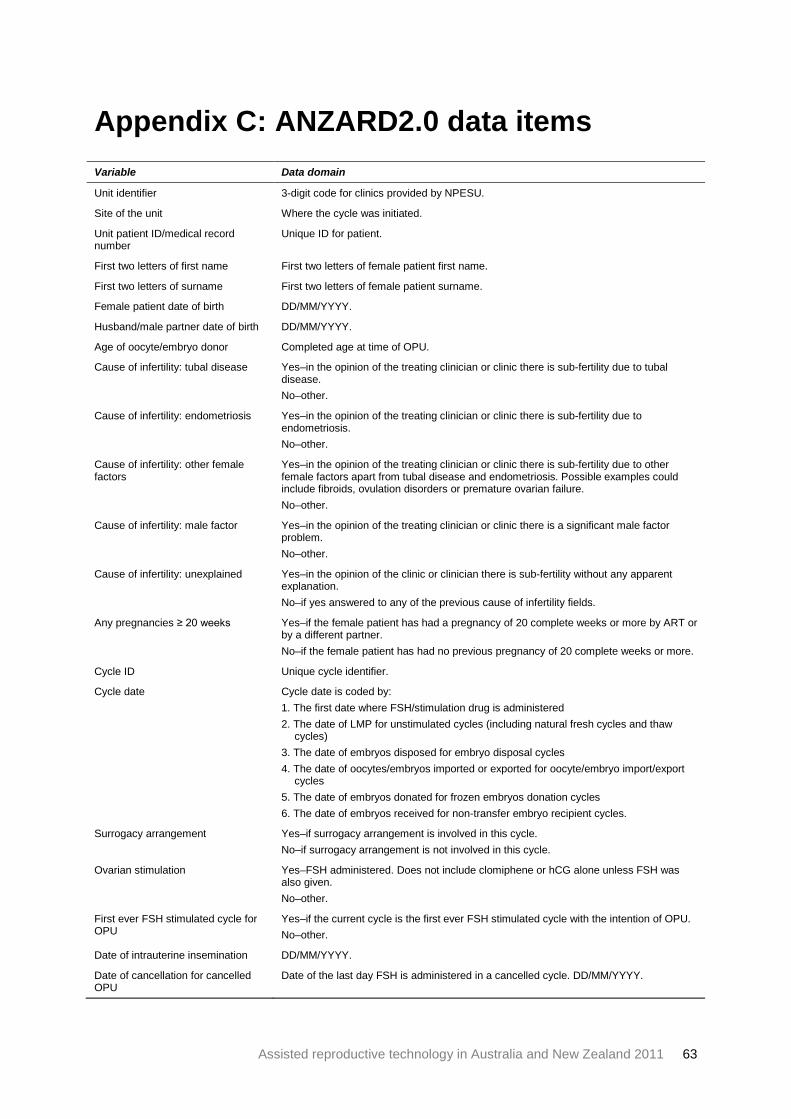
Assisted reproductive technology in Australia and New Zealand 2011 63
Appendix C: ANZARD2.0 data items Variable Data domain
Unit identifier 3-digit code for clinics provided by NPESU.
Site of the unit Where the cycle was initiated.
Unit patient ID/medical record number
Unique ID for patient.
First two letters of first name First two letters of female patient first name.
First two letters of surname First two letters of female patient surname.
Female patient date of birth DD/MM/YYYY.
Husband/male partner date of birth DD/MM/YYYY.
Age of oocyte/embryo donor Completed age at time of OPU.
Cause of infertility: tubal disease Yes–in the opinion of the treating clinician or clinic there is sub-fertility due to tubal disease. No–other.
Cause of infertility: endometriosis Yes–in the opinion of the treating clinician or clinic there is sub-fertility due to endometriosis. No–other.
Cause of infertility: other female factors
Yes–in the opinion of the treating clinician or clinic there is sub-fertility due to other female factors apart from tubal disease and endometriosis. Possible examples could include fibroids, ovulation disorders or premature ovarian failure. No–other.
Cause of infertility: male factor Yes–in the opinion of the treating clinician or clinic there is a significant male factor problem. No–other.
Cause of infertility: unexplained Yes–in the opinion of the clinic or clinician there is sub-fertility without any apparent explanation. No–if yes answered to any of the previous cause of infertility fields.
Any pregnancies ≥ 20 weeks Yes–if the female patient has had a pregnancy of 20 complete weeks or more by ART or by a different partner. No–if the female patient has had no previous pregnancy of 20 complete weeks or more.
Cycle ID Unique cycle identifier.
Cycle date Cycle date is coded by: 1. The first date where FSH/stimulation drug is administered 2. The date of LMP for unstimulated cycles (including natural fresh cycles and thaw cycles) 3. The date of embryos disposed for embryo disposal cycles 4. The date of oocytes/embryos imported or exported for oocyte/embryo import/export cycles 5. The date of embryos donated for frozen embryos donation cycles 6. The date of embryos received for non-transfer embryo recipient cycles.
Surrogacy arrangement Yes–if surrogacy arrangement is involved in this cycle. No–if surrogacy arrangement is not involved in this cycle.
Ovarian stimulation Yes–FSH administered. Does not include clomiphene or hCG alone unless FSH was also given. No–other.
First ever FSH stimulated cycle for OPU
Yes–if the current cycle is the first ever FSH stimulated cycle with the intention of OPU. No–other.
Date of intrauterine insemination DD/MM/YYYY.
Date of cancellation for cancelled OPU
Date of the last day FSH is administered in a cancelled cycle. DD/MM/YYYY.

64 Assisted reproductive technology in Australia and New Zealand 2011
Variable Data domain
OPU date Date of oocyte pickup.
Number of eggs retrieved Number of eggs retrieved at OPU.
Number of eggs donated Number of eggs donated to someone else.
Number of eggs received Number of eggs received from someone else.
Number of eggs imported Records number of oocytes imported into the current unit from another unit.
Number of eggs exported Records number of oocytes exported from the current unit into another unit.
Number of oocytes slow frozen Number of oocytes frozen by slow freezing method in this cycle.
Number of oocytes vitrified Number of oocytes frozen by vitrification in this cycle.
Number of slow frozen oocytes thawed
Number of slow frozen oocytes thawed in this cycle.
Number of vitrified oocytes warmed Number of vitrified oocytes warmed in this cycle.
Freezing date of thawed/warmed oocytes
DD/MM/YYYY.
Number of eggs GIFT Number of eggs replaced in a GIFT procedure.
Number of eggs IVF Number of eggs treated (inseminated) with IVF.
Number of eggs ICSI Number of eggs treated with ICSI.
Site of sperm used Site of sperm extraction: ejaculated, epididymal (whether by open biopsy or by PESA), testicular or other.
Person who provided sperm Husband/partner (h), known donor (k), anonymous donor (a), unknown (u).
Number of eggs fertilised normally Number of eggs fertilised normally.
Preimplantation genetic diagnosis Yes–preimplantation genetic diagnosis in any form (including aneuploidy screening or sex selection) has been performed on any of the embryos (transferred or not). No–PGD not performed.
Assisted hatching Yes–where assisted hatching in any form has been performed on any of the embryos (transferred or not). No–assisted hatching not performed.
Number of embryos imported from another clinic
Records number of embryos imported into the unit from another unit.
Number of embryos received from another patient/ clinic
Records the number of embryos that a patient/couple received from another patient/couple.
Number of slow frozen cleavage embryos thawed
Number of slow frozen cleavage embryos thawed with the intention of performing an embryo transfer.
Number of vitrified cleavage embryos warmed
Number of vitrified cleavage embryos warmed with the intention of performing an embryo transfer.
Number of slow frozen blastocysts thawed
Number of slow frozen blastocysts thawed with the intention of performing an embryo transfer.
Number of vitrified blastocysts warmed
Number of vitrified blastocyst embryos warmed with the intention of performing an embryo transfer.
Freezing date of thawed/warmed embryos
Freezing date of thawed/warmed embryos.
Thawed/warmed embryos originally from oocyte donor or embryo donor
o–embryo from donated oocyte. e–donated embryo.
ET date Embryo transfer date.
Number of cleavage embryos transferred
Number of cleavage stage embryos transferred.
Number of blastocyst transferred Number of blastocyst stage embryos transferred.
Any embryos ICSI? Yes–any embryos transferred were fertilised by ICSI. No–no transferred embryos were fertilised by ICSI.
Number of cleavage embryos slow Number of cleavage embryos frozen by slow freezing method in this cycle.
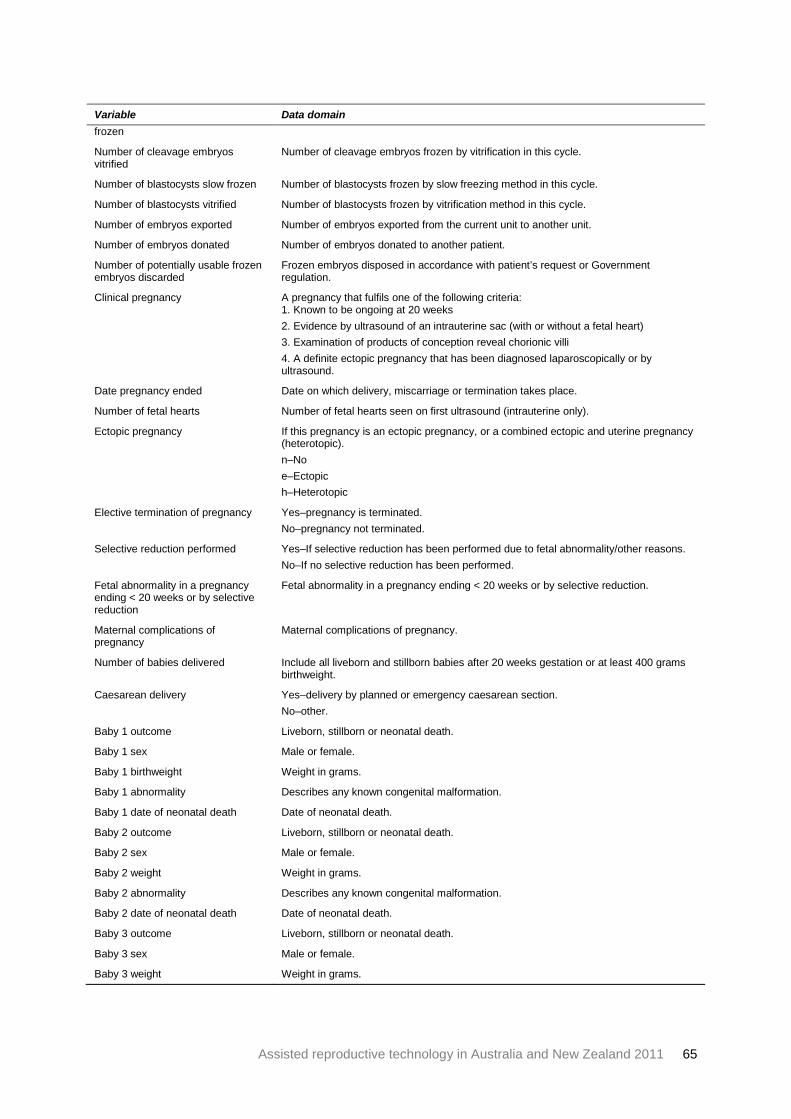
Assisted reproductive technology in Australia and New Zealand 2011 65
Variable Data domain frozen
Number of cleavage embryos vitrified
Number of cleavage embryos frozen by vitrification in this cycle.
Number of blastocysts slow frozen Number of blastocysts frozen by slow freezing method in this cycle.
Number of blastocysts vitrified Number of blastocysts frozen by vitrification method in this cycle.
Number of embryos exported Number of embryos exported from the current unit to another unit.
Number of embryos donated Number of embryos donated to another patient.
Number of potentially usable frozen embryos discarded
Frozen embryos disposed in accordance with patient’s request or Government regulation.
Clinical pregnancy A pregnancy that fulfils one of the following criteria: 1. Known to be ongoing at 20 weeks 2. Evidence by ultrasound of an intrauterine sac (with or without a fetal heart) 3. Examination of products of conception reveal chorionic villi 4. A definite ectopic pregnancy that has been diagnosed laparoscopically or by ultrasound.
Date pregnancy ended Date on which delivery, miscarriage or termination takes place.
Number of fetal hearts Number of fetal hearts seen on first ultrasound (intrauterine only).
Ectopic pregnancy If this pregnancy is an ectopic pregnancy, or a combined ectopic and uterine pregnancy (heterotopic). n–No e–Ectopic h–Heterotopic
Elective termination of pregnancy Yes–pregnancy is terminated. No–pregnancy not terminated.
Selective reduction performed Yes–If selective reduction has been performed due to fetal abnormality/other reasons. No–If no selective reduction has been performed.
Fetal abnormality in a pregnancy ending < 20 weeks or by selective reduction
Fetal abnormality in a pregnancy ending < 20 weeks or by selective reduction.
Maternal complications of pregnancy
Maternal complications of pregnancy.
Number of babies delivered Include all liveborn and stillborn babies after 20 weeks gestation or at least 400 grams birthweight.
Caesarean delivery Yes–delivery by planned or emergency caesarean section. No–other.
Baby 1 outcome Liveborn, stillborn or neonatal death.
Baby 1 sex Male or female.
Baby 1 birthweight Weight in grams.
Baby 1 abnormality Describes any known congenital malformation.
Baby 1 date of neonatal death Date of neonatal death.
Baby 2 outcome Liveborn, stillborn or neonatal death.
Baby 2 sex Male or female.
Baby 2 weight Weight in grams.
Baby 2 abnormality Describes any known congenital malformation.
Baby 2 date of neonatal death Date of neonatal death.
Baby 3 outcome Liveborn, stillborn or neonatal death.
Baby 3 sex Male or female.
Baby 3 weight Weight in grams.

66 Assisted reproductive technology in Australia and New Zealand 2011
Variable Data domain
Baby 3 abnormality Describes any known congenital malformation.
Baby 3 date of neonatal death Date of neonatal death.
Baby 4 outcome Liveborn, stillborn or neonatal death.
Baby 4 sex Male or female.
Baby 4 weight Weight in grams.
Baby 4 abnormality Describes any known congenital malformation.
Baby 4 date of neonatal death Date of neonatal death.
Admitted with ART morbidity Yes–woman is admitted to hospital with any condition (excluding any pregnancy-related issues, such as ectopic pregnancy) that could be in any way related to fertility treatment.
OHSS Yes–admission to hospital is due to symptoms of OHSS.
Morbidity detail Describes symptoms of treatment-related morbidity.
Postcode Postcode of patient residential area.
Comments Any comments on this cycle.

Assisted reproductive technology in Australia and New Zealand 2011 67
Glossary This report categorises ART treatments according to whether a woman used her own oocytes or embryos, or oocytes/embryos were donated by another woman/couple, and whether the embryos were transferred soon after fertilisation or following cryopreservation.
Artificial insemination: a range of techniques of placing sperm into the female genital tract, and can be used with controlled ovarian hyperstimulation or in unstimulated cycles. These techniques are referred to as ‘donor insemination’ (DI) in this report.
ART (assisted reproductive technology): treatments or procedures that involve the in vitro handling of human oocytes (eggs) and sperm or embryos for the purposes of establishing a pregnancy. ART does not include artificial insemination.
Assisted hatching: when the outer layer of the embryo, the zona pellucida, is either thinned or perforated in the laboratory to aid ‘hatching’ of the embryo, the aim being to potentially improve the chance of implantation in the uterus.
Autologous cycle: an ART treatment cycle in which a woman intends to use, or uses her own oocytes or embryos. GIFT cycles are classified separately from autologous cycles.
Blastocyst: an embryo comprising about 100 cells usually developed by 5 or 6 days after fertilisation.
Caesarean section: an operative delivery by surgical incision through the abdominal wall and uterus.
Cleavage stage embryo: an embryo comprising about 8 cells usually developed by 2 or 3 days after fertilisation.
Clinical pregnancy: a pregnancy in which at least one of the following criteria is met:
• known to be ongoing at 20 weeks • evidence by ultrasound of an intrauterine sac (with or without a fetal heart) • examination of products of conception reveal chorionic villi, or • an ectopic pregnancy has been diagnosed by laparoscope or by ultrasound. Controlled ovarian hyperstimulation: medical treatment to induce the development of multiple ovarian follicles in order to obtain multiple oocytes at oocyte pick-up (OPU).
Cryopreservation: freezing embryos for potential future ART treatment.
Delivery: a birth event in which one or more babies of 20 weeks or more gestation or of 400 grams or more birthweight are born.
DI (donor insemination) cycle: an artificial insemination cycle in which sperm not from the woman’s partner (donor sperm) is used.
Discontinued cycle: an ART cycle that does not proceed to oocyte pick-up (OPU) or embryo transfer.
Donation cycle: an ART treatment cycle where a woman intends to donate, or donates her oocytes to others. A donation cycle may result in the donation of either oocytes or embryos to a recipient woman. The use of donor sperm does not alter the donor status of the cycle.

68 Assisted reproductive technology in Australia and New Zealand 2011
Ectopic pregnancy: a pregnancy in which implantation takes place outside the uterine cavity.
Embryo: an egg that has been fertilised by a sperm and has undergone one or more divisions.
Embryo transfer: a procedure whereby embryo(s) are placed in the uterus or fallopian tube. The embryo(s) can be fresh or thawed following cryopreservation, and may include the transfer of cleavage stage embryos or blastocysts.
Fetal death (stillbirth): the birth of an infant after 20 or more weeks gestation or 400 grams or more birthweight that shows no signs of life.
Fresh cycle: an ART treatment cycle that intends to use, or uses embryo(s) that have not been cryopreserved (frozen).
Gestational age: the completed weeks of gestation of the fetus. This is calculated as follows:
• Cycles with embryos transferred: (pregnancy end date – embryo transfer date + 16 days) for transfer of cleavage stage embryos and (pregnancy end date – embryo transfer date + 19 days) for transfer of blastocysts.
• GIFT cycles: (pregnancy end date – OPU date) + 14 days. • DI cycles: (pregnancy end date – date of insemination) + 14 days. GIFT (gamete intrafallopian transfer): an ART treatment where mature oocytes and sperm are placed directly into a woman’s fallopian tubes so that in vivo fertilisation may take place. GIFT cycles are classified separately from autologous cycles.
Heterotopic pregnancy: a double gestation pregnancy in which implantation takes place both inside and outside the uterine cavity.
ICSI (intracytoplasmic sperm injection): a procedure whereby a single sperm is injected directly into the oocyte to aid fertilisation. If an embryo transfer cycle involves the transfer of at least one embryo created using ICSI, it is counted as an ICSI cycle.
IVF (in vitro fertilisation): an ART procedure that involves extracorporeal fertilisation.
Live birth: according to the World Health Organization (WHO) definition, a live birth is defined as the complete expulsion or extraction from its mother of a product of conception irrespective of the duration of the pregnancy, after such separation, breathes or shows any other evidence of life, such as beating of the heart, pulsation of the umbilical cord, or definite movement of the voluntary muscles, whether or not the umbilical cord has been cut or the placenta is attached; each product of such a birth is considered liveborn. In this report, live births are included if they meet the WHO definition and if they are of 20 weeks or more gestation or 400 grams or more birthweight.
Live delivery: a live delivery is the delivery of one or more liveborn infants, with the birth of twins, triplets or more counted as one live delivery.
Low birthweight: a birthweight of less than 2,500 grams.
OHSS (ovarian hyperstimulation syndrome): the complication of ovulation stimulation therapy, which involves the administration of follicle stimulating hormone (FSH). OHSS symptoms include abdominal pain and fluid retention.
Oocyte (egg): a female reproductive cell.

Assisted reproductive technology in Australia and New Zealand 2011 69
OPU (oocyte pick-up): the procedure to collect oocytes from ovaries, usually by ultrasound-guided transvaginal aspiration and rarely by laparoscopic surgery.
Parity: a classification of a woman in terms of the number of previous pregnancies experienced that reached 20 weeks or more gestation.
Parous: refers to a woman who has had at least one previous pregnancy of 20 weeks or more gestation.
PGD (preimplantation genetic diagnosis): a procedure where embryonic cells are removed and screened for chromosomal disorders or genetic diseases before embryo transfer.
Nulliparous: refers to a woman who has never had a pregnancy of 20 weeks or more gestation.
Perinatal death: a fetal death (stillbirth) or neonatal death of at least 20 weeks gestation or at least 400 grams birthweight.
Preterm: a gestation of less than 37 weeks.
Recipient cycle: an ART treatment cycle in which a woman receives oocytes or embryos from another woman.
Secondary sex ratio: the number of male liveborn babies per 100 female liveborn babies.
Surrogacy arrangement: an arrangement where a woman, known as the ‘gestational carrier’ agrees to carry a child for another person or couple, known as the ‘intended parent(s)’, with the intention that the child will be raised by the intended parent(s). The oocytes and/or sperm used to create the embryo(s) in the surrogacy cycle can be either from the intended parents or from a donor(s).
Thaw cycle: an ART treatment cycle in which cryopreserved embryos are thawed with the intention of performing embryo transfer.
Thawed embryo: an embryo thawed after cryopreservation. It is used in thaw cycles.
Vitrification: an ultra-rapid cryopreservation method that prevents ice formation within the suspension which is converted to a glass-like solid.
Note: The International Committee Monitoring Assisted Reproductive Technologies (ICMART) has published an ART glossary for the terms used in ART data collections (Zegers-Hochschild et al. 2009). However, the terminology used in this report may differ from that in the ICMART glossary.
70 Assisted reproductive technology in Australia and New Zealand 2011
References Australian Bureau of Statistics 2013. Australian demographic statistics. Viewed 1 July 2013, <http://www.abs.gov.au/AUSSTATS/[email protected]/DetailsPage/3101.0Sep%202012?OpenDocument>.
Boivin J, Bunting L, Collins JA & Nygren KG 2007. International estimates of infertility prevalence and treatment-seeking: potential need and demand for infertility medical care. Human Reproduction 22:1506–12.
ICMART (International Committee for Monitoring Assisted Reproductive Technology). Preliminary global ART data for 2008. European Society of Human Embryology and Reproduction Annual Meeting, Istanbul, Turkey 1–4 July 2012.
Li Z, Zeki R, Hilder L & Sullivan EA 2012. Australia’s mothers and babies 2010. Perinatal statistics series no. 27. Cat. no. PER 57. Canberra: AIHW National Perinatal Epidemiology and Statistics Unit.
Macaldowie A, Wang YA, Chambers GM & Sullivan EA 2012. Assisted reproductive technology in Australia and New Zealand 2010. Assisted reproduction technology series. Cat. no. PER 55. Canberra: AIHW.
Statistics New Zealand 2012. National population estimates: September 2012 quarter. Viewed 1 July 2013, <http://www.stats.govt.nz/browse_for_stats/population/estimates_and_projections/NationalPopulationEstimates_HOTPSep12qtr.aspx>.
Zegers-Hochschild F, Adamson GD, de Mouzon J, Ishihara O, Mansour R, Nygren K, Sullivan E, Van der Poel S on behalf of ICMART and WHO 2009. The International Committee Monitoring Assisted Reproductive Technologies (ICMART) and the World Health Organization (WHO) revised glossary on ART terminology. Human Reproduction 24(11):2683–87.
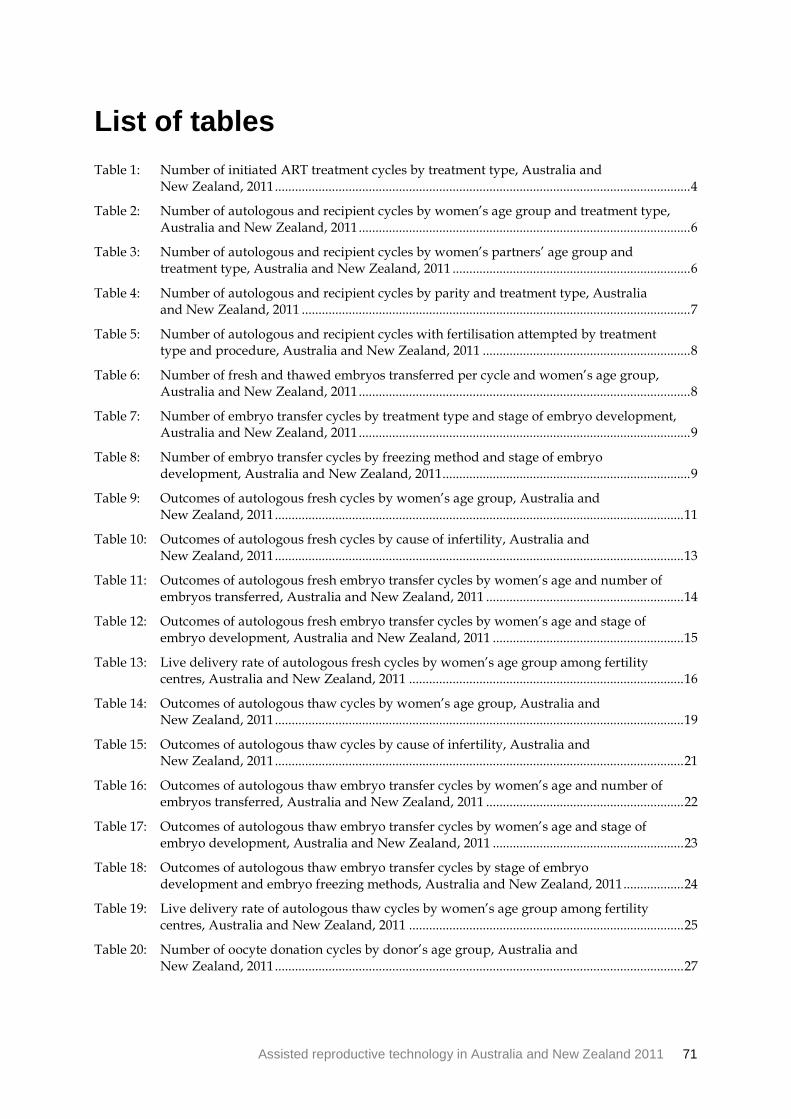
Assisted reproductive technology in Australia and New Zealand 2011 71
List of tables Table 1: Number of initiated ART treatment cycles by treatment type, Australia and
New Zealand, 2011 ............................................................................................................................ 4
Table 2: Number of autologous and recipient cycles by women’s age group and treatment type, Australia and New Zealand, 2011 ................................................................................................... 6
Table 3: Number of autologous and recipient cycles by women’s partners’ age group and treatment type, Australia and New Zealand, 2011 ....................................................................... 6
Table 4: Number of autologous and recipient cycles by parity and treatment type, Australia and New Zealand, 2011 .................................................................................................................... 7
Table 5: Number of autologous and recipient cycles with fertilisation attempted by treatment type and procedure, Australia and New Zealand, 2011 .............................................................. 8
Table 6: Number of fresh and thawed embryos transferred per cycle and women’s age group, Australia and New Zealand, 2011 ................................................................................................... 8
Table 7: Number of embryo transfer cycles by treatment type and stage of embryo development, Australia and New Zealand, 2011 ................................................................................................... 9
Table 8: Number of embryo transfer cycles by freezing method and stage of embryo development, Australia and New Zealand, 2011 .......................................................................... 9
Table 9: Outcomes of autologous fresh cycles by women’s age group, Australia and New Zealand, 2011 .......................................................................................................................... 11
Table 10: Outcomes of autologous fresh cycles by cause of infertility, Australia and New Zealand, 2011 .......................................................................................................................... 13
Table 11: Outcomes of autologous fresh embryo transfer cycles by women’s age and number of embryos transferred, Australia and New Zealand, 2011 ........................................................... 14
Table 12: Outcomes of autologous fresh embryo transfer cycles by women’s age and stage of embryo development, Australia and New Zealand, 2011 ......................................................... 15
Table 13: Live delivery rate of autologous fresh cycles by women’s age group among fertility centres, Australia and New Zealand, 2011 .................................................................................. 16
Table 14: Outcomes of autologous thaw cycles by women’s age group, Australia and New Zealand, 2011 .......................................................................................................................... 19
Table 15: Outcomes of autologous thaw cycles by cause of infertility, Australia and New Zealand, 2011 .......................................................................................................................... 21
Table 16: Outcomes of autologous thaw embryo transfer cycles by women’s age and number of embryos transferred, Australia and New Zealand, 2011 ........................................................... 22
Table 17: Outcomes of autologous thaw embryo transfer cycles by women’s age and stage of embryo development, Australia and New Zealand, 2011 ......................................................... 23
Table 18: Outcomes of autologous thaw embryo transfer cycles by stage of embryo development and embryo freezing methods, Australia and New Zealand, 2011 .................. 24
Table 19: Live delivery rate of autologous thaw cycles by women’s age group among fertility centres, Australia and New Zealand, 2011 .................................................................................. 25
Table 20: Number of oocyte donation cycles by donor’s age group, Australia and New Zealand, 2011 .......................................................................................................................... 27

72 Assisted reproductive technology in Australia and New Zealand 2011
Table 21: Outcomes of oocyte/embryo recipient cycles by treatment type, Australia and New Zealand, 2011 ................................................................................................................................... 29
Table 22: Outcomes of oocyte/embryo recipient cycles by recipient’s age group, Australia and New Zealand, 2011 .................................................................................................................. 29
Table 23: Outcomes of oocyte/embryo recipient cycles by donor’s age group, Australia and New Zealand, 2011 .................................................................................................................. 30
Table 24: Outcomes of oocyte/embryo recipient cycles by recipient’s age and number of embryos transferred, Australia and New Zealand, 2011 ........................................................... 31
Table 25: Outcomes of oocyte/embryo recipient cycles by recipient’s age and stage of embryo development, Australia and New Zealand, 2011 ........................................................................ 32
Table 26: Outcomes of oocyte/embryo recipient thaw cycles by stage of embryo development and embryo freezing methods, Australia and New Zealand, 2011 .......................................... 33
Table 27: Clinical pregnancies by number of fetal hearts and number of embryos transferred, Australia and New Zealand, 2011 ................................................................................................. 34
Table 28: Early pregnancy losses by pregnancy outcome and number of embryos transferred, Australia and New Zealand, 2011 ................................................................................................. 35
Table 29: Deliveries by delivery outcome and treatment type, Australia and New Zealand, 2011 ..... 36
Table 30: Deliveries by gestation and number of embryos transferred, Australia and New Zealand, 2011 .......................................................................................................................... 36
Table 31: Deliveries by gestation and maternal age group, Australia and New Zealand, 2011 ............ 37
Table 32: Deliveries by method of delivery and maternal age group, Australia and New Zealand, 2011 .......................................................................................................................... 38
Table 33: Babies by gestational age and plurality, Australia and New Zealand, 2011 ........................... 40
Table 34: Liveborn babies by birthweight group and plurality, Australia and New Zealand, 2011 .......................................................................................................................... 42
Table 35: Perinatal mortality of babies by type of death and plurality, Australia and New Zealand, 2011 .......................................................................................................................... 43
Table 36: Number of cycles with PGD by type of embryo, Australia and New Zealand, 2011 ............ 45
Table 37: Number of cycles with OPU performed and OHSS by number of oocytes collected, Australia and New Zealand, 2011 ................................................................................................. 45
Table 38: Outcomes of DI cycles by women’s age group, Australia and New Zealand, 2011 ............... 46
Table 39: Number of fresh cycles by stage/outcome of treatment, Australia and New Zealand, 2007 to 2011............................................................................................................. 48
Table 40: Number of thaw cycles by stage/outcome of treatment, Australia and New Zealand, 2007 to 2011............................................................................................................. 48
Table 41: Number of deliveries following ART treatment by gestation, Australia and New Zealand, 2007 to 2011............................................................................................................. 49
Table 42: Number of fresh and thaw autologous cycles by women’s age group, Australia and New Zealand, 2007 to 2011............................................................................................................. 49
Table 43: Number of embryo transfer cycles by treatment type, Australia and New Zealand, 2007 to 2011............................................................................................................. 50
Table 44: Proportion of embryo transfer cycles by number of embryos transferred, Australia and New Zealand, 2007 to 2011 ..................................................................................................... 50

Assisted reproductive technology in Australia and New Zealand 2011 73
Table 45: Women undertaking autologous fresh and/or thaw cycles by number of cycles, Australia and New Zealand, 2011 ................................................................................................. 51
Table 46: Women undertaking autologous fresh cycles by number of cycles, Australia and New Zealand, 2011 .......................................................................................................................... 52
Table 47: Women undertaking autologous thaw cycles by number of cycles, Australia and New Zealand, 2011 .......................................................................................................................... 53
Table 48: Number of cycles by women’s age group, Australia and New Zealand, 2009–2011 ............. 55
Table 49: Cumulative pregnancy and live delivery rates by women’s age group, Australia and New Zealand, 2009–2011 ................................................................................................................ 56
Table 50: Cumulative live delivery rate by women’s age group and number of cycles, Australia and New Zealand, 2009-2011 ........................................................................................ 57

74 Assisted reproductive technology in Australia and New Zealand 2011
List of figures Figure 1: Progression of autologous fresh cycles, Australia and New Zealand, 2011 ............................ 10
Figure 2: Live deliveries per initiated autologous fresh cycle by women’s age at start of a treatment cycle, Australia and New Zealand, 2011 .................................................................... 12
Figure 3: Live deliveries per autologous fresh embryo transfer cycle by number of embryos transferred and stage of embryo development among fertility centres, Australia and New Zealand, 2011 .................................................................................................................. 17
Figure 4: Progression of autologous thaw cycles, Australia and New Zealand, 2011 ............................ 18
Figure 5: Live deliveries per initiated autologous thaw cycle by women’s age at start of the thaw treatment cycle, Australia and New Zealand, 2011 .......................................................... 20
Figure 6: Live delivery rate of autologous thaw embryo transfer cycles by number of embryos transferred and stage of embryo development among fertility centres, Australia and New Zealand, 2011 .................................................................................................................. 26
Figure 7: Progression of fresh and thaw oocyte/embryo recipient cycles, Australia and New Zealand, 2011 .......................................................................................................................... 28
Figure 8: Number of babies born following embryo transfer cycles by gestational age, Australia and New Zealand, 2011 ................................................................................................. 41
In 2011, there were 66,347 assisted reproductive technology (ART) treatment cycles performed in Australia and New Zealand. Of these, 23.1% resulted in a clinical pregnancy and 17.5% in a live delivery (the birth of at least one liveborn baby). There were 12,443 liveborn babies following ART treatment in 2011.