Embed Size (px)
Citation preview
Assocham Economic Research Bureau
THE ASSOCIATED CHAMBERS OF COMMERCE AND INDUSTRY OF INDIA
ASSOCHAM Economic Weekly 16th February, 2014
2
Contents
1. Macroeconomy
1.1 Highlights of Government of India‟s Railway Budget, 2014-15
1.2 Wholesale Price in India, January 2014
1.3 India‟s Foreign Trade: January, 2014
1.4 Consumer Price Index for Rural, Urban and Combined, January 2014
2. Corporate Sector
2.1 Index of Industrial Production, December 2013
2.2 Tourist availing “Tourist Visa on Arrival” (VoA) Scheme, January 2014
3. Market Trends
4. Global Developments
4.1 Euro Area and EU28 Industrial Production
4.2 China‟s Consumer Prices, January 2014
5. Data Appendix
3
1. Macroeconomy
1.1 Highlights of Government of India’s Railway Budget, 2014-15
Measures for improving Safety & Security
No unmanned Level Crossing. A total of 5,400 unmanned level crossings eliminated –
2,310 by manning it and 3,090 by closure / merger / construction of ROBs or RUBs.
Improved audio – visual warning to road users in advance of approaching trains.
Induction of indigenously developed Train Collision Avoidance System
Development of „crashworthy‟ coaches
In last five years, offering employment to over one lakh persons in Group C categories and
to 1.6 lakh persons in erstwhile Group D categories.
Provision of Vigilance Control Device in all locomotives
Various measures to prevent fire incidents on trains –
Fire retardant materials
Multi-tier protection for electric circuits
Portable fire extinguishers in coaches
Induction based cooking to replace LPG in pantry cars
Intensive checks against explosives and inflammable materials.
Financial Performance 2013-14
Loading Target raised to 1,052 Million Tonne from B.E. 1,047 Million Tonne.

4
Freight Earnings Target revised to Rs 94,000 crore from B.E. Rs 93,554 crore
Stringent Financial control exercised and Ordinary Working Expenses pegged only at Rs
560 crore higher than Budget Estimates, despite various post-budgetary factors
Plan Outlay revised to Rs 59,359 crore
Operating Ratio likely to be 90.8%
Fund Balances to continue to grow to Rs 8,018 crore
Budget Estimates 2014-15
Loading target of 1,101 Million Tonnes
Gross Traffic Receipts targeted at Rs 1,60,775 crore with Passenger Earnings (Rs 45,255
crore), Goods (Rs 1,05,770 crore), Other Coaching & Sundry Earnings (Rs 9,700 crore)
Ordinary Working Expenses placed at Rs 1,10,649 crore, higher by Rs 13,589 crore
Pension Outgo budgeted at Rs 27,000 crore against Rs 24,000 crore for 2013-14
The entire Dividend of Rs 9,117 crore to General Exchequer will be paid
Fund Balances likely to be Rs 12,728 crore.
Operating Ratio budgeted at 89.8%
Annual Plan 2014-15
Annual Plan envisaged at Rs 64,305 crore with a Budgetary Support of Rs 30,223 crore ,
Internal Resources of Rs 10,418 crore and Extra Budgetary Resources of Rs 19,805 crore
New Surveys: 19 New Lines & 5 Doubling
Financial Health
Rail infrastructure by cost sharing arrangement with State Governments; Karnataka,
Jharkhand, Maharashtra, Andhra Pradesh and Haryana agreed to several projects
Several Public Private Partnerships (PPP) projects are in the pipeline.
FDI being enabled to foster creation of world-class rail infrastructure.
Rail Land Development Authority raised Rs 937 crore so far.

5
Modernisation and Technology Induction
High Speed Trains
Joint feasibility study by India and Japan for Mumbai – Ahmedabad Corridor to
be co-financed by Japan International Cooperation Agency
Business Development Study by SNCF for Mumbai – Ahmedabad corridor.
Semi- High Speed Projects
Exploring low cost option of speeds 160- 200 kmph on select routes
Green Initiatives
Railway Energy Management Company becomes functional. Windmill and solar power
plants to be set up with 40% subsidy from Ministry of New & Renewable Energy.
200 Stations, rooftops of 26 buildings and 2,000 level crossing gates to be covered.
Railways bagged 22 out of 112 awards given by the Government.
„Green Curtains‟ along the track close to major stations; Pilot work at Agra and Jaipur
Coverage of Bio-toilets in 2,500 coaches and would be increased progressively.
Passenger Friendly Initiatives
Overwhelming public response to e-booking of ticket
On-line tracking of exact location and running of train movements
51 Jan-Ahaar outlets for Janta Meals ; 48 passenger escalators commisionsed at stations
and 61 more being installed ; air-conditioned EMU services in Mumbai from July 2014 ;
information display system in important trains to indicate stations & arrival time.
„Upgradation‟ scheme extended to AC Chair Car and Executive Chair car passengers.
Demand Management through Dynamic Pricing
Premium AC Special train introduced in Delhi – Mumbai Sector with shorter advance
reservation period and dynamically varying premium over tatkal fare
6
Enhancing Market Share
Clearing missing links in Carrying Capacity + 8 tonne routes; freight train speeding;
upgradation of rolling stock; increasing length of trains; tariff and incentive schemes to
encourage traffic to rail and minimizing empty running.
Rail Tariff Authority
Independent Rail Tariff Authority set-up to advise on fixing of fares and freight, to engage
all stake-holders
Information Technology
Initiatives taken include–proliferation of cash accepting Automatic Ticket Vending
Machines; ticketing on mobile phones in unreserved segments; system update on PNR
status; online booking of retiring rooms at important stations; online booking of meals for
selected en-route stations; introduction of e-forwarding note and electronic transmission of
railway receipts for freight customers.
Revenue Freight Traffic
Loading target of 1047 Million Tonnes for 2013-14 would be surpassed
Empty Flow Discount Scheme to be implemented
Carrying Capacity + 9 tonne + 1 tonne routes being planned
Easing of some restrictions on movement of imported commodities through Containers
Carrying capacity of 20 feet containers increased by 4 tonnes
Parcel Terminals & Special Parcel Trains with scheduled timings.
New policy on parcels to encourage transportation of milk.
New concept of „hub and spoke‟ for parcel business
Third party warehousing in Special Parcel Terminals envisaged.

7
New Services
New Trains: 17 Premium trains, 38 Express trains, 10 Passenger trains, 4 MEMU and 3
DEMU
Extension and Increase in frequency: 3 Extension of trains and 3 increase in frequency
Achievements / Initiatives
Major landmark achievement in National Project of Kashmir
State of Meghalaya and capital of Arunachal Pradesh to be on Railway Map by this fiscal.
Gauge Conversion of strategically important 510 km Rangiya-Murkongselek line in
Assam to be completed by this fiscal.
XIth Five Year Plan Targets exceeded in New Lines (2,207 km) , Doubling (2,758 km)
and Electrification (4,556 km), Production of Diesel (1,288) & Electrical (1,218) Locos
and Acquisition of Wagons (64,875)
Dedicated Freight Corridors on the Eastern and Western Routes–leading to strategically
critical capacity augmentation.
Railways met from its own means the total additional impact of Rs one lakh crore due to
implementation of 6th
Pay Commission
In 2013-14, 1532 km of New Lines, Doubling and Gauge Conversion commissioned.
Production commenced at the new factories-Rail Wheel Plant, Chhapra; Rail Coach
Factory, Rae Bareli; and Diesel Component Factory, Dankuni.
Specially designed coaches for adverse weather condition for rail travel in Kashmir.
Successful development of Corrosion resistant, lighter wagons with higher pay-load and
speed potential up to 100kmph.
Railways sportspersons dominate national events by winning titles in 23 disciplines and
runners up in 9 disciplines. In various international championships a total of 2 Gold, 4
Silver and 3 Bronze Medals won.
Unigauge Policy started in 1992 has converted 19,214 km to Broad Gauge, benefitting
several States including Gujarat, Rajasthan, Madhya Pradesh, Maharashtra, Karnataka,
Uttar Pradesh, Assam and Tamil Nadu.
8
1.2 Wholesale Price in India, January 2014
Wholesale Price Index for „All Commodities‟ (Base: 2004-05 = 100) for the month of January,
2014 declined by 0.2 percent to 178.9 from 179.2 for the previous month. The annual rate of
inflation, stood at 5.05% for the month of January, 2014 (over January, 2013) as compared to
6.16% for the previous month and 7.31% during the corresponding month of the previous year.
Build up inflation rate in the financial year so far was 5.17% compared to a build up rate of 5.78%
in the corresponding period of the previous year.
The index for primary articles group declined by 1.9 percent to 238.9 from 243.6 for the previous
month.
The index for `Food Articles` group declined by 2.7 percent to 233.6 from 240.1 for the previous
month due to lower price of fruits & vegetables (11%), maize (3%), ragi (2%) and gram, coffee,
arhar and tea (1% each). However, the price of poultry chicken (5%), pork (3%), urad and egg
(2% each) and moong, bajra, condiments & spices, masur, fish-inland, beef & buffalo meat and
fish-marine (1% each) moved up.
The index for `Non-Food Articles` group rose by 0.1 percent to 216.0 from 215.8 for the previous
month due to higher price of guar seed (8%), raw cotton (6%), copra (coconut) (4%), mesta (3%),
castor seed (2%) and fodder, linseed and raw jute (1% each). However, the price of logs & timber
(13%), flowers (11%), raw silk (9%), safflower (kardi seed) (4%), gingelly seed (3%), soyabean
(2%) and tobacco, cotton seed and raw rubber (1% each) declined.
The index for `Minerals` group declined by 0.4 percent to 352.9 from 354.2 for the previous
month due to lower price of barytes (3%) and crude petroleum (1%). However, the price of
copper ore (5 %), steatite (4%), zinc concentrate (3%) and chromite (2%) moved up.
The index for „Fuel & Power‟ group rose by 0.7 percent to 212.8 from 211.3 for the previous
month due to higher price of LPG (5%), aviation turbine fuel and petrol (2% each) and furnace
oil, kerosene, high speed diesel and bitumen (1% each).
9
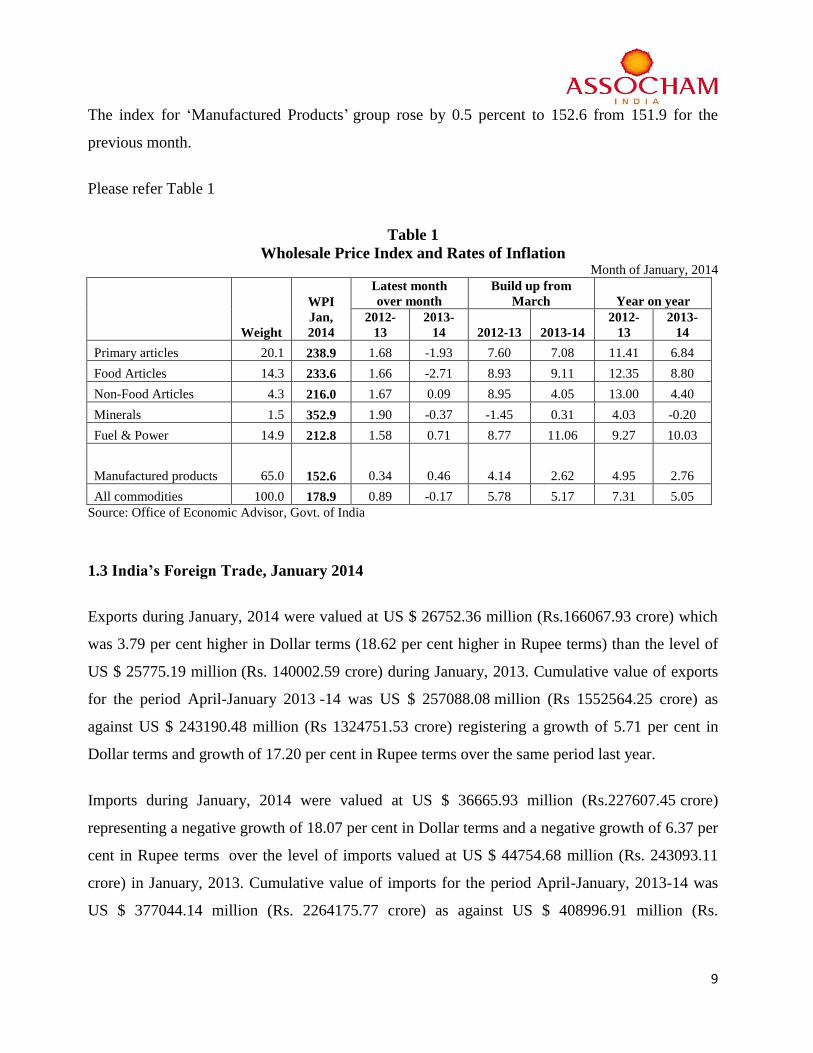
The index for „Manufactured Products‟ group rose by 0.5 percent to 152.6 from 151.9 for the
previous month.
Please refer Table 1
Table 1
Wholesale Price Index and Rates of Inflation Month of January, 2014
Weight
WPI
Jan,
2014
Latest month
over month
Build up from
March Year on year
2012-
13
2013-
14 2012-13 2013-14
2012-
13
2013-
14
Primary articles 20.1 238.9 1.68 -1.93 7.60 7.08 11.41 6.84
Food Articles 14.3 233.6 1.66 -2.71 8.93 9.11 12.35 8.80
Non-Food Articles 4.3 216.0 1.67 0.09 8.95 4.05 13.00 4.40
Minerals 1.5 352.9 1.90 -0.37 -1.45 0.31 4.03 -0.20
Fuel & Power 14.9 212.8 1.58 0.71 8.77 11.06 9.27 10.03
Manufactured products 65.0 152.6 0.34 0.46 4.14 2.62 4.95 2.76
All commodities 100.0 178.9 0.89 -0.17 5.78 5.17 7.31 5.05
Source: Office of Economic Advisor, Govt. of India
1.3 India’s Foreign Trade, January 2014
Exports during January, 2014 were valued at US $ 26752.36 million (Rs.166067.93 crore) which
was 3.79 per cent higher in Dollar terms (18.62 per cent higher in Rupee terms) than the level of
US $ 25775.19 million (Rs. 140002.59 crore) during January, 2013. Cumulative value of exports
for the period April-January 2013 -14 was US $ 257088.08 million (Rs 1552564.25 crore) as
against US $ 243190.48 million (Rs 1324751.53 crore) registering a growth of 5.71 per cent in
Dollar terms and growth of 17.20 per cent in Rupee terms over the same period last year.
Imports during January, 2014 were valued at US $ 36665.93 million (Rs.227607.45 crore)
representing a negative growth of 18.07 per cent in Dollar terms and a negative growth of 6.37 per
cent in Rupee terms over the level of imports valued at US $ 44754.68 million (Rs. 243093.11
crore) in January, 2013. Cumulative value of imports for the period April-January, 2013-14 was
US $ 377044.14 million (Rs. 2264175.77 crore) as against US $ 408996.91 million (Rs.

10
2227033.70 crore) registering a negative growth of 7.81 per cent in Dollar terms and growth of
1.67 per cent in Rupee terms over the same period last year.
Oil imports during January, 2014 were valued at US $ 13185.9 million which was 10.1 per cent
lower than oil imports valued at US $ 14666.2 million in the corresponding period last
year. Oil imports during April-January, 2013-14 were valued at US $ 138144.0 million which
was 1.2 per cent higher than the oil imports of US $ 136498.1 million in the corresponding
period last year.
Non-oil imports during January, 2014 were estimated at US $ 23480.0 million which was 22.0
per cent lower than non-oil imports of US $ 30088.5 million in January, 2013. Non-oil imports
during April-January, 2013-14 were valued at US $ 238900.1 million which was 12.3 per cent
lower than the level of such imports valued at US $ 272498.9 million in April-January, 2012-
13.
The trade deficit for April-January, 2013-14 was estimated at US $ 119956.06 million which
was lower than the deficit of US $ 165806.43 million during April-January, 2012-13.
Please refer Table 2
Table 2
India’s Exports & Imports (US $ Million)
January April-January
Exports (including re-exports)
2012-13 25775.2 243190.5
2013-14 26752.4 257088.1
%Growth2013-14/ 2012-2013 3.79 5.71
Imports
2012-13 44754.7 408996.9
2013-14 36665.9 377044.1
%Growth2013-14/ 2012-2013 -18.07 -7.81
Trade Balance
2012-13 -18979.5 -165806.4
2013-14 -9913.6 -119956.1
%Growth2013-14/ 2012-2013 -47.8 -27.7
Source: Department of Commerce, Govt. of India

11
1.4 Consumer Price Index for Rural, Urban and Combined, January 2014
All India provisional General (all groups), Group and Sub- Group level CPI numbers for January
2014 for rural, urban and combined are 139.3, 135.0 and 137.4, respectively.
Provisional annual inflation rate based on All India general CPI (Combined) for January 2014 on
point to point basis (January 2014 over January 2013) is 8.79 percent as compared to 9.87 percent
(final) for the previous month of December 2013. The corresponding provisional inflation rates
for rural and urban areas for January 2014 are 9.43 percent and 8.09 percent respectively. Inflation
rates (final) for rural and urban areas for December 2013 are 10.49 percent and 9.11 percent
respectively.
Please refer Table 3
Table 3
All India Annual Inflation Rates
Category
Rural Urban Combined
Jan.13
Index
Final
Jan.14
Index
Prov.
Rate
(%)
Jan.13
Index
Final
Jan.14
Index
Prov.
Rate
(%)
Jan.13
Index
Final
Jan.14
Index
Prov.
Rate
(%)
Cereals and products 122.8 137.2 11.73 122.2 134.7 10.23 122.6 136.6 11.42
Pulses and products 115.4 119.9 3.90 116.6 116.3 -0.26 115.8 118.8 2.59
Oils and fats 142.5 145.4 2.04 147.8 140.1 -5.21 144.2 143.7 -0.35
Egg, fish and meat 132.5 147.5 11.32 135.1 151.8 12.36 133.4 149.0 11.69
Milk and products 135.2 148.3 9.69 130.3 143.5 10.13 133.4 146.5 9.82
Condiments and spices 128.6 137.8 7.15 124.0 137.4 10.81 127.3 137.7 8.17
Vegetables 125.3 156.2 24.66 115.8 133.6 15.37 122.3 149.1 21.91
Fruits 138.1 163.1 18.10 133.3 149.7 12.30 136.0 157.3 15.66
Sugar etc 112.9 108.1 -4.25 111.5 101.8 -8.70 112.5 106.3 -5.51
Non-alcoholic beverages 128.2 137.8 7.49 128.7 139.3 8.24 128.4 138.4 7.79
Prepared meals etc 127.3 138.7 8.96 129.8 141.3 8.86 128.5 140.0 8.95
Food and beverages 127.5 141.1 10.67 126.9 137.3 8.20 127.3 139.9 9.90
Fuel and light 130.6 139.8 7.04 128.8 136.0 5.59 129.9 138.4 6.54
Clothing, bedding and
footwear 135.9 149.0 9.64 136.5 147.8 8.28 136.1 148.6 9.18
General Index (All
Groups) 127.3 139.3 9.43 124.9 135.0 8.09 126.3 137.4 8.79
Source: MOSPI, Govt. of India

12
2. Corporate Sector
2.1 Index of Industrial Production, December 2013
The General Index for the month of December 2013 stands at 178.3, which is 0.6 percent lower as
compared to the level in the month of December 2012. The cumulative growth for the period
April-December 2013-14 over the corresponding period of the previous year stands at (-) 0.1
percent.
The Indices of Industrial Production for the Mining, Manufacturing and Electricity sectors for the
month of December 2013 stand at 133.0, 188.0 and 169.4 respectively, with the corresponding
growth rates of 0.4 percent, (-) 1.6 percent and 7.5 percent as compared to December 2012. The
cumulative growth in the three sectors during April-December 2013-14 over the corresponding
period of 2012-13 has been (-) 1.8 percent, (-) 0.6 percent and 5.6 percent respectively.
Please refer Table 4
Table 4
Index of Industrial Production-Sectoral
Mining Manufacturing Electricity General
Month (141.6) (755.3) (103.2) (1000)
2012-13 2013-14 2012-13 2013-14 2012-13 2013-14 2012-13 2013-14
Apr 124.8 120.5 173.0 176.1 152.7 159.1 164.1 166.5
May 130.0 122.3 179.0 173.3 162.3 172.4 170.3 166.0
Jun 122.1 116.5 178.1 175.0 157.0 157.0 168.0 164.9
Jul 119.7 116.1 177.4 182.7 156.3 164.5 167.1 171.4
Aug 114.6 113.6 175.8 175.4 152.2 163.1 164.7 165.4
Sept 111.2 114.9 174.6 175.6 149.7 169.0 163.1 166.3
Oct 122.4 118.5 182.4 179.2 160.5 162.6 171.6 168.9

13
Nov 121.7 123.8 176.4 171.7 149.1 158.5 165.8 163.6
Dec* 132.5 133.0 191.1 188.0 157.6 169.4 179.3 178.3
Jan 135.5 193.6 160.7 182.0
Feb 124.6 190.8 140.5 176.2
Mar 146.4 207.3 164.2 194.2
Average
Apr-Dec 122.1 119.9 178.6 177.6 155.3 164.0 168.2 168.1
Growth (Y-o-Y)
Dec -3.1 0.4 -0.8 -1.6 5.2 7.5 -0.6 -0.6
Apr-Dec -1.8 -1.8 0.6 -0.6 4.6 5.6 0.7 -0.1
Source: MOSPI, Govt. of India
Note: Indices for December 2013 are Quick Estimates.
Indices for the months of Sep'13 and Nov‟ 13 incorporate updated production data
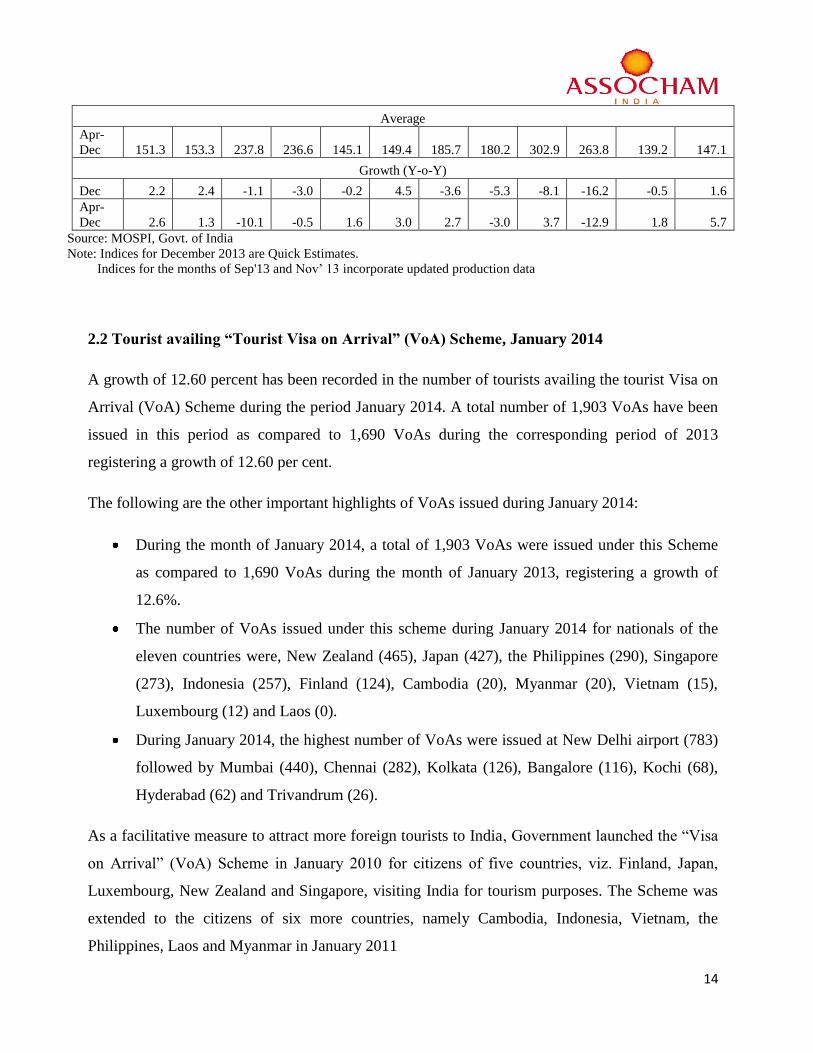
As per Use-based classification, the growth rates in December 2013 over December 2012 are 2.4
percent in Basic goods, (-) 3.0 percent in Capital goods and 4.5 percent in Intermediate goods.
The Consumer durables and Consumer non-durables have recorded growth of (-) 16.2 percent
and 1.6 percent respectively, with the overall growth in Consumer goods being (-) 5.3 percent.
Please refer Table 5
Table 5
Index of Industrial Production-Used Base
Basic goods Capital goods
Intermediate
goods
Consumer
goods
Consumer
durables
Consumer non-
durables
Month (456.82) (88.25) (156.86) (298.08) (84.60) (213.47)
2012-
13
2013-
14
2012-
13
2013-
14
2012-
13
2013-
14
2012-
13
2013-
14
2012-
13
2013-
14 2012-13 2013-14
Apr 148.0 150.1 207.9 207.3 141.8 145.3 187.5 190.6 306.2 276.8 140.5 156.4
May 155.9 155.5 227.3 218.8 148.6 150.2 187.1 174.7 310.1 253.5 138.3 143.5
Jun 151.2 148.4 235.0 219.6 145.4 147.3 185.8 183.1 307.2 276.1 137.7 146.2
Jul 150.6 152.1 234.0 271.3 146.3 151.0 183.3 182.1 307.0 277.6 134.3 144.2
Aug 149.0 150.4 250.0 245.0 146.4 152.0 173.3 171.7 280.7 257.4 130.7 137.8
Sept 144.0 151.6 248.7 232.1 142.1 148.1 177.8 179.1 303.9 271.2 127.8 142.6
Oct 153.7 151.6 241.1 247.0 146.7 150.0 191.7 182.3 336.2 295.5 134.5 137.4
Nov 149.6 153.7 235.4 235.2 139.4 144.1 184.2 167.9 301.1 236.4 137.8 140.7
Dec* 160.1 163.9 260.7 252.8 149.4 156.1 200.6 189.9 273.9 229.4 171.5 174.3
Jan 162.7 250.5 151.7 207.2 285.4 176.2
Feb 150.2 285.5 144.3 200.7 289.7 165.4
Mar 168.6 343.2 158.3 208.4 311.2 167.6
14
Average
Apr-
Dec 151.3 153.3 237.8 236.6 145.1 149.4 185.7 180.2 302.9 263.8 139.2 147.1
Growth (Y-o-Y)
Dec 2.2 2.4 -1.1 -3.0 -0.2 4.5 -3.6 -5.3 -8.1 -16.2 -0.5 1.6
Apr-
Dec 2.6 1.3 -10.1 -0.5 1.6 3.0 2.7 -3.0 3.7 -12.9 1.8 5.7
Source: MOSPI, Govt. of India
Note: Indices for December 2013 are Quick Estimates.
Indices for the months of Sep'13 and Nov‟ 13 incorporate updated production data
2.2 Tourist availing “Tourist Visa on Arrival” (VoA) Scheme, January 2014
A growth of 12.60 percent has been recorded in the number of tourists availing the tourist Visa on
Arrival (VoA) Scheme during the period January 2014. A total number of 1,903 VoAs have been
issued in this period as compared to 1,690 VoAs during the corresponding period of 2013
registering a growth of 12.60 per cent.
The following are the other important highlights of VoAs issued during January 2014:
During the month of January 2014, a total of 1,903 VoAs were issued under this Scheme
as compared to 1,690 VoAs during the month of January 2013, registering a growth of
12.6%.
The number of VoAs issued under this scheme during January 2014 for nationals of the
eleven countries were, New Zealand (465), Japan (427), the Philippines (290), Singapore
(273), Indonesia (257), Finland (124), Cambodia (20), Myanmar (20), Vietnam (15),
Luxembourg (12) and Laos (0).
During January 2014, the highest number of VoAs were issued at New Delhi airport (783)
followed by Mumbai (440), Chennai (282), Kolkata (126), Bangalore (116), Kochi (68),
Hyderabad (62) and Trivandrum (26).
As a facilitative measure to attract more foreign tourists to India, Government launched the “Visa
on Arrival” (VoA) Scheme in January 2010 for citizens of five countries, viz. Finland, Japan,
Luxembourg, New Zealand and Singapore, visiting India for tourism purposes. The Scheme was
extended to the citizens of six more countries, namely Cambodia, Indonesia, Vietnam, the
Philippines, Laos and Myanmar in January 2011
15
3. Market Trends
BSE: The 30 share BSE Sensex decreased by 0.3 per cent and closed at 20,366.8
NSE: Nifty decreased by 0.4 per cent during the week and closed at 6048.3
Dollar: The value of Rupee depreciated by Rs. 0.08 against the US dollar during the
week and closed at Rs 62.27 per dollar.
Euro: The value of Rupee depreciated by Rs. 0.43 against the Euro and closed at Rs.
85.17 per euro.
Gold: Prices of gold increased by Rs. 248.3 per 10 grams during the week and closed
at Rs. 30552.8 per 10 grams.
Silver: Prices of silver increased by Rs. 1018.4 during the week and closed at Rs.
46995.1 Per kg.
Crude Oil: The prices of crude oil increased by USD 1.8 per barrel and closed at
USD 106.1 per barrel.
Forex Reserves: India‟s Foreign Exchange reserves increased by USD 1.2 billion to
USD 292.3 billion during the week-ended February 7, 2014.

16
4. Global Developments
4.1 Euro Area and EU28 Industrial Production
In December 2013 compared with November 2013, seasonally adjusted industrial production fell
by 0.7% in both the Euro Area (EA17) and the EU28, according to estimates from Eurostat, the
statistical office of the European Union. In November, industrial production rose by 1.6 percent
and 1.3 percent respectively. In December 2013 compared with December 2012, industrial
production grew by 0.5% in the Euro Area and by 0.9% in the EU28. Average industrial
production for the year 2013 compared with 2012 dropped by 0.8% in the Euro Area and by
0.5% in the EU28.
In December 2013 compared with November 2013, production of capital goods decreased by
2.1% in the Euro Area and by 1.9% in the EU28. Energy fell by 2.1% and 1.5% respectively.
Non-durable consumer goods dropped by 0.1% in the Euro Area and increased by 0.1% in the
EU28. Durable consumer goods rose by 0.4% in the Euro Area, but decreased by 0.3% in the
EU28. Intermediate goods grew by 0.9% and 0.7% respectively. Among the Member States for
which data are available, industrial production fell in nineteen and rose in four. The largest
decreases were registered in Estonia (-5.7%), Sweden (-2.7%), the Netherlands (-2.6%) and
Croatia (-2.4%), and the increases in Slovenia (+2.7%), Greece (+2.6%), Portugal (+0.7%) and
the United Kingdom (+0.4%).
In December 2013 compared with December 2012, production of intermediate goods rose by
3.6% in the Euro Area and by 3.7% in the EU28. Capital goods fell by 0.3% in the Euro Area,
but grew by 0.7% in the EU28. Nondurable consumer goods decreased by 0.9% in the Euro
Area, but gained 0.3% in the EU28. Durable consumer goods decreased by 1.2% and 0.8%
respectively. Energy fell by 1.9% in the Euro Area and by 2.3% in the EU28. Among the

17
Member States for which data are available, industrial production rose in ten and fell in thirteen.
The highest increases were registered in Portugal (+7.1%), Romania (+7.0%), the Czech
Republic (+6.7%) and Slovenia (+5.2%), and the largest decreases in Malta (-7.3%), Ireland (-
6.7%), Estonia (-6.4%) and Finland (-4.8%).
Please refer Tables 6 & 7
Table 6
Industrial Production excluding Construction % change compared with previous month
13-Jul 13-Aug 13-Sep 13-Oct 13-Nov 13-Dec
EA17
Total industry -0.9 0.9 -0.2 -0.7 1.6 -0.7
Intermediate goods -0.3 0.8 -0.4 0.4 0.7 0.9
Energy -0.5 -0.7 1.5 -3.3 2.3 -2.1
Capital goods -1.8 2 -0.8 -0.9 2.8 -2.1
Durable consumer goods -1 0.1 -1.4 -1.9 2.3 0.4
Non-durable consumer goods -0.3 0.4 0.1 0.3 0.3 -0.1
EU28
Total industry -0.5 0.5 0.1 -0.4 1.3 -0.7
Intermediate goods -0.2 0.7 -0.2 0.5 0.6 0.7
Energy -0.1 -0.5 0.6 -2.2 1.6 -1.5
Capital goods -1.2 1.2 -0.1 -0.8 2.5 -1.9
Durable consumer goods 0.1 -1.5 -0.8 -1.4 1.5 -0.3
Non-durable consumer goods 0.1 -0.5 0.7 0.1 0.2 0.1
Source: Eurostat, the statistical office of the European Union
Table 7
Industrial production excluding construction % change compared with same month of the previous year
13-Jul 13-Aug 13-Sep 13-Oct 13-Nov 13-Dec
EA17
Total industry -2.0 -1.5 0.2 0.5 2.8 0.5
Intermediate goods -1.4 -0.6 0.1 1.5 3.2 3.6
Energy -1.8 -3.6 -0.7 -3.1 0.0 -1.9
Capital goods -3.2 -0.9 0.2 1.4 4.3 -0.3
Durable consumer goods -4.2 -4.0 -2.5 -4.8 0.0 -1.2
Non-durable consumer
goods -0.9 -2.0 1.1 0.2 2.0 -0.9
EU28
Total industry -1.6 -1.3 0.7 1.0 2.8 0.9
18
Intermediate goods -1.1 -0.2 0.7 2.0 3.4 3.7
Energy -3.4 -4.6 -1.4 -2.8 -1.0 -2.3
Capital goods -2.3 -0.6 1.2 2.1 4.6 0.7
Durable consumer goods -2.4 -2.8 -1.5 -3.7 0.1 -0.8
Non-durable consumer
goods -0.3 -2.1 1.1 0.5 1.8 0.3
Source: Eurostat, the statistical office of the European Union
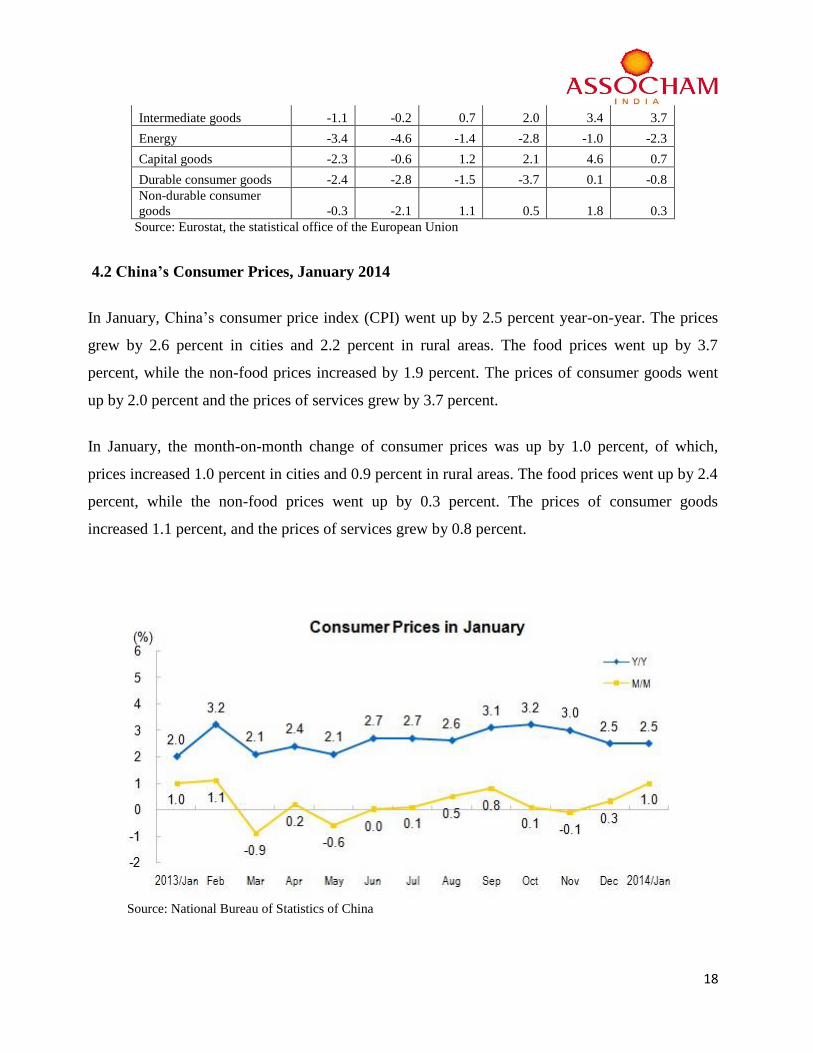
4.2 China’s Consumer Prices, January 2014
In January, China‟s consumer price index (CPI) went up by 2.5 percent year-on-year. The prices
grew by 2.6 percent in cities and 2.2 percent in rural areas. The food prices went up by 3.7
percent, while the non-food prices increased by 1.9 percent. The prices of consumer goods went
up by 2.0 percent and the prices of services grew by 3.7 percent.
In January, the month-on-month change of consumer prices was up by 1.0 percent, of which,
prices increased 1.0 percent in cities and 0.9 percent in rural areas. The food prices went up by 2.4
percent, while the non-food prices went up by 0.3 percent. The prices of consumer goods
increased 1.1 percent, and the prices of services grew by 0.8 percent.
Source: National Bureau of Statistics of China
19
5. Data Appendix
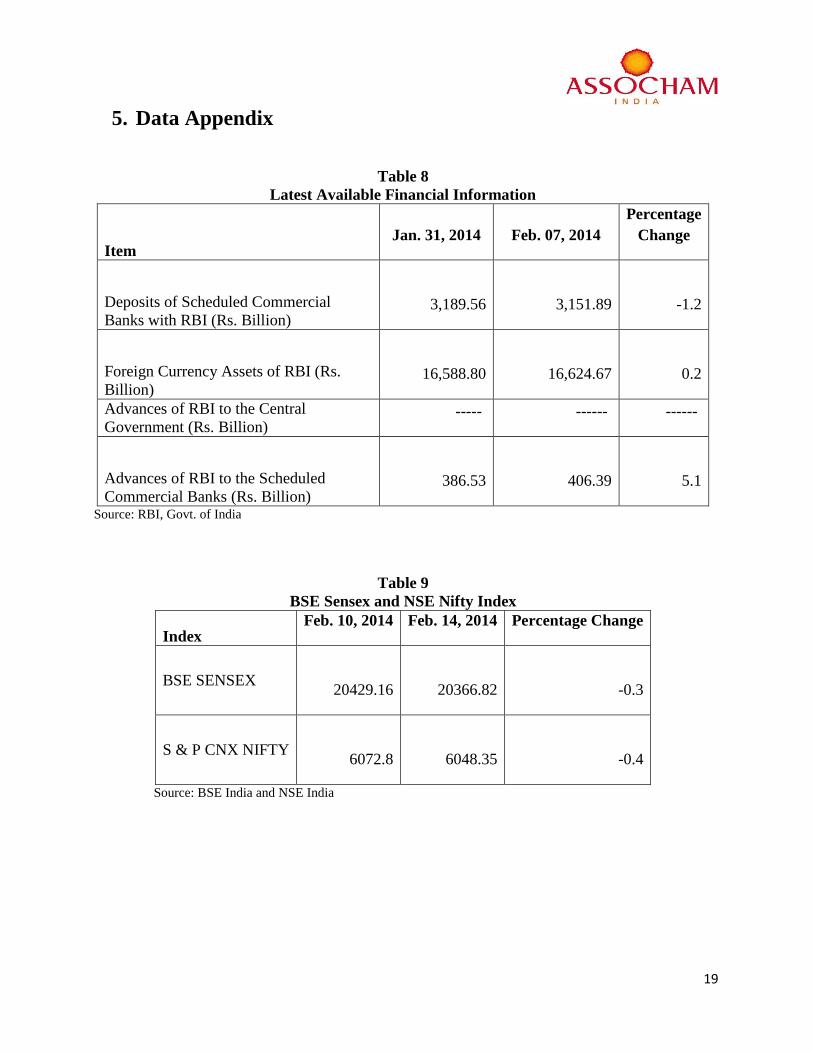
Table 8
Latest Available Financial Information
Item Jan. 31, 2014 Feb. 07, 2014
Percentage
Change
Deposits of Scheduled Commercial
Banks with RBI (Rs. Billion)
3,189.56
3,151.89
-1.2
Foreign Currency Assets of RBI (Rs.
Billion)
16,588.80
16,624.67
0.2
Advances of RBI to the Central
Government (Rs. Billion) ----- ------ ------
Advances of RBI to the Scheduled
Commercial Banks (Rs. Billion)
386.53
406.39
5.1
Source: RBI, Govt. of India
Table 9
BSE Sensex and NSE Nifty Index
Index Feb. 10, 2014 Feb. 14, 2014 Percentage Change
BSE SENSEX
20429.16
20366.82
-0.3
S & P CNX NIFTY
6072.8
6048.35
-0.4
Source: BSE India and NSE India
20
ASSOCHAM Economic Research Bureau
ASSOCHAM Economic Research Bureau (AERB) is the research division of the
Associated Chambers of Commerce and Industry of India. The Research Bureau
undertakes studies on various economic issues, policy matters, financial markets,
international trade, social development, sector wise performance and monitoring global
economy dynamics.
The main banners of the Bureau are:
ASSOCHAM Eco Pulse (AEP) studies are based on the data provided by various
institutions like Reserve Bank of India, World Bank, IMF, WTO, CSO, Finance Ministry,
Commerce Ministry, CMIE etc.
ASSOCHAM Business Barometer (ABB) are based on the surveys conducted by the
Research Team to take note of the opinion of leading CEOs, MDs, CFOs, economists and
experts in various fields.
ASSOCHAM Investment Meter (AIM) keeps the track of the investment
announcements by the private sector in different sectors and across the various states
and cities.
ASSOCHAM Placement Pattern (APP) is based on the sample data that is tracked on a
daily basis for the vacancies posted by companies via job portals and advertisements in
the national and regional dailies, journals and newspaper. Data is tracked for 60 cities
and 30 sectors that are offering job opportunities in India.
ASSOCHAM Financial Pulse (AFP) as an analytical tool tracks quarterly financial performance
of India Inc; forming strong inter-linkages with the real economy and presents sectoral insights
and outlook based on financial indicators, demand signals and corporate dividend activity.
Email: [email protected]
21
THE KNOWLEDGE CHAMBER
Evolution of Value Creator ASSOCHAM initiated its endeavor of value creation for Indian
industry in 1920. It has witnessed upswings as well as upheaval of Indian Economy and
contributed significantly by playing a catalytic role in shaping up the Trade, Commerce and
Industrial environment of the country.
ASSOCHAM derives its strength from the following Promoter Chambers: Bombay Chamber of
Commerce and Industry, Mumbai; Cochin Chamber of Commerce and Industry, Cochin; Indian
Merchant's Chamber, Mumbai; The Madras Chamber of Commerce and Industry, Chennai; PHD
Chamber of Commerce and Industry, New Delhi.
VISION
Empower Indian enterprise by inculcating knowledge that will be the catalyst of growth in the
barrier less technology driven global market and help them upscale, align and emerge as
formidable player in respective business segment
MISSION
As representative organ of Corporate India, ASSOCHAM articulates the genuine, legitimate
needs and interests of its members. Its mission is to impact the policy and legislative
environment so as to foster balanced economic industrial and social development. We
believe education, health, agriculture and environment to be the critical success factors.
GOALS
To ensure that the voice and concerns of ASSOCHAM are taken note of by policy makers and
legislators. To be proactive on policy initiatives those are in consonance with our mission. To
strengthen the network of relationships of national and international levels/forums. To develop
learning organization, sensitive to the development needs and concerns of its members. To
broad-base membership. Knowledge sets the pace for growth by exceeding the expectation, and
blends the wisdom of the old with the needs of the present.


![ASSOCHAM-Companies Bill Web[1]](https://img.pdfslide.net/doc/110x75/577cc3531a28aba71195ae50/assocham-companies-bill-web1.jpg)