Embed Size (px)
Citation preview

i
United Nations
Department of Economic and Social Affairs
Associate Experts (JPO) Programme A Statistical Overview
2009-2013
Final Report

ii
DESA
The Department of Economic and Social Affairs of the United Nations Secretariat is a vital
interface between global policies in the economic, social and environmental sphere and national
action. The Department works in three main interlinked areas: i) it compiles, generates and
analyses a wide range of economic, social and environmental data and information on which
Member States of the United Nations draw to review common problems and to take stock of
policy options; ii) it facilitates the negotiations of Member States in many intergovernmental
bodies on joint course of action to address ongoing or emerging global challenges; and iii) it
advises interested governments on the ways and means of translating policy frameworks
developed in United Nations conferences and summits into programmes at the country level and,
through technical assistance, helps build national capacities.
NOTE
The designations employed and the presentation of material in this report do not imply the
expression of any opinion whatsoever on the part of the Secretariat of the United Nations
concerning the legal status of any country, territory, city or area or of its authorities, or
concerning the delimitation of its frontiers or boundaries. Where the designations “country or
area” appears in the headings of tables, it covers countries, territories, cities or areas.
Acknowledgement
Special mention should be made of the contribution of Ms. Birunda Chelliah, who has been
invaluable in the preparation of the present study on behalf of the United Nations Department of
Economic and Social Affairs (UN/DESA).
Limited distribution to participating countries and United Nations Organizations.
Enquiries concerning this report may be directed to:
Associate Experts (JPO) Programme
Capacity Development Office
United Nations Department of Economic and Social Affairs
One United Nations Plaza, Room DC1-2585
United Nations, New York, NY 10017
Tel. +1 917-367-5058
Fax: +1 212-963-1270
E-mail: [email protected]
United Nations publication
Copyright © United Nations, 2015
All rights reserved

iii
Table of Content
1. Executive Summary ...................................................................................................... 1 2. Introduction ............................................................................................................... 3
2.1 Background and research purpose ........................................................................................... 3 2.2 Methodology ............................................................................................................................... 4 2.3 Data Collection ........................................................................................................................... 4 2.4 Operationalization of variables ................................................................................................. 4 2.5 Structure of the report ............................................................................................................... 5
3 Data Collection .......................................................................................................... 6 3.1 Population data ........................................................................................................................... 6
3.1.1 Population of Associate Experts .................................................................................... 6
3.1.2 Gender ............................................................................................................................ 7 3.1.3 Age at entry into the Programme ................................................................................... 8
3.1.4 Marital status .................................................................................................................. 9 3.1.5 Nationality and sponsorship ........................................................................................... 9 3.1.6 Geographical representation in the UN ........................................................................ 11 3.1.7 Duty station .................................................................................................................. 11 3.1.8 Duration of assignment ................................................................................................ 13
3.2 Survey data ............................................................................................................................... 14 3.2.1 Response rate ............................................................................................................... 14 3.2.2 Academic background at entry into the Programme .................................................... 14 3.2.3 Academic field ............................................................................................................. 16 3.2.4 Language proficiency ................................................................................................... 16 3.2.5 Prior work experience ................................................................................................ 167 3.2.6 Sources of information on the Programme .................................................................. 17 3.2.7 Reasons for applying to the Programme ...................................................................... 19 3.2.8 Prior applications to the Programme ............................................................................ 20 3.2.9 Level of supervisor ...................................................................................................... 21 3.2.10 Evaluation .................................................................................................................. 212 3.2.11 Reasons for leaving the Programme ............................................................................ 23 3.2.12 UN job networks .......................................................................................................... 23
3.2.13 Initial JPO assignment in preferred field ..................................................................... 23 3.2.14 Time before next employment ................................................................................. 2631 3.2.15 Post-JPO career development (at six months after the Programme) ............................ 23 3.2.16 Post-JPO career development (at the time of the survey) ............................................ 31
4 Data Analysis .......................................................................................................... 34 4.1 Career development analysis ................................................................................................... 34
4.1.1 Pearson correlation analysis ......................................................................................... 34 4.1.2 Binary logisitics regression model ............................................................................... 35
4.2 Detailed analysis of career development .............................................................................. 388
4.2.1 Post-Programme positions by survey ........................................................................... 38 4.2.2 Post-Programme positions by gender........................................................................... 39 4.2.3 Post-Programme positions by age ................................................................................ 40 4.2.4 Post-Programme positions by job network .................................................................. 42 4.2.5 Post-Programme positions by length of assignment .................................................... 43
4.2.6 Post-Programme positions by country ......................................................................... 43 5 Conclusion ............................................................................................................ 476 6 Annex ..................................................................................................................... 487
Annex I: Associate Expert Online Survey .............................................................................. 47
Annex II: Abbreviations ........................................................................................................ 343
Annex III: Job networks and job families in the UN Secretariat ......................................... 56

iv
Index of Figures
Figure 3.1: Average number of JPOs exiting the Programme each year (1990-2013)................................................. ......... 6
Figure 3.2: Gender ratio (2009-2013) ................................................................................................................................... 7
Figure 3.3: Gender ratio by year (2009-2013) ...................................................................................................................... 7
Figure 3.4: Distribution by age at entry of duty (2009-2013) ............................................................................................... 8
Figure 3.5 Population by nationality and sponsorship (2009-2013) .................................................................................... 9
Figure 3.6: Population by region of duty station (1990-2013) ............................................................................................ 12
Figure 3.7: Duration of assignment by survey period (1990-1995, 2004-2008, 2009-2013) .............................................. 13
Figure 3.8: Academic level by survey period (1996-2000, 2001-2003, 2004-2008, 2009-2013) ....................................... 14
Figure 3.9: Academic level by gender (2009-2013) ........................................................................................................... 15
Figure 3.10: Average language proficiency before and after the Programme (2001-2003, 2004-2008, 2009-2013) ........... 17
Figure 3.11: Prior work experience of JPOs (2009-2013) .................................................................................................... 18
Figure 3.12: Prior UN experience (2009-2013) ................................................................................................................... 18
Figure 3.13: JPOs’ prior applications to the Programme (2009-2013) ................................................................................ 20
Figure 3.14: Distribution of JPO assignments by job networks (2009-2013) ...................................................................... 23
Figure 3.15: Distribution of JPO assignments in job families for the top 3 job networks (2009-2013) ............................. 25
Figure 3.16: Employment status exactly 6 months after the Programme (2009-2013) ........................................................ 27
Figure 3.17: Distribution by Department/Office (2009-2013) ............................................................................................ 28
Figure 3.18: Level of appointment (2009-2013) ................................................................................................................. 28
Figure 3.19: Distribution by Agencies, Funds and Programmes (2009-2013) ..................................................................... 29
Figure 3.20: Level of appointment (2009-2013) ................................................................................................................. 29
Figure 3.21: Employment status at the time of the survey (2009-2013) .............................................................................. 31
Figure 3.22: Distribution by Department/Office (2009-2013) ............................................................................................. 31
Figure 3.23: Level of appointment (2009-2013) ................................................................................................................. 32
Figure 3.24: Distribution by Agencies, Funds and Programmes (2009-2013) ..................................................................... 32
Figure 3.25: Level of appointment (2009-2013) .................................................................................................................. 33
Figure 4.1: Post-Programme positions by survey (1990-2013) ............................................................................................ 38
Figure 4.2: Post-Programme positions by gender (2009-2013)............................................................................................ 39
Figure 4.3: Post-Programme positions by age (2009-2013) ................................................................................................. 40
Index of Tables
Table 3.1: Number of JPOs leaving the Programme by survey period (1990-2013) ............................................................. 6
Table 3.2 Gender distribution (1990-2013) ........................................................................................................................... 7
Table 3.3: Statistics for age at entry on duty (1990-2013) ..................................................................................................... 8
Table 3.4: Statistics for marital status at entry on duty (1990-2013) ..................................................................................... 9
Table 3.5: Population by nationality (1990-2013) ............................................................................................................... 10
Table 3.6: Geographical representation of JPOs Nationalities (1990-2013) ........................................................................ 11
Table 3.7: Population by region of duty station (1990-2013) .............................................................................................. 11
Table 3.8: Response rate by year (1990-2013) ..................................................................................................................... 14
Table 3.9: Academic level by gender with Master’s degree distinction (2009-2013) ......................................................... 15
Table 3.10: Academic level by gender without Master’s degree distinction (2001-2003, 2004-2008, 2009-2013) ........... 15
Table 3.11: Population by academic field (2001-2003, 2004-2008, 2009-2013) ................................................................ 16
Table 3.12: Population by number of UN official languages known (2001-2003, 2004-2008, 2009-2013) ........................ 16
Table 3.13: Prior work experience (2009-2013) ................................................................................................................. 18
Table 3.14: Population by source of information on the Programme (2009-2013) .............................................................. 19
Table 3.15: Reason for applying to the Programme (2009-2013) ........................................................................................ 19
Table 3.16: JPOs prior applications to the Programme (2009-2013) ................................................................................... 20
Table 3.17: Number of times JPOs previously applied to the Programme (2009-2013) ...................................................... 21
Table 3.18: JPOs’ prior applications by nationality (2009-2013) ........................................................................................ 20

v
Table 3.19: Level of supervisor for initial JPO assignment (2009-2013) ............................................................................ 21
Table 3.20: Average score of satisfaction with the Programme (2009-2013) ...................................................................... 22
Table 3.21: Reason for leaving the Programme (2001-2003, 2004-2008, 2009-2013) ........................................................ 23
Table 3.22: Distribution of JPO assignments in job families for the top 3 job networks (2009-2013) .............................. 25
Table 3.23: Initial JPO assignment in preferred field (2009-2013) ...................................................................................... 26
Table 3.24: Time period before next employment offer (1990-2013) .................................................................................. 26
Table 3.25: Employment status exactly 6 months after the Programme (2009-2013) ......................................................... 27
Table 3.26: Employment status exactly 6 months after the Programme (1990-2013) ......................................................... 27
Table 3.27: Contract type of former JPOs in the UN common system (2009-2013) ........................................................... 30
Table 3.28: Employment status at the time of the survey (2009-2013) ................................................................................ 30
Table 4.1: Retention rate based on male JPO characteristics ............................................................................................... 36
Table 4.2: Retention rate based on female JPO characteristics ............................................................................................ 36
Table 4.3: Post-Programme positions by survey(1990-2013) .............................................................................................. 38
Table 4.4: Post-Programme positions by gender (1990-2013) ............................................................................................. 39
Table 4.5: Post-Programme positions by age (1990-2013) .................................................................................................. 41
Table 4.6: Post-Programme positions by job network (2009-2013) ..................................................................................... 42
Table 4.7: Post-Programme positions by length of assignment(2009-2013) ....................................................................... 42
Table 4.8: Post-Programme positions by country (2009-2013) ........................................................................................... 43

1
1 Executive Summary
The United Nations Associate Experts (JPO) Programme, referred to as the Programme in this report, has
been successfully operating for more than six decades. The current report is the fifth of a cycle of statistical
evaluations on the Associate Experts, also referred to as Junior Professional Officers (JPOs), who have left
the Programme.
The purpose of this statistical report is to provide a descriptive overview of the JPOs’ participation with the
Associate Experts Programme for the period 2009 to 2013. The report analyses the characteristics of JPOs at
the time of appointment, their satisfaction with the Programme and their future career development.
This report is based on 335 JPOs who left the Programme between 1 January 2009 and 31 December 2013.
An online survey was administered between July and September 2014 and multiple approaches were
utilized to contact former JPOs, such as e-mail, telephone, LinkedIn and Facebook. A total of 263 former
JPOs responded to the online survey representing a response rate of 78.5%, the highest amongst all previous
reports.
In comparison with previous editions, the survey has been further refined to include new questions and to
test new hypotheses such as the relevance of the level of the JPOs’ supervisor, having prior UN experience
and the UN job network of the JPO assignment.
The analysis is based on data from the UN/DESA JPO database for the total population 335 JPOs and data
from the implemented survey for 263 JPOs.
The key insights are based on the initial descriptive analysis and a binary logistic regression model:
For the period 2009-2013 the number of JPOs exiting the Programme was on average 67 JPOs per
year.
The gender ratio has developed in favor of female JPOs and the Programme has tried to maintain a
fair gender distribution.
The average age of the JPOs entering the Programme is 29 and 78% of the JPOs were single at the
beginning of their assignment.
97% of all JPOs joined the Programme with an advanced level university degree, with several JPOs
having completed double Masters.
Nearly 80% of the JPOs had more than the required 2 years of professional work experience prior to
the Programme, with 27% having more than 4 years of experience. In addition, 70% of the surveyed
JPOs also had some field experience working in a developing country. This shows the increased
competitiveness of the Programme.
Half of the JPOs had prior UN exposure in the form of internships, volunteering or consultancies.
This is found to be a statistically significant factor for future career development within the
Organization.
Nearly 50% of JPOs were assigned to the Political, Peace & Security job network which was found
to increase the likelihood of JPOs being employed within the UN common system at six months

2
after completing the Programme. In addition, JPO assignments within the Management &
Operations Support job network also increased the likelihood of being employed with the UN.
Approximately 67% of surveyed JPOs were employed within the UN common system exactly six
months after the completion of the Programme, with 40% of former JPOs being on a fixed-term
appointment.
Completion of a third year has proven to be beneficial for continued employment with the UN
common system for JPOs as 78% of JPOs, who completed three years in the Programme, stayed
with the UN system compared to the average of 67%.
Gender, length of assignment, being assigned to the Political, Peace & Security job network or
Management & Operations Support job network, applying for other positions early on during the
Programme, having more than 2 years of prior work experience and having prior UN exposure have
all been positively associated with future career development within the UN common system.
Overall the surveyed JPOs displayed a very positive attitude towards the Programme. The JPOs
especially appreciated working in a multicultural working environment and valued the Programmes’
ability to allow participation in international development cooperation activities.
In conclusion, the report highlights the increased competitiveness of JPO candidates in terms of academic
qualification, amount of previous professional work experience, prior experience with the UN and prior
field experience. Approximately 67% of former JPOs were employed with the UN common system at six
months after the completion of the Programme with 63% of former JPOs being employed at the time of
the survey. Lastly, the Programme has been successful in providing JPOs an exposure to international
development cooperation and the ability to use the JPOs’ expertise and skills in a relevant field.

3
2 Introduction
2.1 Background and research purpose
The United Nations Associate Experts Programme (AEP) was introduced in the UN Secretariat following
the Economic and Social Council Resolution 849 of 4 August 1961 on the use of volunteer workers in the
operational programmes of the United Nations and related Agencies, Funds and Programmes. The
Associate Experts Programme was designed to assist developing countries with the assignment of
technical assistance personnel in field projects and to offer young graduates from universities or
institutions of higher education an opportunity to acquire professional experience in technical cooperation
in an international organization.
The assignments of Associate Experts (AE), hereafter referred to as Junior Professional Officers (JPOs),
continue to be sponsored by their respective governments. Candidates from developing countries are in
some cases sponsored by other national governments (e.g. Netherlands, Italy, and Spain in previous
reporting periods). For the period 2009-2013, The Netherlands and Italy were the only donor governments
sponsoring developing country candidates in the UN Secretariat. In an effort to increase the number of
developing country candidates in the Programme, the 9th Meeting of the National Recruitment Services
and UN Organizations on the Associate Expert/JPO/APO Programmes in 2013 in Stockholm, Sweden,
endorsed the launch of a voluntary Trust Fund for developing country candidates and the United Nations
Associate Experts Programme continues to encourage donors to participate in this initiative.
The purpose of this report is to provide a statistical overview of the UN’s Associate Experts Programme
during the period 1 January 2009 to 31 December 2013. It is the fifth report of a series initiated by the
United Nations Department of Economic and Social Affairs (UN/DESA), which administers the
Programme in the UN Secretariat (earlier reports cover the periods 1990-1995, 1996-2000, 2001-2003 and
2004-2008). The population for this study is 337 JPOs who officially left the Associate Experts
Programme between 1 January 2009 and 31 December 2013. The report is based on 335 former JPOs as
two JPOs, regrettably, died in service during this reporting period.
The fifth statistical report differs from the previous reports in the following ways:
The report is based on the largest sample of former JPOs;
The survey was modified significantly to include new hypothesis and variables;
The report obtained a 78.5% response rate, which is the highest among all previous reports;
The analysis identifies seven statistically significant characteristics, which positively influence post-
Programme career development. The analysis also confirms several statistically significant findings
from the fourth report.
In addition, the report aims to answer the following questions:
1) How has the Programme developed throughout the period 2009-2013?
2) Was the Programme efficient in developing the JPOs’ career in an international organization?
3) What factors positively influenced the career development of the participants?

4
2.2 Methodology
The defined target population for this statistical evaluation report is the 335 former JPOs who left
the Associate Experts Programme between 1 January 2009 and 31 December 2013. A descriptive
research methodology was used for this evaluation to gather information about the former JPOs,
their JPO assignment, and post-Programme career development.
The data for this study was gathered from multiple sources: UN/DESA JPO database, United
Nations Integrated Management Information System (IMIS), previous reports & other official UN
documents, and lastly the administered survey questionnaire responses.
The UN/DESA JPO database provides background data on all 335 former JPOs:
Gender, nationality, sponsoring country, age, marital status at the time of recruitment;
Job title, length of assignment, duty station and department/office in the UN;
A questionnaire (Annex I) was designed to collect crucial and relevant information to prepare this
report. Questions 1 to 5 cover information related to academic background, language proficiency
and work experience of participants at the time of entry to the Programme, as well as the source of
information about the Programme. Questions 6 to 11 focus on the application process to the
Programme, the JPO assignment, and the evaluation of the Programme; questions 12 to 20
concentrate on the JPOs’ career development at six months after completing the Programme and at
the time of the survey. As the survey has many sub-level questions, the online survey was
customized to support response-based skips. The survey was further refined after reviewing and
analyzing prior reports, documents, and the database. Thus, the survey responses provide more
accurate results while testing new hypothesis, although in some cases do not allow for direct
comparison with previous reports.
2.3 Data collection
The survey was implemented online using Google Survey Form and was self-administered. 335
former JPOs were contacted through email with the web survey link imbedded in July 2014. In
addition, telephone interview surveys were administered on occasions when respondents were
unable to access the questionnaire. Former JPOs’ contact information was found using a
combination of means, including e-mail and direct telephone contact, drawing on UN/DESA’s JPO
database, the UN Global Contact Directory, social networking websites (LinkedIn, Facebook) and
various internet search engines. The questionnaire was sent out in a series of e-mail messages on
five occasions, from July to September 2014. After the initial email, several reminders were sent to
increase the response rate. A total of 263 JPOs completed the questionnaire within the deadline
established, which represent 78.5% of the target population.
2.4 Operationalization of variables
Gender is recoded as dummy variable “Female”, where 1 = being female and 0 = being male.
Similarly, marital status is recoded as dummy variable “Single”, where 1 = being single and 0 =
being married. None of the JPOs described their marital status as separated or divorced at the time
of appointment. The regions of the duty stations have been categorized into five main groups:
“Asia and the Pacific”, “Europe”, “Africa”, “North America” and “Latin America”. In addition, the
dichotomous dummy variable “Headquarters” is generated such that 1 = JPOs whose duty station

5
was New York, Geneva or Vienna and 0 = JPOs whose duty station was not New York, Geneva or
Vienna.
2.5 Structure of the report
The report consists of the following 4 chapters:
Chapter 1 provides an executive summary of the report;
Chapter 2 provides an introduction and includes the background of the Associate Experts
Programme and the methodology used for this report;
Chapter 3 presents data collected from the UN/DESA JPO database and data collected through the
survey;
Chapter 4 analyzes the relationship between individual characteristics and assignment-related
factors of the participants and future career development. Section 4.1 classifies post-Programme
careers into UN and non-UN categories; while Section 4.2 includes a more detailed analysis of the
JPOs career development.
Chapter 5 presents the most important conclusions deriving from chapter 4.

6
3 Data Collection
3.1 Population data
This section of the report presents basic information on the whole population of 335 JPOs compiled using
data in the UN/DESA JPO database. The purpose of this section is to describe the Programmes’ main
characteristics and trends.
3.1.1 Population of Associate Experts/JPOs
Figure 3.1: Average number of JPOs exiting the Programme each year (1990-2013)
Figure 3.1 and Table 3.1 show that the average number of JPOs exiting the Programme each year has
increased over the five reporting periods. The average exits have increased by 5% between reporting
periods 2004-2008 to 2009-2013 demonstrating the stable increase of the JPOs on board in the various
periods.
Table 3.1: Number of JPOs leaving the Programme by survey period (1990-2013)
Survey Number of JPOs Length of reporting period Average per year
2009-2013 335 5 67.6
2004-2008 308 5 61.6
2001-2003 170 3 56.7
1996-2000 208 5 41.6
1990-1995 164 5.7 28.9

7
3.1.2 Gender
Figure 3.2: Gender ratio (2009-2013) Table 3.2: Gender distribution (1990-2013)
The female to male ratio in the population of former JPOs who exited between 2009 and 2013 approaches
6:4. For this reporting period, 192 women exited the program as opposed to 143 men. Historically, the
Programme has witnessed a development of the gender ratio shifting in favor of female participants due to
the increasing number of applications received from women.
Figure 3.3: Gender ratio by year (2009-2013)
Figure 3.3 shows that the gender distribution in the Programme has fluctuated in the past five years. The
Programme has tried to maintain a fair gender distribution, with slight overrepresentation of women in
2010 and 2012. In 2013, 48.94% of women exited the Programme, the lowest in the last five years.
Historically, it can be observed that the gender distribution has improved in favour of women. The current
pattern of more women entering the Programme will continue to hold importance as a measure to improve
the organization’s gender balance, and possibly contribute to future female representation at higher levels,
as women are still far less represented in senior management positions.
Survey Period Female % Male %
2009-2013 192 57% 143 43%
2004-2008 177 57% 135 43%
2001-2003 79 47% 91 54%
1996-2000 110 53% 98 47%
1990-1995 49 30% 115 70%

8
3.1.3 Age at entry into the Programme
Table 3.3: Statistics for age at entry on duty (1990-2013)
Period Mean Median
2009-2013 29.2 29
2004-2008 29.3 29
2001-2003 30.4 30
1996-2000 29.8 30
1990-1995 29.5 29
The average and median age of entry into the Programme for the population is 29. There is not a
substantial difference in the age of entry between this report and the last report. The age limit in order to
apply to the Programme is 32 for several donors. Most candidates apply in their late twenties as the
Programme requires candidates to have at least an advanced level university and two years of relevant
work experience. Figure 3.4 presents the age distribution of JPOs at the beginning of their assignment
across the five reporting periods. The overall age distribution follows a similar pattern as shown in prior
reports. However, according to findings of the last analysis, a greater number of JPOs enter the
Programme at age 30. In addition, there is a steady decline in the proportion of JPOs who begin their
assignment after the age of 30.
Compared to the first three reports, the age composition of JPOs is more concentrated around the average
and the sample distribution for the period 2004-2008 and 2009-2013 is closer to the Normal distribution.
Figure 3.4: Distribution by age at entry on duty (1990-2013)

9
3.1.4 Marital status
Table 3.4: Statistics for marital status at entry on duty (1990-2013)
Survey Single Married Total Single%
2009-2013 262 73 335* 78.50%
2004-2008 152 43 195 77.90%
2001-2003 129 39 167 76.60%
1996-2000 133 75 208 63.90%
1990-1995 87 72 159 54.70%
*Marital status information sourced from DESA database instead of survey.
Information on marital status is available for the total population of 335 JPOs as marital status was
determined through their initial appointment personnel action. The previous four reports used the survey
data for this information and the total number of valid answers was dependent on the response rate. Table
3.4 shows a slight increase in the proportion of JPOs who had a single status at the time of their initial
appointment which is the highest in the last two decades.
3.1.5 Nationality and sponsorship
Twenty donor countries participating in the Programme were sponsoring 335 JPOs of 30 different
nationalities. For the period 2009-2013, the Netherlands and Italy were the only two donors sponsoring
developing country candidates (DCC) with 13 candidates sponsored by the Netherlands and 1 candidate
sponsored by Italy. As mentioned in the fourth report, the decrease in sponsoring developing country
candidates over time is due to the suspension of the Programme supported by OIF (Organisation
internationale de la francophonie) as well as other budgetary constraints.
Figure 3.5: Population by nationality and sponsorship (2009-2013)
Figure 3.5 illustrates that Germany, France, Italy, Norway and Switzerland were the donors sponsoring
more than 25 JPOs each. The JPOs sponsored by these five countries make up more than 60% of the total
pool of 335 JPOs.

10
Table 3.5: Population by nationality (1990-2013)
Country 2009-2013 2004-2008 2001-2003 1996-2000 1990-1995
Australia 3 0.9% / / / / 1 0.6% / /
Austria 17 5.1% 3 1.2% 7 5.6% 9 5.0% 6 4.3%
Belgium 5 1.5% 5 2.0% 6 4.8% 8 4.4% 18 12.9%
Canada 1 0.3% / / / / / / / /
Denmark 17 5.1% 26 10.6% 8 6.4% 20 11.0% 8 5.8%
Finland 21 6.3% 11 4.5% 11 8.8% 4 2.2% 4 2.9%
France 42 12.5% 36 14.7% 16 12.8% 17 9.4% 9 6.5%
Germany 66 19.7% 46 18.8% 23 18.4% 30 16.6% 21 15.1%
Great Britain / / 2 0.8% / / 2 1.1% / /
Italy 37 11.0% 48 19.6% 21 16.8% 43 23.8% 25 18.0%
Japan 7 2.1% 10 4.1% 11 8.8% 8 4.4% 7 5.0%
Liechtenstein 2 0.6% / / / / / / / /
Luxembourg 2 0.6% 4 1.6% 1 0.8% / / / /
Netherlands 12 3.6% 26 10.6% 12 9.6% 32 17.7% 40 28.8%
Norway 29 8.7% 14 5.7% 1 0.8% 4 2.2% 1 0.7%
Poland 2 0.6% / / / / / / / /
Republic of
Korea 7 2.1% 7 2.9% 3 2.4% 4 2.2% / /
South Africa 1 0.3% / / / / / / / /
Spain 13 3.9% 7 2.9% 4 3.2% / / / /
Sweden 9 2.7% 13 5.3% 19 15.2% 11 6.1% 8 5.8%
Switzerland 29 8.7% 20 8.2% 1 0.8% 2 1.1% 2 1.4%
DCC* 13 3.9% 30 12.2% 25 20.0% 13 7.2% 15 10.8%
Total 335 100% 245 100.0% 125 100.0% 181 100.0% 139 100.0%
Nationalities of JPOs from developing countries of this reporting period: Brazil, Chad, Cameroon, Colombia, Côte
d'Ivoire, Kyrgyzstan, Togo, Uganda, Uzbekistan, Suriname.
Compared with the data from previous surveys, Germany and France remain the Programme’s primary
donor countries, while Austria, Finland, Norway, Spain and Switzerland have made an effort to increase
their participation in the Programme. The number of developing country candidates has decreased
significantly over the years. As noted above, the suspension of the OIF’s participation in the Programme
during the fourth reporting period has resulted in a severe reduction of developing country candidates.
This trend is envisaged to be mitigated by the upcoming launch of the voluntary Trust Fund for
developing country candidates.

11
3.1.6 Geographical representation in the UN
Table 3.6: Geographical representation of JPO nationalities (2009-2013)
*Developing Country Candidates Nationalities
Table 3.6 presents the geographical representation of JPO nationalities within the UN Secretariat as of 31
December 2013. The majority of the nationalities are within range. Only 23% of the nationalities are in
the under represented category. Our hypothesis is that JPOs’ with nationalities who are currently under
represented may be more likely to develop their career within the UN common system after completing
the Programme, while those who are over represented are less likely to be employed with the UN System.
This hypothesis will be further examined in Chapter 4.
3.1.7 Duty station
Table 3.7: Population by region of duty station (1990-2013)
Region 2009-2013 2004-2008 2001-2003 1996-2000 1990-1995
Africa 29 8.66% 32 10.39% 12 7.06% 14 6.93% 29 17.68%
Asia and the Pacific 15 4.48% 26 8.44% 10 5.88% 33 16.34% 28 17.07%
Europe 115 34.33% 114 37.01% 83 48.82% 83 41.09% 43 26.22%
Latin America 14 4.18% 13 4.22% 7 4.12% 19 9.41% 19 11.59%
North America 162 48.36% 123 39.94% 58 34.12% 53 26.24% 45 27.44%
Total 335 100.0% 308 100.00% 170 100.00% 202 100.00% 164 100.00%
Under Represented
Within Range, below midpoint
Within Range, above midpoint Over Represented
Japan Germany Australia Austria
Luxembourg Netherlands Belgium Canada
Norway Republic of Korea Denmark Italy
Poland Spain Finland Switzerland
Chad* Colombia* France Cameroon*
Liechtenstein Côte d'Ivoire* Sweden Uganda*
Brazil* Kyrgyzstan* South Africa
Togo* Uzbekistan*
Suriname*

12
Figure 3.6: Population by region of duty station (1990-2013)
The number of JPOs assigned to non-headquarter duty stations has slightly decreased over the last
reporting period, and the number of placement countries has decreased from 47 in the last report to 38 in
the period 2009-2013. Duty stations of JPOs continued to be concentrated in North America and Europe,
with over 75.96% working in New York, Geneva or Vienna. The percentage of JPOs being assigned to
Asian and African regions fluctuates between the previous and current reporting periods. The trend of
assigning JPOs to headquarter locations may derive from a high demand by offices at headquarters,
particularly in light of limited resources and past favorable experiences with receiving JPOs.

13
3.1.8 Duration of assignment
Figure 3.7: Duration of assignment by survey period (1990-1995, 2004-2008, 2009-2013)
Figure 3.7 presents that for the period 2009 to 2013 the average duration of assignment is 30 months, thus
most JPOs remain on board for a period of 2 to 3 years. There is an increase in the number of JPOs
completing their assignment between 3-4 years. While Luxembourg remains the only donor fully
sponsoring assignments of 4 years, the fact that other JPOs continue beyond the 3rd year can be explained
by an increase in the number of cost-sharing arrangements between donor countries and receiving offices.
The number of JPOs with an assignment of more than 4 years is further decreasing as it may only occur in
special circumstances such as a short-term extension to complete specific duties. The relatively high value
for >48 months for the period 1990-1995 is due to the fact that The Netherlands sponsored a 4 years
Proramme and eventually reduced it to 3 years.

14
3.2 Survey data
3.2.1 Response rate
Out of the 335 JPOs a total of 263 former JPOs participated in the survey, which represents a 78.5%
response rate. This is the highest response rate across all five reports.
Table 3.8: Response rate by year (1990-2013)
Survey Response Total Response Rate
2009-2013 263 335 78.50%
2004-2008 198 308 64.30%
2001-2003 120 170 70.60%
1996-2000 143 208 68.80%
1990-1995 125 164 76.20%
3.2.2 Academic background at entry into the Programme
Figure 3.8: Academic level by survey period (1996-2000, 2001-2003, 2004-2008, 2009-2013)
* Double Masters measured for the first time.

15
For the period 2009-2013, the question on level of education was modified to differentiate between
attaining one or two Master’s degrees. Figure 3.8 indicates that 97% of JPOs had completed an advanced
level university degree out of which 28% completed two Master’s degrees prior to joining the Programme.
The number of candidates with a Ph.D. level education has decreased from the last reporting period.
Overall, Figure 3.8 shows the increasing competitiveness among applicants resulting in the selection of
stronger candidates with higher academic qualifications.
Figure 3.9: Academic level by gender (2009-2013)
Figure 3.9 and Table 3.9 present that all JPOs are highly qualified academically. All female JPOs have
attained an advanced level degree, with 25% having two Master level degrees and a small proportion even
attaining a Ph.D. Similarly, 97% of male JPOs have attained an advanced level degree, with a small
proportion only completing a first level degree when applying to the Programme. In comparison to the
prior reporting period, using the former education classification, as shown in Table 3.10, we find that
education levels have improved, while the percentage of candidates holding a Ph.D. has decreased.
Table 3.9: Academic level by gender with Master’s degree distinction (2009-2013)
Degree Level Male % Female % Total %
Bachelors 3 3% 0 0% 3 1%
Masters 66 59% 103 68% 169 64%
Double Masters 34 30% 38 25% 72 27%
Ph.D. 9 8% 10 7% 19 7%
Total 112 100.0 151 100.0 263 100%
Table 3.10: Academic level by gender without Master’s degree distinction (2001-2003, 2004-2008, 2009-2013)
Degree Level 2009-2013 2004-2008 2001-2003 1996-2000
Male
Bachelors 3% 4% 12% 7%
Masters 89% 75% 71% 79%
Ph.D. 8% 20% 17% 14%
Female
Bachelors 0% 10% 7% 3%
Masters 93% 78% 83% 88%
Ph.D. 7% 12% 9% 10%

16
3.2.3 Academic field
Table 3.11: Population by academic field (2001-2003, 2004-2008, 2009-2013)
Academic Field 2009-2013 % 2004-2008 2001-2003
Political Affairs/International Relations 116 44.11% 35.4% 35.8%
Law/Legal 63 23.95% 26.8% 20.9%
Social Sciences 35 13.31% 14.6% 6.8%
Business/Management/Finance 16 6.08% 4.5% 5.4%
Environmental Science/Science 16 6.08% 7.2% 12.8%
Economics 13 4.94% 11.6% 17.6%
Journalism/Media/Communication Studies 4 1.52% - -
Statistics/Math - - 0.50% 0.7%
Total 263 100% 100% 100%
Over one third of JPOs (44%) have a degree in Political Science or International Relations, followed by a
degree in Law (24%) and Social Sciences (13%). In addition, as observed in the last report, the proportion
of JPOs specialized in Economics has decreased over time with only 5% of the surveyed population
majoring in Economics. Interestingly, there is a small number of JPOs trained in Journalism &
Media/Communication studies in this reporting period.
3.2.4 Language proficiency
Language proficiency was based on and the JPO’s mother tongue/s and knowledge of one or more of the
six official languages of the UN at the entrance on duty.
Table 3.12: Population by number of official languages of the UN known (2009-2013)
Number of languages 2009-2013 %
1 7 2.66%
2 187 71.10%
3 59 22.43%
4 10 3.80%
Total 263 100.0%

17
Figure 3.10: Average language proficiency before and after the Programme (2009-2013)
* Applicants are required to be fluent in at least one of the two UN official working languages: English or French.
Language proficiency is counted if JPOs have at least an advanced working proficiency or more in one of
the six official languages of the UN, including their mother tongue/s where applicable. Table 3.12 reflects
the language abilities of JPOs before and after the Programme. More than two-third of the surveyed
population has strong knowledge of at least two languages, followed by 22.4% who communicate well in
three languages. All Programme participants have excellent command of at least one UN working
language (English or French). Moreover, Figure 3.10 illustrates that the average language proficiency of
JPOs has improved during the course of the Programme due to free language courses offered by the UN
and the multilingual working environment. French and Spanish show the highest improvement followed
by English and Arabic.
3.2.5 Prior work experience
While the analysis related to the JPOs’ prior work experience in the last report focused on “international”
work experience, in this Report, the questionnaire was modified to reflect the JPOs’ overall relevant
working experience, highlighting experience in the field (developing countries). Therefore a comparative
analysis with the previous four reports will not be shown, as it would not be accurate or reliable, and
hence data on overall professional work experience is only provided for the period 2009-2013.
All JPOs had relevant work experience before joining the Programme. Figure 3.11 shows that the majority
of JPOs had more than two years of relevant working experience, with almost 30% having two to three
years, followed by 27% having worked for more than four years. Furthermore, nearly 70% of the JPOs
had field experience before joining the Programme, with more than one fourth of the surveyed population
having more than two years of work experience in the field.
It can be observed that most candidates have fulfilled the minimum of two years of relevant professional
experience as required for P2 level. The JPO’s average amount of professional work experience points out
the competitiveness of the Programme. In addition, Figure 3.12 shows that 55% of JPOs had some prior
United Nations experience in the form of internships, volunteering or consultancies.

18
Figure 3.11: Prior work experience of JPOs (2009-2013)
Table 3.13: Prior work experience (2009-2013) Figure 3.12: Prior UN experience (2009-2013)
Working
Exp. %
Field
Exp. %
None - - 80 30.4
Less than 1 Year 6 2.28 60 22.8
1 to 2 years 40 15.2 58 22.1
2 to 3 years 77 29.3 35 13.3
3 to 4 years 69 26.2 20 7.6
More than 4 years 71 27.0 10 3.8
Total 263 100 263 100

19
3.2.6 Sources of information on the Programme
Table 3.14: Population by source of information on the Programme (2009-2013)
Source 2009-2013 %
National Government/National Agencies/Equivalent (Website) 128 48.67
National Government (Other source) 36 13.69
Friends/Family 33 12.55
UN Employee/ Professional Network Recommendation 30 11.41
Associate Experts/ JPO Programme (Website) 24 9.13
University/Job Fairs 6 2.38
Newspaper 2 0.76
UN Agency 2 0.76
UN Careers (Website) 1 0.38
Do not Remember 1 0.38
Total 263 100
Websites of national governments seem to be the most effective method to promote the Programme with
50% of JPOs considering this source to be most informative.
3.2.7 Reasons for applying to the Programme
Table 3.15: Reason for applying to the Programme (2009-2013)
Reason for applying to the Associate Experts Programme 2009-2013 %
To gain relevant international experience and work for an international
organization 133 50.6
To utilize this opportunity to plan a long term career with United Nations 83 31.6
To apply my knowledge and expertise in a relevant field 25 9.5
To participate in international development cooperation 22 8.4
Total 263 100.0
The most common motivation for applying to the Programme was to gain relevant international
experience and work for an International Organization such as the United Nations, followed by an interest
in establishing a long-term career with the United Nations, using the JPO experience as a stepping board.

20
3.2.8 Prior applications to the Programme
Table 3.16: JPOs’ prior applications to the Programme (2009-2013)
Table 3.17: Number of times JPOs previously applied to the Programme (2009-2013)
Figure 3.13: JPOs’ prior applications to the Programme (2009-2013)
Table 3.16 and 3.17 indicate that half of the former JPO population had applied to the Programme, prior
to being successfully selected as a JPO. In addition, among the 132 prior applicants, 40% had applied at
least once, followed by 38% who applied twice and lastly 20% who applied three times or more to the
Programme. These findings suggest that many JPOs are persistent in reapplying and this demonstrates
their tenacity. Moreover, Table 3.18 identifies that candidates from Germany, Italy, France and
Switzerland continued to apply frequently until they were successful. Italian candidates are the most
frequent to apply three times or more, followed by Germans.
Prior application to the Programme? JPOs %
No 131 49.81%
Yes 132 50.19%
Total 263 100%
Number of previous applications to the Programme JPOs %
Once 54 40.9%
Twice 51 38.64%
Three time or More 27 20.45%
Total 132 100%

21
Table 3.18: JPOs’ prior applications by nationality (2009-2013)
3.2.9 Level of supervisor
Table 3.19: Level of supervisor for initial JPO assignment (2009-2013)
Table 3.19 indicates that the majority of JPOs are mostly supervised by a P4 level staff member, followed
by a P5 level staff member. A small proportion of JPOs worked under director level staff members. This
question was added to the survey and has not been examined in previous reports. The hypothesis that the
supervisor’s level may influence career development of the JPO, due to their exposure to higher strata of
guidance and mentorship, will be further examined in Chapter 4.
Nationality Once Twice more Total
Germany 17 9 5 31
Italy 4 11 9 24
France 7 6 3 16
Norway 6 2 3 11
Switzerland 4 5 1 10
Finland 4 5 0 9
Netherlands 3 1 2 6
Denmark 3 2 0 5
Austria 3 1 0 4
Spain 1 3 0 4
Sweden 1 1 2 4
Belgium 1 1 0 2
Japan 0 2 0 2
Chad 0 0 1 1
Côte
d'Ivoire 0 0 1 1
Republic of
Korea 0 1 0 1
Togo 0 1 0 1
Total 54 51 27 132
Level of Supervisor JPOs %
ASG 2 0.8%
D2 5 1.9%
D1 28 10.7%
P5 98 37.3%
P4 106 40.3%
P3 24 9.1%
Total 263 100.0%

22
3.2.10 Evaluation
Respondents were asked to score their satisfaction regarding their expectations and experience with the
Programme and their personal development using a score of 1 to 5 (1= disagree, 2= somewhat disagree,
3= neither disagree nor agree, 4= somewhat agree and 5= agree).
Table 3.20: Average score of satisfaction with the Programme (2009-2013)
Satisfaction of JPOs regarding professional and personal expectations:
Programme Evaluation Avg. Score
1 To gain relevant international experience and work for an international organization 4.31
2 To apply my expertise and skills in a relevant field 4.41
3 To participate in international development cooperation 4.85
4 To continue a successful career with the United Nations system 4.02
Personal Evaluation
5 My experience allowed me to appreciate a multicultural working environment 4.71
6 The JPO position allowed me to professionally grow 4.58
7 My work and input were very much valued in the office 4.05
8 I found my assignments challenging and meaningful 4.39
9 The JPO duties I performed were in line with what I expected 3.84
10 I was provided with the sufficient guidance on the job 3.82
11 I received regular feedback from my immediate supervisor on my performance 4.14
Former JPOs rated all four statements with regard to the Programme with an average score of four or
higher. With the highest score of 4.85, JPOs were satisfied with the Programmes’ ability to allow
participation in international development cooperation. Furthermore, the opportunity to gain relevant
international experience and to work for an international organization was highly rated by all JPOs with
an average score of 4.31.
With regard to personal evaluation, most JPOs positively rated their experience in terms of professional
growth, working in a multicultural setting, and performing challenging and meaningful assignments. At
the same time, many JPOs felt that more guidance would be desirable during the assignment as the lowest
average score was for statement 10.

23
3.2.11 Reasons for leaving the Programme
Table 3.21: Reason for leaving the Programme (2001-2003, 2004-2008, 2009-2013)
Did you complete your assignment as JPO? JPOs 2009-2013 2004-2008 2001-2003
Yes 204 77.6% 82.3% 82.0%
No, due to other work opportunities 40 15.2% 13.2% 12.3%
No, due to family issues 15 5.7% 2.0% 1.6%
No, due to lack of funding 2 0.8% 0.0% 0.0%
No, due to the challenging living conditions 1 0.4% 0.0% 0.8%
No, other 1 0.4% 2.0% 2.5%
Total 263 100% 100% 100%
Nearly 78% of JPOs completed their JPO assignment. Former JPOs cite other work opportunities and
family issues as the main reasons for not completing their JPO assignment.
3.2.12 UN job networks (field of activity)
Figure 3.14: Distribution of JPO assignments by job networks (2009-2013)
The United Nations has eight job networks (further details provided in Annex III), namely: Economic and
Social Development, Management and Operations Support, Political, Peace and Security, Information
System and Communication Technology, Legal, Public Information and External Relations, Conference
Management and Safety and Security. Each job network encompasses a number of job families.
Respondents were asked to select the applicable job network of their first JPO assignment in order to align
the report to the official UN job networks. In previous reports the field of activity of JPOs assignment was
determined by the Programme based on the UN/DESA JPO database and interpreted as job sectors.

24
Figure 3.14 shows that JPOs were mainly assigned to three job networks, namely
Political, Peace and Security;
Economic and Social Development;
Management and Operations Support.
No JPOs were assigned to the Safety and Security and Conference Management job networks.
Within the Political, Peace and Security job network, the majority of JPOs was assigned to the following
job families: Political Affairs (43%), Human Rights (23%) and Humanitarian Affairs (22%) as shown in
Figure 3.15. Within the Economic and Social Development network, most JPO positions were in
Economic Affairs, Drug control & Crime Prevention, followed by Environmental Affairs. Within the
Management and Operations Support job network, 39% of JPOs were placed in Human Resources,
followed by 29% in Management & Programme Analysis and Administration.

25
Table 3.22: Distribution of JPO assignments in Figure 3.15: Distribution of JPO assignments in
job families for the top 3 job networks (2009-2013) job families for the top 3 job networks (2009-2013)
Political, Peace & Security JPOs %
Political Affairs 56 43%
Human Rights 30 23%
Humanitarian Affairs 29 22%
Rule of Law 13 10%
Civil Affairs 1 1%
Electoral Affairs 1 1%
Total 130 100%
Economic and Social Development JPOs %
Economic Affairs 21 27%
Drug Control and Crime Prevention 17 24%
Environment Affairs 13 19%
Social Sciences 9 13%
Programme Management 5 7%
Population Affairs 4 6%
Public Administration 2 3%
Science and Technology 1 1%
Total 72 100%
Management & Operations Support JPOs %
Human Resources 15 38%
Management & Programme Analysis 11 28%
Administration 5 13%
Audit 3 8%
Finance 2 5%
Procurement 3 8%
Total 39 100%

26
3.2.13 Initial JPO assignment in preferred field
Table 3.23: Initial JPO assignment in preferred field of activity (2009-2013)
JPO placed in preferred field JPOs %
No 60 22.81%
Yes 203 77.19%
Total 263 100%
Nearly 23% of JPOs were not initially assigned to the field of activity they were actually interested in,
while the majority (77%) was satisfied with the field of activity they were placed for their initial
assignment. This question was added to the survey based on the hypothesis that candidates who were
placed in a field of activity they were actually interested in would be more likely to perform well and as a
consequence be more likely to have a satisfactory career development.
3.2.14 Time before next employment
Table 3.24: Time period before next employment offer (1990-2013)
Time before next
employment offer 2009-2013 % 2004-2008 2001-2003 1996-2000 1990-1995
During JPO assignment 104 39.5 / / / /
< 1 month 86 32.7 71.2 75 72 81
1 to 6 months 42 16.0 20.7 16.7 21 19
7 to 12 months 14 5.3 6.6 3.3 7 /
>12 months 12 4.6 1.5 5 / /
Still Searching 5 1.9 / / / /
Total 263 100 100 100 100 100
[In this report, the question of when JPOs succeeded in finding a next employment was amended to
include ‘before completing JPO assignment’ and ‘still searching’]
Table 3.24 shows that more than one third of the former JPOs managed to find their next professional
position before they completed their JPO assignment, followed by 33% of JPOs who found their next
employment within less than one month afterwards. A very small proportion of JPOs took longer than 7
months to find a job following the Programme and only 5 JPOs were searching for a job at the time of the
survey. Further examination revealed that among the 5 JPOs, only 2 were actually unemployed as one
JPO had been reappointed for a second JPO appointment, and 2 returned back to academia.

27
3.2.15 Post-JPO career development (six months after the Programme)
Table 3.25: Employment status exactly 6 months after the Programme (2009-2013)
Employment status JPOs %
Work for UN Secretariat 147 55.9%
Work for UN Agencies, Funds and
Programmes 28 10.7%
Work for other Intl. Organization 16 6.1%
Work for NGO 17 6.5%
Work in private sector 6 2.3%
Work in public sector 20 7.6%
Academics 8 3.0%
Unemployed 15 5.7%
Others 6 2.3%
Total 263 100.0%
Figure 3.16: Employment status exactly 6 months after the Programme (2009-2013)
Table 3.26: Employment status exactly 6 months after the Programme (1990-2013)
Employment status at six months 2009-
2013
2004-
2008
2001-
2003
1996-
2000
1990-
1995
Work for the UN System 66.5 63.1 65.3 52.4 56
Work for other Int. Org or NGOs 12.5 10.6 8.9 7.7 7
Work in the Private Sector 2.3 5.6 4 16.1 10
Work in the Public Sector 7.6 9.6 9.7 13.3 10
Academics (Studying/Teaching) 3.0 5.6 3.2 4.2 13
Unemployed/Others 8.0 5.6 8.9 6.3 4
Total 100% 100% 100% 100% 100%

28
Table 3.25 and Figure 3.16 reveal that more than two-third of the surveyed JPO population was employed
within the UN common system exactly six months after completing their JPO assignments. 55% were with the
UN Secretariat, while an additional 10% were working in other UN Agencies, Funds and Programmes. 12.5%
of JPOs worked in other International Organizations or NGOs. Only 5.7% of the population was unemployed
six months after completing the Programme. JPOs who selected “others” clarified that they were either on
maternity leave, travelling, or taking a sabbatical period; in other words they were not working by their own
choice. It is also interesting to note that two of the former JPOs started a second JPO assignment with the
Associate Experts Programme in virtue of the open policy of the donor.
Table 3.26 presents employment status of former JPOs at six months for all five reporting periods from 1990
to 2013. When compared to previous periods, the percentage of JPOs employed in the UN System has
increased and is the highest across the two decades. The proportion of JPOs with careers in other International
Organizations and NGOs has also increased to the highest across the two decades. The proportion of JPOs
employed in the private and public sector decreased significantly over the years and is the lowest amongst all
reports.
3.2.15.1 Working at the UN Secretariat six months after the Programme
Figure 3.17: Distribution by Department/Office (2009-2013)
Figure 3.18: Level of appointment (2009-2013)

29
Among the 139 former JPOs who were employed with the UN Secretariat six months after the Programme,
more than half were employed in the following four departments/offices: OCHA (20%), UNODC (13%),
OHCHR (12%) and DPKO (10.1%) as shown in Figure 3.17. In addition, Figure 3.18 illustrates that most
JPOs were retained at P3 level; followed by P2 level and a very small proportion of JPOs were employed as
consultants.
3.2.15.2 Working at UN Agencies, Funds and Programmes at six months after the Programme
Figure 3.19: Distribution by Agencies, Funds and Programmes (2009-2013)
Figure 3.20: Level of appointment (2009-2013)
Figure 3.19 presents the distribution of the 28 JPOs who started the Programme with the UN Secretariat but
were subsequently employed with UN Agencies, Funds and Programmes at six months after the Programme.
Approximately 27% of the JPOs were employed at UNDP. Figure 3.20 shows that most JPOs were employed
with UN Agencies at P3 level, followed by a small number of JPOs employed at P2 level. There is a higher
proportion of JPOs employed as consultants in UN Agencies, Funds and Programme than in the UN
Secretariat, possibly also because being a consultant in UN Agencies, Funds and Programme does not
preclude applying for positions in the UN Secretariat.

30
3.2.15.3 Contract type with the UN common system at six months after the Programme
Table 3.27: Contract type of former JPOs in the UN common system (2009-2013)
Contract Type 2009-2013 %
Fixed-term 69 40.98
Temporary 84 46.99
YPP Career 6 3.28
Consultant 10 6.56
Other 6 2.19
Total 175 100
Table 3.27 shows that among all former JPOs who were employed within the UN common system exactly six
months after completing the Programme, the majority was employed on temporary contracts, followed by
41% receiving a fixed-term contract. In addition, a small proportion of former JPOs who successfully passed
the Young Professionals Programme (YPP) examination received a fixed-term appointment as YPP
candidates.
3.2.15.4 Working at other International Organizations at six months after the Programme
A small proportion of JPOs (6%) were employed outside the UN System with other International
Organizations such as the European Union, OSCE, World Bank, OECD, CTBTO, The Global Fund and
OPCW.

31
3.2.16 Post-JPO career development (at the time of the survey)
Table 3.28: Employment status at the time of the survey (2009-2013)
Current Employment Status JPOs %
Work for the UN Secretariat 132 50.2%
Work for UN Agencies, Funds and
Programmes 34 12.9%
Work for other International Organization 22 8.4%
Work for NGO 19 7.2%
Work in the Private Sector 6 2.3%
Work in the Public Sector 31 11.8%
Academics 5 1.9%
Unemployed 10 3.8%
Other 4 1.5%
Total 263 100.0%
Figure 3.22 and Table 3.28 present the current employment status of the surveyed former JPOs – when
respondents answered the survey. More than two-third of the population continued to be employed with the
United Nations Common System, with 50% employed in the UN Secretariat and 13% employed in UN
Agencies, Funds and Programmes. In addition, 15.6% of the JPOs were employed outside the UN with other
International Organizations and NGOs. Only 3.8% of the population was unemployed at the time of the
survey. Unemployment has decreased from 5.7%, at exactly six months after the completion of the
Programme, to 3.8%, during the time of the survey. This shows the capability of the Programme in shaping
the future career opportunities of the JPOs.
Figure 3.21: Employment status at the time of the survey (2009-2013)

32
3.2.16.1 Working at the UN Secretariat at the time of the survey
Figure 3.22: Distribution by Department/Office (2009-2013)
The top four departments/offices that former JPOs were employed with during the time of the survey are
OCHA, DPKO, UNODC and OHCHR. These four departments/offices represent more than two-third of the
population that was still employed with the UN Secretariat.
Considering various departments with more than ten JPOs initially assigned in the period under consideration,
OHCHR, OCHA, DPKO-DFS and DPA have more than 70% of successful career development.
In addition, Figure 3.23 shows that 75% of employment with UN Secretariat is at the P3 level for former JPOs,
followed by P2 (12%) and P4 (12%).
Figure 3.23: Level of appointment (2009-2013)

33
3.2.16.2 Working at UN Agencies, Funds and Programmes at the time of the survey
Figure 3.24: Distribution by Agencies, Funds and Programmes (2009-2013)
At the time of the survey, more than one-third of the respondents who were currently working in UN
Agencies, Funds and Programme, in spite of having served as JPOs within the UN Secretariat, were
subsequently employed by UNICEF, followed by another 16% employed with UNDP. Consistent with prior
findings above, nearly 60% of the JPOs employed with UN Agencies, Funds and Programme are at P3 level,
followed by P2 level and as Consultants as shown in Figure 3.26. Likewise, a larger proportion of former
JPOs had been recruited as consultants with UN Agencies, Funds and Programme than in the UN Secretariat.
Figure 3.25: Level of appointment (2009-2013)

34
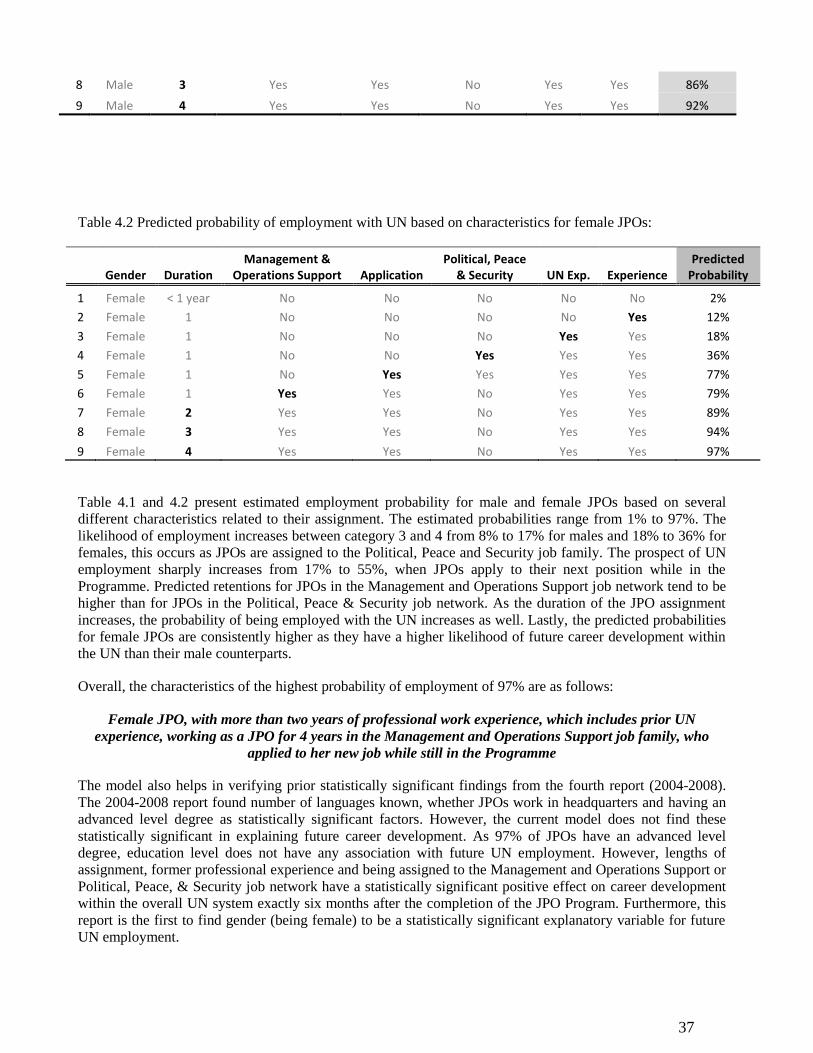
The duration of a JPO assignment is positively correlated with continued employment
with the UN. As the length of the assignment increases by 1 year, the likelihood of being
employed in the UN System increases by 21.8%.
Academic specialization in natural science is not positively correlated with being
employed in the UN system. If a JPO has attained a degree in natural sciences, they are
12.3% less likely to be retained with the UN.
Candidates with more than two years of work experience prior to the Programme are 14%
more likely to be employed with the UN System.
Candidates having prior UN experience e.g. in the form of internships, volunteering or
consultancies, are 15.4% more likely to stay with the UN after the Programme.
JPO assignments in the Political, Peace and Security job network increase employment in
the UN by 13.7% while positions in the Economic and Social Development job are not
significantly correlated.
3.2.16.3 Working at other International Organizations at the time of the survey
Only 22 (8%) former JPOs were working outside the UN System, with other International Organizations such
as the European Union, the World Bank, The Global Fund and OSCE at the time of the survey.
4 Data Analysis
4.1 Career development analysis
The variables below provide some important indicators that may influence the career development of
participants.
Pre-Programme variables: gender, age, nationality, marital status, number of languages known, academic level,
academic field, work experience, field experience, UN experience, prior application to JPO Programme.
Variables related to the JPO assignment: job network, job family, assignment in headquarters, duration of
assignment, and time of starting to apply for next job.
Post-Programme variables: time before starting new job, type of contract of new job, and level of new job.
The aim of the analysis is to obtain statistical evidence leading to the forecasting of JPOs career development
on the basis of pre-Programme and JPO assignment-related variables. Post-Programme variables, although
related to JPO positions, are viewed as results rather than causes. For the purposes of this report, retention is
defined as the former JPO being employed within the UN common system at six months after the end of the
Programme.
4.1.1 Pearson correlation analysis*
A correlation coefficient bivariate analysis of the dependent variable and each independent variable was
conducted at the preliminary stage. This analysis reveals statistically significant factors affecting JPOs
retention with the UN System.
The correlation analysis identified the following eight statistically significant associations with JPOs career
development in the UN common system. Most of the associations are weak in strength. These associations
will be further analyzed in a regression analysis.

35
This initial preliminary bivariate analysis reveals that gender, marital status, number of languages known,
field experience, academic level, field of activity, level of supervisor, geographical representation and
assignment in headquarters do not have a statistically significant association with JPOs’ post-Programme
career development. Additional analysis in the form of a binary logistic regression model is required to further
test the associations found in the correlation.
*Please note that a correlation analysis is between two variables only, without controlling for other
individual characteristics. For example only age and retention are examined without accounting for
characteristics such as work experience, academic degree, academic field or even gender. Thus, correlations
observations must be verified by a regression analysis. A regression analysis controls for other variables and
thus presents a more accurate and reliable finding.
4.1.2 Binary logistic regression model
As previously mentioned, a binary logistic regression model is built to analyze the relation between the
dependent variable measuring whether JPOs stay in the UN System at six months after completing their
assignments. The final retention model is based on seven statistically significant explanatory factors
(coefficients are estimated using the STATA statistical software):
The logistic model confirms some earlier associations observed in the above correlation analysis, between
length of assignment, UN experience, Political, Peace & Security job network and applying during their JPO
assignment, and the likelihood of a JPO of being retained with the UN common system. On the other hand,
the model also rejects the factors, age, academic specialization in natural science, Economic and Social
Development job network and completing the JPO assignment, as they are not able to statistically explain
their effect on retention.
As an important statistical indicator, the P-values of all the right-hand side factors except UN experience are
less than 0.05, which means the probability of the JPO staying in the UN System, if these factors were non-
significant, is less than 5%. The P-value of UN experience is 0.068 and can still be considered relatively
Completion of the full duration of the contract is positively associated with future UN
career development.
Applying to UN positions early in the Programme will increase the likelihood of staying
with the UN System.
Age and its correlation with future UN employment. It is hypothesized that as age of JPOs
increases, the less likely they will stay with the UN. This variable was tested and gave no
relevance in further regression analysis.

36
significant at 90% confidence level. All seven factors are positively associated with future employment with
the UN System at six months after the Programme.
The “Prob” on the left side of the equation represents the JPO’s probability of remaining in the UN System
after completing the Programme. The function, “Prob” is called odds and it is calculated using an exponential
function. On the right side of the equation, the statistically significant variables are used to predict the
probability. “Female” represents whether a JPO is female or not, thus, females are coded as a value of 1 and
males are coded as a value of 0; “Experience” and “UN Experience” represent whether JPOs have more than
2 years of professional work experience and whether they have prior UN experience; “Political” and
“Management” refers to whether a JPO is assigned with the Political, Peace & Security job network or the
Management & Operations Support job network respectively; “Length of Assignment” stands for the number
of years of the JPO assignment. Finally, “Application” indicates whether the JPO has applied for future
position while being a JPO, where 1= if they applied during the Programme, and 0= if they applied after the
Programme.
By entering the values of the variables on the right side of the equation, a prediction can be made regarding
the JPO’s probability of remaining in the UN System, i.e. his or her own projected retention rate. For example,
if a JPO who is male, who has 2 years of professional work experience with no prior UN experience, who had
completed 1 year (12 months) of duty in the Management and Operations Support job network, and applied
for the next job during his JPO assignment, the following values would be assigned for the variables:
Female = 0, experience = 1, UN experience = 0, Length of assignment = 1, Political = 0,
Management = 1, Application = 1
Therefore the equation becomes:
It is then solved for Prob
Given the above example JPO characteristics, the forecasted employment rate is 45%.
Table 4.1: Predicted probability of employment with UN based on characteristics for male JPOs:
Gender Duration
Management & Operations Support Application
Political, Peace & Security
UN Exp. Experience
Predicted Probability
1 Male < 1 year No No No No No 1%
2 Male 1 No No No No Yes 5%
3 Male 1 No No No Yes Yes 8%
4 Male 1 No No Yes Yes Yes 17%
5 Male 1 No Yes Yes Yes Yes 55%
6 Male 1 Yes Yes No Yes Yes 59%
7 Male 2 Yes Yes No Yes Yes 74%
37
8 Male 3 Yes Yes No Yes Yes 86%
9 Male 4 Yes Yes No Yes Yes 92%
Table 4.2 Predicted probability of employment with UN based on characteristics for female JPOs:
Gender Duration
Management & Operations Support Application
Political, Peace & Security UN Exp. Experience
Predicted Probability
1 Female < 1 year No No No No No 2%
2 Female 1 No No No No Yes 12%
3 Female 1 No No No Yes Yes 18%
4 Female 1 No No Yes Yes Yes 36%
5 Female 1 No Yes Yes Yes Yes 77%
6 Female 1 Yes Yes No Yes Yes 79%
7 Female 2 Yes Yes No Yes Yes 89%
8 Female 3 Yes Yes No Yes Yes 94%
9 Female 4 Yes Yes No Yes Yes 97%
Table 4.1 and 4.2 present estimated employment probability for male and female JPOs based on several
different characteristics related to their assignment. The estimated probabilities range from 1% to 97%. The
likelihood of employment increases between category 3 and 4 from 8% to 17% for males and 18% to 36% for
females, this occurs as JPOs are assigned to the Political, Peace and Security job family. The prospect of UN
employment sharply increases from 17% to 55%, when JPOs apply to their next position while in the
Programme. Predicted retentions for JPOs in the Management and Operations Support job network tend to be
higher than for JPOs in the Political, Peace & Security job network. As the duration of the JPO assignment
increases, the probability of being employed with the UN increases as well. Lastly, the predicted probabilities
for female JPOs are consistently higher as they have a higher likelihood of future career development within
the UN than their male counterparts.
Overall, the characteristics of the highest probability of employment of 97% are as follows:
Female JPO, with more than two years of professional work experience, which includes prior UN
experience, working as a JPO for 4 years in the Management and Operations Support job family, who
applied to her new job while still in the Programme
The model also helps in verifying prior statistically significant findings from the fourth report (2004-2008).
The 2004-2008 report found number of languages known, whether JPOs work in headquarters and having an
advanced level degree as statistically significant factors. However, the current model does not find these
statistically significant in explaining future career development. As 97% of JPOs have an advanced level
degree, education level does not have any association with future UN employment. However, lengths of
assignment, former professional experience and being assigned to the Management and Operations Support or
Political, Peace, & Security job network have a statistically significant positive effect on career development
within the overall UN system exactly six months after the completion of the JPO Program. Furthermore, this
report is the first to find gender (being female) to be a statistically significant explanatory variable for future
UN employment.

38
4.2 Detailed analysis of career development
In this section, for comparative analysis with previous surveys, JPOs’ future career development are classified
into six categories: the UN common system (UN), other International Organizations or NGOs (IO/NGO), the
public sector (Public), the private sector (Private), academic career including teaching and studying
(Academic), and unemployed including other statuses such as travelling, sabbatical or maternity
(Unemployed). Career development in this section refers to employment status at six months after completing
the Programme.
4.2.1 Post-Programme positions by survey (2009-2013)
Approximately 67% of JPOs were employed with the UN common system exactly six months after
completing their assignment, the highest percentage amongst all reports. Similarly, employment with other
International Organizations/NGOs has increased for the period 2009-2013. In contrast to the previous report
(2004-2008), employment within the private sector, public sector and academia has decreased.
Figure 4.1: Post-Programme positions by survey (1990-2013)
Table 4.3 Post-Programme positions by survey (2009-2013)
Employment Status 09-13 04-08 01-03 96-00 90-95
UN System 66.5% 63.1% 65.3% 52.4% 56%
IO/NGO 12.5% 10.6% 8.9% 7.7% 7.2%
Public 7.6% 9.6% 9.7% 13.3% 9.6%
Private 2.3% 5.6% 4% 16.1% 10.4%
Academic 3.0% 5.6% 3.2% 4.2% 12.8%
Unemployed 8.0% 5.6% 8.9% 6.3% 4%

39
4.2.2 Post-Programme positions by gender
Figure 4.2: Post-Programme positions by gender (2009-2013)
In line with previous reports, according to the findings of the analysed period, female JPOs are slightly more
likely to be employed within the UN common system than males, with 69% of females still working with the
UN exactly six months after the Programme versus only 63% of the males. The same patterns holds true for
employment within other International Organizations and NGOs.
Table 4.4: Post-Programme positions by gender (1990-2013)
Gender Survey UN % IO/
NGO
% Public % Private % Academic % Unemployed % Total %
09-13 71 63 13 12 13 12 3 3 4 4 8 7 112 100
04-08 55 59 12 13 8 9 6 7 6 7 6 7 93 100
Male 01-03 42 61 5 7 10 15 4 6 1 1 7 10 69 100
96-00 35 55 4 6 10 16 13 20 0 0 2 3 64 100
90-95 44 52 6 7 10 12 10 12 13 15 2 2 85 100
09-13 104 69 20 12 7 5 3 2 4 3 13 9 151 100
04-08 70 67 9 9 11 11 5 5 5 5 5 5 105 100
Female 01-03 39 71 6 11 2 4 1 2 3 6 4 7 55 100
96-00 40 51 7 9 9 11 10 13 6 8 7 9 79 100
90-95 26 65 3 8 2 5 3 8 3 8 3 8 40 100

40
4.2.3 Post-Programme positions by age (2009-2013)
Figure 4.3: Post-Programme positions by age (2009-2013)
Career opportunities in the UN common system continue to increase for JPOs in all age groups except the 34
plus category. JPOs who entered the Programme at age 27 and 28 were more likely to be employed with the
UN common system while employment among 34 plus age category declined over the last decade from 73%
(2001-2003) to 50% (2009-2013). We can hypothesize that JPOs in this category could have left voluntarily as
they have extensive professional experience and may already be part of an established professional network
with career opportunities.

41
Table 4.5: Post-Programme positions by age (1990-2013)
Age Survey UN % IO/
NGO % Public % Private % Academic % Unemployed % Total %
22-26
09-13 10 63 3 19 0 0 1 6 1 6 1 6 19 100
04-08 11 48 2 9 5 22 3 13 1 4 1 4 23 100
01-03 5 71 0 0 1 14 0 0 0 0 1 14 7 100
96-00 8 53 3 20 1 7 3 20 0 0 0 0 15 100
90-95 9 50 1 6 2 11 1 6 5 28 0 0 18 100
27-28
09-13 38 75 5 10 4 8 1 2 1 2 0 0 56 100
04-08 38 72 6 11 5 9 2 4 2 4 0 0 53 100
01-03 19 68 2 7 3 11 1 4 1 4 2 7 28 100
96-00 20 53 2 5 4 11 7 18 3 8 2 5 38 100
90-95 20 69 2 7 1 3 4 14 1 3 1 3 29 100
29-30
09-13 65 67 11 11 7 7 3 3 3 3 7 7 108 100
04-08 48 66 8 11 4 6 3 4 5 7 5 7 73 100
01-03 24 69 3 9 3 9 0 0 2 6 3 9 35 100
96-00 26 58 3 7 5 11 6 13 1 2 4 9 45 100
90-95 21 54 5 13 3 8 5 13 5 13 0 0 39 100
31-33
09-13 55 65 11 13 6 7 1 1 3 4 7 8 96 100
04-08 22 58 5 13 3 8 3 8 2 5 3 8 38 100
01-03 22 56 5 13 4 10 3 8 1 3 4 10 39 100
96-00 17 47 2 6 6 17 7 19 2 6 2 6 36 100
90-95 17 52 1 3 6 18 3 9 3 9 3 9 33 100
34+
09-13 7 50 3 21 3 21 0 0 0 0 0 0 17 100
04-08 6 55 0 0 2 18 0 0 1 9 2 18 11 100
01-03 11 73 1 7 1 7 1 7 0 0 1 7 15 100
96-00 4 44 1 11 3 33 0 0 0 0 1 11 9 100
90-95 1 25 0 0 0 0 0 0 2 50 1 25 4 100

42
4.2.4 Post-Programme positions by job network
Table 4.6: Post-Programme positions by job network (2009-2013)
Employment Status
Political,
Peace &
Security
%
Economic &
Social
Development
%
Management
&
Operations
Support
% Legal % Public
Information %
Information
Technology % Total %
UN Secretariat 86 66 27 38 25 64 5 42 1 20 3 60 145 56
UN Agencies 9 7 11 15 5 13 1 8 2 40 0 0 28 11
IO 7 5 6 8 1 3 2 17 0 0 0 16 6
NGO 9 7 6 8 1 3 0 0 1 20 0 0 17 6
Private 0 0 2 3 2 5 1 8 0 0 1 20 6 2
Public 12 9 6 8 2 5 0 0 0 0 0 0 20 8
Academics 1 1 5 7 2 5 0 0 0 0 0 0 8 3
Unemployed 3 2 7 10 1 3 3 25 0 0 1 20 15 6
Others 3 2 2 3 0 0 0 0 1 20 0 0 6 2
Total 130 100 72 100 39 100 12 100 5 100 5 100 263 100
In this survey, JPOs in the Political, Peace, and Security and the Management & Operations Support job
networks have the highest retention rates, as compared to the other job networks.
4.2.5 Post-Programme positions by length of assignment
Table 4.7: Post-Programme positions by length of assignment (2009-2013)
Duration
(Year) UN %
IO &
NGO % Public % Private % Academic % Unemployed % Total %
1 5 29.4 3 17.7 7 41.2 1 5.9 0 0.0 1 5.9 17 100.0
2 48 57.8 14 16.9 7 8.4 3 3.6 4 4.8 7 8.4 83 100.0
3 93 77.5 11 9.2 4 3.3 2 1.7 2 1.7 8 6.7 120 100.0
4 26 65.0 5 12.5 2 5.0 0 0.0 2 5.0 5 12.5 40 100.0
> 4 3 100.0 0 0.0 0 0.0 0 0.0 0 0.0 0 0.0 3 100.0
Total 175 66.5 33 12.55 20 7.6 6 2.2 8 3.0 21 7.9 263 100.0
Table 4.7 highlights that the chances to stay within the UN common system are noticeably higher for JPOs
who completed three years with the Programme versus JPOs with less than three years. Nearly 78% were
employed with the UN common system at six months after the completion of the Programme. In contrast,
only 58% of those with only a two-year JPO experience remained with the UN.

43
4.2.6 Post-Programme positions by country
Table 4.8: Post-Programme positions by country (2009-2013)
Survey UN % IO &
NGO % Public % Private % Academic % Unemployed % Total %
AUL
09-13 2 100.0 0 0.0 0 0.0 0 0.0 0 0.0 0 0.0 2 100.0
04-08 / / / / / / / / / / / / / /
01-03 / / / / / / / / / / / / / 100.0
96-00 1 100.0 0 0.0 0 0.0 0 0.0 0 0.0 0 0.0 1 /
90-95 / / / / / / / / / / / / / /
AUS
09-13 10 62.5 4 25.0 1 6.25 0 0.0 0 0.0 1 6.25 16 100.0
04-08 2 100.0 0 0.0 0 0.0 0 0.0 0 0.0 0 0.0 2 100.0
01-03 2 50.0 1 25.0 0 0.0 1 25.0 0 0.0 0 0.0 4 100.0
96-00 3 37.5 0 0.0 3 37.5 2 25.0 0 0.0 0 0.0 8 100.0
90-95 1 25.0 2 50.0 0 0.0 0 0.0 0 0.0 1 25.0 4 100.0
BEL
09-13 4 80.0 1 20.0 0 0.0 0 0.0 0 0.0 0 0.0 5 100.0
04-08 2 50.0 0 0.0 1 25 0 0.0 1 25.0 0 0 4 100.0
01-03 3 60.0 0 0.0 0 0.0 0 0.0 0 0.0 2 40.0 5 100.0
96-00 0 0.0 0 0.0 0 0.0 5 100 0 0.0 0 0.0 5 100.0
90-95 6 46.1 0 0.0 1 7.7 2 15.4 4 30.8 0 0.0 13 100.0
CAN
09-13 1 100.0 0 0.0 0 0.0 0 0.0 0 0.0 0 0.0 1 100.0
04-08 / / / / / / / / / / / / / /
01-03 / / / / / / / / / / / / / /
96-00 / / / / / / / / / / / / / /
90-95 / / / / / / / / / / / / / /
DEN
09-13 5 45.5 2 18.2 3 27.3 0 0.0 0 0.0 1 9.1 11 100.0
04-08 12 66.7 2 11.1 3 16.7 0 0.0 0 0.0 1 5.6 18 100.0
01-03 2 33.3 0 0.0 3 50.0 1 16.6 0 0.0 0 0.0 6 100.0
96-00 6 42.9 0 0.0 3 21.4 3 21.4 0 0.0 2 14.3 14 100.0
90-95 1 25.0 0 0.0 1 25.0 0 0.0 2 50.0 0 0.0 4 100.0
FIN
09-13 8 44.4 4 22.2 3 16.67 1 5.6 / / 2 11.1 18 100.0
04-08 2 33.3 0 0.0 0 0.0 0 0.0 3 50.0 1 16.7 6 100.0
01-03 7 87.5 0 0.0 0 0.0 0 0.0 1 12.5 0 0.0 8 100.0
96-00 1 33.3 1 33.3 0 0.0 0 0.0 1 33.3 0 0.0 3 100.0
90-95 1 25.0 0 0.0 3 75.0 0 0.0 0 0.0 0 0.0 4 100.0
FRA
09-13 28 75.7 3 8.1 / / 2 5.4 1 2.7 3 8.1 37 100.0
04-08 22 88.0 0 0.0 2 8.0 1 4.0 0 0.0 0 0.0 25 100.0
01-03 7 58.3 0 0.0 1 8.3 0 0.0 1 8.3 3 25.0 12 100.0
96-00 10 76.9 2 15.4 0 0.0 1 7.7 0 0.0 0 0.0 13 100.0
90-95 3 42.8 0 0.0 0 0.0 0 0.0 2 28.6 2 28.6 7 100.0

44
Survey UN % IO &
NGO % Public % Private % Academic % Unemployed % Total %
GER
09-13 39 72.2 4 7.4 4 7.4 2 3.7 2 3.7 3 5.6 54 100.0
04-08 22 66.7 3 9.1 3 9.1 2 6.1 3 9.1 0 0.0 33 100.0
01-03 12 66.6 2 11.1 1 5.5 2 11.1 0 0.0 1 5.5 18 100.0
96-00 14 63.6 2 9.1 2 9.1 4 18.2 0 0.0 0 0.0 22 100.0
90-95 8 47.0 2 11.8 0 0.0 7 41.2 0 0.0 0 0.0 17 100.0
ITA
09-13 19 63.3 5 16.7 0 0.0 0 0.0 3 10.0 3 10.0 30 100.0
04-08 20 71.4 5 17.9 0 0.0 1 3.6 1 3.6 1 3.6 28 100.0
01-03 8 57.1 3 21.4 0 0.0 0 0.0 1 7.1 2 14.2 14 100.0
96-00 25 69.4 1 2.8 2 5.6 2 5.6 3 8.3 3 8.3 36 100.0
90-95 14 63.8 0 0.0 4 18.2 0 0.0 4 18.2 0 0.0 22 100.0
JPN
09-13 6 100.0 0 0.0 0 0.0 0 0.0 0 0.0 0 0.0 6 100.0
04-08 3 50.0 0 0.0 0 0.0 0 0.0 0 0.0 3 50.0 6 100.0
01-03 4 80.0 0 0.0 1 20.0 0 0.0 0 0.0 0 0.0 5 100.0
96-00 1 100.0 0 0.0 0 0.0 0 0.0 0 0.0 0 0.0 1 100.0
90-95 3 75.0 0 0.0 0 0.0 0 0.0 1 25.0 0 0.0 4 100.0
LIE
09-13 1 100.0 0 0.0 0 0.0 0 0.0 0 0.0 0 0.0 1 100.0
04-08 / / / / / / / / / / / / / /
01-03 / / / / / / / / / / / / / /
96-00 / / / / / / / / / / / / / /
90-95 / / / / / / / / / / / / / /
LUX
09-13 1 100.0 0 0.0 0 0.0 0 0.0 0 0.0 0 0.0 1 100.0
04-08 2 100.0 0 0.0 0 0.0 0 0.0 0 0.0 0 0.0 2 100.0
01-03 0 0.0 0 0.0 0 0.0 0 0.0 0 0.0 1 100.0 1 100.0
96-00 / / / / / / / / / / / / / /
90-95 / / / / / / / / / / / / / /
NET
09-13 5 50.0 0 0.0 0 0.0 2 20.0 1 10.0 2 20.0 10 100.0
04-08 7 43.8 1 6.2 2 12.5 2 12.5 1 6.2 3 18.8 16 100.0
01-03 6 66.6 1 11.1 1 11.1 0 0.0 0 0.0 1 11.1 9 100.0
96-00 6 31.6 3 15.8 3 15.8 4 21.1 1 5.3 2 10.5 19 100.0
90-95 21 67.8 3 9.7 2 6.4 3 9.7 0 0.0 2 6.4 31 100.0
NOR
09-13 9 47.4 5 26.2 3 15.8 / / 1 5.3 1 5.3 19 100.0
04-08 5 50.0 1 10.0 1 10 3 30.0 0 0.0 0 0.0 10 100.0
01-03 1 100.0 0 0.0 0 0.0 0 0.0 0 0.0 0 0.0 1 100.0
96-00 1 50.0 0 0.0 1 50.0 0 0.0 0 0.0 0 0.0 2 100.0
90-95 1 100.0 0 0.0 0 0.0 0 0.0 0 0.0 0 0.0 1 100.0

45
Survey UN % IO &
NGO % Public % Private % Academic % Unemployed % Total %
NZE
09-13 / / / / / / / / / / / / / /
04-08 / / / / / / / / / / / / / /
01-03 1 100.0 0 0.0 0 0.0 0 0.0 0 0.0 0 0.0 1 100.0
96-00 / / / / / / / / / / / / / /
90-95 / / / / / / / / / / / / / /
POL
09-13 0 0.0 0 0.0 0 0.0 0 0.0 0 0.0 0 0.0 2 100.0
04-08 / / / / / / / / / / / / / /
01-03 / / / / / / / / / / / / / /
96-00 / / / / / / / / / / / / / /
90-95 / / / / / / / / / / / / / /
ROK
09-13 1 50.0 / / / / / / / / 1 50.0 2 100.0
04-08 3 75.0 0 0.0 1 25.0 0 0.0 0 0.0 0 0.0 4 100.0
01-03 1 100.0 0 0.0 0 0.0 0 0.0 0 0.0 0 0.0 1 100.0
96-00 1 100.0 0 0.0 0 0.0 0 0.0 0 0.0 0 0.0 1 100.0
90-95 / / / / / / / / / / / / / /
SAF
09-13 0 0.0 0 0.0 1 100.0 0 0.0 0 0.0 0 0.0 1 100.0
04-08 / / / / / / / / / / / / / /
01-03 / / / / / / / / / / / / / /
96-00 / / / / / / / / / / / / / /
90-95 / / / / / / / / / / / / / /
SPA
09-13 7 70.0 2 20.0 0 0.0 0 0.0 0 0.0 1 10.0 10 100.0
04-08 0 0.0 0 0.0 1 33.3 1 33.3 1 33.3 0 0.0 3 100.0
01-03 3 60.0 1 20.0 0 0.0 1 20.0 0 0.0 0 0.0 5 100.0
96-00 / / / / / / / / / / / / / /
90-95 / / / / / / / / / / / / / /
SWE
09-13 5 71.4 0 0.0 1 14.3 0 0.0 0 0.0 1 14.3 7 100.0
04-08 4 50.0 2 25.0 2 25.0 0 0.0 0 0.0 0 0.0 8 100.0
01-03 8 61.5 1 7.6 3 23.0 0 0.0 0 0.0 1 7.6 13 100.0
96-00 2 25.0 1 12.5 2 25.0 1 12.5 0 0.0 2 25.0 8 100.0
90-95 4 57.1 1 14.3 1 14.3 0 0.0 1 14.3 0 0.0 7 100.0
SWI
09-13 16 69.6 1 4.35 3 13.0 1 4.4 0 0.0 2 8.7 23 100.0
04-08 8 61.5 0 0.0 2 15.4 1 7.7 1 7.7 1 7.7 13 100.0
01-03 / / / / / / / / / / / / / /
96-00 0 0.0 0 0.0 1 100.0 0 0.0 0 0.0 0 0.0 1 100.0
90-95 / / / / / / / / / / / / / /

46
Survey UN % IO &
NGO % Public % Private % Academic % Unemployed % Total %
UK
09-13 / / / / / / / / / / / / / /
04-08 / / / / / / / / / / / / / /
01-03 / / / / / / / / / / / / / /
96-00 1 50.0 0 0.0 1 50.0 0 0.0 0 0.0 0 0.0 2 100.0
90-95 / / / / / / / / / / / / / /
DCC
09-13 7 87.5 1 12.5 0 0.0 0 0.0 0 0.0 0 0.0 8 100.0
04-08 11 55.0 7 35.0 1 5.0 0 0.0 0 0.0 1 5.0 20 100.0
01-03 16 76.1 2 9.5 2 9.5 0 0.0 1 4.7 0 0.0 21 100.0
96-00 3 42.9 1 14.3 1 14.3 1 14.3 1 14.3 0 0.0 7 100.0
90-95 7 63.6 1 9.1 0 0.0 1 9.1 2 18.2 0 0.0 11 100.0
Total
09-13 175 66.5 33 12.6 20 7.6 6 2.3 8 3.0 21 8.0 263 100.0
04-08 125 63.1 21 10.6 19 9.6 11 5.6 11 5.6 11 5.6 198 100.0
01-03 81 65.3 11 8.9 12 9.7 5 4.0 4 3.2 11 8.9 124 100.0
96-00 75 52.4 11 7.7 19 13.3 23 16.1 6 4.2 9 6.3 143 100.0
90-95 70 56.0 9 7.2 12 9.6 13 10.4 16 12.8 5 4.0 125 100.0

47
5 Conclusion
The major findings of this Report can be summarized as follows:
Gender is found to be a statistically significant factor for JPOs’ career development within the UN
system. Following the Programme, a higher proportion of females (69%) were employed with the
UN common system than their male (63%) counterparts.
The findings show that it is easier for JPO candidates with more than two years of pre-Programme
professional work experience and prior UN experience to find a position in the UN System.
Length of assignment was found to be a statistically significant variable explaining JPOs’ post-
Programme employment with the UN. 78% of former JPOs, whose contract was extended for a
third year, were employed with the UN common system at six months of completing the
Programme compared to only 58% of those JPOs who had a two-year assignment.
Applying to the next professional position at an early stage while in the Programme is found to be
a critical factor in explaining future career development with the UN. It is highly recommended
that JPOs start applying as early as possible. Given these findings, more emphasis will be placed
on career development support for current JPOs on board.
The overall employment rate of former JPOs in the UN Secretariat has increased from 63% in the
period 2004-2008 to approximately 67% in the period 2009-2013 while the percentage of former
JPOs who work in other international organizations and NGOs has increased even more
proportionally (10.6% in 2004-2008 and 12.54% in 2009-2013).
JPOs assigned to the Political, Peace and Security or the Management and Operations Support job
network had a higher chance of continued employment with the UN System. In fact, 77% of JPOs
assigned to the Management and Operations Support job network and 73% to the Political, Peace
and Security job network were retained within the UN system exactly six months after completing
the Programme.
According to our analysis, the following factors have not been found to be statistically significant
for JPOs’ career development: marital status, academic degree, academic field, language
proficiency, being assigned to headquarters, level of supervisor, previous field experience, and
geographical representation status.

48
6 Annex
Annex I: Associate Expert Online Survey
Your name
Last First Middle
Question 1
What was your academic level or equivalent when you started the JPO PROGRAMME?
First level university degree (BA/BS)
Advanced-level university degree (Masters) / or equivalent
Double Master or more
Ph.D.
Question 2
In what field was your main degree?
Law/Legal
Political Affairs/ International Relations
Economics/ Public Policy
Business/ Management/ Finance
Social Sciences (Sociology, Psychology, Urban Studies etc.)
Environmental Science/Science
Other (specify)
Question 3
What is your mother tongue (specify)
1-No Proficiency 2-Elementary proficiency 3-Basic working proficiency 4-Professional working
proficiency 5-Native/Bilingual
Please evaluate your language proficiency at the beginning of the assignment as an Associate Expert
Arabic 1 2 3 4 5
Chinese 1 2 3 4 5
French 1 2 3 4 5
Russian 1 2 3 4 5
Spanish 1 2 3 4 5
Please evaluate your language proficiency at the end of assignment as an Associate Expert
Arabic 1 2 3 4 5
Chinese 1 2 3 4 5
French 1 2 3 4 5
Russian 1 2 3 4 5
Spanish 1 2 3 4 5

49
Question 4 a) How many years of relevant professional work experience did you have prior to joining the JPO
Programme?
Less than 1 year
1 to 2 years
2 to 3 years
3- 4 years
More than 4 years
b) How many years of professional international experience at the field (working in a developing
country) did you have prior to joining the JPO Programme?
None
< 1 year
1 to 2 years
2 to 3 years
3- 4 years
More than 4 years
c) Did you have prior United Nations experience (e.g. Internship, volunteering, consultancy) before
joining the JPO Programme?
Yes
No
Question 5
Where did you find information about the JPO Programme for the first time?
Websites
UN Careers
Associate Experts Programme
National Government/National Agencies/ equivalent
Social Media (Facebook, LinkedIn, etc.)
National Government
Friends/Family
UN Employee/Professional Network Recommendation
University/ job fairs
Other (specify): ______________________________
Question 6
Please select the most appropriate reason (ONLY 1 OPTION) that motivated you to apply to the JPO
Programme:
To gain relevant international experience and work for an international organization
To apply my knowledge and expertise in a relevant field
To participate in international development cooperation
To utilize this opportunity to plan a long term career with United Nations
Others (Please specify): ____________________________________

50
Question 7
a) Except the time when you were successfully selected as a candidate, have you ever applied to the
Associate Experts/JPO/APO Programmes?
Yes
No
b) If YES, how many times and when?
Once
Twice
More than three times
Question 8
Please indicate the level of your first reporting officer (supervisor) during your JPO assignment?
P3
P4
P5
D1
D2
Others (Specify): __________________
Question 9
a) To which of the 8 UN job networks were you assigned to for your JPO position (if you were
transferred, please refer to first assignment)? Conference Management
Economic and Social Development
Information Systems and Communication Technology
Management and Operations Support
Legal
Political, Peace and Security
Public Information and External Relations
Safety and Security
b) Please indicate which job family you were assigned to within your chosen job
network:___________________________________________
(E.g. Economic Affairs within Economic and social development)
c) Was your JPO assignment exactly in the field that you were mostly interested in?
Yes.
No
Question 10
Did you complete the full duration planned for your assignment as an associate expert? If not, why?
Yes.
No, due to continuing education.
No, due to other work opportunities.
No, due to family issues.
No, due to the challenging living conditions at the duty station.
No, because it was not a good experience.
No, because of other reasons (specify)

51
Question 11
1-Disagree 2-Somewhat disagree 3-Neither disagree or agree 4-Somewhat agree 5-Agree
a) Was the JPO Programme able to satisfy your expectations regarding the JPO Programme:
(Please choose as appropriate)
1. To participate in international development cooperation 1 2 3 4 5
2. To apply my expertise and skills in a relevant field 1 2 3 4 5
3. To gain relevant international experience and work for an international organization 1 2 3 4 5
4. To continue a successful career with the United Nations system 1 2 3 4 5
b) Was the JPO Programme able to satisfy your personal expectations:
(Please choose as appropriate)
5. My experience allowed me to appreciate a multicultural environment 1 2 3 4 5
6. The JPO position allowed me grow to professionally 1 2 3 4 5
7. The JPO duties I performed were in line with what I expected 1 2 3 4 5
8. My work and input was very much valued in the office 1 2 3 4 5
9. I was provided with the guidance on the job 1 2 3 4 5
10. I received regular feedback from my immediate supervisor on my performance 1 2 3 4 5
11. I found my assignments challenging and meaningful 1 2 3 4 5
Question 12
When did you begin applying for other positions while being a JPO?
First Year
Second Year
Third Year
After exiting the JPO Programme
Question 13
Please rate the job sources according to how informative it was for your job search.
1-Very uninformative 2-Slightly uninformative 3-neither uninformative nor informative
4-Slightly informative 5-Very informative
(Please choose as appropriate)
Associate Expert Programme Circulation email 1 2 3 4 5
UN Careers page 1 2 3 4 5
Other Agencies 1 2 3 4 5
Internal job vacancy announcements 1 2 3 4 5
Professional network 1 2 3 4 5
Others (Please specify): ____________________ 1 2 3 4 5

52
Question 14
How long did it take before beginning a new job after exiting the JPO Programme?
Before the end of JPO position
< 1 month
1 to 6 months
7 to 12 months
> 12 months
Still searching
Question 15
What were you doing EXACTLY 6 MONTHS after the end of your assignment as an Associate Expert?
(Please specify department and level of appointment for UN /UN Agency/ International positions)
SKIP QUESTION 16 AND 17 IF YOU WERE NOT WORKING AT UN/ UN AGENCY/
INTERNATIONAL ORGANIZATION 6 MONTHS AFTER YOUR JPO DUTY (QUESTION 15)
Question 16
If you were working for the UN/International organization exactly 6 months after the end of your
assignment as an JPO, what type of contract did you receive?
Fixed-term
Temporary
YPP Career
Consultant
Others (Please specify): ____________________________
Question 17
How long was the contract of your new job after the JPO Programme (if applicable)?
Up to 6 months
6 months to 364 days
Work for the UN Secretariat:
_________________________________
Work for other UN agencies :
_________________________________
Work for other international
organizations :
_________________________________
Work for NGOs :
Work in the public sector:
Work in the private sector:
Self-employed
Teaching:
Studying
Unemployed
Other (specify):
Department
_______________________
_______________________
_______________________
Level (P1, P2, P3, P4,
Consultant)
______________________
______________________
______________________

53
1 year
2-3 years
Others (Please specify): _____________________
SKIP QUESTION 18 IF YOU WERE WORKING FOR AT UN/ UN AGENCY/
INTERNATIONAL ORGANIZATION 6 MONTHS AFTER YOUR JPO DUTY (QUESTION 15)
Question 18
If you did not continue to work with the UN, what is the specific reason?
Better work opportunities elsewhere
Return to education or teaching
Personal or family reasons
Did not want to continue to work abroad
Option of continuing with the UN was not available
Did not find the work interesting
Other reasons (specify)
Question 19
In what type of organization or area do you work now? (Please specify department and level of
appointment for UN /UN Agency/ International positions)
Work for the UN Secretariat:
_________________________________
Work for other UN agencies :
_________________________________
Work for other international
organizations :
_________________________________
Work for NGOs :
Work in the public sector:
Work in the private sector:
Self-employed
Teaching:
Studying
Unemployed
Other (specify):
Department
_______________________
_______________________
_______________________
Level (P1, P2, P3, P4,
Consultant)
______________________
______________________
______________________

54
Annex II: Abbreviations
AUL Australia
AUS Austria
BEL Belgium
CAN Canada
CTED Counter-Terrorism Committee Executive Directorate
DCC Developing Country Candidate
DEN Denmark
DESA Department of Economic and Social Affairs
DFS Department of Field Support
DGACM Department for General Assembly and Conference Management
DM Department of Management
DPA Department of Political Affairs
DPI Department of Public Information
DPKO Department of Peacekeeping Operations
ECE Economic Commission for Europe
EOSG Executive Office of the Secretary-General
ESCAP Economic and Social Commission for Asia and the Pacific
FIN Finland
FRA France
GER Germany
ITA Italy
JPN Japan
LIE Liechtenstein
LUX Luxembourg
NET Netherlands
NOR Norway
NZE New Zealand
OCHA Office for the Coordination of Humanitarian Affairs
ODA Office for Disarmament Affairs
OHCHR Office of the High Commissioner for Human Rights
OIF Organisation internationale de la francophonie
OIOS Office of Internal Oversight Services

55
OSRSG-
CAAC
Office of the Special Representative of the Secretary-
General for Children And Armed Conflict
PBSO The Peacebuilding Support Office
POL Poland
ROK Republic of Korea
SAF South Africa
SPA Spain
SWE Sweden
SWI Switzerland
UK United Kingdom of Great Britain and Northern Ireland
UNCDF United Nations Capital Development Fund
UNCTAD United Nations Conference on Trade and Development
UNDG United Nations Development Group
UNDP United Nations Development Programme
UNEP The United Nations Environment Programme
UNEP/CMS Convention on Migratory Species
UNICEF The United Nations Children's Fund
UNICRI United Nations Interregional Crime and Justice Research
Institute
UNISDR United Nations International Strategy for Disaster Reduction
UN-NGLS United Nations Non-governmental Liaison Service
UNODC United Nations Office on Drugs and Crime
UNOG United Nations Office at Geneva
UNON The United Nations Office at Nairobi
UNOPS The United Nations Office for Project Services
UNOSDP United Nations Sport for Development and Peace
UNRWA The United Nations Relief and Works Agency
UNSSC United Nations System Staff College
UNU United Nations University
UZB Uzbekistan
WFP World Food Programme
WHO World Health Organization

56
Annex III: Job networks and job families of the UN Secretariat
Job network Job family
Economic and Social Development
Economic Affairs
Environment Affairs
Population Affairs
Statistics
Social Sciences
Public Administration
Programme Management
Science and Technology
Drug Control and Crime Prevention
Management and Operations Support
Administration
Audit
Finance
Procurement
Human Resources
Medical
Production, Service & Transport
Investment Management
Management & Programme Analysis
Ethics
Engineering
Pension Management
Logistics
Political, Peace and Security
Political Affairs
Humanitarian Affairs
Human Rights
Civil Affairs
Electoral Affairs
Rule of Law
Information Systems and Communication
Technology Information Systems and Technology
Information Management
Legal
Jurists
Legal Affairs
Ombudsman
Public Information and External Relations Public Information
Protocol
Conference Management Conference Services
Language
Safety and Security
Security
Safety
Investigation