Embed Size (px)
Citation preview

Associate Professor Adela BÂRA, PhD
E-mail: [email protected]
Professor Ion LUNGU, PhD
E-mail: [email protected]
Simona-Vasilica OPREA, PhD
E-mail: [email protected]
Lecturer Iuliana BOTHA, PhD
E-mail: [email protected]
Alexandra CHINIE, PhD-c
E-mail: [email protected]
The Bucharest Academy of Economic Studies
MODEL ASSUMPTIONS FOR EFFICIENCY OF WIND POWER
PLANTS' OPERATION
Abstract. While the exploitation of the renewable resources takes more
ground, especially internationally, also in Romania we can identify some major
projects in the field of renewable energy, considered of great interest nowadays. As
we talk of an environment with low predictability, stimulating investors can be
achieved by using decision support systems with a powerfully predictions
simulator.
The architecture of the proposed informatics solution and the model of data
integration are briefly mentioned, as they were already exposed in our other works.
Instead, this paper focuses on forecasting and predictive models of renewable
energy and also on financial simulations performed in order to determine the
profitability of investments.
Keywords: Renewable energy, Databases, Decision Support Systems,
Forecasting, Naïve Bayes, Decision Trees, Support Vector Machines, Financial
models.
JEL Classification: C01, C53, L86, O13, Q42, Q43, Q47, Q48
1. Introduction
In the Energy Strategy of Romania for 2007–2020 (HG no.1069/2007), one of the
priorities of Romanian sector development is the promotion of energy production
based on renewable resources, so that these resources share in total electricity
consumption to be 35 % in 2015 and 38 % in 2020. According to Transelectrica’
studies (Transelectrica, 2008-2013), currently, in Romania, there are a significant
number of producers of energy from renewable sources, which receive green

Adela Bara, Ion Lungu, Simona Oprea, Iuliana Botha, Alexandra Chinie
___________________________________________________________
certificates whose installed capacity is about 2500 MW to April 1, 2013, of which
2095 MW in wind power plants (207 undispatchable and 1888 MW dispatchable),
94 MW photovoltaic power plants, 365 MW in small hydro power plants and 40
MW installed in biomass plants.
Investments in this area have increased rapidly from 2009, where the total energy
capacity was approximately 100 MW, to more than 2500 MW today. Currently,
new connection requests are registered in wind energy, covering over 20 000 MW,
in phase of contracting and technical connection approval, mainly in Dobrogea,
Moldova and Banat. In Romania, the main types of renewable energy sources
connected to NPS are: wind farms, photovoltaic power plants, small hydro plants
(SHP) and biomass and biogas plants. The largest share consists of wind farms,
followed by photoelectric power plants. But, integration into the National Power
System (NPS) of renewable resources is highly complex and involves technical,
economic and legal aspects, environmental issues, and issues related to
information flows and decision-making processes.
From the technical point of view, the production of renewable energy is determined
by a number of characteristics, depending on type of resources involved. So, wind
farms characteristics bring together the following issues, (Landberg, 2003):
Dependence on weather conditions for wind power generation, leads, even
when the wind blows at a more limited production conditioned by many
meteorological factors: velocity, direction and duration of wind. Due to the
random nature of wind, an accurate weather prediction (with errors less than
10 %) can be achieved only through stochastic methods. Existing forecasting
systems can produce significant errors which may generate grid outages,
what's more, being recorded many cases both on national and in European
level,
Power fluctuations caused by wind generation requires tertiary reserves that
can be used in two distinct situations: when the wind increases production,
reserves must be disconnected and when production decreases, reserves must
be engaged to cover the consumption of the power system. As estimates of
electricity produced from wind sources become more accurate, the need for
tertiary reserves in the system is reduced. The role of good estimation of the
wind generation is particularly important, because it reduces the costs of
operating safety of the system, costs which could cause significant increases
in electricity prices as a result of using of these reserves. Assuming a
forecast with an error of 10 %, wind power fluctuations being about 300
MW per hour, it means that the power reserve needed is about 330 MW per
hour. However, if the fluctuations is 600 MW per hour, then the reserve
requirements doubles, doubling the availability and costs of power reserve
dial. In reality when operating, power fluctuations generated in an hour of
wind power is 300 MW, but reserving a power of 600 MW lead to higher
costs without requiring using the reserves.
From an economic point of view, this field can be very profitable because of the
support scheme and promotion of renewable resources based on green certificates

Model Assumptions for Efficiency of Wind Power Plants' Operation
_______________________________________________________________
(GC). Depending on resource type, renewable energy producers receive a number
of green certificates for electricity produced and delivered to the system. The green
certificates are traded on a dedicated market where the demand is represented by
energy suppliers who must purchase a number of GC in percentage to the
consumption covered by that energy producer. GCs’ price varies between a
minimum price, according with the laws, meant to protect producers so that they
can recoup the investment, and a maximum price, designed to protect the end
consumers whose final price of electricity covers entirely the green certificates.
The higher will be the number of producers and production is more widespread, the
price will be oriented to the minimum value. Besides, the large number of
producers reflected in high installed power does no guarantees of full integration
into the network, being possible that the Transmission and System Operator (TSO)
– Transelectrica SA to limit their operation taking into account the safety principle.
Thus, an integrated simulation and analysis system of the power plants operation
based on renewable resources will increase the system security and will optimize
the resources involved.
To support investments in this field, the potential investors need advice and active
support, both technically on grid connection solutions, but also financially for
making a business plan efficiently as much as can be done.
From information point of view, renewable energy producers use now, for the
management of current activities, various heterogeneous systems developed in
house or purchased from IT solutions vendors. This approach involves additional
investments in infrastructure, products and IT services, resulting heterogeneity of
information provided by these systems. Thus, monitoring and activities analysis by
production units are not performed consistently, which produces differences,
sometimes major, regarding information provided to Regulatory Authority (ANRE)
and Transmission and System Operator (TSO). For instance, hourly production
estimations for renewable generation within 1-3 days record significant errors,
depending on the forecasting system or service used locally. Under the Commercial
Code (ANRE, 2004) of the energy market in Romania, the production companies
are required to notify the hourly production, as these must to comply the estimation
transmitted to the Romanian Gas and Electricity Market Operator (OPCOM) and
the National Dispatching Centre (NDC). If there are fluctuations in comparison
with the estimations then imbalances are paid. The Code provides for the existence
of Balancing Responsible Party (BRP), consisting of one or more production
companies which aim to avoid imbalances. For instance, such an association can be
formed by wind farms, hydro power plants and photovoltaic power stations. An
incorrect notification made by the wind farms can have adverse consequences for
hydro power plants and photovoltaic power stations. In the event that notification
of BRP is not met, the TSO (Transelectrica) must dispatch electricity production
units to ensure permanently the balance between production and consumption
which is reflected in the operation frequency of the system. A good estimate of
production, from BRP side, would mean an additional cost reduction caused by

Adela Bara, Ion Lungu, Simona Oprea, Iuliana Botha, Alexandra Chinie
___________________________________________________________
imbalances, and nationally, can optimize the resources allocated in the system and
the balance production/consumption would be more predictable.
In this context, based on team experience in decision making systems, we believe
that the research motivation in proposing an analytical and support system for
decision making process, in a dynamic field with a significant impact on economic
and social environment is entirely justified. Accordingly, we propose a prototype to
forecast and analyze investments in renewable energy field with application in
wind power plants. The relevance of this model follows from benefits of both
producers and investors in renewable energy.
2. System’s architecture
The proposed prototype is designed for renewable investors in wind power plants
(WPP) and will offer advice and active support by providing simulation services
and achievement of the business plan on which to base their investment decision
making. The components of the prototype are:
An integration model, where sources derived from current activities are
stored in on a cloud computing infrastructure. This approach will allow the
design of a unified forecasting and analytical model for wind energy
production.
A predictive model of energy produced from wind sources by which we
aim to improve the estimates given by the producers on hourly and daily
averages in order to decrease costs related to differences between notices
and real production and to increase operation safety.
An advanced analysis, simulation and strategic planning model, based on
sets of performance indicators, which can be used by managers to analyze
in real time the activities of their renewable power plants and in a most
efficient way, by means of customizable and interactive reports.
Figure 1 – The architecture of the proposed prototype

Model Assumptions for Efficiency of Wind Power Plants' Operation
_______________________________________________________________
3. The integration model
The data sources received regularly from wind farms will be integrated into a
central database via an integration framework. Data will be received in XML
format and will be stored in a relational database.
The locations of wind farms and also the areas that record energy consumption and
production will be stored in the database in the form of spatial data in order to
represent them on geographic maps for activity monitoring.
An effective way to facilitate data integration involves specifying a standard
structure, consistent with the template of data that will be received from operators
of wind turbines. Based on such standard structures, defined through XML
Schemas, the following database tables will be created: date_meteo_t, consum_t,
productie_t. These XML Schemas were also used to validate data received in
various formats from various external sources.
For example, the following is the XML Schema corresponding to the structure of
XML documents relating to the consumption in MW registered at the connection
points. Subsequently, the XML Schema was transformed in a database table,
through a mapping algorithm. <?xml version="1.0" encoding="ISO-8859-1" ?>
<xs:schema xmlns:xs="http://www.w3.org/2001/XMLSchema">
<!-- defining a complex element, whose components will be
mapped to attributes of the consum_t table -->
<xs:element name="consum_eol">
<xs:complexType>
<!-- indicating the use of a sequence that will group the
sub-elements-->
<xs:sequence>
<!-- defining simple datatype elements, which will be
mapped to attributes of the consum_t table -->
<xs:element name="data">
<xs:simpleType>
<xs:restriction base="xs:date">
</xs:restriction>
</xs:simpleType>
</xs:element>
<xs:element name="consum">
<xs:simpleType>
<xs:restriction base="xs:decimal">
</xs:restriction>
</xs:simpleType>
</xs:element>
<!-- defining a simple type attribute that is mandatory to
be completed and that will be mapped to a primary key
attribute in the database table consum_t -->
</xs:sequence>
..<xs:attribute name="id_statie_racord" type="xs:integer"
use="required"/>
Adela Bara, Ion Lungu, Simona Oprea, Iuliana Botha, Alexandra Chinie
___________________________________________________________ </xs:complexType>
</xs:element>
</xs:schema>
In order to implement the defined model in a database, XML Schema is
transformed according to the algorithm proposed in (Botha, 2012), resulting
specific elements of the database. This gives, in fact, the source code for data
definition statements (DDL commands belonging to Data Definition Language) CREATE TABLE consum_t
(id_statie_racord NUMBER PRIMARY KEY,
data TIMESTAMP,
consum NUMBER);
These database tables are obtained from the transformation of XML Schemas
related to documents to be received from the wind farm operators. XML
documents in question are automatically generated at the connection points (data
related to energy consumption), by the anemometers placed in the area of each
wind farm (data on weather conditions) and by the wind turbines (data related to
energy production). Once these documents are generated, the operators will load
them in the system, in order to check their consistency again by using XML
Schemas (see the data component from the system’s architecture).
4. The predictive model
At this moment, renewable power plants, based mainly on wind resources, have not
been able to establish effective solutions for estimating and forecasting the
production, errors of 10-15% are common. The most important problem, which
production, profitability of investments in wind power and sizing of energy
reserves in the system depends on, is the component that builds their operation,
namely the wind. Wind energy production is conditioned also by other factors such
as: slipstream effect, soil orography, power characteristics, losses up to the
connection point of etc. These factors are identified and detailed in the fundamental
work (Ackerman, 2005), (Burton, 2001), (Landberg, 2003). For knowledge based
management, it is necessary to be able to make an accurate prediction with
minimum errors. Studies carried out nationally (studies realized by SC ISPE SA,
Tractebel Engineering SA, ICEMENERG ) revealed that these errors propagated in
the national energy system can lead, in periods of maximum consumption, to a
failure of the produced power in specific regions. In Europe, some forecasting
systems are used, built in Germany, France, Denmark, Spain, for example
CrossGrid systems - Weather Forecasting Application, Zephyr - Prediktor - Anemo
(DMI, 2013), AWPPS (ARMINES Wind Power Prediction System 2013)
developed at Ecole des Mines de Paris (AWPPS, 2013), ALADIN project
(Adaptation Dynamique Développement international Aire limits) initiated in 1990
by Meteo -France, but errors recorded are still high, with an accuracy of 85-90 %,
which may lead to over- dimensioning of resources or systems crashes (Bossanyi,
1985), (Fukuda, 2001). In addition to the recorded errors, appears also the

Model Assumptions for Efficiency of Wind Power Plants' Operation
_______________________________________________________________
extremely high costs issue, related to the computing power for servers, which leads
to the impossibility of their application widely in Romania.
As specified in (Lungu, 2012), (Bara, 2010), depending on measured
meteorological factors, investments can be made in wind generators whose power
features best fit the potential of the respective emplacement. Power characteristics
can be very different. For example, for an average wind speed of 6-7 m/s it will be
chosen a generator to produce at rated power at lower wind speeds. The primary
energy used to drive the wind turbine blades is determined by the movement of air
masses under the action of temperature differences on the surface of the globe
According to (Heir, 2006) and (Oprea, 2009) the PWA theoretical power that can be
obtained is:
1
2
21
22
31
2122
21 11
4)()(
4
1
v
v
v
vvAvvvvAPWA
(1)
where:
t - time
V - the volume of air mass;
- the air density (air = 1,2 kg/m3);
m - air mass;
v1/v2 - wind speed in front/rear of the blades of the wind generator.
The above expression reveals a variation of the PWA theoretical power depending
on the v2/v1 ratio. It notes that the appropriate choice of the v2/v1 ratio can lead to
maximizing the power taken from the energy of the air masses.
2
1
2
2
1
2
3
1
12
3214
0)/( v
v
v
vvAP
vvd
dWA
(2)
3/1/ 12 opt
vv
Therefore, the maximum power that can be taken from the energy of air masses,
with current technology, is:
3
1max,27
8vAPW A
(3)
where:
A – scanned area by the wind generator group paddles;
– air density (air = 1,2 kg/m3);
v – wind speed.
In conclusion the available power of a WPP is proportional to the air density, wind
speed to third power and with scanned area by the generator paddles.
According to (Heir, 2006) and (Oprea, 2009), it results that the maximum power is
only part of this:
Adela Bara, Ion Lungu, Simona Oprea, Iuliana Botha, Alexandra Chinie
___________________________________________________________
PvantWA CPvAvAP 59,02
1
27
8 31
31max, (4)
where CP is the power coefficient or power factor.
According to (Bara, 2010-2013), power factor can be calculated individually for
each WPP. It is determined as the ratio between produced power and installed
power. This factor depends heavily on weather conditions of each emplacement.
Typically, the power factor lies in the range 0.25 (low wind speeds) and 0.4 (high
wind speeds). From the above it follows that determining the electricity produced
by wind sources is extremely important both in the investment stage, in order to
choose the type of wind generator and the field emplacement of each production
unit and in the exploitation phase in order to achieve production forecasts.
The predictive model for the produced energy is based on a set of data mining
algorithms that can determine to what degree the produced energy is influenced by
factors such as direction and velocity of wind at different altitudes, atmospheric
pressure, temperature, luminosity, soil orography, placement of turbines, slipstream
effect, power characteristics, loses up to the connection point.
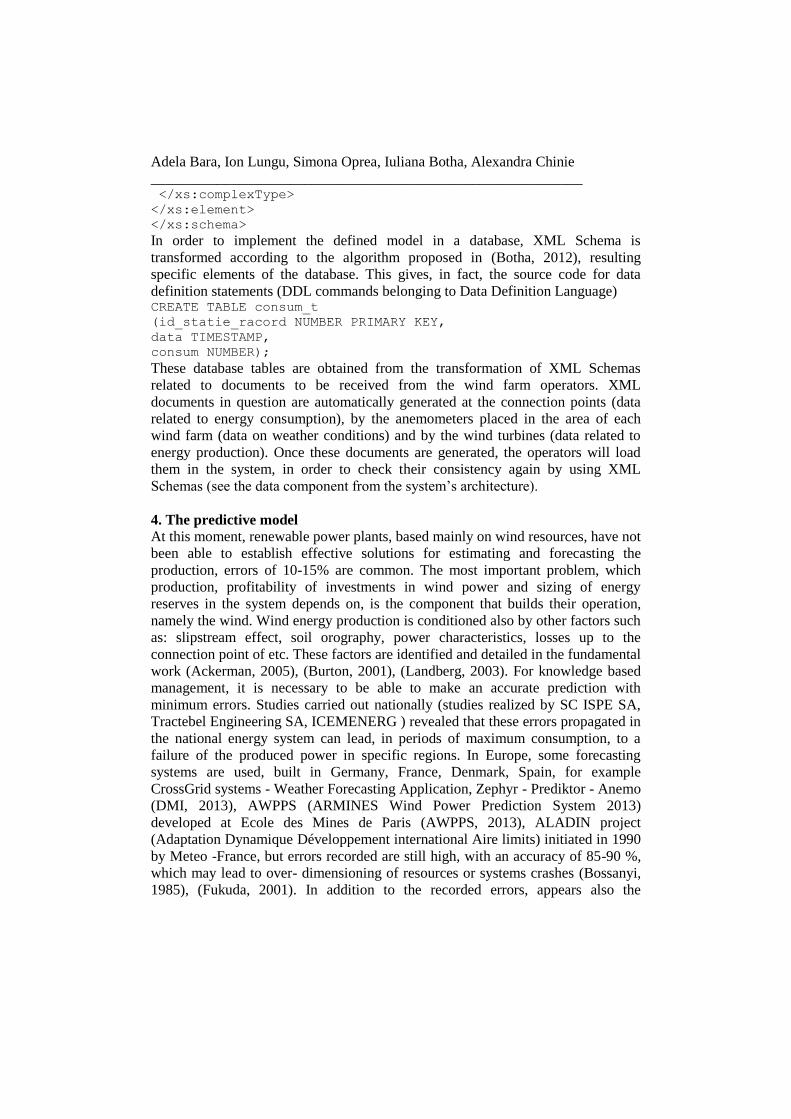
Mainly a general feature for the wind turbines, the optimal range of wind speed in
which they produce energy is between 3 and 25 m/s. If the wind speed drops below
this limit or it exceeds 27 m/s the turbines stop. From previous analysis in (Bara,
2010) it is revealed that the main natural factor, wind speed, records significant
fluctuations even within a few hours (Figure 2).
Figure 2 - Fluctuations of wind velocity within day/months
Hence, the importance of making the best possible forecasts for each park.
Forecasts are realized also based on historical data recorded by the devices from
the park, devices installed on to the pole so: three anemometers at a height of 52 m,
50 m, 30 m that measure wind speed, two wind vanes at 50 m and 30 m that
measure wind direction, a barometric pressure sensor and a temperature sensor.
Measurement performed with the anemometer mounted at 52 m it is not disturbed
by the presence of the pole.
The algorithms are developed and tested based on three-site measurement data
recorded from 10 to 10 minutes between 14 November 2011, 23h and 4 September
2012, 11h in 29 WPPs. The records from the measurements devices are processed

Model Assumptions for Efficiency of Wind Power Plants' Operation
_______________________________________________________________
and loaded into the central database as described in Section 2. The total of values
recorded for the height of 50 m is 16037. The minimum value recorded in this time
interval is 0 m/s, the maximum is 24.8 m/s, and the average is 6.9 m/s
From the set consisting of 16037 records of wind speed at a height of 50 m, about
2500 were lower or equal to 3.5 m/s - the start speed of a wind generator group
(WGG). In approximately 1100 cases the wind speed exceeded 12 m/s.
Approximately 8,800 of the measured values were lower than the average speed,
and about 7200 were over the average wind speed (6.9 m/s).
Thus the records in the source table in which the measured values have been
imported are divided into three sets for each stage that will be covered:
the learning stage which consists in applying the algorithm built on the data
set from the wind_build table and building the analysis model;
the testing step, in which the pattern constructed in the previous step is
tested on the set of data from the wind_test table;
the validation phase, in which is applied the built model on the wind_apply
dataset to verify the results obtained from applying the algorithm.
Attributes used in the algorithm are:
S1 – wind speed at a height of 52 m;
S2 – wind speed at a height of 50 m;
S3 – wind speed at a height of 30 m;
D1 and D2 – vector components of the wind direction;
H1 – humidity;
T1 – temperature;
B1 – atmospheric pressure;
R1 – the amount of precipitation;
E – produced energy;
The output of the data mining model is the produced energy. We developed two
sets of algorithms: the first set is used to determine with a high degree of accuracy
whether the energy is produced or not (E01 values) and the second set is used to
determine the actual value of the produced energy (E). In both cases we have
started the research from the existing specialty studies, like (Costea , 2009), (Ecer,
2013), (Agapie, 2009) and (Pazienza, 2011).
First set – predicting the target attribute for E01 where 0 – no energy will be
produced caused by the wind speed less then 3.5m/s or above 25 m/s, 1 – energy
will be produced due to the wind speed between 3.5-25m/s.
We applied two types of data mining algorithms that allow us to predict with a high
accuracy the yes/no values:
Naïve Bayes – we obtained an average of 94% accuracy;
Decision Tree - the accuracy is 99%, better then the Naïve Bayes.
In conclusion by using the decision tree algorithm we can obtain an excellent
accuracy that can be considered very reliable.
The second set – predicting discrete values for the produced energy.
Adela Bara, Ion Lungu, Simona Oprea, Iuliana Botha, Alexandra Chinie
___________________________________________________________
In order to scale properly the influence factors we applied the Attribute
Importance algorithm and identified first attributes that have the greatest influence
on the produced energy. These attributes are wind speed and direction at 52 and 50
m, temperature and air pressure.
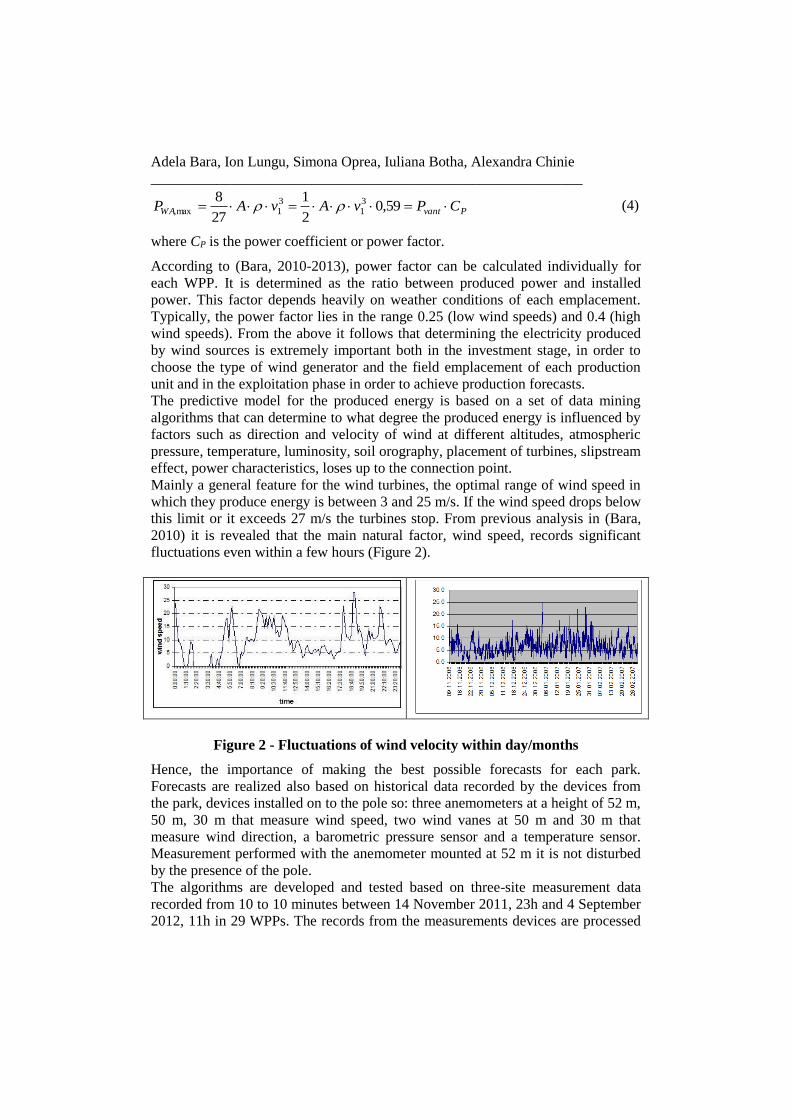
Than we build the Regression with Support Vector Machines algorithm to predict
the actual energy that can be obtained using these attributes. The accuracy of the
model is about 58% which is a low accuracy and cannot be used for forecasting.
The residual plot indicates that the errors are significant and the differences
between the actual energy and the predicted energy can be of ± 800 kW. Supposing
that the actual energy is 100 kW, the model will predict around 900 kW or in a
negative scenario that the WPP will not produce.
Therefore, given the high degree of scattering of the data, the regression model
should be applied to an attribute with values in certain intervals depending on wind
speed and temperature. Thus, we introduced the attribute E_THRESHOLD
grouping values of produced power by intervals depending on variation of wind
velocity of 0.5 m/s. For example, we have found that at wind speeds between 0 and
3.5 m/s power output is 0 kW, at speeds of 3.5-4 m/s power output is of 43 kW,
etc. These thresholds are defined according to the power characteristic of a WGG.
After building the regression model there can be noticed significant increase in
prediction accuracy from 57.68% to 93.72% (Figure 3). The errors are between ±
20 kW, so if the recorded energy is 100 kW, the model will provide estimation
within 80 kW and 120 kW.
Figure 3 - Residual plot data results of the regression with thresholds values
for 24h
In the following table we compared the results from the regression models with the
actual energy. The regression with E_THRESHOLD has a better accuracy.
Model Assumptions for Efficiency of Wind Power Plants' Operation
_______________________________________________________________
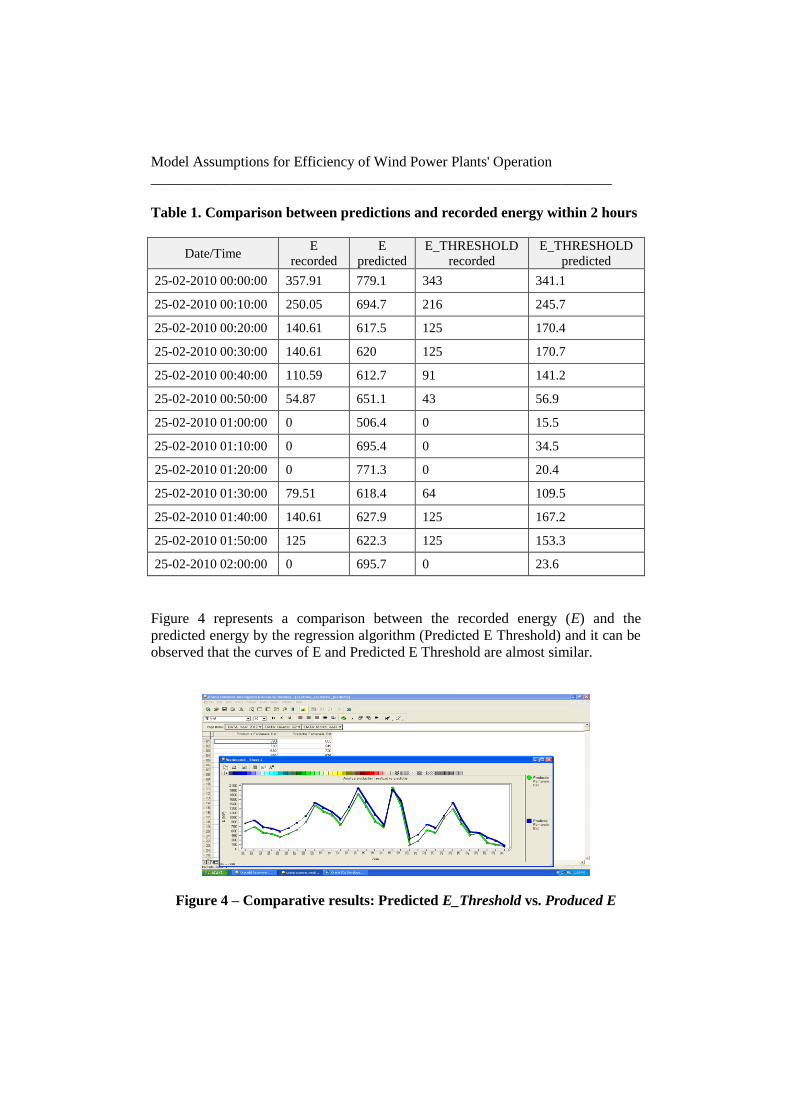
Table 1. Comparison between predictions and recorded energy within 2 hours
Date/Time E
recorded
E
predicted
E_THRESHOLD
recorded
E_THRESHOLD
predicted
25-02-2010 00:00:00 357.91 779.1 343 341.1
25-02-2010 00:10:00 250.05 694.7 216 245.7
25-02-2010 00:20:00 140.61 617.5 125 170.4
25-02-2010 00:30:00 140.61 620 125 170.7
25-02-2010 00:40:00 110.59 612.7 91 141.2
25-02-2010 00:50:00 54.87 651.1 43 56.9
25-02-2010 01:00:00 0 506.4 0 15.5
25-02-2010 01:10:00 0 695.4 0 34.5
25-02-2010 01:20:00 0 771.3 0 20.4
25-02-2010 01:30:00 79.51 618.4 64 109.5
25-02-2010 01:40:00 140.61 627.9 125 167.2
25-02-2010 01:50:00 125 622.3 125 153.3
25-02-2010 02:00:00 0 695.7 0 23.6
Figure 4 represents a comparison between the recorded energy (E) and the
predicted energy by the regression algorithm (Predicted E Threshold) and it can be
observed that the curves of E and Predicted E Threshold are almost similar.
Figure 4 – Comparative results: Predicted E_Threshold vs. Produced E
Adela Bara, Ion Lungu, Simona Oprea, Iuliana Botha, Alexandra Chinie
___________________________________________________________
By applying the data mining algorithms for predicting power produced by WPP
there have been obtained good results in particular by establishing some thresholds
of power. With their help, the data mining algorithm was able to learn and better
establish the dependency between variables, the forecast being much closer to the
values measured in reality.
5. The advanced analysis, simulation and strategic planning model
The model will be developed as a simulator that relies on a financial model based
on parameters such as capacity factor, nameplate capacity, percentage of time the
plant will be operating, capital expenditures regarding the amount of euro per
installed kilowatt, the inflation rate per period, operating and maintenance costs,
the lifetime of the plant, balancing costs and revenue. The simulator will allow the
investors to fundament their decisions.
The presented analysis is based on the fictive company Wind Park S.R.L. that has a
nameplate capacity of 50MW, powered by 20 turbines, each with a capacity of 2.5
MW. The plant is on-line 25% of the year. The energy production of the plant will
be the product of the nameplate capacity and the number of hours when the power
plant is online. Four different cases that would underline the efficiency of the
simulator presented in this paper will be further presented.
In order to discount future cash expenses and cash revenues, the weighted
average cost of capital is used:
(5)
where re=rf + ß x (rm-rf);
rf - the risk-free rate;
ß - predicted equity beta (levered);
(rm-rf) - the market risk premium;
rd - the debt .
The capital structure of the company is 50% private equity and 50% borrowed
capital. The tax which we take into account is the income tax in Romania, 16%.
The chosen risk-free rate is 0.048, and the market risk premium for Romania is
0.081, according to the analysis of (Fernandez, 2014). The beta estimate for wind
projects varies between 1.25 (Carson, 2013) and 1.87 (Konrad, 2009). An
alternative to compute the beta estimate for a wind park project is based on the
performance of other renewable energy companies that operate in the same
business. For the present analysis, a beta estimate of 1.518 is used.
When introducing the values in the WACC formula, the result becomes a value of
0.1149. This value is in EIA’s discount rate used for renewable energy projects,
which varies between 8% and 13% (EWEA, 2009). Wind power investments are constituted out of two main costs types: the net
present value of total capital costs (TKCpv) and operations and maintenance costs
(O&Mpv).
Model Assumptions for Efficiency of Wind Power Plants' Operation
_______________________________________________________________
The total capital costs comprise the costs of the feasibility studies, consultancy,
land, foundation, the turbines, ex works transportation, electric installation, grid-
connection and road construction, if they were to happen in one day. However, the
construction of a wind park usually takes around 3 years. The cash flow expenses
need to be discounted to present with the following discount rate:
(6)
where i= 3% and r=WACC=11,49%. Thus, R= 0.9238
Depreciation, operation and maintenance are deductible costs that reduce taxable
income. This way, these costs are reduced by the amount recovered from the
income taxation. The total capital costs of WP also take into account the
depreciation tax shield (Formula 7). The depreciation tax shield is taken into
consideration after the project has been finalized and the assets have been put in
function. In the present case, these will run starting with the 3rd year.
(7)
where DTSpv - present value of the depreciation tax shield;
x – tax rate;
Dn – depreciation in period n;
t – the number of periods for construction;
z – the economic life of the asset;
r – the nominal discount rate.
Depreciation is always discounted with the nominal discount rate. The discount
rate R used for depreciation will be 1/(1+r). The formula for the NPV of total
capital costs becomes:
(8)
(9)
According to the estimations of (EWEA, 2009) in 2006, the capital costs in
Europe can vary between 1000-1350 EUR per installed kW. The structure of
capital costs includes turbines with ex works transport, foundation, electric
installation, grid-connection, consultancy and land. For our simulation, we will
use a cost of 1100 EUR/kW. The used depreciation method will be accelerated,
with 50% of the total capital costs being depreciated in the first year of
production, and 50% depreciated in equal amounts during the remaining 29
years.
Adela Bara, Ion Lungu, Simona Oprea, Iuliana Botha, Alexandra Chinie
___________________________________________________________
The operation and maintenance costs used for the analysis are 20EUR/installed
kW/year. Operation and maintenance costs will only start after the project lead
time is over and the power plant is functional. No operational expenses will be
approved in the last year before the plant decommissioning.
(10)
The revenues of the company are generated from the price of electricity and green
certificates. The price of the electricity varies from hour to hour. Based on the
average electricity price on the regulated market in January 2014, an average price
of 45EUR/MWh will be used in our analysis. The average price for green
certificates in 2013 also averages around 45 EUR/MWh. Thus, the revenues of the
company will be the product of the electricity output and the prices per MWh and
per green certificate.
The energy producer may sign a regulated or unregulated contract with an energy
provider that must comply with the commercial code for the energy market. The
producer thereby engages to provide a certain energy production, for a market
based price for each hour of the day. The energy producer may also participate to
the day-ahead market, registering an offer with a maximum of 25 quantity-price
pairs. Each pair of the selling offer defines the minimum price at which the
producer is willing to sell an energy quantity that doesn’t exceed the one
mentioned in the quantity-price pair. All licensed energy providers are obliged to
participate to the balancing market, where they must register offers for power
increase and power reduction. Based on these offers, the market deficit and excess
prices are calculated (ANRE, 2004).
The chosen market closure price for the present analysis is 45 EUR/MWh. The
energetic deficit price is 63.9 EUR/MWh (the average deficit price in January), and
the energetic excess price is 8.05 EUR/MWh (the average excess price in January).
The prediction of the energy production consequently gains a major importance in
maximizing the producer’s profits. Creating a deficit on the market by announcing
a higher production on the market than the later real production, triggers an
equilibration cost that the company must pay. Also, when exceeding the planned
production, one would receive revenue based on excess prices, instead of the
market closing price, losing possible revenue based on a wrong prediction.
The usual estimation errors of energy players recorded by the actual forecasting
systems have an average between 15% and 30%. The tests of the presented solution
have shown an average estimation error of 5%.
Four different cases will be further presented, with estimation errors of 20%,
respectively 5%, as follows:
Scenario I: an error of 20%, with actual production higher than the planned
production (Pp<Pa); the planned production was of 95,812.5 MWh. The
actual production was 114,975 MWh, 20% over the estimation;
Model Assumptions for Efficiency of Wind Power Plants' Operation
_______________________________________________________________
Scenario II: an error of 20%, with actual production lower than the planned
production (Pp>Pa); the planned production was 109,500MWh. The actual
production was 91,250 MWh, 20% below the estimation;
Scenario III: an error of 5%, with actual production higher than the planned
production (Pp<Pa); the planned production was of 109,500 MWh. The
actual production was 114,975 MWh, 5% over the estimation;
Scenario IV: an error of 5%, with actual production lower than the planned
production (Pp>Pa); the planned production was 95,812.5 MWh. The
actual production was 91,250 MWh, 5% below the estimation.
The revenues for the four cases are based on the below calculations:
Scenarios I & III (Pp<Pa): Pp*MCP+Pp*Pcert+(Pa-Pp)*Pe
Scenarios II & IV (Pp>Pa): Pa*MCP+Pa*Pcert+(Pa-Pp)*Pd,
where MCP is the market closing price and Pcert is the price per green certificate
The four models are extrapolations of cases where a wind energy provider
continuously overestimates or underestimates the energy production, for analysis
purposes.
The overnight capital costs for the power plant amount to 55Mil EUR. The annual
O&M costs add up to 1Mil EUR. The depreciation method is accelerated, with
50% of the capital costs being depreciated in the first year of operation; the
remaining amount is split into equal amounts during the 29 years left. Depreciation
will lower capital costs with 4.4 Mil current Euro in the first year and a further
amount of 151,724 current Euro annually, in the remaining 29 years. Operation and
maintenance costs will also generate a cost cut of 160,000 EUR annually through
deductibility. All costs will be discounted with R = (1+i)/(1+r) = 0.9238, while
depreciation is discounted using a nominal discount rate 1/(1+r) = 0.8969.
The implementation of the presented prediction model had different results
depending on the prediction error type. When comparing the prediction errors of
actual production being lower with 20%, respectively 5%, the difference between
the two NPVs (net present value) and IRRs (internal rate of return) are smaller than
the difference occurring between prediction errors of actual production being
higher than predicted. In all four scenarios, the IRR is higher than the hurdle rate of
11,49%. However, Scenario II, with a prediction error of 20% and an actual
production lower than the planned production, is only 0,5% higher than the hurdle
rate. The overview of the four models can be analysed in Table 2.
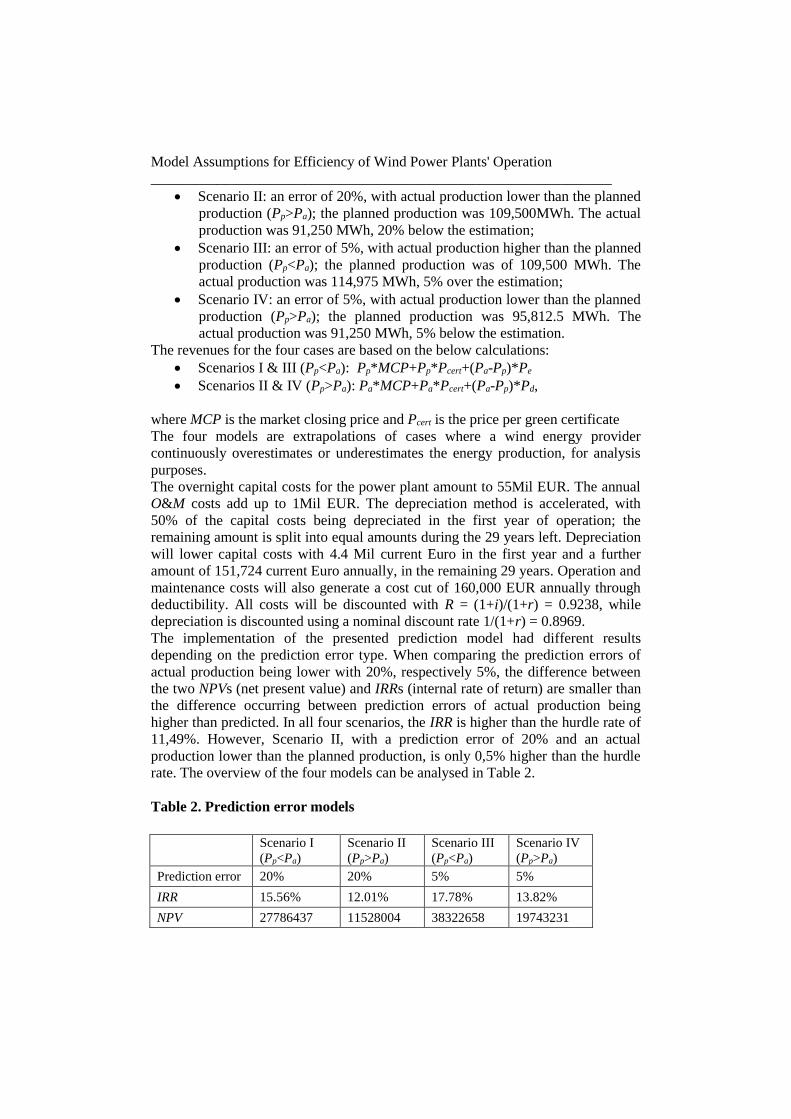
Table 2. Prediction error models
Scenario I
(Pp<Pa)
Scenario II
(Pp>Pa)
Scenario III
(Pp<Pa)
Scenario IV
(Pp>Pa)
Prediction error 20% 20% 5% 5%
IRR 15.56% 12.01% 17.78% 13.82%
NPV 27786437 11528004 38322658 19743231
Adela Bara, Ion Lungu, Simona Oprea, Iuliana Botha, Alexandra Chinie
___________________________________________________________
DPP (years) 9.75 15.75 8.00 12.00
PP (years) 5.50 7.00 4.50 6.25
Legend: IRR – internal rate of return, NPV – net present value, DPP – discounted payback
period, PP – payback period
The third scenario (Pp<Pa), with a prediction error of 5%, had a NPV with
10,536,221.4577 EUR more than the first scenario (Pp<Pa), with a prediction error
of 20%. The discounted payback period of the third scenario is almost two years
shorter than that of the first model. Given that both models have the same actual
production, the error variable when underestimating the production has a
considerable impact on the financial outcome. For and output of 114,975 EUR, 5%
higher than the planned production, the revenue loss of the company is determined
by the energy output that could have been sold for the closing price of the day
ahead market, but was instead sold for the market excess price. In this case, the
product of 5,475 MWh and the difference between the day ahead market closing
price and the price of the excess market (45 EUR - 8,044 EUR), with a result of
202,328 EUR per year. The revenue loss of scenario I is 708,150 EUR per year, 3.5
times higher than in scenario III.
When analysing scenarios II and IV, the difference between the two prediction
models is decisive when determining whether to invest in the power park. While
scenario II has an IRR barely higher than the hurdle rate, scenario IV has an IRR
with 1.8 percentage units higher, a NPV higher with 8,215,227.396 EUR than
scenario II, and a 3.75 years shorter discounted payback period. The equilibration
cost of scenario II is 1,166,201 EUR annually, while the equilibration cost of
scenario IV is 291,550 EUR per year.
It is well known that prediction errors vary for each day and each hour, and the
comparison of companies using the two prediction models for a specific time frame
would be most defining for the financial impact of the proposed model in the given
time frame. However, for analysis purposes, the extrapolation used has shown that
the difference of the two models may strongly influence the investment decision.
6. Conclusions
The field of renewable energy represents one of the key development areas for our
country in the near future, being also one of the main interest points in the
European Union's Energy Strategy until 2020.
Considering the importance of this particular type of energy and the current interest
surrounding it we present in this paper a proposal for a prototype for an analytical
and support system for the decision making process, which will forecast and
analyze investments in renewable energy field, with application in wind power
plants.
The proposed prototype supports investments in the researched field through two
models. The first one is a predictive model that helps potential investors to give an
accurate estimation of their energy production to the TSO after integration in the
NPS, therefore cutting operating costs and increasing efficiency. For this model we

Model Assumptions for Efficiency of Wind Power Plants' Operation
_______________________________________________________________
used data recorded in the span of 10 months and consisting of more than 16000
observations. We used data mining techniques, we built a regression model and we
obtained an estimation accuracy of approximately 95%. This means an estimation
error of 5%, which is 3 to 6 times better than existing forecasting systems where
the usual estimation errors have an average between 15 and 30%.
The second model of the prototype is an advanced analysis, simulation and
strategic planning model, developed as a simulator that relies on a financial model,
which will allow investors to fundament their decision based on solid data
regarding the costs and revenue from operating a WPP.
We consider that the implementation of such a system on a national scale can
support the growth of investments in the area at a faster pace and help achieve the
European Union’s 2020 climate change/energy targets of 20% of energy coming
from renewables.
ACKNOWLEDGEMENTS
Sections 2-4 of this paper presents some results of the research project PN II,
TE Program, Code 332: “Informatics Solutions for decision making support in
the uncertain and unpredictable environments in order to integrate them within
a Grid network” and section 5 presents some results of the research project
“Intelligent System for prediction, analysis and monitoring of performance
indicators of technological and business processes in the field of renewable
energies” (SIPAMER), PNII – PCCA 2013, code 0996, no. 49/2014 funded by
NASR.
REFERENCES
[1] Ackerman, T. (2005), Wind Power; John Wiley & Sons;
[2] Agapie, A., Badin, L. (2009), Confidence Intervals for the Guesstimation
Algorithm: A Bootstrap Approach; Economic Computation and Economic
Cybernetics Studies and Research; ASE Publishing, No.3; pp.167-178, ISSN:
0424-267X;
[3] ANRE (2004), Ordin nr. 25/22.10.2004 – Codul Comercial al pieţei angro de
energie electrică, Bucharest, 2004, available at
http://www.anre.ro/documente.php?id=153;
[4] AWPPS (2013), available at
http://www-cenerg.cma.fr/prediction/main_prediction3_FR.htm;
[5] Bara, A., Lungu, I., Velicanu, M., Oprea, S. (2010), Intelligent Systems for
Predicting and Analyzing Data in Power Grid Companies, i-Society 2010
Proceedings, pp.597-602, ISBN 978-0-9564263-3-8;
[6] Bara, A., Oprea, S.V., Botha, I., Velicanu, A. (2010-2013), Solutii
informatice pentru asistarea procesului decizional in mediile incerte si cu
evolutii putin predictibile in vederea integrarii in retele de tip grid. Research
project PN2-TE, Code 332, 2010-2013;

Adela Bara, Ion Lungu, Simona Oprea, Iuliana Botha, Alexandra Chinie
___________________________________________________________
[7] Bara, A., Velicanu, A., Lungu, I., Botha, I. (2010), Natural Factors that Can
Affect Wind Parks and Possible Implementation Solutions in a Geographic
Information System; Proc. of the International Conference on Development,
Energy, Environment, Economics, pp.50-54, ISBN 978-960-474-253-0;
[8] Bossanyi, E.A. (1985), Short-Term Wind Prediction Using Kalman Filters,
Wind Engineering 9, pp. 1-8;
[9] Botha, I. (2012), Integrarea tehnologiilor Web cu bazele de date relaţional-
obiectuale în con textul noii economii; PhD Thesis, University of Economic
Studies, Bucharest;
[10] Burton, T., Sharpe, D. (2001), Wind Energy Handbook; John Wiley & Sons;
[11] Carson, B. (2013), The Economics of Renewable Energy, in Energy Finance
and Economics. Analysis and Valuation, Risk Management and the Future of
Energy, Eds. B.J. Simkins, R.E. Simkins, John Wiley & Sons;
[12] Costea, A., Eklund, T., Karlsson, J., Voineagu, V. (2009), Financial
Performance Analysis of Scandinavian Telecommunication Companies using
Statistical and Neural Network Techniques, Economic Computation and
Economic Cybernetics Studies and Research, ASE Publishing; No.4; pp.87-104,
ISSN: 0424-267X;
[13] DMI (2013) http://www.dmi.dk/eng/index/research_and_development/dmi-
hirlam-2.htm;
[14] Ecer, F. (2013), Artificial Neural Networks in Predicting Financial
Performance: An Application for Turkey’s Top 500 Companies; Economic
Computation and Economic Cybernetics Studies and Research, ASE Publishing;
No.2; pp.103-114, ISSN: 0424-267X;
[15] EWEA (2009), The Economics of Wind Energy. A Report by the European
Wind Energy Association, available at
http://www.ewea.org/fileadmin/ewea_documents/documents/publications/reports/E
conomics_of_Wind_Main_Report_FINAL-lr.pdf;
[16] Fernandez, P., Aguirreamalloa, J., Linares P. (2014), Market Risk
Premium and Risk Free Rate used for 51 countries in 2013; IESE Business
School, 2013, retrieved online in February 2014 from
http://papers.ssrn.com/sol3/papers.cfm?abstract_id=914160;
[17] Fukuda, H., Tamaki, S., Nakamura, M., Nagai, H., Shijo, F., Asato, S.,
Onaga, K. (2001), The Development of a Wind Velocity Prediction Method
Based on a Data-Mining Type Auto-Regressive Model; Proc. of the European
Wind Energy Conference, Denmark, pp.741-744, ISBN 3-936338-09-4;
[18] Heir, S. (2006), Grid Integration of Wind Energy Conservation Systems;
John Willey & Sons Ltd.;
[19] HG no.1069/2007, Strategia Energetica a Romaniei pentru perioada 2007-
2020, available online at
http://www.minind.ro/energie/strategia_energetica_actualizata.pdf;
[20] Konrad, T. (2009), The Obama Effect: Is Clean Energy Outperforming?,
available online at .

Model Assumptions for Efficiency of Wind Power Plants' Operation
_______________________________________________________________
http://www.altenergystocks.com/archives/2009/04/the_obama_effect_is_clean_ene
rgy_outperforming.htm
[21] Landberg, L., Giebel, G., Nielsen, H.A., Nielsen, T.S., Madsen, H. (2003),
Short-term prediction - An overview, Wind Energy 6(3), pp.273-280;
[22] Lungu, I., Velicanu, A., Bara, A., Botha, I., Mocanu A.M., Tudor A.
(2012), Spatial Databases for Wind Parks, Economic Computation and Economic
Cybernetics Studies and Research Journal, no.2, vol.46, pp.5-22, ISSN: 0424-
267X;
[23] Oprea, SV (2009), Aspecte privind accesul deschis la reţelele electrice.
Integrarea surselor regenerabile de energie, doctoral thesis, Universitatea
Politehnica Bucureşti, 2009
[24] Pazienza, M.T., Lungu, I., Tudorache, A. (2011), Flames Recognition for
Opinion Mining, Economic Computation and Economic Cybernetics Studies and
Research Journal, no.3/2011, pp.43-58, ISSN: 0424-267X
[25] Transelectrica (2008-2013), Transelectica’s reports available at
http://www.transelectrica.ro/web/tel/integrarea-in-sen-a-centralelor-eoliene


![[IJCT V3I3P8] Authors: Ionut Taranu, Manole Velicanu, Adela Bara](https://img.pdfslide.net/doc/110x75/58a5dd341a28abd14d8b554b/ijct-v3i3p8-authors-ionut-taranu-manole-velicanu-adela-bara.jpg)