Embed Size (px)
Citation preview
Page 1/23
Whole-Genome Sequencing on 220 Alfalfa(Medicago sativa L.) Accessions Identi�ed LociAssociated with Fall DormancyFan Zhang
Chinese Academy of Agricultural SciencesJunmei Kang
Chinese Academy of Agricultural SciencesRuicai Long
Chinese Academy of Agricultural SciencesMingna Li
Chinese Academy of Agricultural SciencesYan Sun
China Agricultural UniversityFei He
Chinese Academy of Agricultural SciencesXueqian Jiang
Chinese Academy of Agricultural SciencesChangfu Yang
Chinese Academy of Agricultural SciencesXijiang Yang
Chinese Academy of Agricultural SciencesJie Kong
Chinese Academy of Agricultural SciencesZhen Wang
Chinese Academy of Agricultural SciencesZhiwu Zhang
Washington State UniversityQingchuan Yang ( [email protected] )
Chinese Academy of Agricultural Sciences https://orcid.org/0000-0002-5926-9798
Research Article
Keywords: GWAS, fall dormancy, Medicago sativa, DREB1C, freezing tolerance
Posted Date: November 17th, 2021

Page 2/23
DOI: https://doi.org/10.21203/rs.3.rs-1006624/v1
License: This work is licensed under a Creative Commons Attribution 4.0 International License. Read Full License
Page 3/23
AbstractFall dormancy (FD) is one of the most important traits of alfalfa (Medicago sativa) for cultivar selection toovercome winter damage. Regrowth plant height following autumn clipping is an indirect way to evaluateFD. Although transcriptomics, proteomics analysis, and QTL mapping have revealed some importantgenes correlated with FD, the genetic architecture of this trait is still unclear. There are no applicable genesor markers for selection, which hinders progress in the genetic research and molecular breeding for thetrait. We conducted whole-genome sequencing (WGS) on 220 alfalfa accessions at 10x depth. Among the875,023 SNPs, seven of them were associated with FD using genome-wide association study (GWAS).One SNP located on chromosome 6 is in linkage disequilibrium with dehydration-responsive element-binding protein 1C (DREB1C). Furthermore, seven DREB genes are clustered in this region, one of whichhas previously been shown to enhance freezing tolerance in the model plant Medicago truncatula. Thecandidate genes uncovered by our research will bene�t the transgenic and CRISPR-Cas9 research of FD inalfalfa. This gene will also be useful for marker development and assisted selection of FD for alfalfa.
Key MessageSeven SNP associated to fall dormancy in alfalfa and one candidate gene DREB1C were identi�ed usingGWAS method combined with whole genome sequencing.
IntroductionFall dormancy (FD) is the adaptive growth characteristic of alfalfa in autumn and can be evaluated by theregrowth plant height at 25-30 days after �nal cutting (Teuber et al. 1998).
The taller alfalfa grows in the fall, the less dormant it is. The FD level of alfalfa varieties can be classi�edfrom 1 to 11, where 1 represents most dormant and 11 represents least dormant (Teuber et al. 1998).Dormancy is induced by falling temperature and shortening photoperiod. Dormancy can improve plantsurvival in winter and increase freezing tolerance. FD alfalfa cultivars have better winter survival andhardiness than non-dormant alfalfa cultivars (Barnes et al. 1979; Smith 1961; STOUT 1985; STOUT andHALL 1989). FD level can be considered one of the indices for alfalfa cultivar selection in speci�c regions.There is a trade-off between FD and yield. High FD could increase overwintering ability, but decrease thepotential yield (Avci et al. 2018; STOUT and HALL 1989). Breaking down the linkage between FD and yieldfrom genetic level could bene�t for both yield and winter hardiness. Studying the genetic architecture ofFD could be used to improve those high yield alfalfa cultivars with bad cold tolerance (Li et al. 2015;Munjal et al. 2018).
The genetic mechanism of FD in alfalfa has been studied using genomics, transcriptomics, andproteomics. QTL mapping between different FD level alfalfa germplasms has been conducted in severalstudies. Seventy-one QTL related to FD traits have been identi�ed, and 15 of them can be detected in morethan one environment (Li et al. 2015). Another study identi�ed 45 signi�cantly associated QTL for FD(Adhikari et al. 2018). Both of these groups found that FD and winter hardiness have independent
Page 4/23
inheritance and could be improved independently. A gene expression‐related experiment showed that acold acclimation‐responsive gene, RootCAR1, was positively associated with alfalfa winter survival(Cunningham et al. 2001). More FD-related genes have been found using transcriptomics technology.Forty-four genes were identi�ed by comparison of the transcriptomes from non-FD versus FD cultivars’leaves. The transcription of the genes IAA-amino acid hydrolase ILR1-like 1, abscisic acid receptor PYL8,and monogalactosyldiacylglycerol synthase-3 were suggested to be involved in regulating FD in alfalfa(Du et al. 2017). Eight signi�cantly differentially expressed transcription factors related to CBF and ABRE-BFs were identi�ed (Liu et al. 2019). Furthermore, FD-related proteins were analyzed using proteomics andmetabolomics. A total of 90 proteins were different between FD and non-FD alfalfa. One of these wasthiazole biosynthetic enzyme (MsThi), which is important for alfalfa growth (Du et al. 2018). Ra�nosefamily oligosaccharide (RFO) metabolism was shown to be involved in short photoperiod-induced freezingtolerance in dormant alfalfa cultivars (Bertrand et al. 2017).
Genome-wide association studies (GWAS) are widely used to locate precise SNPs associated withphenotypes using historical recombination information. With the development of the sequencing methodand genetic analysis method of GWAS, the candidate SNP markers for important quantitative traits havebeen identi�ed across different populations (Biazzi et al. 2017; Wang et al. 2016; Yu et al. 2016). Based on198 accessions, Longxi-Yu reported a set of GWAS results. It includes 19 SNPs associated with droughtresistance (Zhang et al. 2015). 36 SNPs associated with salt tolerance (Yu et al. 2016), 42 associated withplant growth and forage production (Liu and Yu 2017), and 131 markers associated with 26 forage qualitytraits (Lin et al. 2020). Using the 336 genotypes, Wangzan conducted GWAS for several key alfalfa traits,including �ber-related traits and digestibility (Wang et al. 2016), crude protein and mineral concentrations(Jia et al. 2017), and nine biomass-related traits (Wang et al. 2020). Another study reported several SNPsassociated with forage quality using half-sib progeny developed from three cultivars (Biazzi et al. 2017).Furthermore, several genes were revealed to be related to some important traits of alfalfa. For example,several stress-responsive genes associated with yield under water de�cit were identi�ed, including leucine-rich repeat receptor-like kinase, B3 DNA-binding domain protein, translation initiation factor IF2, andphospholipase-like protein (Liu and Yu 2017). Two markers linked to NIR-NBS-LRR genes weresigni�cantly associated with Verticillium wilt resistance (Yu et al. 2017). A cell wall biosynthesis geneassociated with several cell wall–related traits that affect alfalfa nutritive value has been identi�ed(Sakiroglu and Brummer 2017). MsACR11 has an effect on plant height, which could signi�cantly increasethe height of transgenic arabidopsis (Wang et al. 2020).
Although many GWAS have been performed in alfalfa, few of these have focused on FD. Furthermore, withthe lack of reference genome in alfalfa, most previous studies have used the Medicago truncatula genomeas a reference (Sakiroglu and Brummer 2017; Wang et al. 2020; Yu et al. 2017). With the technologicaldevelopment of the genome assembly, the genome of the cultivar “Zhongmu No.1'' has been released. A�owering locus T homolog gene, MsFTa2, may be associated with fall dormancy and salt resistance andwas identi�ed using the GWAS method and the new reference genome for alfalfa (Shen et al. 2020).
Page 5/23
In this study, we evaluated FD (we de�ne FD as regrowth plant height at 30 days following autumnclipping) in 220 accessions and conducted WGS with the mean depth of 10x sequencing for everyaccession. A total of 875,023 SNPs were detected in the alfalfa reference genome and used forconducting GWAS. The objectives of this experiment were (1) evaluate the linkage disequilibrium (LD) andpopulation structure of alfalfa, (2) identify SNPs associated with FD, and (3) infer the candidate genescontrolling FD.
Materials And MethodsPlant materials and phenotyping
The plant materials used in this study consisted of 220 accessions collected from all over the world.These accessions include 55 cultivars, 26 cultivated materials, 95 landraces, 4 breeding materials, 16 wildmaterials, and 24 uncertain improvement status materials. Among them, 26 accessions come from thedatabase of the Medium Term Library of National Grass Seed Resources of China. Another 194accessions come from the database of the U.S. National Plant Germplasm System (USDA GRIN). Thegeographic sources of the accessions include China, the United States, Turkey, Afghanistan, TashkentUzbekistan, Spain, Russia, Morocco, France, Argentina, and others (Table S1).
In October 2017, the seeds of 220 accessions were planted in the greenhouse of the Chinese Academy ofAgricultural Sciences (CAAS) in Langfang, Hebei Province, China (39.59°N, 116.59° E). The area has acontinental monsoon climate with an average temperature of 11.9 °C/year. The coldest month is Januarywith an average temperature of -4.7 °C and the hottest month is July with an average temperature of 26.2°C. The annual rainfall is 554.9 mm. The soil type is loam soil with the PH value of 7.37 and soil organicmatter content is 1.69%. Individuals were transplanted to the �eld of CAAS in April 2018. A randomizedcomplete block design with three replications was used for the experimental design. Every accessionincluded 5 individuals placed 30 cm apart in a single row for one replication. The accession spacing was65 cm between rows and columns. To keep all individuals uniform, they were clipped to a height of 5 cmafter transplant. To keep same evaluation standard with �eld management of alfalfa, all individuals wereclipped at the early �owering stage (when 10% of plants begin �owering). Plants were clipped three timesin 2018 and four times in 2019. Fall dormancy was collected using plant regrowth one month after �nalclipping (31 Oct 2018 and 29 Oct 2019). The tallest stem height of one individual was considered FD. Thecorrelation information between FD of the mean value of different individuals (3 replication x 5individual=15 individuals) and FD of sequencing individual was analyzed using ggplot2 (Wickham 2011).
The variance of fall dormancy was analyzed using a generalized linear model (GLM) as follows:
height = accession + ind (accession) + year + accession * year + replicates + error
All factors were random, and the GLM was performed using PROC GLM (SAS Institute, 2010). The broad-sense heritability (H2) was computed as follows:
Page 6/23
where σ2g
is the variance of accession; σ2gy is the interaction variance of accession and year; σ2
is the
residual variance. The items y and i in the equation refer to the number of years and individuals, respectively.
Sequencing and SNP calling
Phenotyping was conducted on 15 individuals per accession and one individual with the typicalphenotype was selected for sequencing. Young leaves were selected at the early regrowth stage (9 July2019). Total DNA was extracted using the CWBIO Plant Genomic DNA Kit (CoWin Biosciences, Beijing,China), according to the manufacturer’s protocol. At least 6 ug of genomic DNA from each accession wasused to construct a sequencing library following the manufacturer’s instructions (Illumina Inc.). Paired-endsequencing libraries with an insert size of approximately 300 bp were sequenced on an Illumina NovaSeq6000 sequencer at BerryGenomics company. The data size of every accession is 10 Gb and the averageQ30 is 85%. The raw data has been uploaded to the National Genomics Data Center (NGDC,https://bigd.big.ac.cn/) under BioProject PRJCA004024 and NCBI Sequence Read Archive with BioProjectID: PRJNA739212. Sequencing data were �rst quality �ltered using Trimmomatic software with defaultparameters (Bolger et al. 2014). Paired-end sequencing reads were mapped to the alfalfa referencegenome (haploid genome with 8 chromosomes (Long et al. 2021)) with BWA-MEM using defaultparameters (Li 2013). SAMtools were used to translate SAM �le to BAM �le and sort BAM �les usingdefault parameters (Li et al. 2009).
Picard Tools was used to mark duplicate reads (http://broadinstitute.github.io/picard/), and GenomeAnalysis ToolKit was used to correct indels which can be mistaken for SNPs (Van der Auwera et al. 2013).SAMtools mpileup and VarScan were used to detect SNPs (Koboldt et al. 2012). Furthermore, SNP datawere �ltered using VCFtools (Danecek et al. 2011) with a missing rate of less than 10%, a minor allelefrequency of more than 0.05, and mean read depth greater than 20. The SNP distribution on thechromosome was generated using the R code from a GWAS study in beef cattle (Zhou et al. 2019).
Population structure and linkage disequilibrium
Population structure was calculated using the TASSEL 5 software with principal component analyses(PCA) (Bradbury et al. 2007). The 3D PCA results combined with geography information were plottedusing R package scatterplot3d (Ligges and Mächler 2002). The population structure subgroup wasestimated using admixture and the �gure was generated using R package pophelper (Francis et al, 2017).LD information was calculated using the software PopLDdecay with default parameters (Zhang et al.2019). The VCF �le containing information on all 875,023 SNP markers was imported to PopLDdecay. TheLD results among all accessions were used to estimate the LD of alfalfa. The distance versus mean R2
within 30 kb of LD was plotted using R package ggplot2.
Association mapping

Page 7/23
The Bayesian-information and linkage-disequilibrium iteratively nested keyway (BLINK) method was usedto carry out the GWAS (Huang et al. 2019) for two kinds of FD phenotype (sequencing individual andmean of 15 individuals). GWAS was conducted using the BLINK C version software. The Bonferronimultiple test correction was used to determine the signi�cant SNP threshold (P=0.01/875,023= 1.14x10⁻⁸). The BLINK method uses iterations to select a set of markers associated with a trait. These associatedmarkers are �tted as a covariate for testing the remaining markers. This method better controls falsepositives than the kinship approach. The real data and simulated data results showed that BLINK hashigher statistical power than other methods, such as MLM, FarmCPU, et al. (Huang et al. 2019). TheManhattan and Q-Q plots of GWAS results were created using the R package qqman (Turner et al. 2014).
ResultsPhenotypic variance
To identify the genetic difference in FD for different individual among the same accession, the variance ofthe phenotype was analyzed. The effect of accession, year, individual, and accessions–year interactionwere estimated (Table1). FD was recorded for two years: 2018 and 2019. The FD correlation betweensequencing individual and mean of 15 individuals was used to estimate individual variance. Thecorrelation R2 value was 0.46 and 0.55 in 2018 and 2019. The correlation R2 value across two years was0.47 (Figure 1). The FD correlation R2 between 2018 and 2019 among sequencing individuals andaccession mean were 0.41 and 0.27 (Figure S1). The variance of FD in 220 accessions was analyzedusing ANOVA. Signi�cant differences in accession, year, and accession-year interaction were observed atthe 0.001 probability level (p<0.001)). The variation of individuals was not signi�cant at the 0.05probability level (p=0.12), indicating that the difference in FD between individuals is not big enough andthe mean value can be used to represent the FD of one accession (Table 1). The broad-sense heritabilitywas 69.2% for FD.
Genotype calling and allele frequencies
A total of 32.2 million SNPs were detected using the BWA-SAMTools-VarScan pipeline. After �ltering theSNPs with a missing value >10%, minimum mean read depth >20, and minor allele frequency (MAF) >0.05,there were 875,023 SNPs that passed the threshold and were con�rmed for further analysis. Among these875,023 SNPs, the average SNP density in the genome was one SNP per 26.95 bp (among the 814,517SNP with SNP interval less than 300 bp) (Figure 2a, b). There were 60,506 SNP with an interval larger than300bp, and the average SNP interval for these was 11128.66 bp (Figure 2b). The distribution of the MAFvalue showed that the value equal to 0.06 has the highest density (Figure 2c, detail data not shown). TheSNP number range is similar for MAF values from 0.2 to 0.5 (Figure 2c). These results demonstrate thatthe markers can be assigned to unbiased chromosomes and distinct positions.
Population structure
Page 8/23
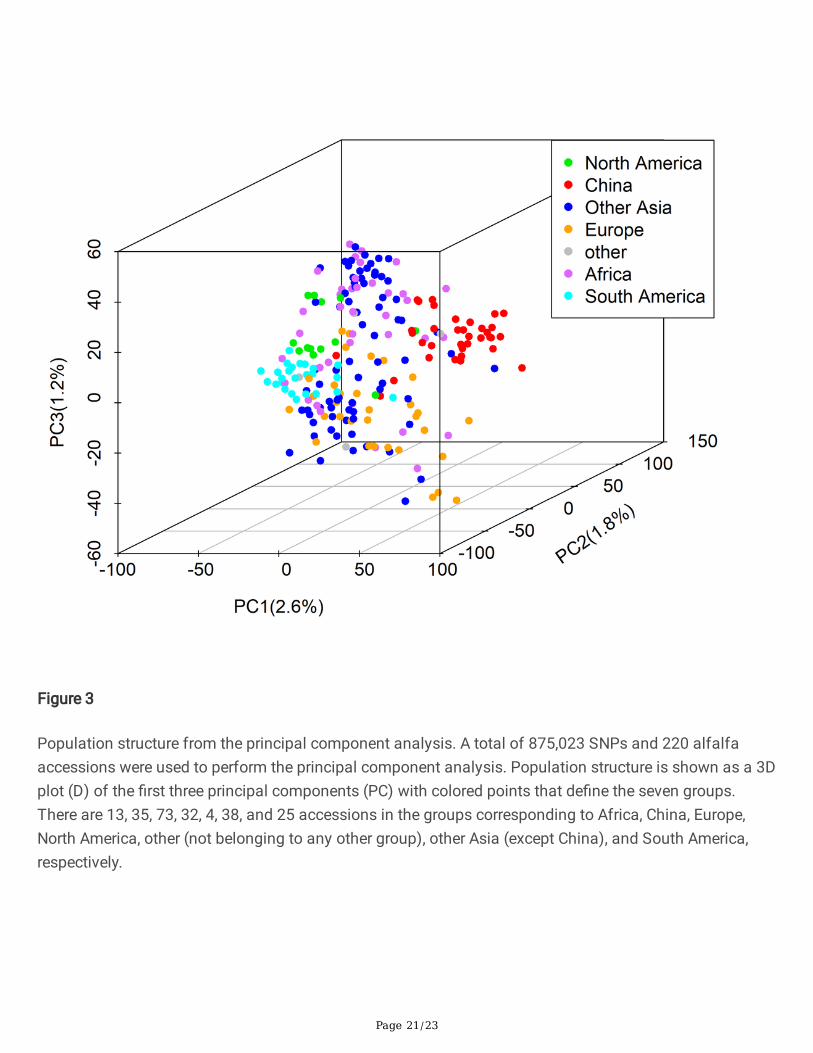
The accessions used in our research originated from different countries, especially the USDA-GRINcollection, representing wide coverage of genetic diversity on alfalfa. To analyze population structure, thegenome-wide SNP data generated by WGS was used for principal component analysis (PCA) andpopulation structure analysis. The PCA scatter-plots showed a weak population structure for the 220accessions consisting of different geographical origins with no clear subpopulation (Figure 3). In thescatterplot of PC1-3, most accessions are mixed. But some accessions coming from China can beseparated from those with other origins (red color). Similarly, some accessions from South America can beseparated from the others (cyan color). The accessions from Europe, North America, and other Asiacountries have wide and mixed distribution. The geographic distribution of accessions interacted with PC1showed similar results and the accessions coming from China and South America were different fromothers (Figure S2). The �rst three PCs explained 2.6%, 1.8%, and 1.2% genetic variance separately; the totalgenetic variance explained by the �rst three PCs is 5.6%. Population structure analyses were conducted byadmixture. The best subgroup was estimated by cross-validation (CV) error with a K value range from 2 to10. The CV results showed K=3 has the smallest error (Figure S3 and Figure S4). The relationship betweensubgroup were illustrated using population structure results from K=2 to K=4. The accessions comingfrom China can be separate for K=3. The accessions from South America and Africa can be separate forK=4 (Figure 4). These mixed clusters indicate that, although accessions come from different geographicalorigins, they still have a high degree of genetic relatedness. Furthermore, the variance of FD amongdifferent geographic origins has a similar difference pattern. The accessions coming from Africa have thehighest FD, while the accessions coming from China have lower FD. The FD variance of South Americawas in the middle of Africa and China. The FD variance of accessions coming from other origins (Europe,North America, and other Asia) is either similar to FD in China or South America (Figure S5).
Linkage disequilibrium
To estimate the con�dence interval of GWAS results, LD was analyzed using a total of 875,023 markers.The r2 of LD across all chromosomes was used to estimate the LD of alfalfa. A rapid drop in r2 wasobserved with the increase in physical distance. Over all the accessions, the value of r2 decreased quicklywithin 2 kb physical distance, then decreased slowly afterward (Figure 2d). The value of r2 decreased to0.1 after 18 kb across all chromosomes. The results showed that extensive recombination took placeduring alfalfa evolution and distribution.
GWAS and candidate genes for FD
To identify SNP markers associated with FD and compare the effect of different kind of phenotype,genotypic and phenotypic data were analyzed using the Bayesian-information and Linkage-disequilibriumIteratively Nested Keyway (BLINK) method in the BLINKC version software. SNP effect was calculate usingthe BLINK R version Prediction function. Both kind of phenotype (mean of 15 individuals and sequencingindividual) were used to conduct GWAS analysis.
The quantile-quantile (Q-Q) plot results of marker-trait associations for FD were illustrated using observedversus expected p-values (Figure 5). Any deviation from the expected red line implies SNP association with
Page 9/23
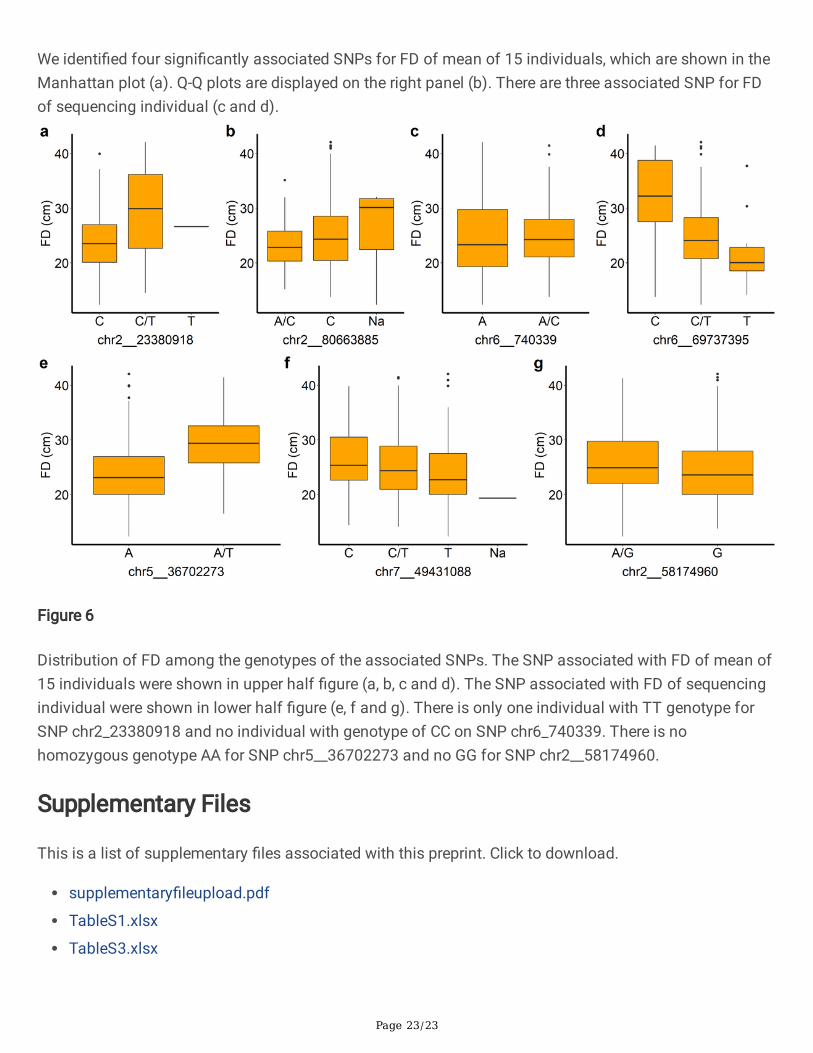
FD. In the present study, a total of four SNPs passed the 1% threshold after a Bonferroni correction(p<1.14x10⁻⁸) and were associated with FD of mean of 15 individuals and three SNPs associated with FDof sequencing individual (Figure 5, Table 2). Among them, two markers, chr2__23380918 andchr2__80663885, were located on chromosome 2. In addition, 2 markers (chr6__740339 and SNPchr6__69737395) were located on chromosome 6. Another three markers associated with FD ofsequencing individual were located on chromosome 5 (chr5__36702273), 7 (chr7__49431088) and 2(chr2__58174960). The FD difference between different genotypes can be observed in the seven SNPboxplots. There is no homozygous genotype CC for SNP chr6_740339 and there is no homozygousgenotype TT for SNP chr5__36702273 and no AA for SNP chr2__58174960 (Figure 6). These results maysuggest that CC, TT or AA genotype is the deleterious variance for alfalfa.
To identify potential candidate genes linked to SNP associated with FD, candidate genes were screenedbased on the up- and downstream 18 kb LD interval information. Of the seven signi�cantly associatedSNP, four of them are linked to known genes in the alfalfa genome (Table 2). There is one candidate gene(Msa0867660) with the annotated function of signal anchor protein connected to chr6__740339. Only onegene (Msa0892030), dehydration responsive element binding protein 1C (DREB1C), was connected withthe SNP chr6__69737395 in the 36 kb genomic interval based on LD information (Figure S6). We furtherchecked the genes near SNP chr6__69737395 with a larger scope (500 kb interval up- and downstream).Another six DREB genes were found upstream of this SNP (chr6:69234712-69716598). One of the sixgenes (Msa0891950) has been validated to be associated with freezing tolerance in Medicago truncatula(Figure S7) (Chen et al. 2010). The transgenic Medicago truncatula has lower plant height than normalplants and has better tolerance for freezing. We further checked all DREB genes on chromosome 6, andfound that there were nine in total (Table S2). Another two DREB genes were Msa0893350 andMsa0893360 (chr6:76949157-76957350). There is only one cluster region with seven DREB genes onchromosome 6, and this region corresponds to our signi�cant GWAS signal. Another two SNP have morethan one candidate gene. The SNP chr5__36702273 is connected with one hypothetical protein gene(Msa0729370) and transcription factor FAMA isoform X2 gene (Msa0729380). The SNP chr7__49431088is connected with two transcription factor bHLH155 genes (Msa1022700 and Msa1022710).
DiscussionThe FD variance of alfalfa
Because of the outcrossing and self-incompatibility feature of alfalfa, the genotype between differentindividuals is different. Most studies collect phenotypes using cloned plants (Li et al. 2015; Liu and Yu2017; Sakiroglu and Brummer 2017; Wang et al. 2016). For one study, seed plants of the same accessionwere used for phenotype collection (Yu et al. 2016). Compared with cloned plants, the advantages ofusing seed plants are that they are easier to establish and have better accession representation.Furthermore, some experiments and assessment of phenotypes cause damage to the plants, such aswinter survival, disease resistance, and root-related phenotypes. It is easier to rebuild the population usingseed than by cloning plants. We checked the FD variance of individuals based on our experiment. To
Page 10/23
check the in�uence of individuals’ genetic differences for FD among the same accessions, we nestedindividuals in accession. Our results showed that the variance of individuals is not signi�cant, while thevariance of accessions is signi�cant (Table 1). That means we could use the mean value to serve as arepresentative phenotype of one accession. Even though there is genetic variance among differentindividuals, their mean value is the whole picture of one accession. Furthermore, the correlation betweensequencing individual plants and the mean value of different plants is high enough. The correlation R2
value is 0.46 and 0.55 in 2018 and 2019 (Figure 1). While the correlation R2 between 2018 and 2019 is0.41 and 0.27 for mean FD and sequencing individual FD (Figure S1). It showed that environmental effecthas bigger in�uence for a single individual. The mean value of multiple individuals is more stable amongthe different environments. In order to test the genetic variance of these two kinds of FD phenotype(sequencing individual and mean of 15 individuals). We tested the GWAS signal for both kinds ofphenotypes and found associated SNP (Figure 5, Table S3). However, there is no overlap SNP for them.This phenomenon has been observed in previous studies (Heller and Yekutieli 2014; Lin 2019; Rietveld etal. 2014). We think FD maybe controlled by several different genes. Our two kinds of phenotypescorresponding to two different kinds of genes. Combine both associated SNP could uncover a betterunderstanding of FD (Rietveld et al. 2014). Combining ANOVA and correlation results of FD and GWASresults, we think the mean of FD could be used for genetic analysis of alfalfa.
Our experiment also showed that FD evaluation in one location for three years is very hard. Because theaccessions were collected from all over the world. The fall dormancy level is very different. For theaccessions with low dormancy ability, their winter hardiness is weak and winter survival is a problem. It ishard to control the balance between sample diversity and local adaption. If we want to collect more trailsdata, these accessions not adapted local environment will die and our phenotype will be biased. That’swhy we only collected two years’ data. Our purpose is to gain more genetic variance of alfalfa. However,more test trails with different climatic environments may be a possible way to solve this problem.
The genetic diversity of alfalfa
The improvement of alfalfa is mainly based on outcrossing, and the genetic exchange of alfalfa alwaysexists in alfalfa-growing regions (Li and Brummer 2012). To this end, nine distinct germplasms with globalbackgrounds were introduced in North America to cultivate new varieties (Barnes 1977). It is more di�cultto distinguish alfalfa accessions based on geographic origin than for self-pollinating plants, such assoybean (Zhou et al. 2015) and rice (Huang et al. 2012). Also, diploid alfalfa (M. sativa subsp. caeruleaand M. sativa subsp. falcata) can be clustered based on subspecies and geography (Sakiroglu andBrummer 2017; Şakiroğlu et al. 2010); the genetic diversity of tetraploid alfalfa (cultivated alfalfa) is morecomplicated. Based on our PCA results and population structure results, the genetic differentiation amongdifferent origins is not very high, except the ones from China and South America.
The introduction of alfalfa to South America took place around the sixteenth century, while it wasintroduced to China 2000 years ago (Annicchiarico et al. 2015). Differentiation has occurred along withcultivation in the local region. This phenomenon has also been identi�ed in previous studies (Qiang et al.
Page 11/23
2015; Shen et al. 2020; Wang et al. 2020). The accessions coming from Europe and other Asia regions(regions except for China) are mixed and have a wide range. These accessions have the highest geneticdiversity among all accessions with different geography. This result may be the reason that alfalfaoriginated from the Caucasus region: northeastern Turkey, Turkmenistan, and northwestern Iran (Michaudet al. 1988). This theory can also be strengthened by the knowledge that accession genetic diversity fromNorth America and Africa is relatively low compared to European accessions. The cultivated alfalfa wasexported to North America and Africa only around 200~300 years ago (Prosperi et al. 2014). This relativelyshort cultivation period also partially explains the low genetic diversity.
The linkage disequilibrium of alfalfa
Our results also showed that the LD distance is very short (R2 reduced to 0.1 after 18 kb). This is differentfrom previous studies (Sakiroglu and Brummer 2017) and (Li et al. 2014). One major reason may bebecause we used a large number of SNPs (around 58 times more than the previous report). With increasedmarker density, it is easier to estimate historical recombination events. Another study showed that LD canbe decreased rapidly to less than 1 kb in alfalfa using candidate gene–related SNP (Herrmann et al.2010). The rapid LD decrease is likely due to the outcrossing nature of alfalfa and the diverse germplasmwe collected.
The candidate genes of FD
A total of seven SNPs were determined to be associated with FD based on the 1% Bonferroni test (Table 2and Figure 5). Four out of seven SNPs can be mapped to candidate genes based on LD information, andone SNP is connected with a DREB1C gene. DREB1C has been shown to be associated with freezingtolerance. When the gene CBF2/DREB1C was disrupted, mutant Arabidopsis had a higher capacity totolerate freezing than WT plants and were more tolerant to dehydration and salt stress (Novillo et al.2004). Further validation has been done in model plant Medicago truncatula. Transgenic Medicagotruncatula exhibited suppressed shoot growth and enhanced freezing tolerance (Chen et al. 2010). Thetranscriptomic analyses of different dormancy alfalfa cultivars showed that DREB1C was one of the mostsigni�cantly differentially expressed genes and was upregulated in a fall dormant alfalfa cultivar (Liu etal. 2019). Another transcriptome sequencing analysis revealed that nine DREB unigenes responded to coldand/or freezing stresses (Shu et al. 2017). Even though FD and winter survival may be controlled bydifferent QTL (Adhikari et al. 2018; Brummer et al. 2000; Li et al. 2015), FD serves as an indicator toevaluate freezing tolerance in the broad sense is possible. Regrowth plant height following autumnclipping can be considered a signal of fall dormancy and freezing tolerance. If an alfalfa cultivar has ahigher regrowth plant height, it will also have less freezing tolerance (Sheaffer et al. 1992). We furthercon�rmed that DREB1C contributes to FD using the GWAS method. And our gene expression data showedthat the DREB1C gene can be induced by cold treatment. But the difference between high and low falldormancy level alfalfa is not signi�cant (Figure S8). Maybe our sample size (10 samples) used forexpression analysis is not enough. However, combining several previous results from transgenic studies,transcriptomics, and GWAS showed that the DREB1C gene is very important for alfalfa freezing tolerance.
Page 12/23
Validation of the DREB1C gene effects in alfalfa using gene-modi�cation tools such as CRISPR/CAS9(Chen et al. 2020) or a transgenic method (Chao et al. 2014) will give us a better understanding of thefunction of DREB1C.
In addition to the DREB1C gene, there should be other genes responsible for FD, because FD is aquantitative trait with continuous variance (Figure S9). We identi�ed six genes associate with FD and oneof which has a clear relationship with FD. Other genes identi�ed by sequencing individual FD such astranscription factor FAMA isoform X2 and transcription factor bHLH155 may be also important for FD.These results tell us maybe there are different genes responsible for FD.
Moreover, there are some candidate genes responsible for FD that have been identi�ed using omicstechnologies, such as ABF4 from RNA-seq results (Liu et al. 2019) and MsThi from the iTRAQ-basedmethod (Du et al. 2018). Cross-validation from multiple omics technologies could help us develop a moreaccurate understanding of FD. Our results showed that GWAS results could agree with RNA-seq data.Combining GWAS methods with other omics technologies on a bigger scale could be a possible way touncover more details regarding FD for alfalfa (Scossa et al. 2021).
In conclusion, we conducted a GWAS analysis of FD in alfalfa using whole-genome sequencing onseeding plants. Weak population structure was found among different accessions belonging to differentgeographical origins. Seven SNPs were shown to be associated with FD. One candidate gene, DREB1C,was responsible for FD. This research will help us achieve a better understanding of the relationshipbetween genotype and the FD phenotype. The results could serve as basic information for QTL mappingor candidate gene cloning to understand the mechanism of FD in alfalfa. Furthermore, analyzing thegenetic basis of FD will help to develop cultivars with different FD.
DeclarationsFunding
This work was supported by the National Natural Science Foundation of China (No. 31971758), and thebreeding forage and grain legumes to increase China's and EU's protein self-su�ciency, collaborativeresearch key project between China and EU (2017YFE0111000/EUCLEG 727312), and Key Projects inScience and Technology of Inner Mongolia (2021ZD0031) and the China Scholarship Council. Thefunding body played no role in the design of the study, the collection, analysis, and interpretation of dataand the writing of the manuscript.
Competing interests
The authors declare that they have no con�icts of interest.
Availability of data and materials
Page 13/23
All RAD raw sequence data were upload to the National Genomics Data Center (NGDC,https://bigd.big.ac.cn/) under BioProject PRJCA004024 (https://ngdc.cncb.ac.cn/search/?dbId=biosample&q=PRJCA004024&page=1) and NCBI Sequence Read Archive with Bioproject ID:PRJNA739212 (https://www.ncbi.nlm.nih.gov/sra/?term=PRJNA739212). The datasets used andanalyzed during the current study are available from the corresponding author on reasonable request.
Code availability
The software used in the current study were supplied in M&M. Any questions related to software usage,please contract with Fan Zhang ([email protected]).
Authors’ contributions
QCY conceived and designed the experiments. FZ, JMK, RCL, MNL, YS, FH, XQJ, CFY, XJY, ZW, and ZWZperformed the experiments. JMK, RCL, MNL and YS plant the alfalfa seed in the greenhouse. FZ, JMK,RCL FH, XQJ, CFY and XJY collect the alfalfa phenotype. JK and ZW conduct gene expressionexperiment. FZ, ZW and ZWZ analyzed the data. FZ, ZWZ, and QCY wrote the paper. All authors read andapproved the �nal manuscript.
Ethics approval
Not applicable.
Consent to participate
Not applicable.
Consent for publication
Not applicable.
Acknowledgements
We thank the database of the Medium Term Library of National Grass Seed Resources of China and thedatabase of the U.S. National Plant Germplasm System (USDA GRIN) for providing alfalfa accessions. Wethank China Scholarship Council (CSC) for their support the international study of Fan Zhang.
ReferencesAdhikari L, Mohseni-Moghadam M, Missaoui A (2018) Allelopathic effects of cereal rye on weedsuppression and forage yield in Alfalfa. American Journal of Plant Sciences 9:685
Annicchiarico P, Nazzicari N, Li X, Wei Y, Pecetti L, Brummer EC (2015) Accuracy of genomic selection foralfalfa biomass yield in different reference populations. BMC genomics 16:1-13

Page 14/23
Avci M, Hatipoglu R, Çinar S, Kiliçalp N (2018) Assessment of yield and quality characteristics of alfalfa(Medicago sativa L.) cultivars with different fall dormancy rating. Legume Research 41:369-373
Barnes D (1977) Alfalfa germplasm in the United States: Genetic vulnerability, use, improvement, andmaintenance. Department of Agriculture, Agricultural Research Service
Barnes D, RE S, LJ E (1979) Fall dormancy in alfalfa: A valuable predictive tool
Bertrand A, Bipfubusa M, Claessens A, Rocher S, Castonguay Y (2017) Effect of photoperiod prior to coldacclimation on freezing tolerance and carbohydrate metabolism in alfalfa (Medicago sativa L.). PlantScience 264:122-128
Biazzi E, Nazzicari N, Pecetti L, Brummer EC, Palmonari A, Tava A, Annicchiarico P (2017) Genome-wideassociation mapping and genomic selection for alfalfa (Medicago sativa) forage quality traits. PLoS One12:e0169234
Bolger AM, Lohse M, Usadel B (2014) Trimmomatic: a �exible trimmer for Illumina sequence data.Bioinformatics 30:2114-2120
Bradbury PJ, Zhang Z, Kroon DE, Casstevens TM, Ramdoss Y, Buckler ES (2007) TASSEL: software forassociation mapping of complex traits in diverse samples. Bioinformatics 23:2633-2635
Chao Y, Zhang T, Yang Q, Kang J, Sun Y, Gruber MY, Qin Z (2014) Expression of the alfalfa CCCH-type zinc�nger protein gene MsZFN delays �owering time in transgenic Arabidopsis thaliana. Plant Science 215:92-99
Chen H, Zeng Y, Yang Y, Huang L, Tang B, Zhang H, Hao F, Liu W, Li Y, Liu Y (2020) Allele-awarechromosome-level genome assembly and e�cient transgene-free genome editing for the autotetraploidcultivated alfalfa. Nature communications 11:1-11
Chen J-R, Lü J-J, Liu R, Xiong X-Y, Wang T-x, Chen S-Y, Guo L-B, Wang H-F (2010) DREB1C from Medicagotruncatula enhances freezing tolerance in transgenic M. truncatula and China Rose (Rosa chinensisJacq.). Plant Growth Regulation 60:199-211
Cunningham S, Gana J, Volenec J, Teuber L (2001) Winter hardiness, root physiology, and gene expressionin successive fall dormancy selections from ‘Mesilla’and ‘CUF 101’alfalfa. Crop science 41:1091-1098
Danecek P, Auton A, Abecasis G, Albers CA, Banks E, DePristo MA, Handsaker RE, Lunter G, Marth GT,Sherry ST (2011) The variant call format and VCFtools. Bioinformatics 27:2156-2158
Du H, Shi Y, Li D, Fan W, Wang G, Wang C (2017) Screening and identi�cation of key genes regulating falldormancy in alfalfa leaves. PloS one 12:e0188964
Du H, Shi Y, Li D, Fan W, Wang Y, Wang G, Wang C (2018) Proteomics reveals key proteins participating ingrowth difference between fall dormant and non-dormant alfalfa in terminal buds. Journal of proteomics
Page 15/23
173:126-138
Heller R, Yekutieli D (2014) Replicability analysis for genome-wide association studies. The Annals ofApplied Statistics 8:481-498
Herrmann D, Barre P, Santoni S, Julier B (2010) Association of a CONSTANS-LIKE gene to �owering andheight in autotetraploid alfalfa. Theoretical and applied genetics 121:865-876
Huang M, Liu X, Zhou Y, Summers RM, Zhang Z (2019) BLINK: a package for the next level of genome-wide association studies with both individuals and markers in the millions. GigaScience 8:giy154
Huang X, Kurata N, Wang Z-X, Wang A, Zhao Q, Zhao Y, Liu K, Lu H, Li W, Guo Y (2012) A map of ricegenome variation reveals the origin of cultivated rice. Nature 490:497-501
Jia C, Wu X, Chen M, Wang Y, Liu X, Gong P, Xu Q, Wang X, Gao H, Wang Z (2017) Identi�cation of geneticloci associated with crude protein and mineral concentrations in alfalfa (Medicago sativa) usingassociation mapping. BMC plant biology 17:1-7
Koboldt DC, Zhang Q, Larson DE, Shen D, McLellan MD, Lin L, Miller CA, Mardis ER, Ding L, Wilson RK(2012) VarScan 2: somatic mutation and copy number alteration discovery in cancer by exomesequencing. Genome research 22:568-576
Li H (2013) Aligning sequence reads, clone sequences and assembly contigs with BWA-MEM. arXivpreprint arXiv:13033997
Li H, Handsaker B, Wysoker A, Fennell T, Ruan J, Homer N, Marth G, Abecasis G, Durbin R (2009) Thesequence alignment/map format and SAMtools. Bioinformatics 25:2078-2079
Li X, Alarcón‐Zúñiga B, Kang J, Nadeem Tahir MH, Jiang Q, Wei Y, Reyno R, Robins JG, Brummer EC (2015)Mapping fall dormancy and winter injury in tetraploid alfalfa. Crop Science 55:1995-2011
Li X, Brummer EC (2012) Applied genetics and genomics in alfalfa breeding. Agronomy 2:40-61
Li X, Han Y, Wei Y, Acharya A, Farmer AD, Ho J, Monteros MJ, Brummer EC (2014) Development of analfalfa SNP array and its use to evaluate patterns of population structure and linkage disequilibrium. PLoSOne 9:e84329
Ligges U, Mächler M (2002) Scatterplot3d-an r package for visualizing multivariate data. Technical Report
Lin S, Medina CA, Boge B, Hu J, Fransen S, Norberg S, Yu L-X (2020) Identi�cation of genetic lociassociated with forage quality in response to water de�cit in autotetraploid alfalfa (Medicago sativa L.).BMC Plant Biology 20:1-18
Lin X (2019) Reproducibility and replicability in large scale genetic studies. National Academies Press
Page 16/23
Liu X-P, Yu L-X (2017) Genome-wide association mapping of loci associated with plant growth and forageproduction under salt stress in alfalfa (Medicago sativa L.). Frontiers in Plant Science 8:853
Liu Z-Y, Baoyin T, Li X-L, Wang Z-L (2019) How fall dormancy bene�ts alfalfa winter-survival? Physiologicand transcriptomic analyses of dormancy process. BMC plant biology 19:1-13
Long R, Zhang F, Zhang Z, Li M, Chen L, Wang X, Liu W, Zhang T, Yu L-X, He F (2021) Assembly ofchromosome-scale and allele-aware autotetraploid genome of the Chinese alfalfa cultivar Zhongmu-4 andidenti�cation of SNP loci associated with 27 agronomic traits. bioRxiv
Michaud R, Lehman W, Rumbaugh M (1988) World distribution and historical development. Alfalfa andalfalfa improvement 29:25-91
Munjal G, Hao J, Teuber LR, Brummer EC (2018) Selection mapping identi�es loci underpinning autumndormancy in alfalfa (Medicago sativa). G3: Genes, Genomes, Genetics 8:461-468
Novillo F, Alonso JM, Ecker JR, Salinas J (2004) CBF2/DREB1C is a negative regulator of CBF1/DREB1Band CBF3/DREB1A expression and plays a central role in stress tolerance in Arabidopsis. Proceedings ofthe National Academy of Sciences 101:3985-3990
Peterson BG, Carl P, Boudt K, Bennett R, Ulrich J, Zivot E, Cornilly D, Hung E, Lestel M, Balkissoon K (2018)Package ‘performanceanalytics’. R Team Cooperation
Prosperi J-M, Jenczewski E, Muller M-H, Fourtier S, Sampoux J-P, Ronfort J (2014) Alfalfa domesticationhistory, genetic diversity and genetic resources. Legume Perspectives 4:13-14
Qiang H, Chen Z, Zhang Z, Wang X, Gao H, Wang Z (2015) Molecular diversity and population structure ofa worldwide collection of cultivated tetraploid alfalfa (Medicago sativa subsp. sativa L.) germplasm asrevealed by microsatellite markers. PLoS One 10:e0124592
Rietveld CA, Conley D, Eriksson N, Esko T, Medland SE, Vinkhuyzen AA, Yang J, Boardman JD, Chabris CF,Dawes CT (2014) Replicability and robustness of genome-wide-association studies for behavioral traits.Psychological science 25:1975-1986
Sakiroglu M, Brummer EC (2017) Identi�cation of loci controlling forage yield and nutritive value in diploidalfalfa using GBS-GWAS. Theoretical and applied genetics 130:261-268
Şakiroğlu M, Doyle JJ, Brummer EC (2010) Inferring population structure and genetic diversity of broadrange of wild diploid alfalfa (Medicago sativa L.) accessions using SSR markers. Theoretical and appliedgenetics 121:403-415
Scossa F, Alseekh S, Fernie AR (2021) Integrating multi-omics data for crop improvement. Journal of PlantPhysiology 257:153352
Page 17/23
Sheaffer C, Barnes D, Warnes D, Lueschen W, Ford H, Swanson D (1992) Seeding‐year cutting affectswinter survival and its association with fall growth score in alfalfa. Crop Science 32:225-231
Shen C, Du H, Chen Z, Lu H, Zhu F, Chen H, Meng X, Liu Q, Liu P, Zheng L (2020) The Chromosome-levelgenome sequence of the autotetraploid alfalfa and resequencing of core germplasms provide genomicresources for alfalfa research. Molecular Plant 13:1250-1261
Shu Y, Li W, Zhao J, Zhang S, Xu H, Liu Y, Guo C (2017) Transcriptome sequencing analysis of alfalfareveals CBF genes potentially playing important roles in response to freezing stress. Genetics andmolecular biology 40:824-833
Smith D (1961) Association of fall growth habit and winter survival in alfalfa. Canadian Journal of PlantScience 41:244-251
STOUT DG (1985) Fall growth and stand persistence of alfalfa in interior British Columbia. Canadianjournal of plant science 65:935-941
STOUT DG, HALL JW (1989) Fall growth and winter survival of alfalfa in interior British Columbia.Canadian Journal of Plant Science 69:491-499
Teuber L, Taggard K, Gibbs L, McCaslin M, Peterson M, Barnes D (1998) Fall dormancy. Standard tests tocharacterize alfalfa cultivars:A-1
Van der Auwera GA, Carneiro MO, Hartl C, Poplin R, Del Angel G, Levy‐Moonshine A, Jordan T, Shakir K,Roazen D, Thibault J (2013) From FastQ data to high‐con�dence variant calls: the genome analysis toolkitbest practices pipeline. Current protocols in bioinformatics 43:11.10. 11-11.10. 33
Wang J, Zhang Z (2020) GAPIT Version 3: Boosting Power and Accuracy for Genomic Association andPrediction. bioRxiv
Wang Z, Qiang H, Zhao H, Xu R, Zhang Z, Gao H, Wang X, Liu G, Zhang Y (2016) Association mapping for�ber-related traits and digestibility in alfalfa (Medicago sativa). Frontiers in plant science 7:331
Wang Z, Wang X, Zhang H, Ma L, Zhao H, Jones CS, Chen J, Liu G (2020) A genome‐wide associationstudy approach to the identi�cation of candidate genes underlying agronomic traits in alfalfa (Medicagosativa L.). Plant biotechnology journal 18:611
Wickham H (2011) ggplot2. Wiley Interdisciplinary Reviews: Computational Statistics 3:180-185
Yu L-X, Liu X, Boge W, Liu X-P (2016) Genome-wide association study identi�es loci for salt toleranceduring germination in autotetraploid alfalfa (Medicago sativa L.) using genotyping-by-sequencing.Frontiers in plant science 7:956
Yu LX, Zheng P, Zhang T, Rodringuez J, Main D (2017) Genotyping‐by‐sequencing‐based genome‐wideassociation studies on Verticillium wilt resistance in autotetraploid alfalfa (Medicago sativa L.). Molecular
Page 18/23
plant pathology 18:187-194
Zhang C, Dong S-S, Xu J-Y, He W-M, Yang T-L (2019) PopLDdecay: a fast and effective tool for linkagedisequilibrium decay analysis based on variant call format �les. Bioinformatics 35:1786-1788
Zhang T, Yu L-X, Zheng P, Li Y, Rivera M, Main D, Greene SL (2015) Identi�cation of loci associated withdrought resistance traits in heterozygous autotetraploid alfalfa (Medicago sativa L.) using genome-wideassociation studies with genotyping by sequencing. PLoS One 10:e0138931
Zhou J, Liu L, Chen CJ, Zhang M, Lu X, Zhang Z, Huang X, Shi Y (2019) Genome-wide association study ofmilk and reproductive traits in dual-purpose Xinjiang Brown cattle. BMC genomics 20:1-11
Zhou Z, Jiang Y, Wang Z, Gou Z, Lyu J, Li W, Yu Y, Shu L, Zhao Y, Ma Y (2015) Resequencing 302 wild andcultivated accessions identi�es genes related to domestication and improvement in soybean. Naturebiotechnology 33:408-414
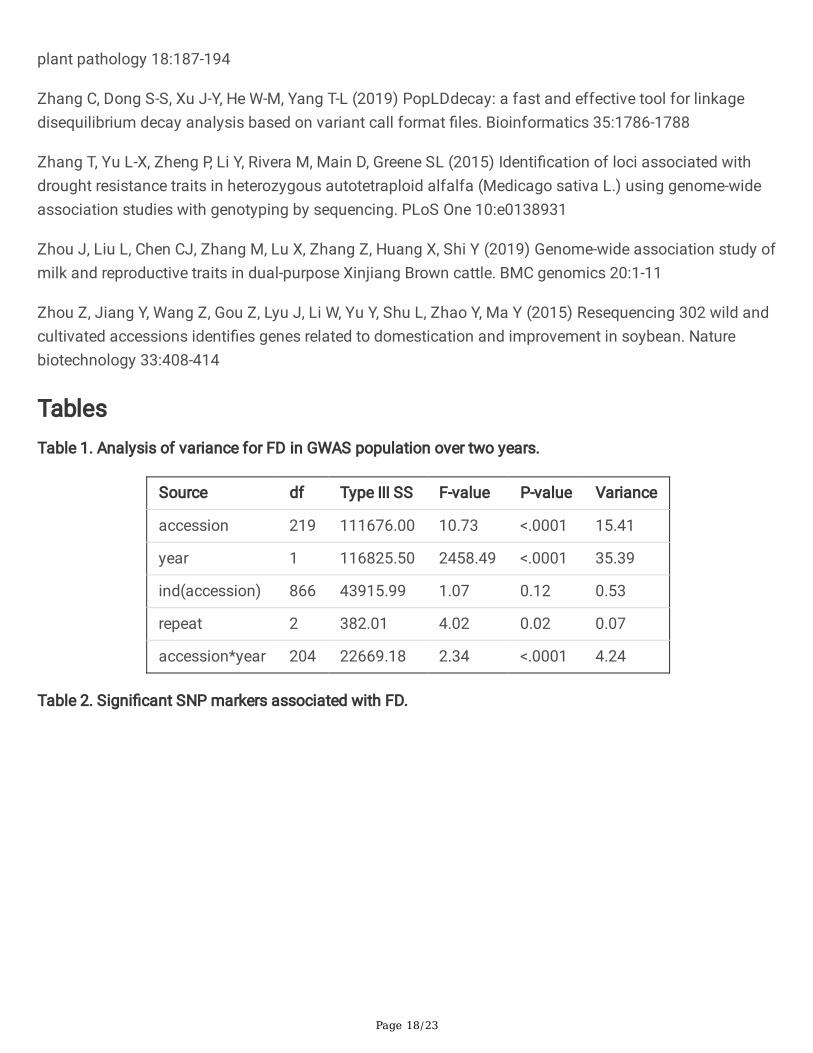
TablesTable 1. Analysis of variance for FD in GWAS population over two years.
Source df Type III SS F-value P-value Variance
accession 219 111676.00 10.73 <.0001 15.41
year 1 116825.50 2458.49 <.0001 35.39
ind(accession) 866 43915.99 1.07 0.12 0.53
repeat 2 382.01 4.02 0.02 0.07
accession*year 204 22669.18 2.34 <.0001 4.24
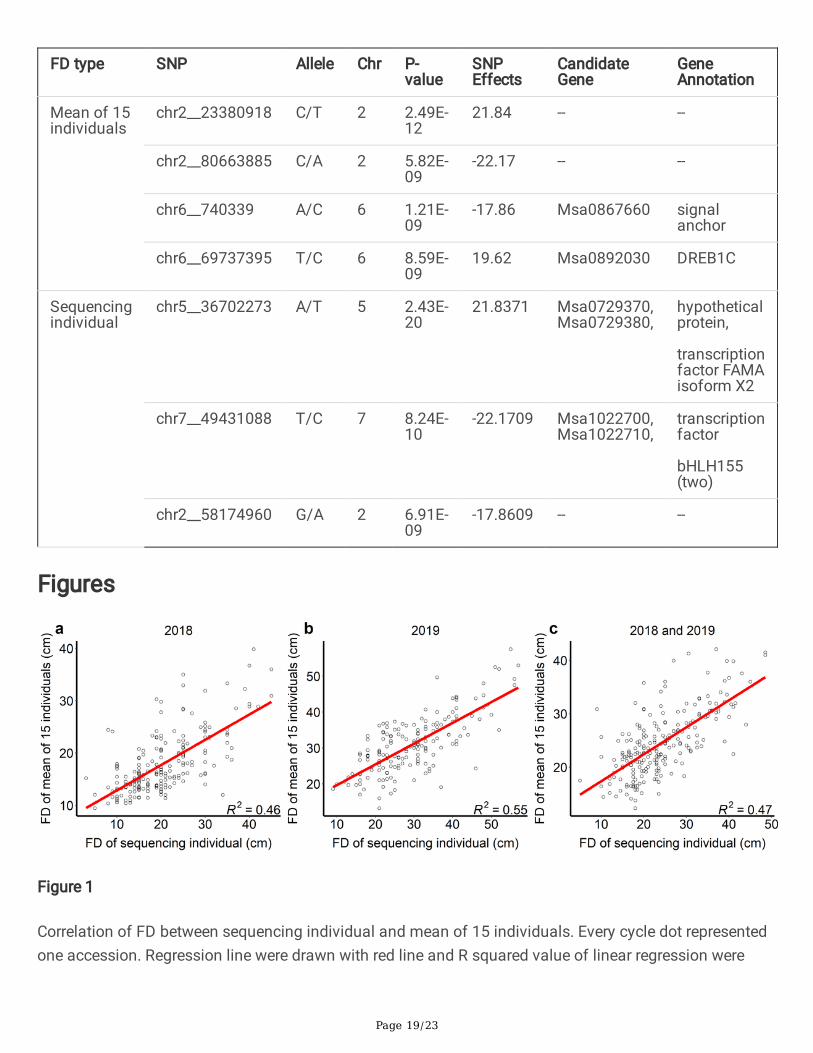
Table 2. Signi�cant SNP markers associated with FD.
Page 19/23
FD type SNP Allele Chr P-value
SNPEffects
CandidateGene
GeneAnnotation
Mean of 15individuals
chr2__23380918 C/T 2 2.49E-12
21.84 -- --
chr2__80663885 C/A 2 5.82E-09
-22.17 -- --
chr6__740339 A/C 6 1.21E-09
-17.86 Msa0867660 signalanchor
chr6__69737395 T/C 6 8.59E-09
19.62 Msa0892030 DREB1C
Sequencingindividual
chr5__36702273 A/T 5 2.43E-20
21.8371 Msa0729370,Msa0729380,
hypotheticalprotein,
transcriptionfactor FAMAisoform X2
chr7__49431088 T/C 7 8.24E-10
-22.1709 Msa1022700,Msa1022710,
transcriptionfactor
bHLH155(two)
chr2__58174960 G/A 2 6.91E-09
-17.8609 -- --
Figures
Figure 1
Correlation of FD between sequencing individual and mean of 15 individuals. Every cycle dot representedone accession. Regression line were drawn with red line and R squared value of linear regression were
Page 20/23
present at the bottom right of the �gure. a, the correlation information in 2018. b, the correlationinformation in 2019. c, the correlation information of 2018 and 2019.
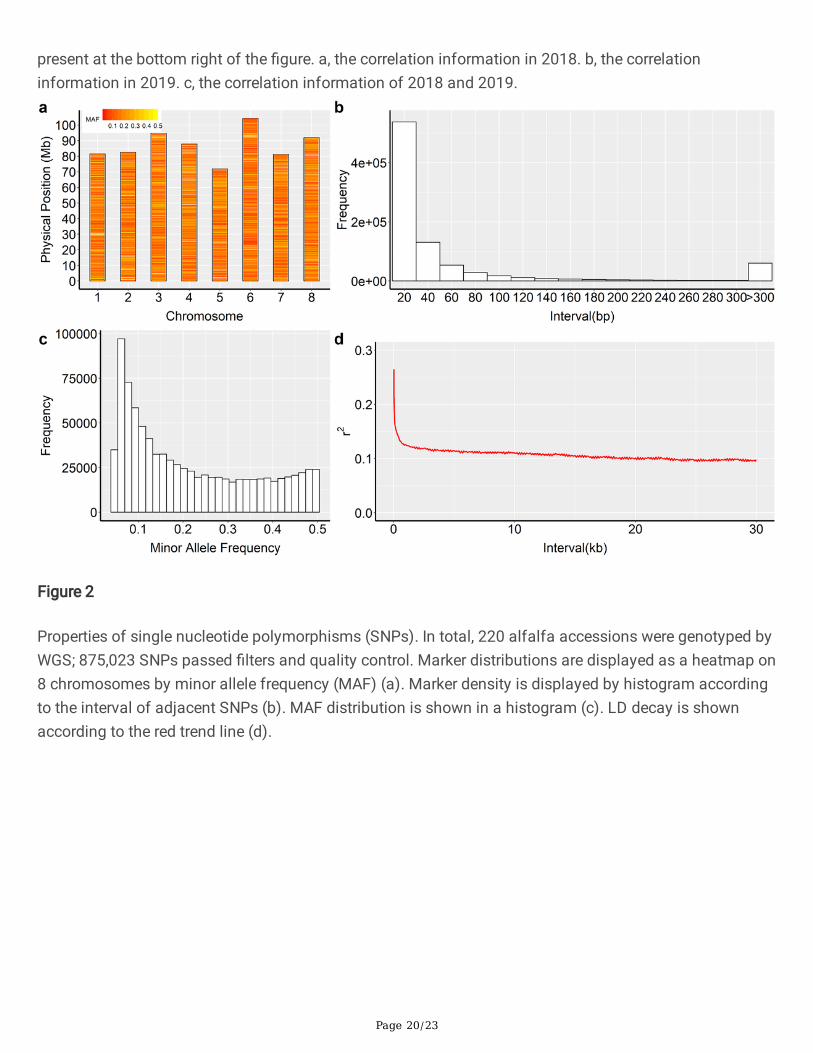
Figure 2
Properties of single nucleotide polymorphisms (SNPs). In total, 220 alfalfa accessions were genotyped byWGS; 875,023 SNPs passed �lters and quality control. Marker distributions are displayed as a heatmap on8 chromosomes by minor allele frequency (MAF) (a). Marker density is displayed by histogram accordingto the interval of adjacent SNPs (b). MAF distribution is shown in a histogram (c). LD decay is shownaccording to the red trend line (d).
Page 21/23
Figure 3
Population structure from the principal component analysis. A total of 875,023 SNPs and 220 alfalfaaccessions were used to perform the principal component analysis. Population structure is shown as a 3Dplot (D) of the �rst three principal components (PC) with colored points that de�ne the seven groups.There are 13, 35, 73, 32, 4, 38, and 25 accessions in the groups corresponding to Africa, China, Europe,North America, other (not belonging to any other group), other Asia (except China), and South America,respectively.
Page 22/23
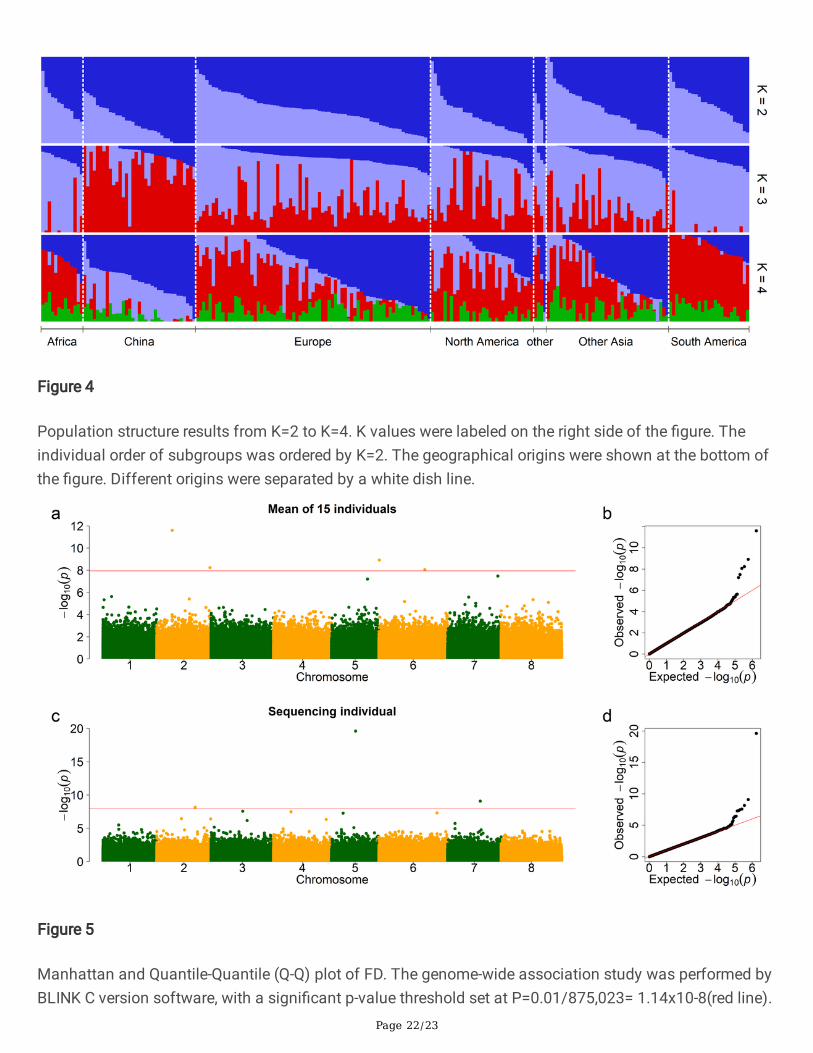
Figure 4
Population structure results from K=2 to K=4. K values were labeled on the right side of the �gure. Theindividual order of subgroups was ordered by K=2. The geographical origins were shown at the bottom ofthe �gure. Different origins were separated by a white dish line.
Figure 5
Manhattan and Quantile-Quantile (Q-Q) plot of FD. The genome-wide association study was performed byBLINK C version software, with a signi�cant p-value threshold set at P=0.01/875,023= 1.14x10⁻⁸(red line).
Page 23/23
We identi�ed four signi�cantly associated SNPs for FD of mean of 15 individuals, which are shown in theManhattan plot (a). Q-Q plots are displayed on the right panel (b). There are three associated SNP for FDof sequencing individual (c and d).
Figure 6
Distribution of FD among the genotypes of the associated SNPs. The SNP associated with FD of mean of15 individuals were shown in upper half �gure (a, b, c and d). The SNP associated with FD of sequencingindividual were shown in lower half �gure (e, f and g). There is only one individual with TT genotype forSNP chr2_23380918 and no individual with genotype of CC on SNP chr6_740339. There is nohomozygous genotype AA for SNP chr5__36702273 and no GG for SNP chr2__58174960.
Supplementary Files
This is a list of supplementary �les associated with this preprint. Click to download.
supplementary�leupload.pdf
TableS1.xlsx
TableS3.xlsx