Embed Size (px)
Citation preview
PD
Amcf
F
T
R
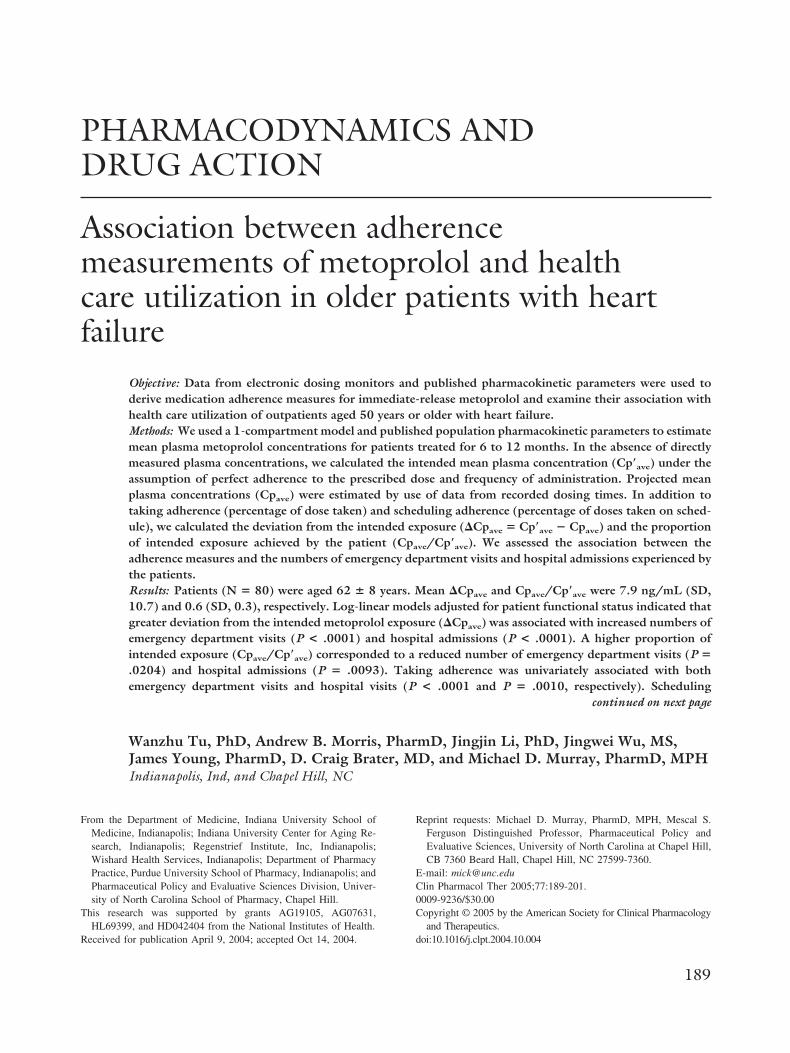
HARMACODYNAMICS ANDRUG ACTION
ssociation between adherenceeasurements of metoprolol and health
are utilization in older patients with heartailure
Objective: Data from electronic dosing monitors and published pharmacokinetic parameters were used toderive medication adherence measures for immediate-release metoprolol and examine their association withhealth care utilization of outpatients aged 50 years or older with heart failure.Methods: We used a 1-compartment model and published population pharmacokinetic parameters to estimatemean plasma metoprolol concentrations for patients treated for 6 to 12 months. In the absence of directlymeasured plasma concentrations, we calculated the intended mean plasma concentration (Cp�ave) under theassumption of perfect adherence to the prescribed dose and frequency of administration. Projected meanplasma concentrations (Cpave) were estimated by use of data from recorded dosing times. In addition totaking adherence (percentage of dose taken) and scheduling adherence (percentage of doses taken on sched-ule), we calculated the deviation from the intended exposure (�Cpave � Cp�ave � Cpave) and the proportionof intended exposure achieved by the patient (Cpave/Cp�ave). We assessed the association between theadherence measures and the numbers of emergency department visits and hospital admissions experienced bythe patients.Results: Patients (N � 80) were aged 62 � 8 years. Mean �Cpave and Cpave/Cp�ave were 7.9 ng/mL (SD,10.7) and 0.6 (SD, 0.3), respectively. Log-linear models adjusted for patient functional status indicated thatgreater deviation from the intended metoprolol exposure (�Cpave) was associated with increased numbers ofemergency department visits (P < .0001) and hospital admissions (P < .0001). A higher proportion ofintended exposure (Cpave/Cp�ave) corresponded to a reduced number of emergency department visits (P �
.0204) and hospital admissions (P � .0093). Taking adherence was univariately associated with bothemergency department visits and hospital visits (P < .0001 and P � .0010, respectively). Scheduling
continued on next page
Wanzhu Tu, PhD, Andrew B. Morris, PharmD, Jingjin Li, PhD, Jingwei Wu, MS,James Young, PharmD, D. Craig Brater, MD, and Michael D. Murray, PharmD, MPHIndianapolis, Ind, and Chapel Hill, NC
rom the Department of Medicine, Indiana University School ofMedicine, Indianapolis; Indiana University Center for Aging Re-search, Indianapolis; Regenstrief Institute, Inc, Indianapolis;Wishard Health Services, Indianapolis; Department of PharmacyPractice, Purdue University School of Pharmacy, Indianapolis; andPharmaceutical Policy and Evaluative Sciences Division, Univer-sity of North Carolina School of Pharmacy, Chapel Hill.
his research was supported by grants AG19105, AG07631,HL69399, and HD042404 from the National Institutes of Health.
Reprint requests: Michael D. Murray, PharmD, MPH, Mescal S.Ferguson Distinguished Professor, Pharmaceutical Policy andEvaluative Sciences, University of North Carolina at Chapel Hill,CB 7360 Beard Hall, Chapel Hill, NC 27599-7360.
E-mail: [email protected] Pharmacol Ther 2005;77:189-201.0009-9236/$30.00Copyright © 2005 by the American Society for Clinical Pharmacology
and Therapeutics.
eceived for publication April 9, 2004; accepted Oct 14, 2004. doi:10.1016/j.clpt.2004.10.004189
rcdampibesfhpd
bpttmgpmccpoarmmtppepmth
pe
CLINICAL PHARMACOLOGY & THERAPEUTICS190 Tu et al MARCH 2005
adherence was associated with the number of emergency department visits (P � .0181) but not with thenumber of hospital admissions (P � .1602). Model selection procedures consistently chose the proposedmeasures over taking adherence and scheduling adherence.Conclusion: Deviation from the intended exposure and proportion of intended exposure achieved by thepatient are valid adherence measures for immediate-release metoprolol and are associated with health careutilization. The potential utility of these measures for other �-adrenergic antagonists and perhaps other
cardiovascular drugs should be investigated. (Clin Pharmacol Ther 2005;77:189-201.)phptmcrrppd
M
hbjppCaB
voaesoczoaOtclet
at
Patients with chronic diseases must take medicationsegularly to prevent deteriorating illness requiringostly use of health care services such as emergencyepartment (ED) visits and hospitalization. However,pproximately half of all patients who are prescribededications for chronic diseases do not adhere to their
rescriptions.1-3 Medication adherence is particularlymportant to patients with chronic heart failure (CHF)ecause of the propensity for such patients to requirexpensive health care services. Adherence to the pre-cribed regimen by patients with heart failure variesrom 10% to 85%.4,5 Indiscretions in medication ad-erence or diet may result in decompensation in 44% ofatients with CHF and other chronic cardiovasculariseases.6
Adherence measurement has been greatly facilitatedy electronic dosing monitors that record the temporalattern of medication container openings.7 Assuminghat an appropriate number of tablets are taken eachime a lid is opened, aggregate adherence measuresay be computed to summarize medication event data
enerated by electronic monitors.8-10 Choo et al11 ex-lored the interrelationships among these measure-ents and elucidated their mathematic foundation. Be-
ause of the relationship between dosing and plasmaoncentration,12,13 we believed that it would be appro-riate to explore this relationship and assess its effectn relevant patient outcomes. As such, we derived 2dherence measures that couple electronic dosingecords with the pharmacokinetic properties of theonitored drug. In doing so, the resulting adherenceeasures consider the frequency, dose administration
ime, dose strength, and population pharmacokineticarameters of the medication. We hypothesized that theroposed measures would be associated with diseasexacerbation. We tested this hypothesis in 80 olderatients with CHF treated with immediate-releaseetoprolol and then assessed the associations between
he new measures and the numbers of ED visits andospital admissions experienced by these patients.In the past decade, several investigators have ex-
lored the use of dosing history data to improve the
stimation of drug concentration curves by measuring ilasma drug concentrations.12,14,15 Their work hasighlighted the importance of dosing history data inharmacokinetic and pharmacodynamic studies. Weook a different approach. Instead of relying on directlyeasured drug concentrations, we estimated plasma
oncentrations by using an individual patient’s dosingecords and published population pharmacokinetic pa-ameters. One advantage of using published populationarameters is that the resulting measures could be ap-licable to nonpharmacokinetic clinical trials in whichrug concentrations were unavailable.
ETHODSSetting and participants. Data were obtained from a
ealth services research, randomized, controlled trialeing conducted in Indianapolis, Ind. The primary ob-ective of the trial was to test the effectiveness of aharmacy-based intervention program aimed at im-roving medication adherence in older adults withHF.16 The study protocol was approved by the Indi-na University–Purdue University Institutional Reviewoard (Indianapolis, Ind).Participants were recruited from Wishard Health Ser-
ices, which serves the inner-city residents of Indianap-lis, Ind. The study population may be generally char-cterized as having limited resources and beingthnically diverse. Eligible participants were English-peaking, were aged 50 years or older, had a diagnosisf CHF, and were currently taking at least 1 cardiovas-ular medication, including angiotensin-converting en-yme (ACE) inhibitors, angiotensin II receptor antag-nists, �-adrenergic receptor antagonists, digoxin, anldosterone antagonist, and loop or nonloop diuretics.n enrollment, participants were provided with elec-
ronic monitor lids (see below) on their prescriptionontainers for each of the aforementioned cardiovascu-ar medications. Other prescription medication contain-rs did not have electronic monitors affixed. Medica-ion use was monitored for 6 to 12 months.
To test the operating characteristics of the proposeddherence measures, we used data from the trial’s con-rol arm for 80 subjects who had been prescribed
mmediate-release metoprolol, a selective �1-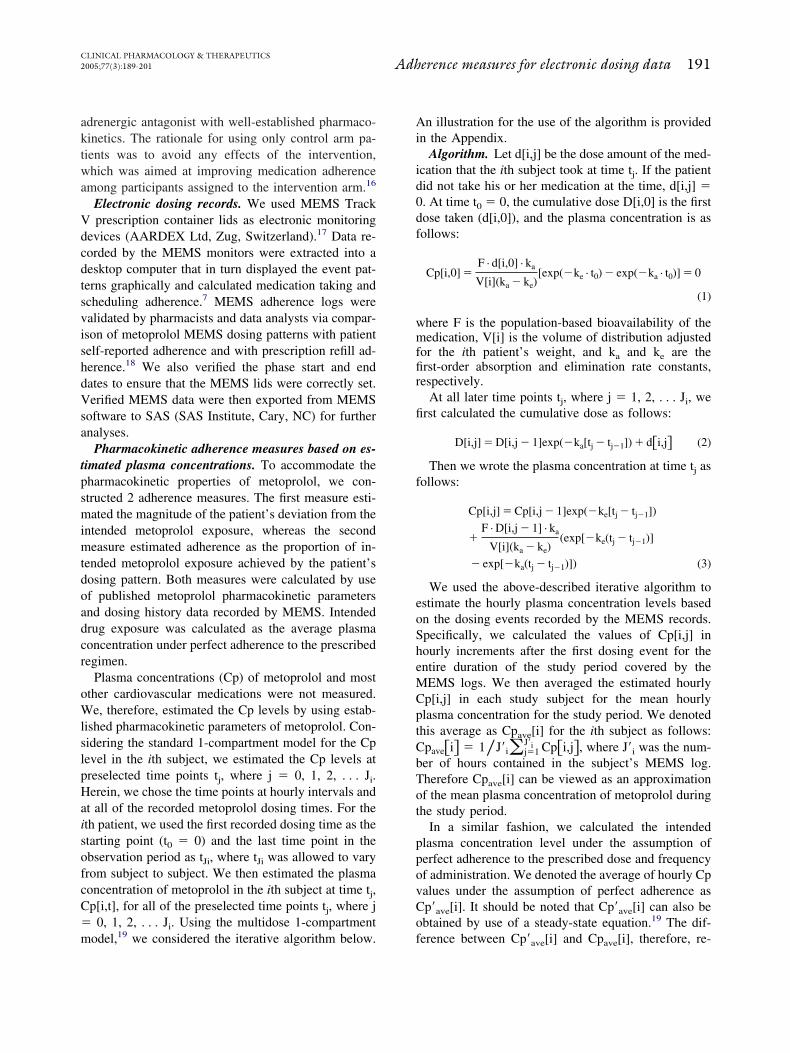
aktwa
VdcdtsvishdVsa
tpsmimtdoadcr
oWlslpHaisofcC�m
Ai
id0df
wmffir
fi
f
eoSheMCptCbTot
ppovCo
CLINICAL PHARMACOLOGY & THERAPEUTICS2005;77(3):189-201 Adherence measures for electronic dosing data 191
drenergic antagonist with well-established pharmaco-inetics. The rationale for using only control arm pa-ients was to avoid any effects of the intervention,hich was aimed at improving medication adherence
mong participants assigned to the intervention arm.16
Electronic dosing records. We used MEMS Trackprescription container lids as electronic monitoring
evices (AARDEX Ltd, Zug, Switzerland).17 Data re-orded by the MEMS monitors were extracted into aesktop computer that in turn displayed the event pat-erns graphically and calculated medication taking andcheduling adherence.7 MEMS adherence logs werealidated by pharmacists and data analysts via compar-son of metoprolol MEMS dosing patterns with patientelf-reported adherence and with prescription refill ad-erence.18 We also verified the phase start and endates to ensure that the MEMS lids were correctly set.erified MEMS data were then exported from MEMS
oftware to SAS (SAS Institute, Cary, NC) for furthernalyses.
Pharmacokinetic adherence measures based on es-imated plasma concentrations. To accommodate theharmacokinetic properties of metoprolol, we con-tructed 2 adherence measures. The first measure esti-ated the magnitude of the patient’s deviation from the
ntended metoprolol exposure, whereas the secondeasure estimated adherence as the proportion of in-
ended metoprolol exposure achieved by the patient’sosing pattern. Both measures were calculated by usef published metoprolol pharmacokinetic parametersnd dosing history data recorded by MEMS. Intendedrug exposure was calculated as the average plasmaoncentration under perfect adherence to the prescribedegimen.
Plasma concentrations (Cp) of metoprolol and mostther cardiovascular medications were not measured.e, therefore, estimated the Cp levels by using estab-
ished pharmacokinetic parameters of metoprolol. Con-idering the standard 1-compartment model for the Cpevel in the ith subject, we estimated the Cp levels atreselected time points tj, where j � 0, 1, 2, . . . Ji.erein, we chose the time points at hourly intervals and
t all of the recorded metoprolol dosing times. For theth patient, we used the first recorded dosing time as thetarting point (t0 � 0) and the last time point in thebservation period as tJi, where tJi was allowed to varyrom subject to subject. We then estimated the plasmaoncentration of metoprolol in the ith subject at time tj,p[i,t], for all of the preselected time points tj, where j
0, 1, 2, . . . Ji. Using the multidose 1-compartment
odel,19 we considered the iterative algorithm below. fn illustration for the use of the algorithm is providedn the Appendix.
Algorithm. Let d[i,j] be the dose amount of the med-cation that the ith subject took at time tj. If the patientid not take his or her medication at the time, d[i,j] �. At time t0 � 0, the cumulative dose D[i,0] is the firstose taken (d[i,0]), and the plasma concentration is asollows:
Cp[i,0] �F · d[i,0] · ka
V[i](ka � ke)[exp(�ke · t0) � exp(�ka · t0)] � 0
(1)
here F is the population-based bioavailability of theedication, V[i] is the volume of distribution adjusted
or the ith patient’s weight, and ka and ke are therst-order absorption and elimination rate constants,espectively.
At all later time points tj, where j � 1, 2, . . . Ji, werst calculated the cumulative dose as follows:
D[i,j] � D[i,j � 1]exp(�ka[tj � tj�1]) � d�i,j� (2)
Then we wrote the plasma concentration at time tj asollows:
Cp[i,j] � Cp[i,j � 1]exp(�ke[tj � tj�1])
�F · D[i,j � 1] · ka
V[i](ka � ke)(exp[�ke(tj � tj�1)]
� exp[�ka(tj � tj�1)]) (3)
We used the above-described iterative algorithm tostimate the hourly plasma concentration levels basedn the dosing events recorded by the MEMS records.pecifically, we calculated the values of Cp[i,j] inourly increments after the first dosing event for thentire duration of the study period covered by theEMS logs. We then averaged the estimated hourlyp[i,j] in each study subject for the mean hourlylasma concentration for the study period. We denotedhis average as Cpave[i] for the ith subject as follows:pave�i� � 1� J�i�j�1
J�i Cp�i,j�, where J�i was the num-er of hours contained in the subject’s MEMS log.herefore Cpave[i] can be viewed as an approximationf the mean plasma concentration of metoprolol duringhe study period.
In a similar fashion, we calculated the intendedlasma concentration level under the assumption oferfect adherence to the prescribed dose and frequencyf administration. We denoted the average of hourly Cpalues under the assumption of perfect adherence asp�ave[i]. It should be noted that Cp�ave[i] can also bebtained by use of a steady-state equation.19 The dif-
erence between Cp�ave[i] and Cpave[i], therefore, re-
flits�ieddhtCi
Ci
tt
sdpphuocema
CLINICAL PHARMACOLOGY & THERAPEUTICS192 Tu et al MARCH 2005
ected the deviation of the projected Cp from thentended (or prescribed) level. The greater this devia-ion, the poorer the patient’s adherence to the pre-cribed metoprolol regimen. Hence we propose to useCpave[i] � Cp�ave[i] � Cpave[i] to measure the med-
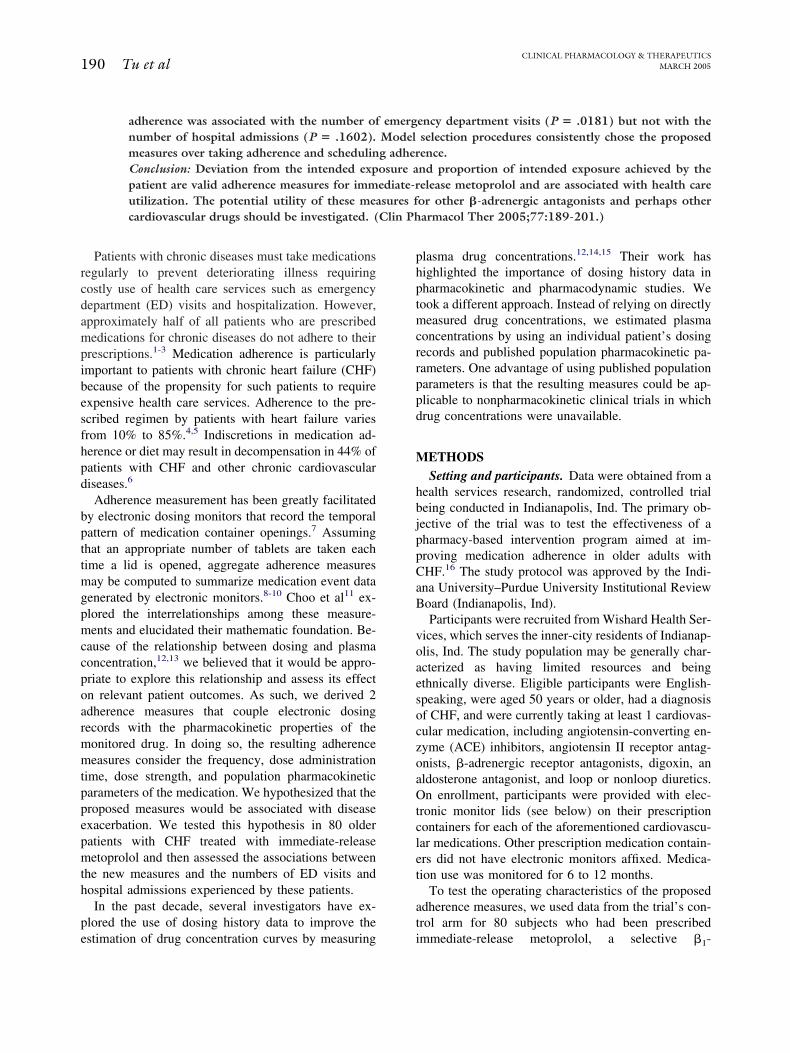
cation adherence of the ith patient. Unlike most of thexisting adherence measures, �Cpave[i] also accommo-ates the pharmacokinetic properties of the drug. For arug with a longer half-life, the plasma concentrationas a slower decrement and �Cpave[i] is less sensitiveo a delayed administration. Fig 1 depicts the estimatedp curves of metoprolol for an abbreviated time period
n 4 representative participants.An alternative adherence measure was the ratio
pave[i]/Cp�ave[i], which quantified the proportion of
Fig 1. Estimated and intended metoprolol plaabbreviated time interval for exemplificationestimated plasma concentration under perfecpattern. The continuous curve depicts the MEMrepresents the overall average value of intenhorizontal line represents the hourly average mMEMS-recorded dosing pattern.
ntended plasma concentration achieved by the ith pa- p
ient. A larger value for this ratio indicated better pa-ient adherence to the prescribed regimen.
Metoprolol. At therapeutic doses, metoprolol acts byelectively antagonizing the �1 receptor in the myocar-ium, producing negative chronotropism and inotro-ism. Long-term use of metoprolol in heart failureatients has been shown to be beneficial in reducingospitalization and mortality rates.20 Abrupt discontin-ation and erratic administration of the drug, on thether hand, are known risk factors of rebound tachy-ardia, hypertension, and subsequent cardiac isch-mia.21 Patients in this study took immediate-releaseetoprolol at doses ranging from 12.5 mg to 100 mg atfrequency of 12 hours.We used a 1-compartment model with published
centration curves for 4 study subjects duringashed curve depicts the time course of thence and thus represents the intended dosingded dosing pattern. The upper horizontal linetoprolol exposure (Cp�ave[i]), and the lowerl concentration (Cpave[i]) estimated from the
sma con. The dt adhere
S-recorded meetoprolo
harmacokinetic parameters to estimate plasma con-
cacwd4p(p
wokiep
opM
tsmiaiestinmamvtmaamYbamsol
Wapmasavldobcmp2�Ctt
tsapi8iFtaudevcmufiitmrmttv
R
CLINICAL PHARMACOLOGY & THERAPEUTICS2005;77(3):189-201 Adherence measures for electronic dosing data 193
entrations of metoprolol, although it more appropri-tely follows a 2-compartment kinetic model. Two-ompartment models could be used when kinetic dataere available to fit those models. Clearance based onifferences in metabolism varies between 50 L/h and09 L/h. In the absence of individual data, we used theopulation-based value of the elimination rate constantke) and the 1-compartment model to estimate thelasma concentration.The pharmacokinetic parameters of metoprolol are
ell established. The drug has an elimination half-lifef approximately 3.5 hours, bioavailability (F) of 0.5,
e equal to 0.198/h, and time to peak Cp (tmax) approx-mately equal to 1.5.22,23 On the basis of the followingquation, we solved for an estimate of the absorptionarameter (ka) equal to 1.585/h:
tmax �1
(ka � ke)ln�ka
ke�
By use of these parameters, we computed the valuesf �Cpave[i] and Cpave[i]/Cp�ave[i] for each of the studyatients based on the dosing events recorded byEMS.Statistical analysis. To assess the performance of
he proposed pharmacokinetic-based adherence mea-ures, we first examined their correlations with 2 com-only used MEMS adherence measures, namely, tak-
ng adherence and scheduling adherence. Takingdherence was defined as the percentage of dose takenn the observation period, whereas scheduling adher-nce was defined as the percentage of dose taken onchedule (ie, �2 hours of the desired dosing time). Wehen evaluated their associations with 2 important clin-cal outcomes—numbers of hospital admissions andumbers of ED visits, which are regarded as surrogatearkers of disease exacerbation. Specifically, by use of
n electronic medical record system,24,25 we deter-ined the numbers of hospital admissions and ED
isits experienced by each study participant during theime period of observation. We then fitted log-linearodels by using the numbers of hospital admissions
nd ED visits as outcome variables. Important explan-tory variables considered for the model included de-ographic characteristics (age, race, and gender), Nework Heart Association (NYHA) classification, num-ers and indicators of cardiovascular drugs, and takingnd scheduling adherence and the proposed adherenceeasure of metoprolol. Race, gender, and NYHA clas-
ification were treated as categoric variables. Each levelf a categoric variable was compared with a reference
evel. pThe effects of variables were evaluated by use of theald test.26 Because lengths of observation differed
mong subjects, we introduced the length of follow-uperiod into the model as an offset parameter.27 The 4etoprolol adherence measures (taking and scheduling
dherence and the 2 new pharmacokinetic-based mea-ures) were used as independent variables for the ex-mination of their associations with the numbers of EDisits and hospital admissions. Our general model se-ection strategy was to first screen all of the indepen-ent variables for their univariate associations withutcome variables. Then, for each outcome, we usedoth forward and stepwise selection procedures tohoose the final models. Because 2 new adherenceeasures were proposed in this research, to assess the
erformance of each one independently, we conductedparallel selection processes for each outcome, one forCpave[i] and all other covariates (excluding Cpave[i]/p�ave[i]) and the other for Cpave[i]/Cp�ave[i] and all of
he covariates (excluding �Cpave[i]). This resulted inhe 4 final models.
Although the primary objective of this research waso develop new pharmacokinetic-based adherence mea-ures and use them to assess the effect of metoprololdherence on health care utilization, it was important toresent the results within the context of other concom-tantly used cardiovascular drugs. In our study sample,7% and 83% of the patients, respectively, took diuret-cs and ACE inhibitors concurrently with metoprolol.ewer patients were taking angiotensin II receptor an-
agonists, digoxin, and spironolactone. To assess thedherence effects of concomitant drugs, we first eval-ated the taking and scheduling effects for each of theserugs univariately via log-linear models. Taking adher-nce and scheduling adherence of these other cardio-ascular drugs were used in the model selection pro-ess, but none of them were selected into the finalodels. We re-examined the adherence effects of di-
retics and ACE inhibitors by including them in thenal models. We did not enter diuretics and ACE
nhibitors into the final models simultaneously becausehe stability of the models was undermined by strongulticollinearity from multiple factors and the much
educed sample size (only 53 patients were prescribedetoprolol, diuretics, and ACE inhibitors concomi-
antly). We do not present data on angiotensin II recep-or antagonists, digoxin, and spironolactone in multi-ariate models because of Journal space limitation.
ESULTSDemographic and clinical characteristics of the study
atients are listed in Table I. The mean age (�SD) of
T
mA
CLINICAL PHARMACOLOGY & THERAPEUTICS194 Tu et al MARCH 2005
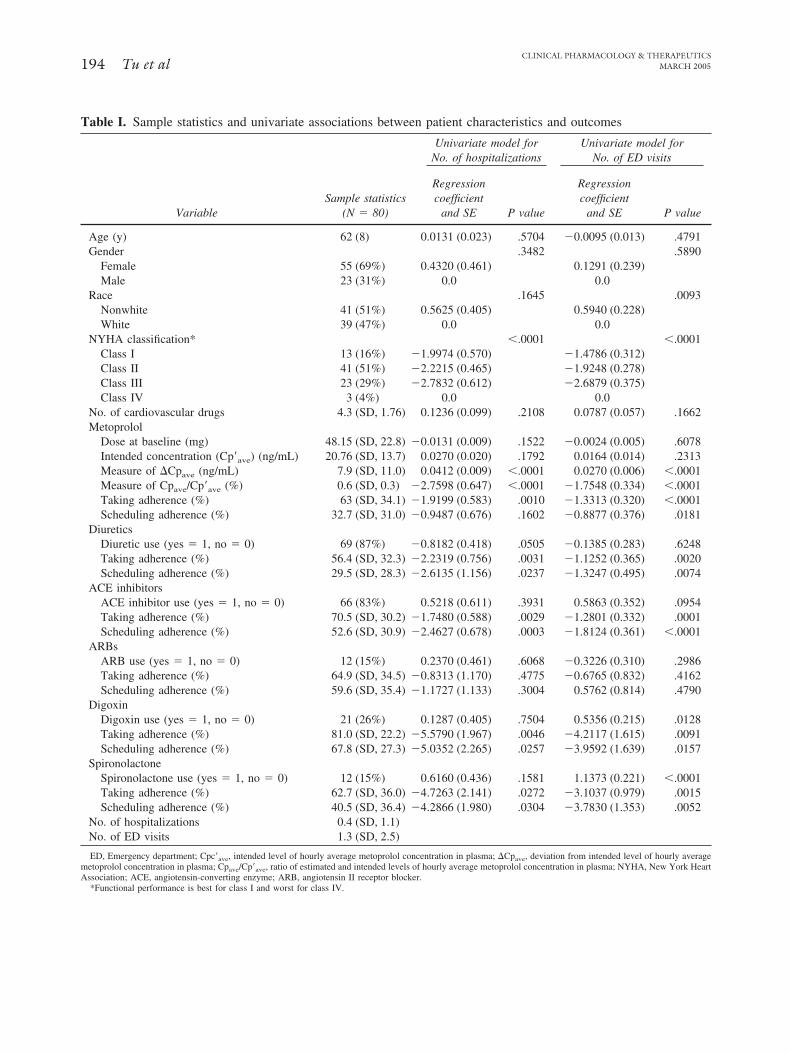
able I. Sample statistics and univariate associations between patient characteristics and outcomes
VariableSample statistics
(N � 80)
Univariate model forNo. of hospitalizations
Univariate model forNo. of ED visits
Regressioncoefficient
and SE P value
Regressioncoefficient
and SE P value
Age (y) 62 (8) 0.0131 (0.023) .5704 �0.0095 (0.013) .4791Gender .3482 .5890
Female 55 (69%) 0.4320 (0.461) 0.1291 (0.239)Male 23 (31%) 0.0 0.0
Race .1645 .0093Nonwhite 41 (51%) 0.5625 (0.405) 0.5940 (0.228)White 39 (47%) 0.0 0.0
NYHA classification* �.0001 �.0001Class I 13 (16%) �1.9974 (0.570) �1.4786 (0.312)Class II 41 (51%) �2.2215 (0.465) �1.9248 (0.278)Class III 23 (29%) �2.7832 (0.612) �2.6879 (0.375)Class IV 3 (4%) 0.0 0.0
No. of cardiovascular drugs 4.3 (SD, 1.76) 0.1236 (0.099) .2108 0.0787 (0.057) .1662Metoprolol
Dose at baseline (mg) 48.15 (SD, 22.8) �0.0131 (0.009) .1522 �0.0024 (0.005) .6078Intended concentration (Cp�ave) (ng/mL) 20.76 (SD, 13.7) 0.0270 (0.020) .1792 0.0164 (0.014) .2313Measure of �Cpave (ng/mL) 7.9 (SD, 11.0) 0.0412 (0.009) �.0001 0.0270 (0.006) �.0001Measure of Cpave/Cp�ave (%) 0.6 (SD, 0.3) �2.7598 (0.647) �.0001 �1.7548 (0.334) �.0001Taking adherence (%) 63 (SD, 34.1) �1.9199 (0.583) .0010 �1.3313 (0.320) �.0001Scheduling adherence (%) 32.7 (SD, 31.0) �0.9487 (0.676) .1602 �0.8877 (0.376) .0181
DiureticsDiuretic use (yes � 1, no � 0) 69 (87%) �0.8182 (0.418) .0505 �0.1385 (0.283) .6248Taking adherence (%) 56.4 (SD, 32.3) �2.2319 (0.756) .0031 �1.1252 (0.365) .0020Scheduling adherence (%) 29.5 (SD, 28.3) �2.6135 (1.156) .0237 �1.3247 (0.495) .0074
ACE inhibitorsACE inhibitor use (yes � 1, no � 0) 66 (83%) 0.5218 (0.611) .3931 0.5863 (0.352) .0954Taking adherence (%) 70.5 (SD, 30.2) �1.7480 (0.588) .0029 �1.2801 (0.332) .0001Scheduling adherence (%) 52.6 (SD, 30.9) �2.4627 (0.678) .0003 �1.8124 (0.361) �.0001
ARBsARB use (yes � 1, no � 0) 12 (15%) 0.2370 (0.461) .6068 �0.3226 (0.310) .2986Taking adherence (%) 64.9 (SD, 34.5) �0.8313 (1.170) .4775 �0.6765 (0.832) .4162Scheduling adherence (%) 59.6 (SD, 35.4) �1.1727 (1.133) .3004 0.5762 (0.814) .4790
DigoxinDigoxin use (yes � 1, no � 0) 21 (26%) 0.1287 (0.405) .7504 0.5356 (0.215) .0128Taking adherence (%) 81.0 (SD, 22.2) �5.5790 (1.967) .0046 �4.2117 (1.615) .0091Scheduling adherence (%) 67.8 (SD, 27.3) �5.0352 (2.265) .0257 �3.9592 (1.639) .0157
SpironolactoneSpironolactone use (yes � 1, no � 0) 12 (15%) 0.6160 (0.436) .1581 1.1373 (0.221) �.0001Taking adherence (%) 62.7 (SD, 36.0) �4.7263 (2.141) .0272 �3.1037 (0.979) .0015Scheduling adherence (%) 40.5 (SD, 36.4) �4.2866 (1.980) .0304 �3.7830 (1.353) .0052
No. of hospitalizations 0.4 (SD, 1.1)No. of ED visits 1.3 (SD, 2.5)
ED, Emergency department; Cpc�ave, intended level of hourly average metoprolol concentration in plasma; �Cpave, deviation from intended level of hourly averageetoprolol concentration in plasma; Cpave/Cp�ave, ratio of estimated and intended levels of hourly average metoprolol concentration in plasma; NYHA, New York Heart
ssociation; ACE, angiotensin-converting enzyme; ARB, angiotensin II receptor blocker.*Functional performance is best for class I and worst for class IV.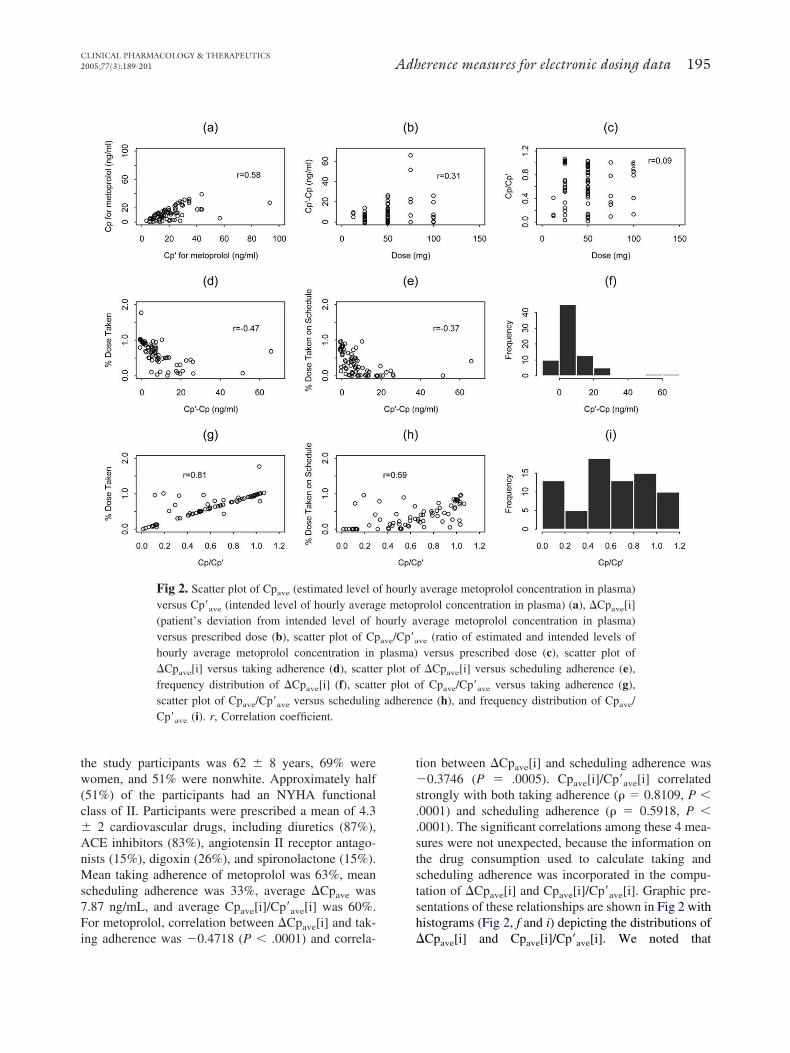
tw(c�AnMs7Fi
t�s..ststsh
CLINICAL PHARMACOLOGY & THERAPEUTICS2005;77(3):189-201 Adherence measures for electronic dosing data 195
he study participants was 62 � 8 years, 69% wereomen, and 51% were nonwhite. Approximately half
51%) of the participants had an NYHA functionallass of II. Participants were prescribed a mean of 4.3
2 cardiovascular drugs, including diuretics (87%),CE inhibitors (83%), angiotensin II receptor antago-ists (15%), digoxin (26%), and spironolactone (15%).ean taking adherence of metoprolol was 63%, mean
cheduling adherence was 33%, average �Cpave was.87 ng/mL, and average Cpave[i]/Cp�ave[i] was 60%.or metoprolol, correlation between �Cpave[i] and tak-
Fig 2. Scatter plot of Cpave (estimated level oversus Cp�ave (intended level of hourly averag(patient’s deviation from intended level of hversus prescribed dose (b), scatter plot of Cphourly average metoprolol concentration in�Cpave[i] versus taking adherence (d), scattefrequency distribution of �Cpave[i] (f), scattscatter plot of Cpave/Cp�ave versus schedulingCp�ave (i). r, Correlation coefficient.
ng adherence was �0.4718 (P � .0001) and correla- �
ion between �Cpave[i] and scheduling adherence was0.3746 (P � .0005). Cpave[i]/Cp�ave[i] correlated
trongly with both taking adherence (� � 0.8109, P �0001) and scheduling adherence (� � 0.5918, P �0001). The significant correlations among these 4 mea-ures were not unexpected, because the information onhe drug consumption used to calculate taking andcheduling adherence was incorporated in the compu-ation of �Cpave[i] and Cpave[i]/Cp�ave[i]. Graphic pre-entations of these relationships are shown in Fig 2 withistograms (Fig 2, f and i) depicting the distributions of
average metoprolol concentration in plasma)rolol concentration in plasma) (a), �Cpave[i]verage metoprolol concentration in plasma)
ve (ratio of estimated and intended levels ofversus prescribed dose (c), scatter plot of�Cpave[i] versus scheduling adherence (e),
f Cpave/Cp�ave versus taking adherence (g),ce (h), and frequency distribution of Cpave/
f hourlye metopourly a
ave/Cp�a
plasma)r plot ofer plot o
adheren
Cpave[i] and Cpave[i]/Cp�ave[i]. We noted that
�cd0s
mwctis4slabsAi(
swt2paicctem
pettwacoaIioCphNs
aIh
anwgCtac
pferbmwm
D
�tpcsmpt
twflttct
pscmtiirtb
CLINICAL PHARMACOLOGY & THERAPEUTICS196 Tu et al MARCH 2005
Cpave[i] was skewed (skewness � 2.5) probably be-ause of 2 large values in the right tail. The rest of theistribution was relatively symmetric (skewness �.58). Fig 2, b and c, showed that �Cpave[i] was moreensitive to the dose input than was Cpave[i]/Cp�ave[i].
Univariate analysis suggested that all 4 adherenceeasures for metoprolol were independently associatedith hospitalizations and ED visits (better adherence
orresponded to decreased utilization), with the excep-ion of the nonsignificant association between schedul-ng adherence and hospitalization (P � .1602). Waldtatistics (Coefficient/SE) corresponding to each of theadherence measures showed that the values of Wald
tatistics for �Cpave[i] and Cpave[i]/Cp�ave[i] werearger than those for taking adherence and schedulingdherence, suggesting that stronger associations existedetween the 2 pharmacokinetic-based adherence mea-ures and the outcomes. Better adherence to diuretics,CE inhibitors, digoxin, and spironolactone was also
ndependently associated with decreased utilizationTable I).
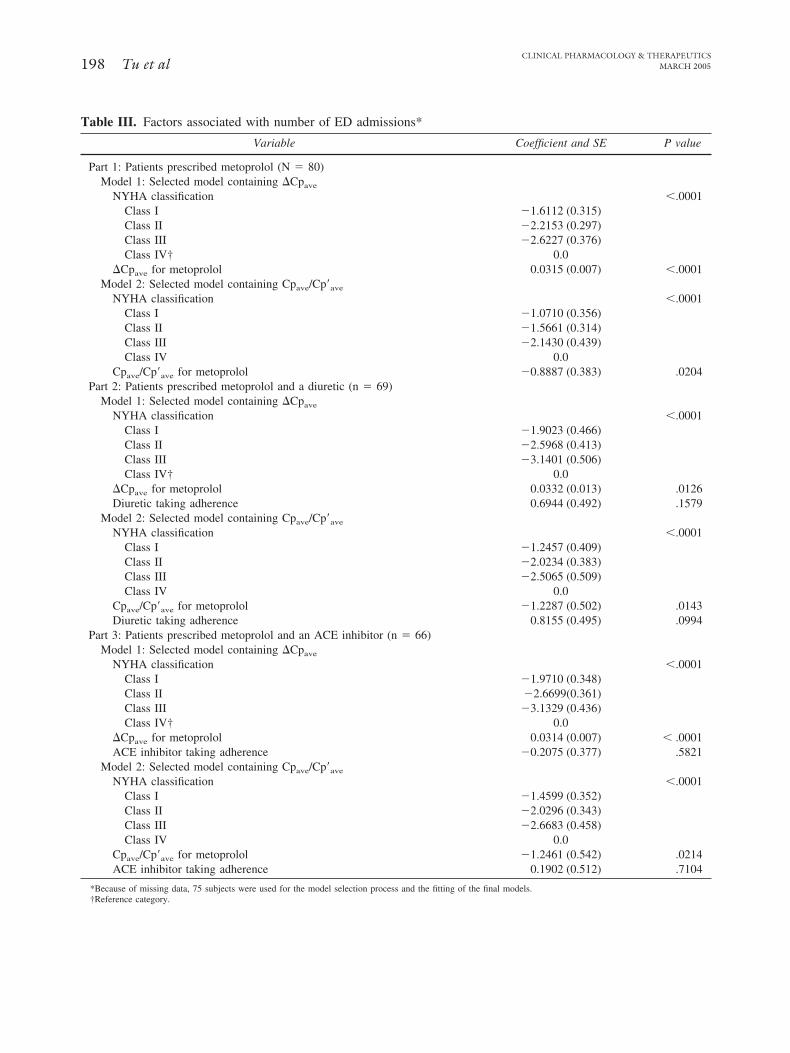
Factors significantly associated with hospital admis-ions and ED visits, as identified by the final models,ere tabulated in part 1 of Tables II and III, respec-
ively. For each of the outcome variables, we reportedfinal models, as follows: (1) a model selected from a
ool of candidate variables including �Cpave[i] and (2)model selected from a pool of candidate variables
ncluding Cpave[i]/Cp�ave[i]. The reported models werehosen through a formal stepwise model selection pro-edure, and the significant variables meeting the selec-ion criteria (P � .05) were included in the final mod-ls. The forward selection process yielded the sameodels.Without exception, a patient’s functional status and
harmacokinetic-based measures of metoprolol adher-nce were selected into the final models, suggestinghat both were strong correlates of health care utiliza-ion in these heart failure patients. Specifically, �Cpave
as significantly associated with the number of hospitaldmissions after we controlled for the effect of NYHAlassification. Exponentiating the coefficient estimatef �Cpave, we found the relative risk of hospitalizationssociated with a 1-unit increase in �Cpave to be 1.05.n other words, for each 1-ng/mL deviation from thentended exposure, there was a 5.0% increase in the riskf hospital admission (P � .0001). Similarly, increasedpave[i]/Cp�ave[i] (a greater proportional metoprolol ex-osure) was associated with a decreased number ofospital admissions (P � .0093). Not surprisingly,YHA functional classification was also found to be
ignificantly associated with the number of hospital t
dmissions; compared with patients with NYHA classV, patients with all other classes had fewer numbers ofospital admissions.For ED visits, �Cpave and Cpave[i]/Cp�ave[i] were
gain identified by model selection procedures as sig-ificant correlates of the number of ED visits, alongith NYHA classifications. The final models show thatreater metoprolol adherence (measured by �Cpave andpave[i]/Cp�ave[i]) was associated with a reduction in
he number of ED visits. Again, taking and schedulingdherence measures did not reach the level of signifi-ance to be selected into the final models.
In addition to the assessment of the effect of meto-rolol adherence, we also examined the adherence ef-ects of other cardiovascular drugs. Whereas adherenceffects of diuretics, ACE inhibitors, digoxin, and spi-onolactone were significant in univariate analyses (Ta-le I), none were strong enough to be selected into finalodels. Furthermore, adherence to these other drugsas not significant when we forced them into the finalodels (parts 2 and 3 in Tables II and III).
ISCUSSIONThe pharmacokinetic-based adherence measures
Cpave and Cpave[i]/Cp�ave[i] account for adherence tohe regimen and pharmacokinetic properties of meto-rolol. From the estimated plasma concentrationurves, it appeared that the proposed measures wereensitive to missing doses, as well as erratic drug ad-inistration. Significant associations between the pro-
osed measure and ED and hospital admissions indicateheir practical utility and validity.
An important feature of the proposed measures ishat they can be used in nonpharmacokinetic studieshere drug levels are not measured. They also offer theexibility to incorporate dose changes because equa-
ions 2 and 3 allow the dose d[i,j] to vary across theime points. This is a clinically important feature be-ause �-blockers such as metoprolol are usually titratedo patient response.
Unlike the taking and scheduling adherence com-uted by MEMS software, the pharmacokinetic mea-ures focus on drug exposure as opposed to the medi-ation use behaviors only. In doing so, they account foretoprolol’s kinetic characteristics, as well as the pa-
ient’s adherence behaviors. Furthermore, certain med-cations are less forgiving than others in terms of clin-cal outcomes from failure to take them.13 For thiseason, we contend that the average plasma concentra-ion of some cardiovascular medications may prove toe a more sensitive and objective assessment of true
herapeutic exposure received by patients.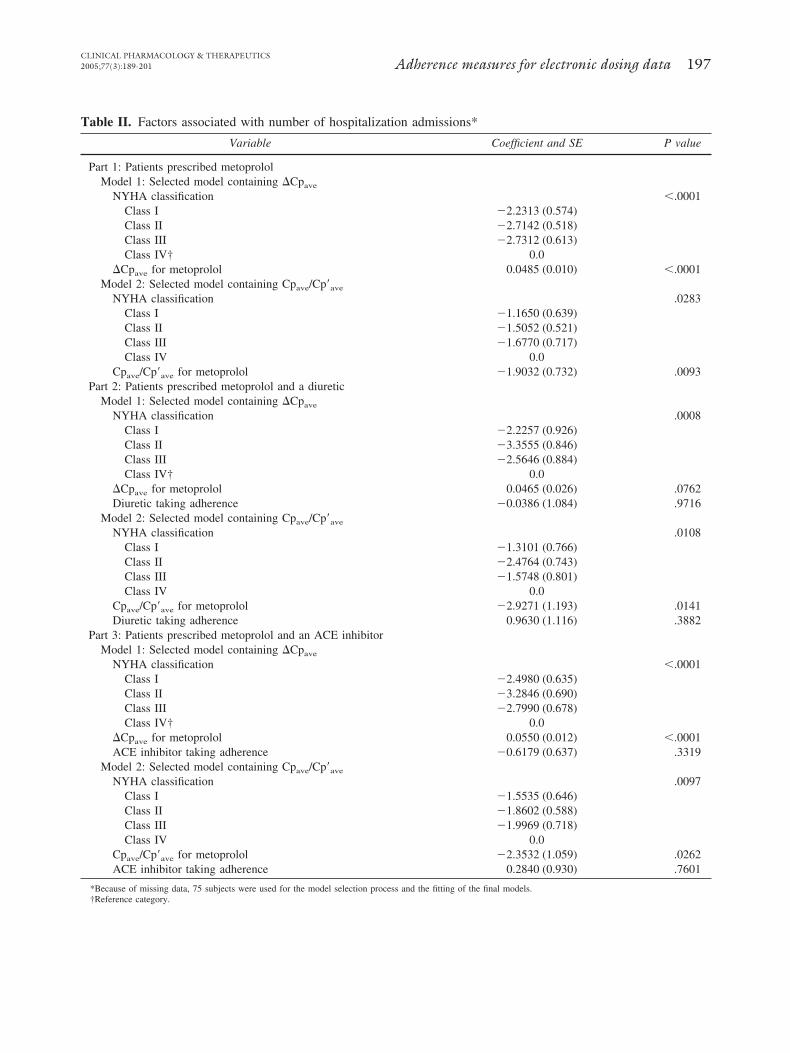
T
CLINICAL PHARMACOLOGY & THERAPEUTICS2005;77(3):189-201 Adherence measures for electronic dosing data 197
able II. Factors associated with number of hospitalization admissions*
Variable Coefficient and SE P value
Part 1: Patients prescribed metoprololModel 1: Selected model containing �Cpave
NYHA classification �.0001Class I �2.2313 (0.574)Class II �2.7142 (0.518)Class III �2.7312 (0.613)Class IV† 0.0
�Cpave for metoprolol 0.0485 (0.010) �.0001Model 2: Selected model containing Cpave/Cp�ave
NYHA classification .0283Class I �1.1650 (0.639)Class II �1.5052 (0.521)Class III �1.6770 (0.717)Class IV 0.0
Cpave/Cp�ave for metoprolol �1.9032 (0.732) .0093Part 2: Patients prescribed metoprolol and a diuretic
Model 1: Selected model containing �Cpave
NYHA classification .0008Class I �2.2257 (0.926)Class II �3.3555 (0.846)Class III �2.5646 (0.884)Class IV† 0.0
�Cpave for metoprolol 0.0465 (0.026) .0762Diuretic taking adherence �0.0386 (1.084) .9716
Model 2: Selected model containing Cpave/Cp�ave
NYHA classification .0108Class I �1.3101 (0.766)Class II �2.4764 (0.743)Class III �1.5748 (0.801)Class IV 0.0
Cpave/Cp�ave for metoprolol �2.9271 (1.193) .0141Diuretic taking adherence 0.9630 (1.116) .3882
Part 3: Patients prescribed metoprolol and an ACE inhibitorModel 1: Selected model containing �Cpave
NYHA classification �.0001Class I �2.4980 (0.635)Class II �3.2846 (0.690)Class III �2.7990 (0.678)Class IV† 0.0
�Cpave for metoprolol 0.0550 (0.012) �.0001ACE inhibitor taking adherence �0.6179 (0.637) .3319
Model 2: Selected model containing Cpave/Cp�ave
NYHA classification .0097Class I �1.5535 (0.646)Class II �1.8602 (0.588)Class III �1.9969 (0.718)Class IV 0.0
Cpave/Cp�ave for metoprolol �2.3532 (1.059) .0262ACE inhibitor taking adherence 0.2840 (0.930) .7601
*Because of missing data, 75 subjects were used for the model selection process and the fitting of the final models.†Reference category.
T
CLINICAL PHARMACOLOGY & THERAPEUTICS198 Tu et al MARCH 2005
able III. Factors associated with number of ED admissions*
Variable Coefficient and SE P value
Part 1: Patients prescribed metoprolol (N � 80)Model 1: Selected model containing �Cpave
NYHA classification �.0001Class I �1.6112 (0.315)Class II �2.2153 (0.297)Class III �2.6227 (0.376)Class IV† 0.0
�Cpave for metoprolol 0.0315 (0.007) �.0001Model 2: Selected model containing Cpave/Cp�ave
NYHA classification �.0001Class I �1.0710 (0.356)Class II �1.5661 (0.314)Class III �2.1430 (0.439)Class IV 0.0
Cpave/Cp�ave for metoprolol �0.8887 (0.383) .0204Part 2: Patients prescribed metoprolol and a diuretic (n � 69)
Model 1: Selected model containing �Cpave
NYHA classification �.0001Class I �1.9023 (0.466)Class II �2.5968 (0.413)Class III �3.1401 (0.506)Class IV† 0.0
�Cpave for metoprolol 0.0332 (0.013) .0126Diuretic taking adherence 0.6944 (0.492) .1579
Model 2: Selected model containing Cpave/Cp�ave
NYHA classification �.0001Class I �1.2457 (0.409)Class II �2.0234 (0.383)Class III �2.5065 (0.509)Class IV 0.0
Cpave/Cp�ave for metoprolol �1.2287 (0.502) .0143Diuretic taking adherence 0.8155 (0.495) .0994
Part 3: Patients prescribed metoprolol and an ACE inhibitor (n � 66)Model 1: Selected model containing �Cpave
NYHA classification �.0001Class I �1.9710 (0.348)Class II �2.6699(0.361)Class III �3.1329 (0.436)Class IV† 0.0
�Cpave for metoprolol 0.0314 (0.007) � .0001ACE inhibitor taking adherence �0.2075 (0.377) .5821
Model 2: Selected model containing Cpave/Cp�ave
NYHA classification �.0001Class I �1.4599 (0.352)Class II �2.0296 (0.343)Class III �2.6683 (0.458)Class IV 0.0
Cpave/Cp�ave for metoprolol �1.2461 (0.542) .0214ACE inhibitor taking adherence 0.1902 (0.512) .7104
*Because of missing data, 75 subjects were used for the model selection process and the fitting of the final models.†Reference category.
psaf�dsldvp“�essfdotdp
�wnflihop6ifttppb
(eewishiCcT
ol
CmdrbCsemraTamid
dcspiehpac(woawdcps
semoavoacml
CLINICAL PHARMACOLOGY & THERAPEUTICS2005;77(3):189-201 Adherence measures for electronic dosing data 199
Both �Cpave and Cpave[i]/Cp�ave[i] for metoprolol inatients with CHF were associated with hospital admis-ions and ED visits. Empiric evidence suggests thatssociations with utilization were stronger than thoseor taking or scheduling adherence. In 2 ways,Cpave[i] and Cpave[i]/Cp�ave[i] measure the estimatedrug exposure by comparing it with the intended expo-ure. When there is a large deviation from the intendedevel (ie, larger �Cpave[i] or smaller Cpave[i]/Cp�ave[i]),isease exacerbation occurs and may result in an EDisit or hospital admission. From a clinical perspective,oor adherence in the long run and occasional drugholidays” are harmful behaviors.20,28,29 Because bothCpave[i] and Cpave[i]/Cp�ave[i] are calculated for anxtended period of time, they are likely to be moreensitive to long-term poor adherence than to occa-ional drug “holidays.” Both measures can be modifiedor the examination of adherence in shorter time win-ows. Short-term adherence may then be linked toutcomes such as heart rate or blood pressure to explorehe health effects of drug “holidays.” Unfortunately, weid not have frequently measured heart rates or bloodressure.Our data show that the proposed adherence measure
Cpave was associated with the hospital and ED visitshereas intended metoprolol concentration (Cp�) wasot. Intended drug concentration does not always re-ect the patient’s drug-taking behavior. A patient’s
ntended metoprolol concentration assumes 100% ad-erence. However, perfect adherence often does notccur in the clinical setting. In our study sample of 80atients, the mean taking adherence of metoprolol was3% and the scheduling adherence was 33%, suggest-ng a considerable lack of adherence. When a patientails to take the prescribed medication appropriately,he intended drug concentration (Cp�) remains simply aarget therapeutic level under perfect adherence to thehysician’s prescription. It often does not represent theatient’s true drug exposure and, as such, will not likelye associated with the patient’s health outcomes.In contrast, the deviation from the intended exposure
�Cpave) incorporates the patient’s medication adher-nce. Greater values of �Cpave indicate poorer adher-nce. Our data suggested that �Cpave correlated wellith other established adherence measures such as tak-
ng and scheduling adherence. As an adherence mea-ure, �Cpave for metoprolol is a strong correlate ofealth care utilization in older heart failure patients. Yett would be reasonable to expect an association betweenp� and health outcomes in situations where there is alear dose-response relationship and adherence is good.
herefore the effect of Cp� is likely to vary depending pn the specific drug, the outcome considered, and theevel of adherence.
As adherence measures, �Cpave[i] and Cpave[i]/p�ave[i] differed. �Cpave[i] was an estimate of theagnitude of a patient’s deviation from the intended
rug exposure, whereas Cpave[i]/Cp�ave[i] estimated theelative level of the intended drug exposure that hadeen achieved by patients. The correlation betweenpave[i]/Cp�ave[i] and taking adherence was much
tronger than that between �Cpave[i] and taking adher-nce. In addition, the range of Cpave[i]/Cp�ave[i] re-ained relatively stable at all dose levels, whereas the
ange of �Cpave[i] tended to vary across the doses,lthough not in a monotonic fashion (Fig 2, b and c).herefore we believe that �Cpave[i] might be moreppropriate when dose variation is more limited. Ulti-ately, the choice of an appropriate adherence measure
s likely to depend on the objective of the study and therug under investigation.Although it is not the focus of the current report, our
ata clearly show independent adherence effects ofoncomitant diuretics, ACE inhibitors, digoxin, andpironolactone among patients who were taking meto-rolol. The lack of inclusion of these concomitant drugsn the final models was likely a result of their weakerffects compared with those of the metoprolol ad-erence measures. Correlations between the 2harmacokinetic-based metoprolol adherence measuresnd the taking and scheduling adherence of other con-omitant cardiovascular drugs were relatively strongcorrelation coefficients between 0.33 and 0.51); thus,hen �Cpave or Cpave[i]/Cp�ave[i] was in the model, thether drug effects were unlikely to be significant. Welso noted that our sample represented patients whoere prescribed metoprolol. The effects of other car-iovascular drugs in this group may not be directlyomparable to the effects of the same drugs in a generalatient population, in which patients may not be pre-cribed metoprolol.
The proposed pharmacokinetic-based measures haveeveral limitations. First, as with other MEMS adher-nce measures, they assume that the correct dose ofedication was consumed when the MEMS lid was
pened. However, unlike MEMS taking and schedulingdherence, they account for the dosage and thus pro-ide more flexibility in handling dosage changes. Sec-nd, the proposed measures rely on several additionalssumptions, including the correctness of the pharma-okinetic model and the appropriateness of the phar-acokinetic parameters for a specific patient popu-
ation. Although we did not have individual
harmacokinetic data in this study, it would be inter-
eowiplsc�csiedampetabm
�Akuptmttbcpsiwpcsm
tpcbh
ct
i
R
1
1
1
1
1
1
CLINICAL PHARMACOLOGY & THERAPEUTICS200 Tu et al MARCH 2005
sting to assess the performance of this method by usef individual pharmacokinetic models. Given the recentork by Vrijens and Goetghebeur14,15 showing the
mportance of dosing history data in the estimation ofharmacokinetic and pharmacodynamic models, we be-ieve that the explanatory power of the proposed mea-ures would increase significantly where plasma con-entrations are available. Third, we recognize that bothCpave[i] and Cpave[i]/Cp�ave[i] are pharmacodynami-ally naive measures. Published findings on metoprololuggested that after the drug is stopped a reboundncrease in cardiac sensitivity to endogenous cat-cholamines was likely to ensue in the following 2 to 7ays.29 Short of a full pharmacodynamic analysis, were investigating the relationship between the proposedeasures in shorter time windows (in which drug ex-
osure could be low) and clinical outcomes in thensuing 7-day periods. Finally, the iterative computa-ion of the proposed measures makes them more suit-ble for clinical investigations involving a small num-er of drugs as opposed to a general-purpose adherenceeasure for clinical practice.As proposed measures, many important aspects of
Cpave[i] and Cpave[i]/Cp�ave[i] remain to be studied.s mentioned previously, subject-specific pharmaco-inetic models with individual dosing logs could besed to further improve the predictive power ofharmacokinetic-based adherence measures. Givenhe recent development in pharmacokinetic and phar-acodynamic models based on dosing history da-
a,14,15 it would be of interest to compare the predic-ive powers of population-based and individual-ased pharmacokinetic adherence measures. Such aomparative study is also likely to provide someractical guidance on the balance between the mea-ures’ predictive power and their general applicabil-ty. Another important aspect is the measures’ utilityith regard to other cardiovascular medications, es-ecially those drugs with longer half-lives. We areurrently studying this approach in patients pre-cribed carvedilol, a 3-compartment drug with auch longer half-life than metoprolol.Notwithstanding these limitations, we conclude
hat by incorporating adherence and pharmacokineticarameters the described adherence measures couldontribute to our understanding of the relationshipsetween medication adherence of metoprolol andealth care utilization in heart failure patients.
We thank the Editor and 4 reviewers for their many constructiveomments. We also thank Dr Song Mu for useful discussion during
he preparation of this report.None of the authors has professional or financial conflicts ofnterest.
eferences1. Eraker SA, Kirscht JP, Becker MH. Understanding and
improving patient compliance. Ann Intern Med 1984;100:258-68.
2. Finnerty FA Jr, Shaw LW, Himmelsbach CK. Hyperten-sion in the inner city. II. Detection and follow-up. Cir-culation 1973;47:76-8.
3. Sackett DL, Haynes RB, Gibson ES, Hackett BC, TaylorDW, Roberts RS, et al. Randomised clinical trial ofstrategies for improving medication compliance in pri-mary hypertension. Lancet 1975;1:1205-7.
4. Eisen SA, Miller DK, Woodward RS, Spitznagel E, Pr-zybeck TR. The effect of prescribed daily dose frequencyon patient medication compliance. Arch Intern Med1990;150:1881-4.
5. Monane M, Bohn RL, Gurwitz JH, Glynn RJ, Avorn J.Noncompliance with congestive heart failure therapy inthe elderly. Arch Intern Med 1994;154:433-7.
6. Ghali JK, Kadakia S, Cooper R, Ferlinz J. Precipitatingfactors leading to decompensation of heart failure. Traitsamong urban blacks. Arch Intern Med 1988;148:2013-6.
7. Urquhart J. The electronic medication event monitor.Lessons for pharmacotherapy. Clin Pharmacokinet 1997;32:345-56.
8. Eisen SA, Woodward RS, Miller D, Spitznagel E,Windham CA. The effect of medication compliance onthe control of hypertension. J Gen Intern Med 1987;2:298-305.
9. Kruse W, Nikolaus T, Rampmaier J, Weber E, SchlierfG. Actual versus prescribed timing of lovastatin dosesassessed by electronic compliance monitoring. Eur J ClinPharmacol 1993;45:211-5.
0. Rudd P, Ahmed S, Zachary V, Barton C, Bonduelle D.Improved compliance measures: applications in an am-bulatory hypertensive drug trial. Clin Pharmacol Ther1990;48:676-85.
1. Choo PW, Rand CS, Inui TS, Lee MT, Canning C, PlattR. Derivation of adherence metrics from electronic dos-ing records. J Clin Epidemiol 2001;54:619-26.
2. Rubio A, Cox C, Weintraub M. Prediction of diltiazemplasma concentration curves from limited measurementsusing compliance data. Clin Pharmacokinet 1992;22:238-46.
3. Urquhart J. Patient non-compliance with drug regimens:measurement, clinical correlates, economic impact. EurHeart J 1996;17(Suppl A):8-15.
4. Vrijens B, Goetghebeur E. The impact of compliance inPK studies. Stat Methods Med Res 1999;8:247-62.
5. Vrijens B, Goetghebeur E. Electronic monitoring of vari-ation in drug intakes can reduce bias and improve preci-sion in pharmacokinetic/pharmacodynamic population
studies. Stat Med 2004;23:531-44.
1
1
1
1
2
2
2
2
2
2
2
2
2
2
A
attta
d�
mdtp
wa
alt3
wm
ptdcf
wrtssi
CLINICAL PHARMACOLOGY & THERAPEUTICS2005;77(3):189-201 Adherence measures for electronic dosing data 201
6. Murray MD, Young JM, Morrow DG, Weiner M, Tu W,Hoke SC, et al. Methodology of an ongoing randomized,controlled trial to improve drug use for elderly patientswith chronic heart failure. Am J Geriatr Pharmacother2004;2:53-65.
7. AARDEX Ltd Web site. Available from: URL: http://www.aardex.net/ or http://www.aardex.ch/. Accessed onMarch 30, 2004.
8. Choo PW, Rand CS, Inui TS, Lee ML, Cain E, Cordeiro-Breault M, et al. Validation of patient reports, automatedpharmacy records, and pill counts with electronic moni-toring of adherence to antihypertensive therapy. MedCare 1999;37:846-57.
9. Gibaldi M, Perrier D. Pharmacokinetics. 2nd ed. NewYork: Marcel Dekker; 1982.
0. Shibata MC, Flather MD, Wang D. Systematic review ofthe impact of beta blockers on mortality and hospitaladmissions in heart failure. Eur J Heart Fail 2001;3:351-7.
1. Psaty BM, Koepsell TD, Wagner EH, LoGerfo JP, InuiTS. The relative risk of incident coronary heart diseaseassociated with recently stopping the use of beta-blockers. JAMA 1990;263:1653-7.
2. AHFS drug information. Bethesda (MD): American So-ciety of Health-System Pharmacists, Inc; 2001.
3. Cerqueira PM, Cesarino EJ, Mateus FH, Mere Y Jr,Santos SR, Lanchote VL. Enantioselectivity in thesteady-state pharmacokinetics of metoprolol in hyperten-sive patients. Chirality 1999;11:591-7.
4. McDonald CJ, Overhage JM, Tierney WM, Dexter PR,Martin DK, Suico JG, et al. The Regenstrief MedicalRecord System: a quarter century experience. Int J MedInf 1999;54:225-53.
5. Murray MD, Smith FE, Fox J, Teal EY, Kesterson JG,Stiffler TA, et al. Structure, functions, and activities of aresearch support informatics section. J Am Med InformAssoc 2003;10:389-98.
6. Le CT. Introductory biostatistics. New York: John Wiley& Sons; 2003.
7. SAS/STAT user’s guide. 8th ed. Cary (NC): SAS Insti-tute, Inc; 2004.
8. Rangno RE, Langlois S, Lutterodt A. Metoprolol with-drawal phenomena: mechanism and prevention. ClinPharmacol Ther 1982;31:8-15.
9. Rangno RE, Langlois S. Comparison of withdrawal phe-nomena after propranolol, metoprolol and pindolol. Br JClin Pharmacol 1982;13(Suppl 2):345S–51S.
PPENDIX
To demonstrate the use of the iterative computationallgorithm, we derived the metoprolol plasma concen-ration formulas at times t0 � 0, t1 � 1.0, t2 � 1.2, and
3 � 2.0 hours in an iterative fashion under the assump-ion that a patient took the medication at time t0 � 0
nd t2 � 1.2 at a constant dose amount d. mAt time t0 � 0, the patient took the medication atose d, so d[i,0] � d and the cumulative dose D[i,0]
d[i,0] � d. From equation 1, we have Cp[i,0] � 0.At time t1 � 1.0, the patient did not take theedication, so d[i,1] � 0. From equation 2, we
erived the cumulative dose D[i,1] � d · exp(�ka) athis time, and from equation 3, we calculated thelasma concentration as follows:
Cp[i,1] �F · d · ka
V[i](ka � ke)[exp(�ke) � exp(�ka)]
hich followed the standard 1-compartment model ex-ctly.
Similarly, at time t2 � 1.2, because the subject tooknother dose of the medication, d[i,2] � d. The cumu-ative dose at this time point was calculated from equa-ion 2 as D[i,2] � d · exp(�1.2ka) d. From equation, we calculated the plasma concentration as follows:
Cp[i,2] �F · d · ka
V[i](ka � ke)[exp(�ke) � exp(�ka)] · exp(�0.2ke)
�F · d exp(�ka) · ka
V[i](ka � ke)[exp(�0.2ke) � exp(�0.2ka)]
�F · d · ka
V[i](ka � ke)[exp(�1.2ke) � exp(�1.2ka)]
hich again followed the standard 1-compartmentodel.At time t3 � 2.0, we had d[i,3] � 0 because the
atient did not take the medication at this time point;he cumulative dose was as follows: D[i,3] �· [exp(�2ka) exp(�0.8ka)]. From equation 3, we
alculated the plasma concentration at this time point asollows:
Cp[i,3] �F · d · ka
V[i](ka � ke)[exp(�1.2ke) � exp(�1.2ka)]
· exp(�0.8ke) �F · d · (exp(�1.2ka) � 1) · ka
V[i](ka � ke)[exp(�0.8ke)
� exp(�0.8ka)] �F · d · ka
V[i](ka � ke)[exp(�2.0ke)
� exp(�2.0ka)] �F · d · ka
V[i](ka � ke)[exp(�0.8ke)
� exp(�0.8ka)]
here the first term in the above-described expressionepresented the portion of plasma concentration con-ributed by the first dosing event at time t0 � 0 and theecond term represented the portion contributed by theecond dosing event at t2 � 1.2. This showed how theterative algorithm was able to accommodate the cu-
ulative drug effect in multiple dose regimens.