Embed Size (px)
Citation preview

RESEARCH ARTICLE Open Access
Association between rural-to-urbanmigrants’ social medical insurance, socialintegration and their medical return inChina: a nationally representative cross-sectional data analysisBo-li Peng1,2 and Li Ling1,2*
Abstract
Background: Without social medical insurance in the destination areas and with low social integration, rural-to-urban migrants had barriers to health service in the destination areas, some of the migrants had to seek healthservice in hometown, namely medical return. This study aimed at exploring the association between rural-to-urbanmigrants’ medical return and social medical insurance type or social integration.
Methods: We analysed a secondary cross-sectional data of the 2014 National Internal Migrant Dynamic MonitoringSurvey collected in May of 2014 from all provinces or regions in mainland China. The medical return was measuredby the location of hospitalisation, and the social integration included economic integration and permanentsettlement intention.
Results: Four thousand eighteen rural-to-urban migrants living in current residence at least one year and used inpatientservice within the last 12months were analysed. The rate of medical return for inpatient service was 15.3%. Havingmedical insurance of hometown (new rural cooperative medical scheme (NRCMS)) (OR = 2.44, 95%CIs 1.80–3.30) waspositively related to the medical return. The permanent settlement intention was negatively associated with the medicalreturn (OR = 0.66, 95%CIs 0.48–0.90).
Conclusions: Social medical insurance of hometown (NRCMS) was positively associated with the medical return, whilethe permanent settlement intention was negatively associated with it. Promoting the transfer of migrants’ social medicalinsurance across different regions might be helpful to improve rural-to-urban migrants’ health access.
Keywords: Migration, Medical return, Social medical insurance, Social integration, China
BackgroundWith the rapid economic development of the metropolisin China, the population of internal migrants has in-creased to 247 million in 2015, which accounted for 18%of the total population of China [1]. Internal migrants,including rural-to-urban migrants, were population liv-ing in their current residence over six months without a
permanent/officially registered residence (hukou) ofthere [1]. The hukou system divided people into ruraland urban residence. The rural-to-urban migrantsaccounted for 3/4 of the internal migrants in 2014 [2].Lacking hukou in the destination areas, rural-to-urbanmigrants always have limited access to a range of socialwelfare provided by the local government, includinghousing, stable working, public health care services, andsocial medical insurance (SMI) [3–6].The SMI system in China included the new rural co-
operative medical scheme (NRCMS), urban resident-based basic medical insurance (URBMI) and urban
* Correspondence: [email protected] of Medical Statistics and Epidemiology, School of Public Health, SunYat-sen University, Guangzhou, China2Center for Migrant Health Policy, Sun Yat-sen University, Guangzhou, China
© The Author(s). 2019 Open Access This article is distributed under the terms of the Creative Commons Attribution 4.0International License (http://creativecommons.org/licenses/by/4.0/), which permits unrestricted use, distribution, andreproduction in any medium, provided you give appropriate credit to the original author(s) and the source, provide a link tothe Creative Commons license, and indicate if changes were made. The Creative Commons Public Domain Dedication waiver(http://creativecommons.org/publicdomain/zero/1.0/) applies to the data made available in this article, unless otherwise stated.
Peng and Ling BMC Public Health (2019) 19:86 https://doi.org/10.1186/s12889-019-6416-y
employee-based basic medical insurance (UEBMI).URBMI was legal to internal migrants in few cities, 5.2%of migrants were enrolled in the URBMI of destinationareas in 2014 [2]. Funded by employers and employees,UEBMI was friendly to the rural-to-urban migrants. In2014, 23.6% of internal migrants were enrolled in theUEBMI of destination areas [2]. Most rural-to-urban mi-grants were enrolled in the NRCMS of hometown in2014. Since the SMI was administrated by the local gov-ernment, rural-to-urban migrants had much difficulty intransferring their SMI between different areas [7], thussuffered barriers in the reimbursement of their medicalbill in destination areas in 2014. Even for the few citieswhich accepted the destination areas’ medical bill,rural-to-urban migrants always could receive low reim-bursement; and the process was inconvenient and un-pleasant [8]. Few cities (Shanghai, Chengdu, Shenzhen,Chongqing, etc.) had tried some special medical insur-ance for the rural-to-urban migrants from 2002, but theeffect is limited. Most of these cities had terminatedtheir special medical insurance before 2014 and contin-ued to rely on the SMI system [2]. In other words, theserural-to-urban migrants enrolled in SMI of hometownalways have to return for medical care to receive full re-imbursement [7]. Someone has found that rural-to-ur-ban migrants enrolled in UEBMI or URBMI were morelikely to use inpatient services in their current residencecompared with those enrolled in NRCMS of hometown[9].Previous studies on rural-to-urban migrants’ returning
home for health care had found that about 37.2% of 188hospitalised migrants had returned (medical return)[10]. The main reasons for their medical return includedthe lower reimbursement for the medical cost in thehost city, followed by high medical expenditure, andhaving nobody to take care of themselves [10].Similar to rural-to-urban migrants, the medical return
was also reported among international immigrant. Previ-ous studies found that many Mexican immigrants livingwithin 100 km of the U.S.-Mexico border had a medicalreturn [11–13], as well as those living far away from theborder [14]. The reasons for their medical return focusedon the cost, medical insurance coverage, access, perceivedmedical quality, social integration, and preference onhealth service style [13–20]. Among these factors, medicalinsurance coverage and social integration were the mostimportant factors. The social integration refers to theprocess of adapting to a new social environment [21].Most studies showed a negative association between med-ical return and medical insurance coverage [13, 15, 16, 22,23], social integration [24] and certain indicator of socialintegration, including language proficiency [15] and accul-turation (measured by generation status) [25]. However,one study found no statistical significance between
medical insurance coverage and medical return amongKorean-U.S. immigrants. The explanation was that costsand social integration were more effective factors on med-ical return, and limited coverage of U.S. insurance ontreatment would also push the immigrants away [26]. Cor-respondingly, many qualitative studies found that themaintenance of international immigrants’ original culture(another dimension of social integration [27]) would at-tract immigrants to return to seek health care. The rea-sons were as follows: feeling cultural comfort in homeland[15, 17, 18, 23], preferring the medical style of homeland[19], and having social connections [20] or social ties withhomeland [23, 26].Similarly, as the diversity of economic development
across the rural and urban areas, rural-to-urban migrantsin China also experience various level of social integration,including economic integration, cultural, social adapta-tion, social structural integration, and self-identity [28].The economic integration was the fundamental of the so-cial integration, which could be measured by employmentstatus, household income, and housing. The self-identitywas the final goal of social integration, which included thepermanent settlement intention [27–29].There has been plenty of research on international im-
migrants’ medical return, but rural-to-urban migrants’medical return remains under-researched, and we haveinsufficient knowledge on the association betweenrural-to-urban migrants’ medical return and SMI or so-cial integration. Although medical return could improvemigrants’ access to health service, it also makes the ser-vice inconvenient and discontinuous. In this study, weapplied the popular model of Anderson’s health behav-iour model [30, 31] to analyse potential factors associ-ated with the medical return, which was determined bythe access to health service in different areas. Influen-cing factors in the model were divided into three cat-egories, namely predisposing characteristics, enablingresources, and needs [31]. Some indexes of the three di-mensions were also covered by the social integration.For instance, the enabling resources refer to the financialand social resources in hometown or destination areas,such as SMI and household income [20, 31], which alsobelong to the economic integration.Based on the Chinese SMI system and previous studies
on international immigrants’ medical return, we testedtwo hypotheses. (1) Rural-to-urban migrants enrolled inNRCMS would need to return in order to get full reim-bursement, and thus would more likely to return for in-patient service compared with those enrolled in UEBMIor URBMI of current residence. (2)High social integra-tion would be associated with good access to the socialresource in current residence and being satisfied withthe destination areas, and thus would attract migrants touse inpatient service at current residence.
Peng and Ling BMC Public Health (2019) 19:86 Page 2 of 16
Hence, we used data from the National Internal Mi-grant Dynamic Monitoring Survey (NIMDMS) in 2014to assess the medical return (for inpatient service) ofrural-to-urban migrants and to explore the associationbetween the migrants’ medical return and their SMI typeor social integration.
MethodsData resourceThis study performed a secondary analysis of the publicaccess dataset NIMDMS [32], which was funded andorganised by the National Population and Family PlanningCommission of the People’s Republic of China (NPFPC)every year since 2009. The data in 2014 was selected be-cause it was the latest NIMDMS collecting informationon inpatient service utilisation of internal migrants, andinformation on the migrants’ social-demographic charac-teristics, social integration, and SMI status.The NIMDMS data of 2014 planned a nationally rep-
resentative sampling of 201,000 internal migrants. Thesampling was recruited from all 32 provinces and pro-vincial regions in mainland China by a stratified,multi-stage, probability proportionate to size samplingmethod (PPS) in May of 2014. Details of the sampling
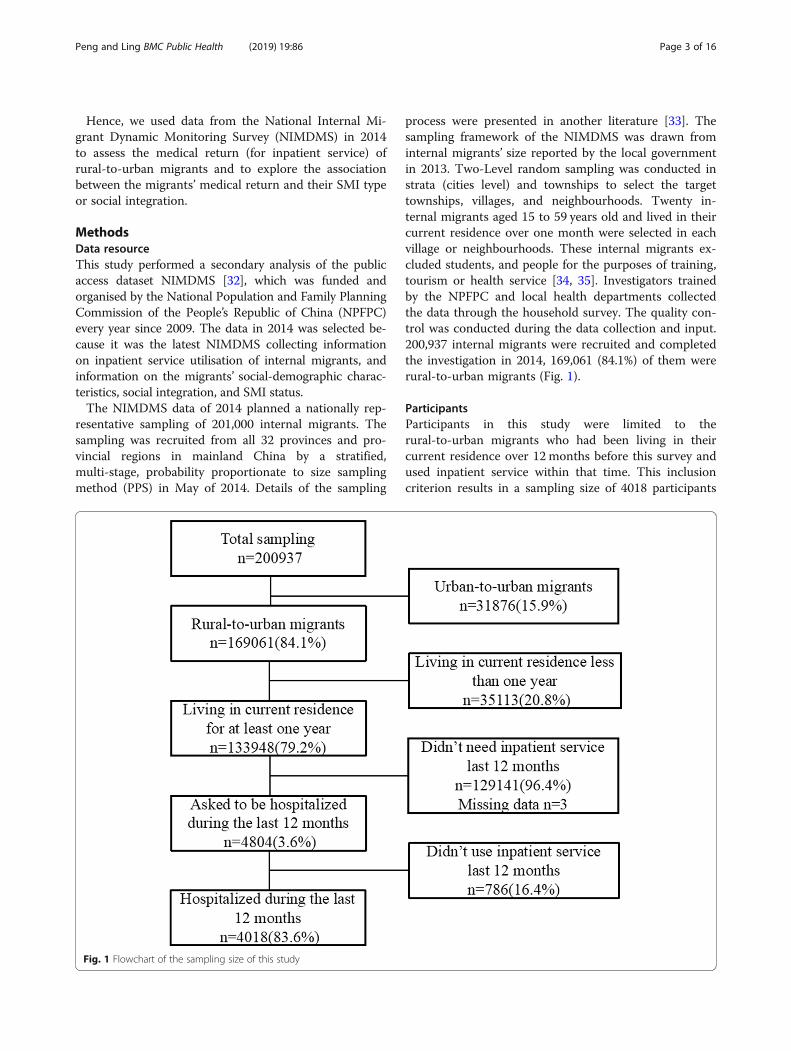
process were presented in another literature [33]. Thesampling framework of the NIMDMS was drawn frominternal migrants’ size reported by the local governmentin 2013. Two-Level random sampling was conducted instrata (cities level) and townships to select the targettownships, villages, and neighbourhoods. Twenty in-ternal migrants aged 15 to 59 years old and lived in theircurrent residence over one month were selected in eachvillage or neighbourhoods. These internal migrants ex-cluded students, and people for the purposes of training,tourism or health service [34, 35]. Investigators trainedby the NPFPC and local health departments collectedthe data through the household survey. The quality con-trol was conducted during the data collection and input.200,937 internal migrants were recruited and completedthe investigation in 2014, 169,061 (84.1%) of them wererural-to-urban migrants (Fig. 1).
ParticipantsParticipants in this study were limited to therural-to-urban migrants who had been living in theircurrent residence over 12 months before this survey andused inpatient service within that time. This inclusioncriterion results in a sampling size of 4018 participants
Fig. 1 Flowchart of the sampling size of this study
Peng and Ling BMC Public Health (2019) 19:86 Page 3 of 16

(Fig. 1). Rural-to-urban migrants were selected becausethey were the disadvantage but main subgroup of in-ternal migrants. Additionally, the location of URBMIand UEBMI of urban-to-urban migrants could not bedistinguished because of lacking this information in theNIMDMS. Besides, we only chose migrants living intheir current residence for at least one year to excludethose migrants who used inpatient service in theirhometown before their migration.
VariablesDependent variableMedical return (measured by the location ofhospitalisation).The location of hospitalisation was categorised into
current resident (=1), hometown (=2), and other places(=3); according to a self-reported question: where didyou choose to be hospitalised last time during the lastyear? Medical return refers to the hospitalisation inhometown.
Independent variables
Social medical insurance We collected the informationon rural-to-urban migrants’ SMI status by asking themwhether they were enrolled in NRCMS, URBMI, orUEBMI. Since the three types of SMI were administratedindependently across rural and urban areas,rural-to-urban migrants could be enrolled in bothNRCMS and URBMI or UEBMI. Hence, we divided theSMI status of rural-to-urban migrants into fourcategories:
1) Uninsured. Haven’t been enrolled in any SMI;2) NRCMS of hometown. Rural-to-urban migrants
were eligible to NRCMS of their hometown;3) URBMI/ UEBMI of current residence. URBMI or
UEBMI were eligible to rural-to-urban migrants insome destination areas;
4) Doubly insured. Migrants enrolled in both NRCMSand URBMI or UEBMI
Social integration Referred to Zhou’s research onrural-to-urban migrants’ social integration [28], social in-tegration can be divided into five dimensions, related toeconomic, cultural, society, structure, and self-identity.The social integration in this study was mainly drawnfrom the economic integration and self-identity. Theeconomic integration act as the fundamental dimensionof social integration and was measured by variables in-cluding employment status (0 = unemployed, 1 =employed), household income per member monthly (acontinuous variable), and housing occupancy (1 =owned, 2 = rented, 3 = temporary shelter).
The permanent settlement intention, a critical index ofself-identity, was measured by the willingness of stayingin current cities in the future five years (0 = No, 1 = Un-known, 2 = Yes).
Confounding factorsThe potential confounding factors were drawn fromAnderson’s health behaviours model [30, 31]. The enab-ling resources were involved in the independent vari-ables mentioned above.Related to the predisposing factors, it contains:
1) Social-demographic characteristics: age groups,gender, ethnic group (1 =Han nationality, 2 =Minority ethnic), education level, marital status,and household size (1 = living alone, 2 = living withone family member (91.2% = 496/544 of them wasspouse), 3 = living with two family members, 4 =living with three or more family members) incurrent residence; economic development ofcurrent residence (categorised into three levelsaccording to the rank of consumption level perresident, 1 = developed province, 2 = developingprovince, 3 = under-developed provinces. Datasource: China Statistic Yearbook 2015 Table 3–20at http://www.stats.gov.cn/tjsj/ndsj/2015/indexch.htm).
2) Migration characteristics: migration type (migratedfrom other 1 = provinces, 2 = cities, and 3 =districts), the reason for migration (migrated forworking or engaging in trade = 1, family reasons/visit relatives = 2, marriage = 3, other reasons = 4),and duration of staying in current residence (acontinuous variable).
Needs were measured by a self-related question: whydid you use inpatient service last time (1 = disease, 2 =injury or poisoned, 3 = delivery, 4 = other reasons).
Data analysisWe used IBM SPSS (IBM crop, version 20.0) to conductthe data analysis. First, we described the rural-to-urbanmigrants’ demographic characteristics, medical return,social integration, and SMI status by the frequency dis-tributions and percentages, means and standard devia-tions (SD). Second, we performed a chi-square test toanalyse the relationships between medical return and theindependent variables. Third, we carried out the multi-variable multinomial logistic regression and stratifiedanalysis to explore the association between medical re-turn and SMI or social integration in the totalrural-to-urban migrants and in different subgroups. Var-iables in the regressions were selected by the stepwisemethod under the threshold of P < 0.1. The unadjusted
Peng and Ling BMC Public Health (2019) 19:86 Page 4 of 16
odds ratio (UOR), adjusted odds ratio (AOR), and 95%confidence intervals (CIs) were used to assess the associ-ation between medical return and independent variables.A two-side of P value less than 0.05 was considered sta-tistically significant.
ResultsParticipants’ demographic characteristicsThere were 4804 rural-to-urban migrants, 3.6% (=4804/133948) of the total rural-to-urban migrants, were askedto be hospitalised during the last 12 months before thesurvey. Among them, 4018 (83.6%) rural-to-urban mi-grants had used inpatient service (Fig. 1).Table 1 showed the demographic characteristics of
these rural-to-urban migrants. Most of them were fe-male (2914, 72.5%), in the age group of 25 to 34 years(1964, 48.9%), married (3834, 95.4%), Han nationality(3616, 90.0%), living with two family members in currentresidence (1707, 42.5%), and haven’t reached the educa-tion level of high school (2760, 68.7%).In addition, most of these hospitalised migrants came
from another province (1911, 47.6%), migrated for work-ing or engaging in trade (2976, 74.1%), and lived in eco-nomically developed provinces of China (1734, 43.2%).These migrants stayed in their current residence for5.4(SD = 4.7) years (Table 1).
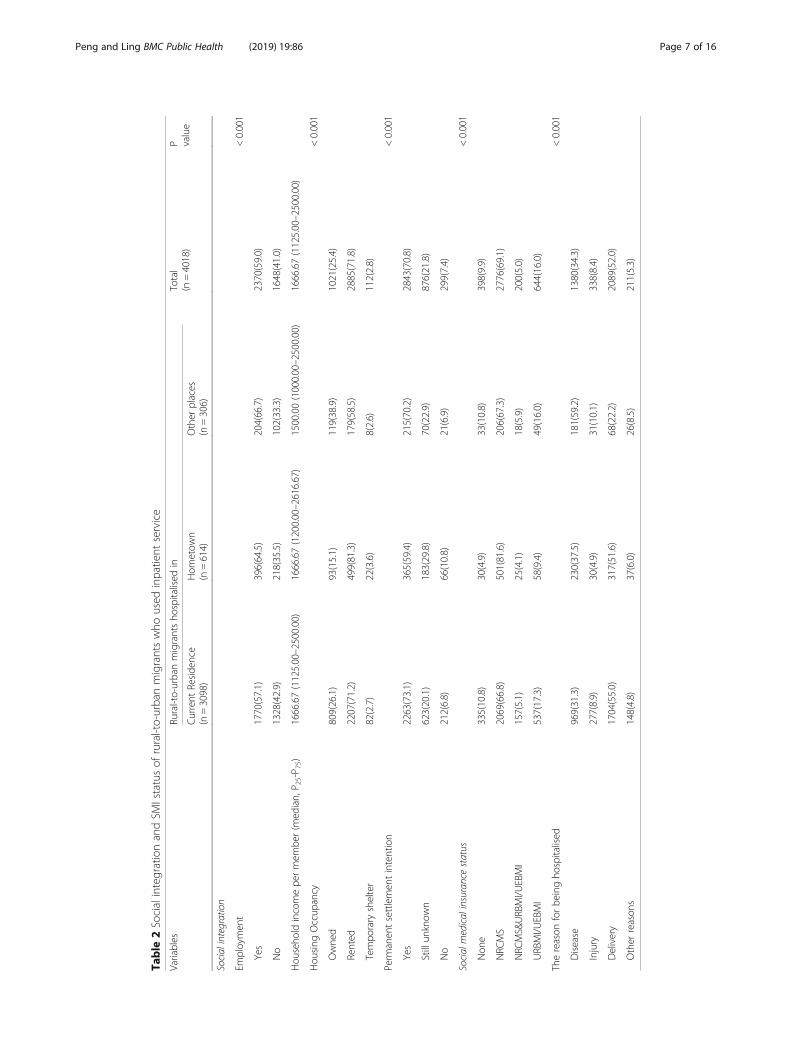
Rural-to-urban migrants’ SMI status and social integrationAmong the 4018 hospitalised rural-to-urban migrants,2776(69.1%) migrants were enrolled in the NRCMS,followed by UEBMI or URBMI (644, 16.0%), 200(5.0%)migrants were enrolled in both NRCMS and UEBMI orURBMI. However, there were 398 (9.9%) migrants havenot been enrolled in any SMI (Table 2).The social integration was measured by economic in-
tegration and the permanent settlement intention (a crit-ical index of self-identity). Regarding the economicintegration, 2370 (59.0%) out of 4018 migrants wereemployed. 2885 (71.8%) migrants lived in a rentedhouse, compared with 1021 (25.4%) of migrants living intheir own house in current residence. The median of themigrants’ household income per family member was1666.7 (p25-p75: 1125 to 2500) yuan RMB. Regarding thepermanent settlement intention, 2843(70.8%) migrantswanted to stay in their current residence in the futurefive years (Table 2).
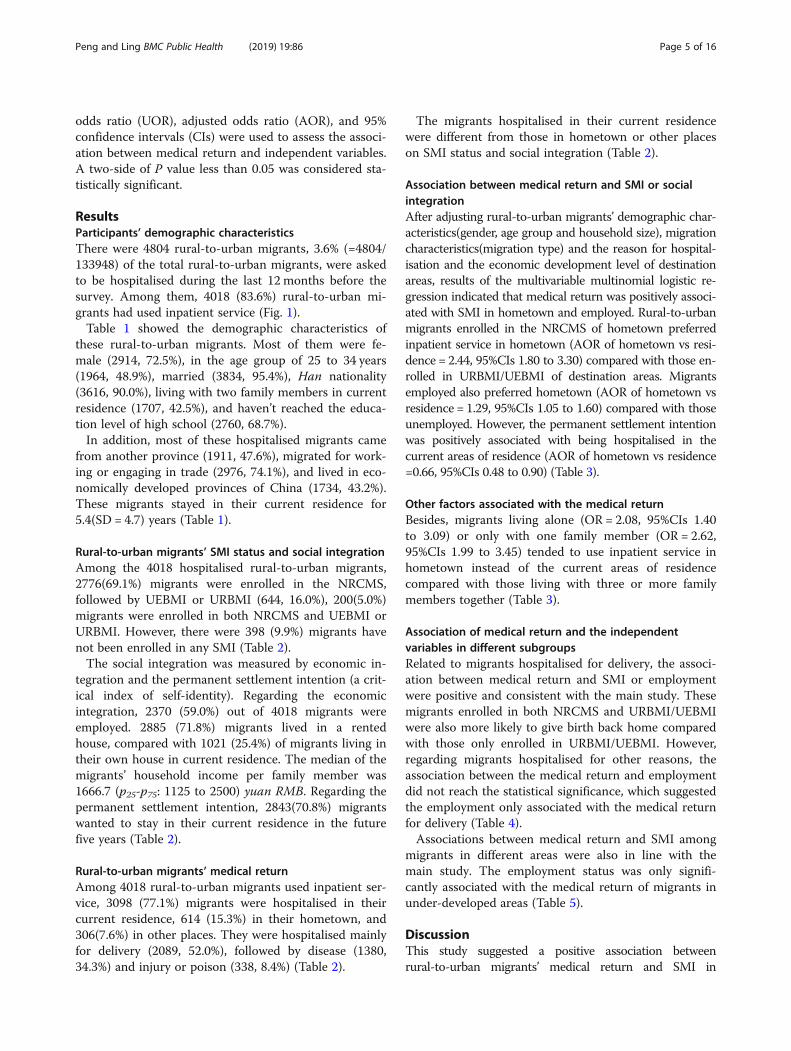
Rural-to-urban migrants’ medical returnAmong 4018 rural-to-urban migrants used inpatient ser-vice, 3098 (77.1%) migrants were hospitalised in theircurrent residence, 614 (15.3%) in their hometown, and306(7.6%) in other places. They were hospitalised mainlyfor delivery (2089, 52.0%), followed by disease (1380,34.3%) and injury or poison (338, 8.4%) (Table 2).
The migrants hospitalised in their current residencewere different from those in hometown or other placeson SMI status and social integration (Table 2).
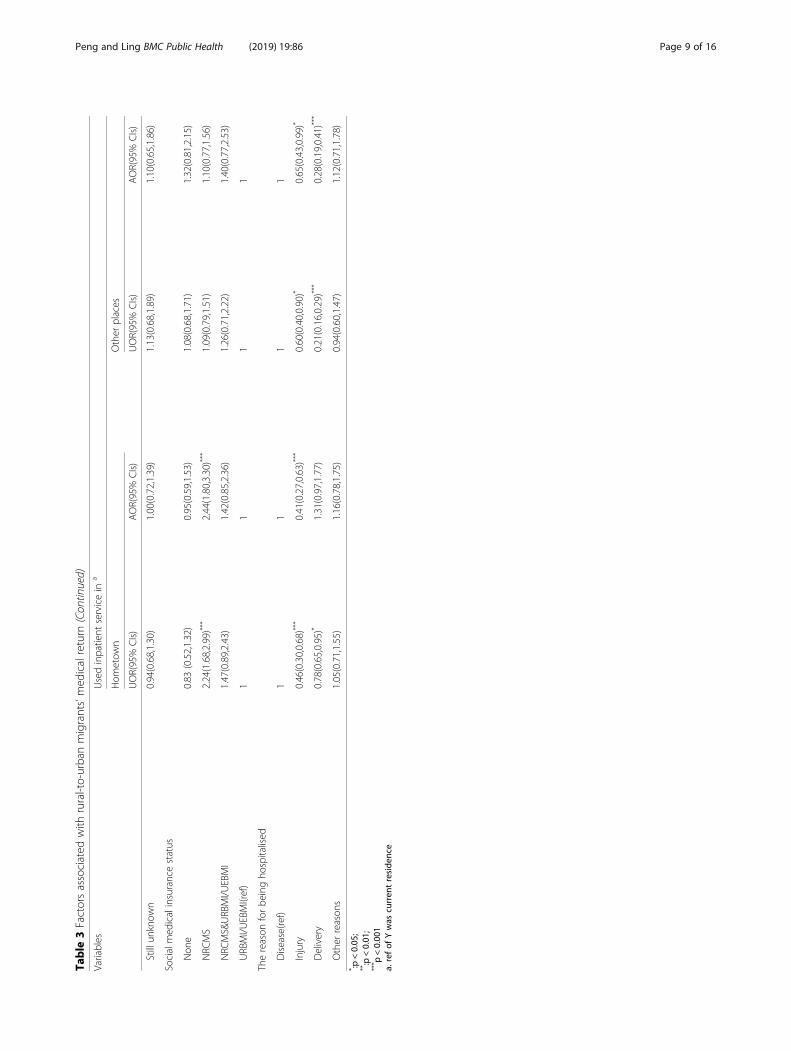
Association between medical return and SMI or socialintegrationAfter adjusting rural-to-urban migrants’ demographic char-acteristics(gender, age group and household size), migrationcharacteristics(migration type) and the reason for hospital-isation and the economic development level of destinationareas, results of the multivariable multinomial logistic re-gression indicated that medical return was positively associ-ated with SMI in hometown and employed. Rural-to-urbanmigrants enrolled in the NRCMS of hometown preferredinpatient service in hometown (AOR of hometown vs resi-dence = 2.44, 95%CIs 1.80 to 3.30) compared with those en-rolled in URBMI/UEBMI of destination areas. Migrantsemployed also preferred hometown (AOR of hometown vsresidence = 1.29, 95%CIs 1.05 to 1.60) compared with thoseunemployed. However, the permanent settlement intentionwas positively associated with being hospitalised in thecurrent areas of residence (AOR of hometown vs residence=0.66, 95%CIs 0.48 to 0.90) (Table 3).
Other factors associated with the medical returnBesides, migrants living alone (OR = 2.08, 95%CIs 1.40to 3.09) or only with one family member (OR = 2.62,95%CIs 1.99 to 3.45) tended to use inpatient service inhometown instead of the current areas of residencecompared with those living with three or more familymembers together (Table 3).
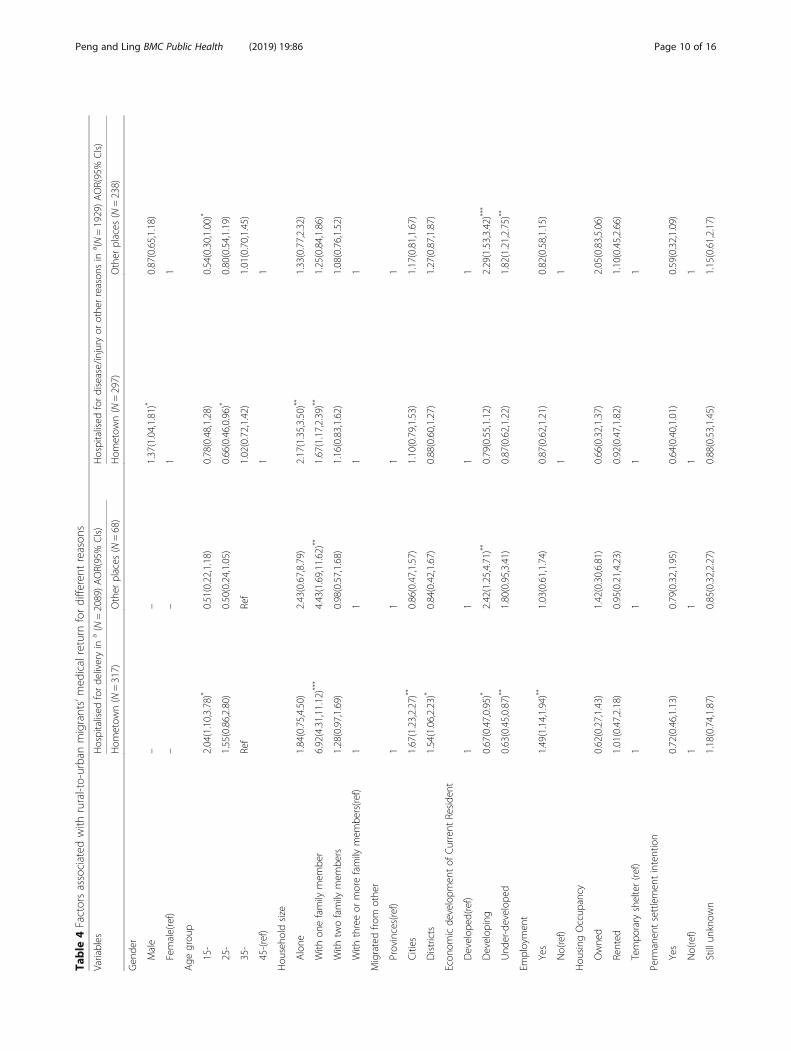
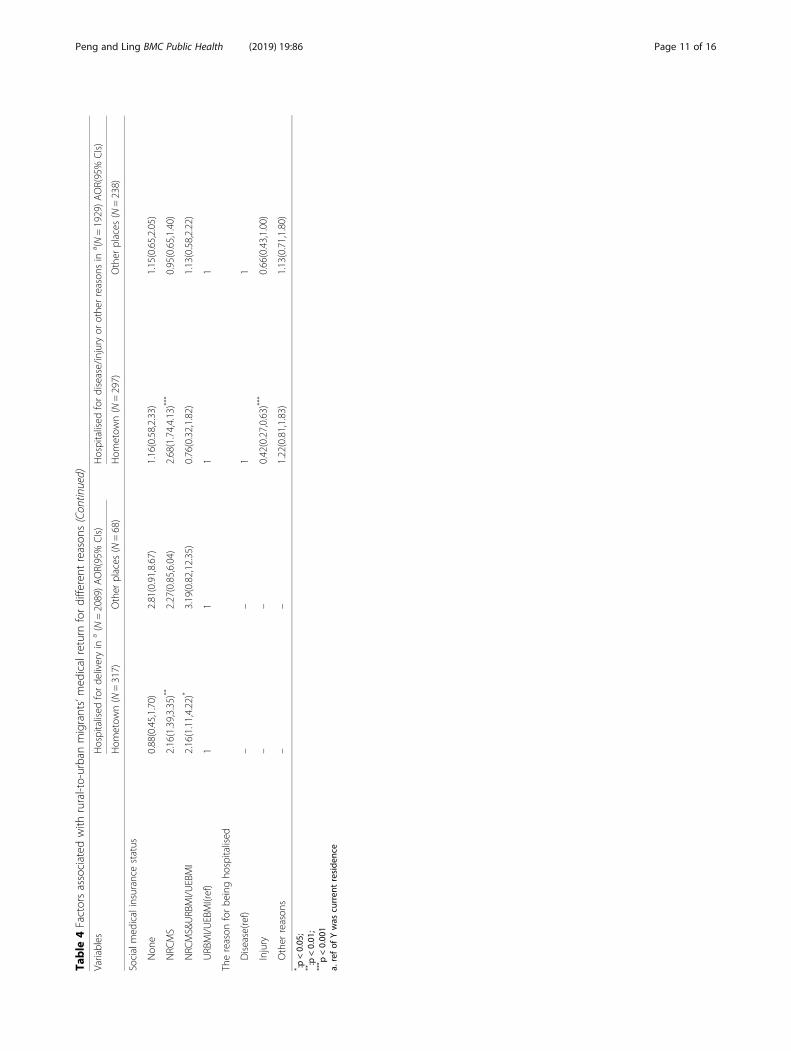
Association of medical return and the independentvariables in different subgroupsRelated to migrants hospitalised for delivery, the associ-ation between medical return and SMI or employmentwere positive and consistent with the main study. Thesemigrants enrolled in both NRCMS and URBMI/UEBMIwere also more likely to give birth back home comparedwith those only enrolled in URBMI/UEBMI. However,regarding migrants hospitalised for other reasons, theassociation between the medical return and employmentdid not reach the statistical significance, which suggestedthe employment only associated with the medical returnfor delivery (Table 4).Associations between medical return and SMI among
migrants in different areas were also in line with themain study. The employment status was only signifi-cantly associated with the medical return of migrants inunder-developed areas (Table 5).
DiscussionThis study suggested a positive association betweenrural-to-urban migrants’ medical return and SMI in
Peng and Ling BMC Public Health (2019) 19:86 Page 5 of 16

hometown (NRCMS), but a mixed association betweenmedical return and social integration (measured by employ-ment, household income, housing and the permanent
settlement intention). The medical return was positively as-sociated with employed status but negatively associatedwith the permanent settlement intention.
Table 1 Demographic characteristics of rural-to-urban migrants who used inpatient service
Variables Rural-to-urban migrants hospitalised in Total(n = 4018)
PvalueCurrent Residence
(n = 3098)Hometown(n = 614)
Other places(n = 306)
Gender < 0.001
Male 800(25.8) 181(29.5) 123(40.2) 1104(27.5)
Female 2298(74.2) 433(70.5) 183(59.8) 2914(72.5)
Age group < 0.001
15- 566(18.3) 141(23.0) 33(10.8) 740(18.4)
25- 1591(51.3) 269(43.8) 104(34.0) 1964(48.9)
35- 610(19.7) 125(20.3) 98(32.0) 833(20.7)
45–59 331(10.7) 79(12.9) 71(23.2) 481(12.0)
Ethnic group 0.356
Han nationality 2786(89.9) 560(91.2) 270(88.2) 3616(90.0)
Minority 312(10.1) 54(8.8) 36(11.8) 402(10.0)
Education level < 0.001
Never be educated 57(1.8) 11(1.8) 10(3.3) 78(1.9)
Below high school 2011(64.9) 440(71.6) 231(75.5) 2682(66.8)
High school 638(20.6) 103(16.8) 44(14.4) 785(19.5)
College/Undergraduate/Postgraduate 392(12.7) 60(9.8) 21(6.8) 473(11.8)
Marital status 0.257
Single 103(3.3) 20(3.2) 11(3.6) 134(3.3)
Married 2959(95.5) 588(95.8) 287(93.8) 3834(95.4)
Divorced/Windowed 36(1.2) 6(1.0) 8(2.6) 50(1.3)
Household size < 0.001
Alone 159(5.1) 47(7.7) 27(8.8) 233(5.8)
With one family member 344(11.1) 138(22.5) 62(20.3) 544(13.5)
With two family members 1354(43.7) 245(39.9) 108(35.3) 1707(42.5)
With three or more family members 1241(40.1) 184(30.0) 109(35.6) 1534(38.2)
Migrated from other 0.002
Provinces 1504(48.5) 292(47.6) 115(37.6) 1911(47.6)
Cities 948(30.6) 198(32.2) 103(33.7) 1249(31.1)
Districts 646(20.9) 124(20.2) 88(28.7) 858(21.3)
Economic development of current resident < 0.001
Developed 1366(44.1) 297(48.4) 71(23.2) 1734(43.2)
Developing 839(27.1) 153(24.9) 140(45.8) 1132(28.2)
Under-developed 893(28.8) 164(26.7) 95(31.0) 1152(28.7)
Duration of stay in current residence 5.35 ± 4.63 4.94 ± 4.34 6.99 ± 5.96 5.41 ± 4.73
Reason for migration 0.010
Working or engaging in trade 2251(72.7) 477(77.7) 248(81.0) 2976(74.1)
Family reasons/visit relatives 740(23.9) 122(19.9) 48(15.7) 910(22.6)
Marriage 81(2.6) 10(1.6) 8(2.6) 99(2.5)
Other reasons 26(0.8) 5(0.8) 2(0.7) 33(0.8)
Peng and Ling BMC Public Health (2019) 19:86 Page 6 of 16
Table
2SocialintegrationandSM
Istatusof
rural-to-urbanmigrantswho
used
inpatient
service
Variables
Rural-to-urbanmigrantsho
spitalised
inTotal
(n=4018)
P value
Current
Reside
nce
(n=3098)
Hom
etow
n(n=614)
Other
places
(n=306)
Socialintegration
Employmen
t<0.001
Yes
1770(57.1)
396(64.5)
204(66.7)
2370(59.0)
No
1328(42.9)
218(35.5)
102(33.3)
1648(41.0)
Hou
seho
ldincomepe
rmem
ber(m
edian,P 2
5-P 7
5)1666.67(1125.00–2500.00)
1666.67(1200.00–2616.67)
1500.00(1000.00–2500.00)
1666.67(1125.00–2500.00)
Hou
sing
Occup
ancy
<0.001
Owne
d809(26.1)
93(15.1)
119(38.9)
1021(25.4)
Rented
2207(71.2)
499(81.3)
179(58.5)
2885(71.8)
Tempo
rary
shelter
82(2.7)
22(3.6)
8(2.6)
112(2.8)
Perm
anen
tsettlemen
tintention
<0.001
Yes
2263(73.1)
365(59.4)
215(70.2)
2843(70.8)
Stillun
know
n623(20.1)
183(29.8)
70(22.9)
876(21.8)
No
212(6.8)
66(10.8)
21(6.9)
299(7.4)
Socialmedicalinsurancestatus
<0.001
Non
e335(10.8)
30(4.9)
33(10.8)
398(9.9)
NRC
MS
2069(66.8)
501(81.6)
206(67.3)
2776(69.1)
NRC
MS&
URBMI/U
EBMI
157(5.1)
25(4.1)
18(5.9)
200(5.0)
URBMI/U
EBMI
537(17.3)
58(9.4)
49(16.0)
644(16.0)
Thereason
forbe
ingho
spitalised
<0.001
Disease
969(31.3)
230(37.5)
181(59.2)
1380(34.3)
Injury
277(8.9)
30(4.9)
31(10.1)
338(8.4)
Delivery
1704(55.0)
317(51.6)
68(22.2)
2089(52.0)
Other
reason
s148(4.8)
37(6.0)
26(8.5)
211(5.3)
Peng and Ling BMC Public Health (2019) 19:86 Page 7 of 16

Table
3Factorsassociated
with
rural-to-urbanmigrants’med
icalreturn
Variables
Usedinpatient
servicein
a
Hom
etow
nOther
places
UOR(95%
CIs)
AOR(95%
CIs)
UOR(95%
CIs)
AOR(95%
CIs)
Gen
der
Male
1.20(0.99,1.45)
1.34(1.02,1.77)*
1.93(1.52,2.46)**
*0.87(0.65,1.17)
Female(ref)
11
11
Age
grou
p
15-
1.04(0.77,1.42)
0.99(0.68,1.43)
0.27(0.18,0.42)**
*0.65(0.40,1.06)
25-
0.71(0.54,0.93)*
0.76(0.55,1.06)
0.30(0.22,0.42)**
*0.76(0.52,1.11)
35-
0.86(0.63,1.17)
0.93(0.67,1.29)
0.75(0.54,1.05)
1.04(0.73,1.49)
45-(ref)
11
1
Hou
seho
ldsize
Alone
1.99(1.39,2.86)**
*2.08(1.40,3.09)**
*1.93(1.23,3.04)**
1.44(0.88,2.37)
With
onefamily
mem
ber
2.71(2.11,3.48)**
*2.62(1.99,3.45)**
*2.05(1.47,2.87)**
*1.46(1.02,2.10)*
With
twofamily
mem
bers
1.22(0.99,1.50)
1.23(0.99,1.52)
0.91(0.69,1.20)
1.02(0.76,1.36)
With
threeor
morefamily
mem
bers(re
f)1
11
1
Migratedfro
mothe
r
Provinces(ref)
11
11
Cities
1.08(0.88,1.31)
1.37(1.10,1.71)**
1.42(1.08,1.88)*
1.09(0.80,1.49)
Districts
0.99(0.79,1.24)
1.16(0.90,1.51)
1.78(1.33,2.39)**
*1.20(0.86,1.67)
Econ
omicde
velopm
entof
Current
Reside
nt
Develop
ed(re
f)1
11
1
Develop
ing
0.84(0.68,1.04)
0.72(0.56,0.92)**
3.21(2.38,4.33)**
*2.29(1.63,3.22)**
*
Und
er-develop
ed0.84(0.69,1.04)
0.73(0.58,0.92)**
2.05(1.49,2.82)**
*1.79(1.27,2.52)**
Employmen
t
Yes
1.36(1.14,1.63)**
1.29(1.05,1.60)*
1.50(1.17,1.92)**
0.91(0.69,1.22)
No(ref)
11
11
Hou
sing
Occup
ancy
Owne
d0.43(0.26,0.72)**
0.66(0.38,1.15)
1.51(0.71,3.20)
1.88(0.86,4.08)
Rented
0.84(0.52,1.36)
0.96(0.58,1.58)
0.83(0.40,1.75)
1.06(0.49,2.27)
Tempo
rary
shelter(re
f)1
11
1
Perm
anen
tsettlemen
tintention
Yes
0.52(0.38,0.70)**
*0.66(0.48,0.90)*
0.96(0.60,1.53)
0.66(0.40,1.09)
No(ref)
11
11
Peng and Ling BMC Public Health (2019) 19:86 Page 8 of 16
Table
3Factorsassociated
with
rural-to-urbanmigrants’med
icalreturn
(Con
tinued)
Variables
Usedinpatient
servicein
a
Hom
etow
nOther
places
UOR(95%
CIs)
AOR(95%
CIs)
UOR(95%
CIs)
AOR(95%
CIs)
Stillun
know
n0.94(0.68,1.30)
1.00(0.72,1.39)
1.13(0.68,1.89)
1.10(0.65,1.86)
Socialmed
icalinsurancestatus
Non
e0.83
(0.52,1.32)
0.95(0.59,1.53)
1.08(0.68,1.71)
1.32(0.81,2.15)
NRC
MS
2.24(1.68,2.99)**
*2.44(1.80,3.30)**
*1.09(0.79,1.51)
1.10(0.77,1.56)
NRC
MS&
URBMI/U
EBMI
1.47(0.89,2.43)
1.42(0.85,2.36)
1.26(0.71,2.22)
1.40(0.77,2.53)
URBMI/U
EBMI(ref)
11
11
Thereason
forbe
ingho
spitalised
Disease(re
f)1
11
1
Injury
0.46(0.30,0.68)**
*0.41(0.27,0.63)**
*0.60(0.40,0.90)*
0.65(0.43,0.99)*
Delivery
0.78(0.65,0.95)*
1.31(0.97,1.77)
0.21(0.16,0.29)**
*0.28(0.19,0.41)**
*
Other
reason
s1.05(0.71,1.55)
1.16(0.78,1.75)
0.94(0.60,1.47)
1.12(0.71,1.78)
* :p<0.05
;**:p<0.01
;*** p
<0.00
1a.refof
Ywas
curren
treside
nce
Peng and Ling BMC Public Health (2019) 19:86 Page 9 of 16
Table
4Factorsassociated
with
rural-to-urbanmigrants’med
icalreturn
fordifferent
reason
s
Variables
Hospitalised
forde
liveryin
a(N
=2089)AOR(95%
CIs)
Hospitalised
fordisease/injury
orothe
rreason
sin
a (N=1929)AOR(95%
CIs)
Hom
etow
n(N
=317)
Other
places
(N=68)
Hom
etow
n(N
=297)
Other
places
(N=238)
Gen
der
Male
––
1.37(1.04,1.81)*
0.87(0.65,1.18)
Female(ref)
––
11
Age
grou
p
15-
2.04(1.10,3.78)*
0.51(0.22,1.18)
0.78(0.48,1.28)
0.54(0.30,1.00)*
25-
1.55(0.86,2.80)
0.50(0.24,1.05)
0.66(0.46,0.96)*
0.80(0.54,1.19)
35-
Ref
Ref
1.02(0.72,1.42)
1.01(0.70,1.45)
45-(ref)
11
Hou
seho
ldsize
Alone
1.84(0.75,4.50)
2.43(0.67,8.79)
2.17(1.35,3.50)**
1.33(0.77,2.32)
With
onefamily
mem
ber
6.92(4.31,11.12)***
4.43(1.69,11.62)**
1.67(1.17,2.39)**
1.25(0.84,1.86)
With
twofamily
mem
bers
1.28(0.97,1.69)
0.98(0.57,1.68)
1.16(0.83,1.62)
1.08(0.76,1.52)
With
threeor
morefamily
mem
bers(re
f)1
11
1
Migratedfro
mothe
r
Provinces(ref)
11
11
Cities
1.67(1.23,2.27)**
0.86(0.47,1.57)
1.10(0.79,1.53)
1.17(0.81,1.67)
Districts
1.54(1.06,2.23)*
0.84(0.42,1.67)
0.88(0.60,1.27)
1.27(0.87,1.87)
Econ
omicde
velopm
entof
Current
Reside
nt
Develop
ed(re
f)1
11
1
Develop
ing
0.67(0.47,0.95)*
2.42(1.25,4.71)**
0.79(0.55,1.12)
2.29(1.53,3.42)**
*
Und
er-develop
ed0.63(0.45,0.87)**
1.80(0.95,3.41)
0.87(0.62,1.22)
1.82(1.21,2.75)**
Employmen
t
Yes
1.49(1.14,1.94)**
1.03(0.61,1.74)
0.87(0.62,1.21)
0.82(0.58,1.15)
No(ref)
11
Hou
sing
Occup
ancy
Owne
d0.62(0.27,1.43)
1.42(0.30,6.81)
0.66(0.32,1.37)
2.05(0.83,5.06)
Rented
1.01(0.47,2.18)
0.95(0.21,4.23)
0.92(0.47,1.82)
1.10(0.45,2.66)
Tempo
rary
shelter(re
f)1
11
1
Perm
anen
tsettlemen
tintention
Yes
0.72(0.46,1.13)
0.79(0.32,1.95)
0.64(0.40,1.01)
0.59(0.32,1.09)
No(ref)
11
11
Stillun
know
n1.18(0.74,1.87)
0.85(0.32,2.27)
0.88(0.53,1.45)
1.15(0.61,2.17)
Peng and Ling BMC Public Health (2019) 19:86 Page 10 of 16
Table
4Factorsassociated
with
rural-to-urbanmigrants’med
icalreturn
fordifferent
reason
s(Con
tinued)
Variables
Hospitalised
forde
liveryin
a(N
=2089)AOR(95%
CIs)
Hospitalised
fordisease/injury
orothe
rreason
sin
a (N=1929)AOR(95%
CIs)
Hom
etow
n(N
=317)
Other
places
(N=68)
Hom
etow
n(N
=297)
Other
places
(N=238)
Socialmed
icalinsurancestatus
Non
e0.88(0.45,1.70)
2.81(0.91,8.67)
1.16(0.58,2.33)
1.15(0.65,2.05)
NRC
MS
2.16(1.39,3.35)**
2.27(0.85,6.04)
2.68(1.74,4.13)**
*0.95(0.65,1.40)
NRC
MS&
URBMI/U
EBMI
2.16(1.11,4.22)*
3.19(0.82,12.35)
0.76(0.32,1.82)
1.13(0.58,2.22)
URBMI/U
EBMI(ref)
11
11
Thereason
forbe
ingho
spitalised
Disease(re
f)–
–1
1
Injury
––
0.42(0.27,0.63)**
*0.66(0.43,1.00)
Other
reason
s–
–1.22(0.81,1.83)
1.13(0.71,1.80)
* :p<0.05
;**:p<0.01
;*** p
<0.00
1a.refof
Ywas
curren
treside
nce
Peng and Ling BMC Public Health (2019) 19:86 Page 11 of 16
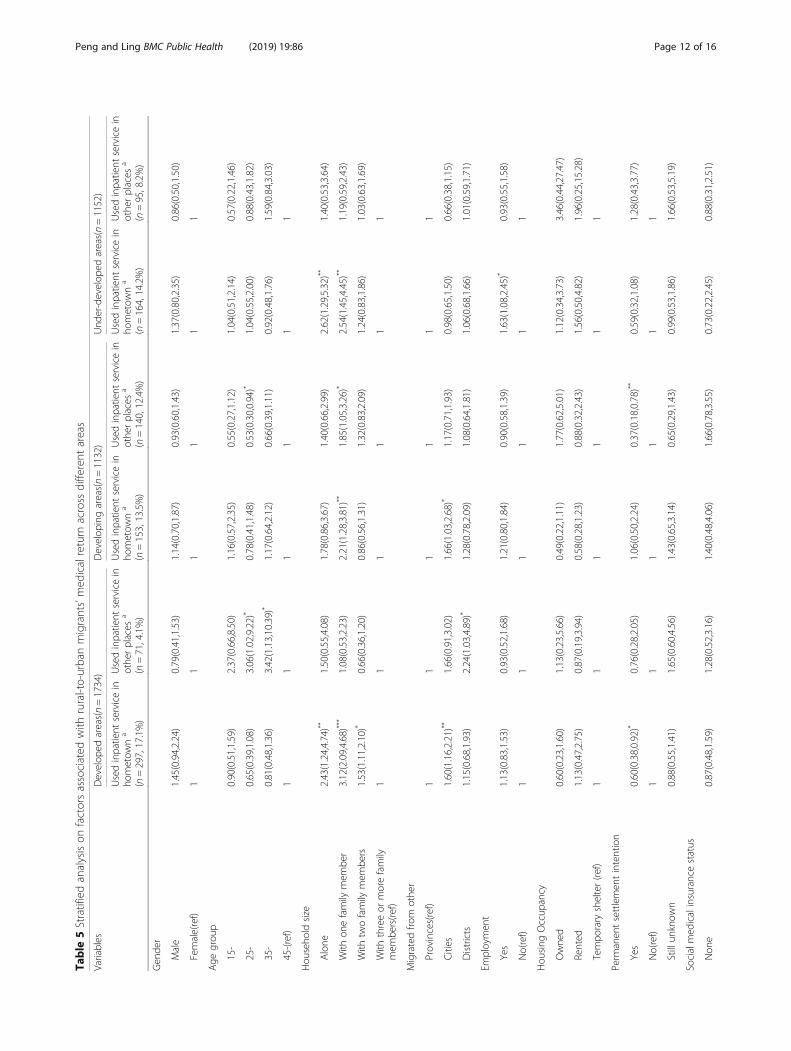
Table
5Stratifiedanalysison
factorsassociated
with
rural-to-urbanmigrants’med
icalreturn
across
different
areas
Variables
Develop
edareas(n=1734)
Develop
ingareas(n=1132)
Und
er-develop
edareas(n=1152)
Usedinpatient
servicein
hometow
na
(n=297,17.1%)
Usedinpatient
servicein
othe
rplaces
a
(n=71,4.1%)
Usedinpatient
servicein
hometow
na
(n=153,13.5%)
Usedinpatient
servicein
othe
rplaces
a
(n=140,12.4%)
Usedinpatient
servicein
hometow
na
(n=164,14.2%)
Usedinpatient
servicein
othe
rplaces
a
(n=95,8.2%)
Gen
der
Male
1.45(0.94,2.24)
0.79(0.41,1.53)
1.14(0.70,1.87)
0.93(0.60,1.43)
1.37(0.80,2.35)
0.86(0.50,1.50)
Female(ref)
11
11
11
Age
grou
p
15-
0.90(0.51,1.59)
2.37(0.66,8.50)
1.16(0.57,2.35)
0.55(0.27,1.12)
1.04(0.51,2.14)
0.57(0.22,1.46)
25-
0.65(0.39,1.08)
3.06(1.02,9.22)*
0.78(0.41,1.48)
0.53(0.30,0.94)*
1.04(0.55,2.00)
0.88(0.43,1.82)
35-
0.81(0.48,1.36)
3.42(1.13,10.39)*
1.17(0.64,2.12)
0.66(0.39,1.11)
0.92(0.48,1.76)
1.59(0.84,3.03)
45-(ref)
11
11
11
Hou
seho
ldsize
Alone
2.43(1.24,4.74)**
1.50(0.55,4.08)
1.78(0.86,3.67)
1.40(0.66,2.99)
2.62(1.29,5.32)**
1.40(0.53,3.64)
With
onefamily
mem
ber
3.12(2.09,4.68)**
*1.08(0.53,2.23)
2.21(1.28,3.81)**
1.85(1.05,3.26)*
2.54(1.45,4.45)**
1.19(0.59,2.43)
With
twofamily
mem
bers
1.53(1.11,2.10)*
0.66(0.36,1.20)
0.86(0.56,1.31)
1.32(0.83,2.09)
1.24(0.83,1.86)
1.03(0.63,1.69)
With
threeor
morefamily
mem
bers(re
f)1
11
11
1
Migratedfro
mothe
r
Provinces(ref)
11
11
11
Cities
1.60(1.16,2.21)**
1.66(0.91,3.02)
1.66(1.03,2.68)*
1.17(0.71,1.93)
0.98(0.65,1.50)
0.66(0.38,1.15)
Districts
1.15(0.68,1.93)
2.24(1.03,4.89)*
1.28(0.78,2.09)
1.08(0.64,1.81)
1.06(0.68,1.66)
1.01(0.59,1.71)
Employmen
t
Yes
1.13(0.83,1.53)
0.93(0.52,1.68)
1.21(0.80,1.84)
0.90(0.58,1.39)
1.63(1.08,2.45)*
0.93(0.55,1.58)
No(ref)
11
11
11
Hou
sing
Occup
ancy
Owne
d0.60(0.23,1.60)
1.13(0.23,5.66)
0.49(0.22,1.11)
1.77(0.62,5.01)
1.12(0.34,3.73)
3.46(0.44,27.47)
Rented
1.13(0.47,2.75)
0.87(0.19,3.94)
0.58(0.28,1.23)
0.88(0.32,2.43)
1.56(0.50,4.82)
1.96(0.25,15.28)
Tempo
rary
shelter(re
f)1
11
11
1
Perm
anen
tsettlemen
tintention
Yes
0.60(0.38,0.92)*
0.76(0.28,2.05)
1.06(0.50,2.24)
0.37(0.18,0.78)**
0.59(0.32,1.08)
1.28(0.43,3.77)
No(ref)
11
11
11
Stillun
know
n0.88(0.55,1.41)
1.65(0.60,4.56)
1.43(0.65,3.14)
0.65(0.29,1.43)
0.99(0.53,1.86)
1.66(0.53,5.19)
Socialmed
icalinsurancestatus
Non
e0.87(0.48,1.59)
1.28(0.52,3.16)
1.40(0.48,4.06)
1.66(0.78,3.55)
0.73(0.22,2.45)
0.88(0.31,2.51)
Peng and Ling BMC Public Health (2019) 19:86 Page 12 of 16
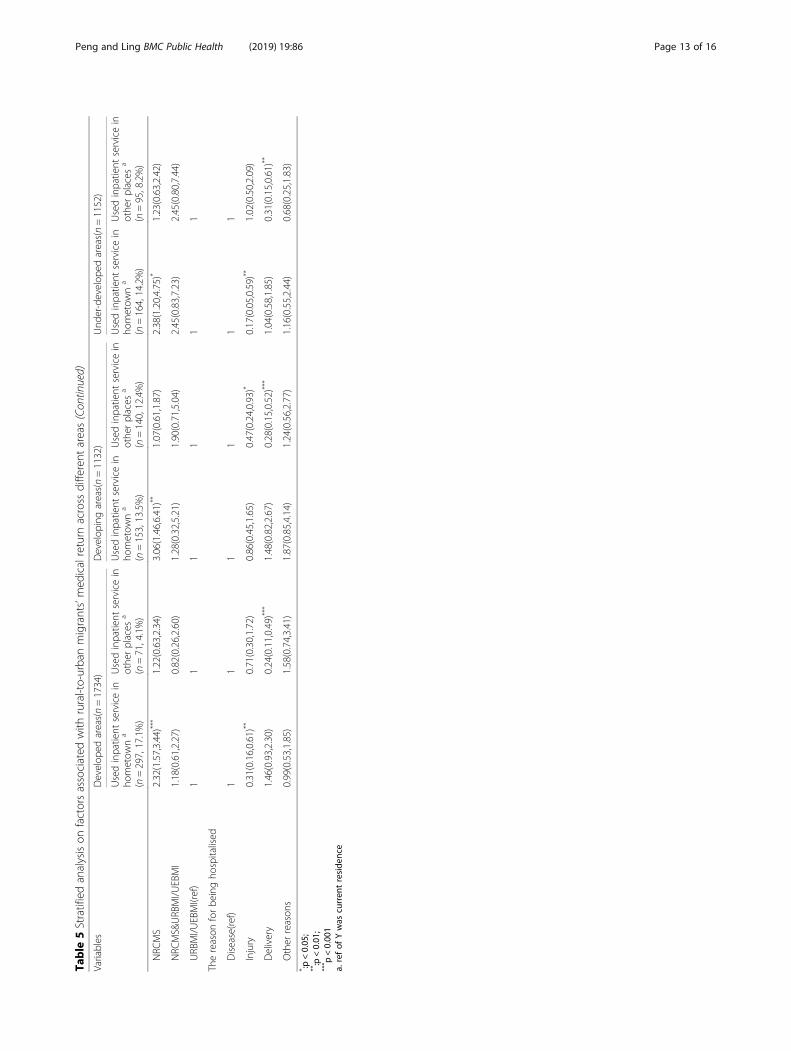
Table
5Stratifiedanalysison
factorsassociated
with
rural-to-urbanmigrants’med
icalreturn
across
different
areas(Con
tinued)
Variables
Develop
edareas(n=1734)
Develop
ingareas(n=1132)
Und
er-develop
edareas(n=1152)
Usedinpatient
servicein
hometow
na
(n=297,17.1%)
Usedinpatient
servicein
othe
rplaces
a
(n=71,4.1%)
Usedinpatient
servicein
hometow
na
(n=153,13.5%)
Usedinpatient
servicein
othe
rplaces
a
(n=140,12.4%)
Usedinpatient
servicein
hometow
na
(n=164,14.2%)
Usedinpatient
servicein
othe
rplaces
a
(n=95,8.2%)
NRC
MS
2.32(1.57,3.44)**
*1.22(0.63,2.34)
3.06(1.46,6.41)**
1.07(0.61,1.87)
2.38(1.20,4.75)*
1.23(0.63,2.42)
NRC
MS&
URBMI/U
EBMI
1.18(0.61,2.27)
0.82(0.26,2.60)
1.28(0.32,5.21)
1.90(0.71,5.04)
2.45(0.83,7.23)
2.45(0.80,7.44)
URBMI/U
EBMI(ref)
11
11
11
Thereason
forbe
ingho
spitalised
Disease(re
f)1
11
11
1
Injury
0.31(0.16,0.61)**
0.71(0.30,1.72)
0.86(0.45,1.65)
0.47(0.24,0.93)*
0.17(0.05,0.59)**
1.02(0.50,2.09)
Delivery
1.46(0.93,2.30)
0.24(0.11,0.49)**
*1.48(0.82,2.67)
0.28(0.15,0.52)**
*1.04(0.58,1.85)
0.31(0.15,0.61)**
Other
reason
s0.99(0.53,1.85)
1.58(0.74,3.41)
1.87(0.85,4.14)
1.24(0.56,2.77)
1.16(0.55,2.44)
0.68(0.25,1.83)
* :p<0.05
;**:p<0.01
;*** p
<0.00
1a.refof
Ywas
curren
treside
nce
Peng and Ling BMC Public Health (2019) 19:86 Page 13 of 16
Association between rural-to-urban migrants’ medicalreturn and SMI statusAssociation between medical return and SMI of home-town (NRCMS) was positive, which was consistent withthe previous studies on internal migrants [9, 10] and inter-national immigrants [13, 15, 16, 22, 23]. This positive as-sociation could be explained as follows. Since SMI inChina was coordinated and managed by the local govern-ment, people were enrolled in and reimbursed by SMI ac-cording to their hukou and the location of their SMI [7].Although in few areas the NRCMS accepted the medicalbills beyond their counties, it still had a cumbersome pro-cedure to receive the reimbursement. The proportion ofreimbursement beyond hometown was also lower thanthat in hometown [8]. Rural-to-urban migrants enrolled inNRCMS of hometown had to return to get more reim-bursement through a convenient procedure [7].Similarly, rural-to-urban migrants enrolled in UEBMI
or URBMI of current residence could receive more re-imbursement in the destination areas, and thus were inbetter access to the health service of the destinationareas. This result was consistent with other studies inChina [9, 36]. Some effective measures to improve mi-grants’ health access in the destination areas may as fol-lows. First, the government might try to offer morestable works to the migrants and guarantee more em-ployees can be enrolled in the UEBMI. Second, promot-ing the portability of the SMI across different areaswould be effective. Third, some efforts may also be doneto facilitate rural-to-urban migrants’ access to theURBMI of the destination areas.Besides, rural-to-urban migrants who were enrolled in
both insurance of current residence (URBMI/UEBMI)and hometown(NRCMS) preferred to give birth backhome. The explanation would be that these migrantscould receive reimbursement in both hometown andcurrent residence, and migrants enrolled in NRCMS ofhometown also felt more familiar with the health systemof hometown and had more social ties with hometown.The uninsured migrants showed similar preference on
current residences’ inpatient service with those enrolledin UEBMI or URBMI of destination areas. The main rea-son would be as follows. First, due to the expensivemedical costs in current residence but the extra costs oftransports and times for returning, the total cost of hos-pitalisation between hometown and current residencewould be extremely close. Second, the quality of in-patient service in developed destination areas would bebetter than that in hometown.
Association between rural-to-urban migrants’ medicalreturn and social integrationThe association between social integration (includingeconomic integration and the permanent settlement
intention) and medical return was complex. The per-manent settlement intention, measured by the willing-ness of staying in their current residence in the future[28, 29], was negatively associated with the medical re-turn [24]. Since the permanent settlement intention wascollected during the survey, it might not measure thepermanent settlement intention before the health careutilisation very well and thus could not predict thecausal relationship between these two variables. How-ever, previous studies have found that high-integratedmigrants were more familiar with the health system andthe reimbursement policy of current residence, whichcould facilitate their hospitalisation in there [20]. Thepermanent settlement intention also indicated the pref-erence on current residence including their health sys-tem, which would attract them to be hospitalised inthere [15, 17–19, 23]. Despite this limitation, our resultswould inform the future prospective studies the possibleassociation between these two variables. Besides, our re-sults indicated the complex association between socialintegration and medical return.Regarding the dimension of economic integration
(measured by employment, household income, andhousing), it demonstrated a complex result. Beingemployed was positively associated with medical returncompared with the unemployed [10], especially amongmigrants who were hospitalised for delivery. However,employment status didn’t associate with the medical re-turn for other reasons. The reason might be that the em-ployment status in the survey was categorised intoemployed and unemployed. We had limited informationabout the migrants’ working time, such as the migrants’working type (full-time or part-time job), which was alsoan important variable associated with the migrants’ ac-cess to health service and economic status. Further studyis needed to explore the effect of employment status onrural-to-urban migrants’ medical return more precisely.Migrants’ household income and housing occupancy
did not achieve the statistical significance after adjustingother factors. The former was consistent with previousstudies [15, 18]. The reason might be that rural-to-urbanmigrants’ medical return was mainly determined by theSMI.
Other factors associated with rural-to-urban migrants’medical returnAs a social resource, the household size was also associ-ated with the medical return. Rural-to-urban migrantsliving with two family members or less preferred home-town’s inpatient service compared with those living withthree or more family members together. This result wasconsistent with other studies on rural-to-urban migrants[10, 37, 38] and studies on the general population [39].Family members living together would enable the
Peng and Ling BMC Public Health (2019) 19:86 Page 14 of 16

migrants to be hospitalised in current residence by tak-ing care of the sick person during their hospitalisation[10]. However, fewer family members living togethermeans less support as more family numbers left behind[28, 29], thus more likely to seek care closer to the fam-ily back home [20, 23, 26].
LimitationThere were several limitations of this study. First, thecross-sectional study cannot predict the causal relation-ship between variables, but it can inform the future inter-vention study to improve the convenience of healthservice among migrants. Second, lacking information onlanguage proficiency and social connection, we onlychecked some indexes of social integration. It could notreflect the social integration comprehensively; despitewhich, we found a mixed association between medical re-turn and indexes of social integration. Third, we failed toget information on health service satisfaction with in-patient service in different locations and the seriousnessof the disease, which were also associated with the medicalreturn. However, we detected the impact of the permanentsettlement intention, which could also indicate satisfactionwith current residence, including health service in there.Fourth, the rural-to-urban migrants in this survey only in-cluded those returned back to be hospitalised and cameback to the destination areas during the 12months beforethe survey, thus excluded those who returned back buthaven’t come back to the destination areas yet before thesurvey. Finally, the high proportion of delivery among therural-to-urban migrants in this survey indicated theremight be selection bias during the sampling. We per-formed a stratified analysis to test the associations be-tween medical return and independent variables indifferent subgroups of the reason for hospitalisation.
ConclusionThis study indicated a positive association between SMIof hometown and medical return. This positive associ-ation suggested that the government might improve mi-grants’ health access through facilitating the transfer ofSMI across different regions or increase rural-to-urbanmigrants’ access to local SMI and improve the propor-tion of reimbursement of SMI. Besides, we found the as-sociation between social integration and medical returnwas complex. The permanent settlement intention wasnegatively associated with the medical return. More pro-spective studies are needed to test the causal relationshipbetween the permanent settlement intention and med-ical return in the future.
AbbreviationsAOR: adjusted odds ratio; CIs: confidence intervals; NIMDMS: the NationalInternal Migrant Dynamic Monitoring Survey; NPFPC: the National Populationand Family Planning Commission of the People’s Republic of China;
NRCMS: new rural cooperative medical scheme; PPS: probabilityproportionate to size sampling method; SD: standard deviations; SMI: socialmedical insurance; UEBMI: urban employee-based basic medical insurance;UOR: unadjusted odds ratio; URBMI: urban resident-based basic medicalinsurance
AcknowledgementsThe authors thank professor Andre M.N. Renzaho (Western Sydney University,Australia) and Wen Chen (Sun Yat-sen University, China) for their contributionto the revision of this paper and help with the language. We also thank theNational Health and Family Planning Commission Migrant Population ServiceCenter for providing the NIMDMS data for this study.
FundingThis study was supported by the Natural Science Foundation of GuangdongProvince, China (Grant No. 2018A030310283) and the FundamentalResearch Funds for the Central Universities of Ministry of Education of Chinafor Sun Yat-sen University (Grant No. 18zxxt28). The funding bodies had norole in the design of the study, data collection, analysis, interpretation of thedata, or writing of the manuscript.
Availability of data and materialsThe data of NIMDMS 2014 are available from the National Population andFamily Planning Commission of the People’s Republic of China (NPFPC) butrestrictions apply to the availability of these data, which could be used onlyby the authorised institutions, and so are not publicly available. Data arehowever available from the authors upon reasonable request and withpermission of the NPFPC.
Authors’ contributionsBP conceptualised this paper, conducted statistical analyses and drafted theinitial manuscript. LL provided the data used in this paper, conceptualisedthis paper and critically revised this paper. All authors contributed to themanuscript and approved the final manuscript.
Ethics approval and consent to participateThis study is a secondary analysis of a public access dataset of the NationalInternal Migrant Dynamic Monitoring Survey (NIMDMS) 2014. It doesn’tcontain any identifiable private information of the participants. This surveywas funded and organised by the National Population and Family PlanningCommission of the People’s Republic of China (NPFPC). Written informedconsent was obtained by the trained investigators from all individualsincluded in the study. We have got the permission to use this dataset fromthe NPFPC. The Institutional Review Broad (IRB) of the School of PublicHealth, Sun Yat-sen University in China approved this study ([2018] No.011).
Consent for publicationNot Applicable.
Competing interestsThe authors declare that they have no competing interests.
Publisher’s NoteSpringer Nature remains neutral with regard to jurisdictional claims inpublished maps and institutional affiliations.
Received: 24 June 2018 Accepted: 8 January 2019
References1. Department of Service and Management of Migrant Population National
Health and Family Planning Commission of China. Report on China’smigrant population development 2016. Beijing: China population publishinghouse; 2016.
2. Department of Service and Management of Migrant Population NationalHealth and Family Planning Commission of China. Report on China’smigrant population development 2015. Beijing: China population publishinghouse; 2015.
3. Jahn HJ, Ling L, Han L, Xia Y, Krämer A. Migration and health in megacities:a Chinese example from Guangzhou, China. In: Health in megacities andurban areas. Berlin Heidelberg: Springer; 2011. p. 189–208.
Peng and Ling BMC Public Health (2019) 19:86 Page 15 of 16
4. Lam KK, Johnston JM. Health insurance and healthcare utilisation forShenzhen residents: a tale of registrants and migrants? BMC Public Health.2012;12:868.
5. Gu H, You H, Ning W, Zhou H, Wang J, Lu Y, Sun J, Kou Y, Dong H. Internalmigration and maternal health service utilisation in Jiangsu, China. TropicalMed Int Health. 2017;22(2):124–32.
6. Mou J, Griffiths SM, Fong HF, Dawes MG. Defining migration and its healthimpact in China. Public Health. 2015;129(10):1326–34.
7. Qiu P, Yang Y, Zhang J, Ma X. Rural-to-urban migration and its implicationfor new cooperative medical scheme coverage and utilization in China.BMC Public Health. 2011;11:520.
8. Mou J, Griffiths SM, Fong H, Dawes MG. Health of China's rural–urbanmigrants and their families: a review of literature from 2000 to 2012. Br MedBull. 2013;106(1):19–43.
9. Hou Z, Zhang D. Health insurance coverage and inpatient services choiceamong rural-to-urban migrants from a nationwide cross-sectional survey inChina: does location matter? Lancet. 2017;390:S27.
10. Song X, Zou G, Chen W, Han S, Zou X, Ling L, Chavez LR, Cornelius WA,Jones OW. Health service utilisation of rural-to-urban migrants inGuangzhou, China: does employment status matter? Tropical Med IntHealth. 2017;22(1):82–91.
11. Chavez LR, Cornelius WA, Jones OW. Mexican immigrants and theutilization of U.S. health services: the case of San Diego. Soc Sci Med.1985;21(1):93–102.
12. Seid M, Castaneda D, Mize R, Zivkovic M, Varni JW. Crossing the borderfor health care: access and primary care characteristics for youngchildren of Latino farm workers along the US-Mexico border. AmbulPediatr. 2003;3(3):121–30.
13. Macias EP, Morales LS. Crossing the border for health care. J Health CarePoor Underserved. 2001;12(1):77–87.
14. Bergmark R, Barr D, Garcia R. Mexican immigrants in the US living far fromthe border may return to Mexico for health services. J Immigr Minor Health.2010;12(4):610–4.
15. De Jesus M, Xiao C. Cross-border health care utilization among the Hispanicpopulation in the United States: implications for closing the health careaccess gap. Ethn Health. 2013;18(3):297–314.
16. Su D, Richardson C, Wen M, Pagán JA. Cross-border utilization of healthcare: evidence from a population-based study in South Texas. Health ServRes. 2011;46(3):859–76.
17. Lee JY, Kearns RA, Friesen W. Seeking affective health care: Korean immigrants’use of homeland medical services. Health Place. 2010;16(1):108–15.
18. Lokdam N, Kristiansen M, Handlos LN, Norredam M. Use of healthcareservices in the region of origin among patients with an immigrantbackground in Denmark: a qualitative study of the motives. BMC HealthServ Res. 2016;16(1):99.
19. Horton S, Cole S. Medical returns: seeking health care in Mexico. Soc SciMed. 2011;72(11):1846–52.
20. Yang PQ, Hwang SH. Explaining immigrant health service utilization: atheoretical framework. SAGE Open. 2016;6(2):1–15.
21. Miglietta A, Tartaglia S. The influence of length of stay, linguisticcompetence, and media exposure in Immigrants’ adaptation. AntimicrobAgents Chemother. 2008;55(2):623–30.
22. Su D, Pratt W, Stimpson JP, Wong R, Pagan JA. Uninsurance,underinsurance, and health care utilization in Mexico by US borderresidents. J Immigr Minor Health. 2014;16(4):607–12.
23. Jang SH. Medical transnationalism: Korean Immigrants’ medical tourism tothe home country. New York: City University of New York; 2017.
24. Kemppainen L, Kemppainen T, Skogberg N, Kuusio H, Koponen P.Immigrants’ use of health care in their country of origin: the role of socialintegration, discrimination and the parallel use of health care systems.Scand J Caring Sci. 2017:1–9. https://onlinelibrary.wiley.com/doi/abs/10.1111/scs.12499.
25. Su D, Wang D. Acculturation and cross-border utilization of health services.J Immigr Minor Health. 2012;14(4):563–9.
26. Jang SH. Factors associated with Korean Immigrants’medical tourism to thehomeland. Am J Health Behav. 2017;41(4):461.
27. Berry JW. Immigration, acculturation, and adaptation. Appl Psychol. 1997;46(1):5–34.
28. Hao Z. Measurement and theoretical perspectives of immigrant assimilationin China. Popul Res. 2012;36(3):27–37.
29. Juhua Y. Index of assimilation for rural-to-urban migrants: a further analysis ofthe conceptual framework of assimilation theory. Popul Econ. 2010;2:64–70.
30. Aday LA, Andersen R. A framework for the study of access to medical care.Health Serv Res. 1974;9(3):208–20.
31. Andersen RM. Revisiting the behavioral model and access to medical care:does it matter? J Health Soc Behav. 1995;36(1):1–10.
32. National Health and Family Planning Commission Migrant PopulationService Center. National Internal Migrant Dynamic Monitoring Survey.Beijing: National Health and Family Planning Commission MigrantPopulation Data Center edn.; 2014. http://www.chinaldrk.org.cn/wjw/#/data/classify/population/yearList.
33. Chen W, Zhang Q, Renzaho AM, Zhou F, Zhang H, Ling L. Social healthinsurance coverage and financial protection among rural-to-urban internalmigrants in China: evidence from a nationally representative cross-sectionalstudy. BMJ Global Health. 2017;2(4):e000477.
34. Wang PA. Collection of data from 2014 migrant population dynamicmonitoring survey in China. Beijing: China population publishing house; 2016.
35. National Health and Family Planning Commission of China. National internalmigrant dynamic monitoring survey data users guide. Beijing: NationalHealth and Family Planning Commission of China; 2014.
36. Zhang X, Yu B, He T, Wang P. Status and determinants of health servicesutilization among elderly migrants in China. Global Health Res Policy. 2018;3(1):8.
37. Song XL, Zou GY, Shi JR, Lin YW, Ling L. Health service utilization of internalmigrants in Guangdong province:from the family migration perspective.Modern Prev Med. 2017;44(8):1454-69.
38. Zhao X, Ming DY, Ma WJ. Utilization and cost of outpatient care and theirinfluencing factors among middle and aged peasant-workers in China.Beijing Da Xue Xue Bao. 2015;47(3):464–8.
39. Zhou C, Ji C, Chu J, Medina A, Li C, Jiang S, Zheng W, Liu J, Rozelle S. Non-use of health care service among empty-nest elderly in Shandong, China: across-sectional study. BMC Health Serv Res. 2015;15:294.
Peng and Ling BMC Public Health (2019) 19:86 Page 16 of 16