Embed Size (px)
Citation preview

Original Investigation | Public Health
Association of Longitudinal Patterns of Habitual Sleep DurationWith Risk of Cardiovascular Events and All-Cause MortalityYun-He Wang, MD; Jing Wang, PhD; Shuo-Hua Chen, MD; Jin-Qiao Li, MD; Qing-Dong Lu, MD; Michael V. Vitiello, PhD; Feng Wang, MD; Xiang-Dong Tang, PhD;Jie Shi, PhD; Lin Lu, PhD; Shou-Ling Wu, MD; Yan-Ping Bao, PhD
Abstract
IMPORTANCE Single self-reported measures of sleep duration are associated with adverse healthoutcomes; however, long-term patterns of self-reported sleep duration and their association withcardiovascular events (CVEs) and all-cause mortality remain unknown.
OBJECTIVE To determine whether trajectories of long-term vs single-measure sleep duration areassociated with subsequent risk of CVEs and all-cause mortality.
DESIGN, SETTING, AND PARTICIPANTS The Kailuan study is a prospective, population-basedcohort study that began in 2006. The present cohort included 52 599 Chinese adults without atrialfibrillation, myocardial infarction, stroke, or cancer to 2010. Trajectories in sleep duration fromJanuary 1, 2006, to December 31, 2010, were identified to investigate the association with risk ofCVEs and all-cause mortality from January 1, 2010, to December 31, 2017. Data analysis wasconducted from July 1 to October 31, 2019.
EXPOSURES Habitual self-reported nocturnal sleep durations were collected in 2006, 2008, and2010. Trajectories in sleep duration for 4 years were identified by latent mixture modeling.
MAIN OUTCOMES AND MEASURES All-cause mortality and first incident CVEs (atrial fibrillation,myocardial infarction, and stroke) from 2010 to 2017 were confirmed by medical records. Based onthe baseline sleep duration and patterns over time, 4 trajectories were categorized (normal stable,normal decreasing, low increasing, and low stable).
RESULTS Of the 52 599 adults included in the study (mean [SD] age at baseline, 52.5 [11.8] years),40 087 (76.2%) were male and 12 512 (23.8%) were female. Four distinct 4-year sleep durationtrajectory patterns were identified: normal stable (range, 7.4 to 7.5 hours [n = 40 262]), normaldecreasing (mean decrease from 7.0 to 5.5 hours [n = 8074]), low increasing (mean increase from4.9 to 6.9 hours [n = 3384]), and low stable (range, 4.2 to 4.9 hours [n = 879]). During a mean (SD)follow-up of 6.7 (1.1) years, 2361 individuals died and 2406 had a CVE. Compared with the normal-stable pattern and adjusting for potential confounders, a low-increasing pattern was associated withincreased risk of first CVEs (hazard ratio [HR], 1.22; 95% CI, 1.04-1.43), a normal-decreasing patternwas associated with increased risk of all-cause mortality (HR, 1.34; 95% CI, 1.15-1.57), and thelow-stable pattern was associated with the highest risk of CVEs (HR, 1.47; 95% CI, 1.05-2.05) anddeath (HR, 1.50; 95% CI, 1.07-2.10).
CONCLUSIONS AND RELEVANCE In this study, sleep duration trajectories with lower or unstablepatterns were significantly associated with increased risk of subsequent first CVEs and all-causemortality. Longitudinal sleep duration patterns may assist in more precise identification of different
(continued)
Key PointsQuestion Are longitudinal patterns of
habitual sleep duration associated with
subsequent risk of cardiovascular events
and all-cause mortality?
Findings In this cohort study that
included 52 599 participants, 4 distinct
sleep duration trajectories reported
during a 4-year interval were identified.
Compared with a stable sleep duration
of 7.0 to 8.0 hours per night, normal-
decreasing and low-increasing patterns
were associated with increased risk of
first cardiovascular events and all-cause
mortality, respectively; individuals
reporting consistently sleeping less than
5.0 hours per night had the highest risk.
Meaning This study suggests that sleep
duration trajectories with lower or
unstable patterns may be associated
with increased risk of subsequent first
cardiovascular events and all-cause
mortality.
+ Supplemental content
Author affiliations and article information arelisted at the end of this article.
Open Access. This is an open access article distributed under the terms of the CC-BY License.
JAMA Network Open. 2020;3(5):e205246. doi:10.1001/jamanetworkopen.2020.5246 (Reprinted) May 22, 2020 1/15
Downloaded From: https://jamanetwork.com/ on 01/03/2022

Abstract (continued)
at-risk groups for possible intervention. People reporting consistently sleeping less than 5 hours pernight should be regarded as a population at higher risk for CVE and mortality.
JAMA Network Open. 2020;3(5):e205246. doi:10.1001/jamanetworkopen.2020.5246
Introduction
Both short and long sleep durations are associated with an increased risk of cardiovascular events(CVEs) and all-cause mortality, as well as related risk factors such as hypertension, diabetes, andobesity.1,2 However, the evidence supporting these associations is based on single baseline measuresof sleep durations, and the effect of longitudinal sleep duration patterns remains unknown.Nevertheless, it was reasonable to expect that habitual sleep duration might change over time,particularly in a population of older adults.3 In addition, despite varying by country, sleep durationshows secular trends of reduction or increase,4 and a single measure may bias the true associationbetween habitual sleep duration and adverse health outcomes. A recent study5 found that long andunstable trajectories of weekly napping duration are related to an increased risk of obesity andhypertension, although this association was not significant in terms of mean napping duration. Inaddition, a laboratory study6 suggested that a repeating pattern of insufficient sleep may lead tolong-term metabolic changes that cannot be effectively mitigated by weekend recovery sleep. Thesefindings highlight the importance of examining the effect of long-term patterns of sleep durationbeyond single or mean measures, which fail to consider the effect of change in sleep duration overtime. Because sleep duration may not be a stable trait, measuring sleep duration over time wouldbetter characterize the association of interest. Moreover, few previous studies adequately accountfor the concurrent changes in other risk factors, such as blood pressure and body mass index, thatmay confound the association between sleep duration and adverse health outcomes. To ourknowledge, whether trajectories of long-term vs single-measure sleep duration are associated withCVEs and all-cause mortality has not been studied in any large population.
Therefore, we investigated the association between trajectory patterns of self-reported,nocturnal sleep duration, derived from 3 repeated measures during a 4-year interval, and the risk ofsubsequent incident CVEs and all-cause mortality in a large prospective cohort. For comparison, wealso assessed the association of a single sleep measure at baseline and cumulative mean sleepduration during the 4-year interval on the risk of developing CVEs and mortality. We hypothesizedthat multiple trajectories of sleep duration exist within the population and that in comparison with apattern in which individuals report adequate duration of sleep across 4 years, extreme or unstablepatterns are associated with increased risk of CVEs and all-cause mortality during a subsequent7-year follow-up.
Methods
Study PopulationThe Kailuan study is an ongoing community-based prospective cohort study designed to investigatethe risk factors for cardiac, cerebrovascular, and related diseases, as detailed elsewhere.7,8 Briefly,in 2006 to 2007 (referred to as the 2006 survey), 101 510 participants (81 110 men and 20 400women) aged 18 to 98 years were recruited from the Kailuan community in Tangshan, China. Allparticipants completed a face-to-face questionnaire survey (including demographic characteristics,medical comorbidity, medical history, medication use, and lifestyle factors, including measures ofsleep), clinical examinations, and laboratory tests. Subsequently, participants were followed upbiennially to update the data, and outcome events were recorded annually until death or December31, 2017, whichever came first. In the current study, we included 57 927 individuals who participated
JAMA Network Open | Public Health Association of Habitual Sleep Duration Patterns With Risk of Cardiovascular Events and Mortality
JAMA Network Open. 2020;3(5):e205246. doi:10.1001/jamanetworkopen.2020.5246 (Reprinted) May 22, 2020 2/15
Downloaded From: https://jamanetwork.com/ on 01/03/2022

in all 3 surveys in 2006, 2008, and 2010. We excluded participants without reported sleep durationin 2006, 2008, and 2010. We also excluded participants who died from 2006 to 2010 and thosewith a diagnosis of CVEs or cancer to 2010 to minimize reverse causality. Self-reported sleep durationtrajectories were modeled among the remaining 52 599 participants with reports of sleep durationin surveys of 2006, 2008, and 2010 and used to assess association with incident CVEs and all-causemortality after 2010 (a flowchart of participant inclusion appears in eFigure 1 in the Supplement).
This research was conducted according to the guidelines of the World Medical AssociationDeclaration of Helsinki9 and was approved by the ethics committee of the Kailuan General Hospital.All the participants gave written informed consent. This study followed the Strengthening theReporting of Observational Studies in Epidemiology (STROBE) reporting guideline for cohort studies.
Assessment of Sleep DurationSubjective, habitual, nighttime sleep duration was biennially collected during face-to-face interviewby the question, “On average, how many hours of sleep have you gotten per night in the preceding 12months?” In our main analysis, we identified sleep duration trajectories based on the repeatedmeasurement of sleep duration in 2006, 2008, and 2010. We also examined the effects of the singlemeasure of sleep duration in 2010 and the cumulative mean sleep duration from January 1, 2006, toDecember 31, 2010, on subsequent risk of CVEs and all-cause mortality from January 1, 2010, toDecember 31, 2017, on subsequent risk of mortality. The American Heart Association recommends 7to 9 hours of sleep per night for cardiometabolic health.10 Likewise, 7 to 9 hours was consideredappropriate sleep duration for adults, and 7 to 8 hours for older adults, by the National SleepFoundation.11 Using the evidence-based recommendations and previous studies, we grouped the2010 and mean sleep durations into 5 groups (<6 hours as very short sleep duration; 6 to <7 hours asshort sleep duration; 7 to <8 hours as reference; 8 to <9 hours as long sleep duration; and �9 hoursas very long sleep duration). We also collected snoring status by asking “Do you generally snore whenyou sleep?” with response categories of never/rarely, occasionally, and frequently at the 2010 survey.
Assessment of CVEs and DeathThe primary outcomes included all-cause mortality and first incident CVEs (fatal or nonfatal CVEs,including atrial fibrillation, myocardial infarction, and stroke). Death information was collected fromthe vital statistics offices. Physician-diagnosed CVEs and history of CVEs was annually collected from4 complementary sources: (1) the Municipal Social Insurance Institution, which covered all theparticipants; (2) Discharge Register centers from 11 affiliated hospitals; (3) death certificates; and (4)biennial interview since 2006. All potential CVEs identified by the code from the InternationalStatistical Classification of Diseases and Related Health Problems, Tenth Revision, or questionnairewere ascertained and validated by a committee of 3 cardiologists and radiologists, blind to studydesign. Atrial fibrillation was diagnosed based on standard 12-lead electrocardiographic findings readby specialists. Myocardial infarction was diagnosed in accordance with the World HealthOrganization’s Multinational Monitoring of Trends and Determinants in Cardiovascular Disease(MONICA) criteria12 on the basis of clinical symptoms and dynamic changes in cardiac enzyme levelsand electrocardiography. Fatal cases of myocardial infarction, including sudden cardiac deaths dueto cardiac arrest, were confirmed by medical record, autopsy report, or death certificate listingcoronary heart disease or myocardial infarction as cause of death. Stroke was diagnosed according tothe World Health Organization criteria13 based on symptoms and neuroimages from computedtomography or magnetic resonance imaging scans of the brain and autopsy reports. Fatal strokeswere confirmed by record, cerebral autopsy, and death certificate with stroke as cause of death.Nonfatal strokes were defined as the sudden onset of focal neurological deficit with a vascularmechanism lasting more than 24 hours. In the present study, we examined 2 main subtypes of stroke:cerebral infarction and intracerebral hemorrhage (not including epidural, subdural, or subarachnoidhemorrhage).
JAMA Network Open | Public Health Association of Habitual Sleep Duration Patterns With Risk of Cardiovascular Events and Mortality
JAMA Network Open. 2020;3(5):e205246. doi:10.1001/jamanetworkopen.2020.5246 (Reprinted) May 22, 2020 3/15
Downloaded From: https://jamanetwork.com/ on 01/03/2022

Assessment of Potential CovariatesData on demographic characteristics (eg, age, sex, educational attainment, income level, occupation,family history, and marital status), medical comorbidities (eg, diabetes, hypertension,hyperlipidemia), medication use (eg, antihypertensives, hypoglycemics, and agents to lower lipidlevels), and lifestyle factors (eg, smoking status, drinking status, physical activity, and habitual saltintake) were collected via questionnaire during the 2010 survey. Anthropomorphic parameters suchas height, weight, and waist and hip circumference were measured by trained nurses. Blood pressurewas measured 3 times in a seated position using a mercury sphygmomanometer, as detailedelsewhere.8 The mean value of the multiple blood pressure measures was used for analysis. Bodymass index was calculated as the weight in kilograms divided by the height in square meters. Fastingblood samples (>12 hours) were collected and analyzed in the laboratory of Kailuan General Hospitalto obtain biochemical parameters, including levels of fasting blood glucose, high-sensitivityC-reactive protein, and creatine. Estimated glomerular filtration rate was calculated using the ChronicKidney Disease Epidemiology Collaboration creatine equation.14
Statistical AnalysisData analysis was conducted from July 1 to October 31, 2019. Latent mixture models were fit toidentify subgroups that share the similar underlying trajectories of sleep duration.15 We estimatedmultiple trajectories using the censored normal model, which is appropriate for continuousoutcomes. We tested models with varied numbers and forms (eg, intercept, linear, or quadraticslope) of potential patterns. Model fit was assessed using the Bayesian information criterion. Weinitiated models with 5 classes and all trajectory classes in quadratic form, then compared theBayesian information criterion with models with 4, 3, 2, and 1 classes. The models with 4 classesidentified fit best, and we then compared the Bayesian information criterion of models with differentfunctional forms. Finally, the model had 3 classes with linear order terms and 1 class with up to aquadratic order term. We also calculated the mean posterior estimated probability of final groupmembership to test discrimination. Person-years for each participant were calculated from thecompletion date of the 2010 survey until date of incident CVEs, death, loss to follow-up (1778 of52 599 [3.4%]), or December 31, 2017, whichever occurred first. Cox proportional hazards regressionmodels were used to estimate the association between exposures (eg, sleep duration trajectories,single measure in 2010, and cumulative mean during 2006-2010) and the risk of incident CVEs andall-cause mortality. The adjusted models included baseline sleep duration in 2010, age, sex, maritalstatus, occupation, income level, educational attainment, smoking and drinking status, salt intake,family history of stroke and myocardial infarction, diabetes (defined as a self-reported physician-diagnosed history, currently taking hypoglycemic medication, or a fasting blood glucoseconcentration �126 mg/dL [to convert to millimoles per liter, multiply by 0.0555]), hypertension(defined as a self-reported physician-diagnosed history, systolic blood pressure �140 mm Hg ordiastolic blood pressure �90 mm Hg, or currently using antihypertensives), snoring status, andmean body mass index, systolic and diastolic blood pressure, estimated glomerular filtration rate,fasting blood glucose level, and high-sensitivity C-reactive protein level during 2006 to 2010.Potential confounders were selected based on a priori knowledge of factors associated with sleepduration and the risk of death and CVEs. Proportional hazards assumptions were assessed with testsbased on Schoenfeld residuals and log-log inspection, and no variables violated the assumption.
Stratified analyses by sex, age (<65 vs �65 years), hypertension (yes vs no), diabetes (yes vsno), kidney function (estimated glomerular filtration rate <60 vs �60 mL/min/1.73 m2), and bodymass index (calculated as weight in kilograms divided by height in meters squared; <25.0 vs �25.0kg/m2) were performed to examine potential statistical interaction. Given the concern of reversecausality, we reexamined the effect of sleep duration trajectories after excluding participants whodeveloped CVEs or died in the first 2 years of follow-up. In addition, to correct the effect of sleepapnea, we performed sensitivity analyses by exclusion of those with self-reported snoring.Considering the effects of shift work, we also removed potential shift workers. To rule out the effect
JAMA Network Open | Public Health Association of Habitual Sleep Duration Patterns With Risk of Cardiovascular Events and Mortality
JAMA Network Open. 2020;3(5):e205246. doi:10.1001/jamanetworkopen.2020.5246 (Reprinted) May 22, 2020 4/15
Downloaded From: https://jamanetwork.com/ on 01/03/2022

of weight change and fatigue, we further excluded those who developed cancer during follow-up.Because atrial fibrillation is not generally considered a CVE, we reanalyzed the data without includingatrial fibrillation in outcomes. We also adjusted for sleep duration in 2006 to examine whether theassociation between sleep duration trajectories and CVEs or mortality was attributed to the singlemeasure of sleep duration. All analyses were performed using SAS software, version 9.4 (SASInstitute, Inc), and 2-sided P < .05 indicated significance.
Results
During the 3-survey rounds in 2006, 2008, and 2010, 101 510 individuals participated in at least 1survey, 86 615 in more than 1 survey, and 57 927 in all 3 surveys. This last group formed the studysample. We excluded 2978 participants without reported sleep duration, 885 who died during 2006to 2010, and 1465 participants with a diagnosis of CVE or cancer to 2010. Those participants whowere excluded owing to missing sleep duration data were older (mean [SD] age, 57.7 [12.0] vs 49.0[11.8] years; P < .001) and more likely to be female (724 [24.3%] vs 12 571 [23.9%]; P < .001) but hadsimilar future risk of CVEs (age- and sex-adjusted hazard ratio [HR], 0.95; 95% CI, 0.81-1.12) andmortality (age- and sex-adjusted HR, 1.09; 95% CI, 0.95-1.25), relative to those with 3 completedsleep duration data sets. Of the 52 599 participants finally included in the study (mean [SD] age atbaseline, 52.5 [11.8] years), 40 087 (76.2%) were male and 12 512 (23.8%) were female. Four discretetrajectories in sleep duration during the 4-year span were identified (Figure): 40 262 participants(76.5%) maintained normal sleep duration throughout (normal-stable group; mean range, 7.4 to 7.5hours); 879 (1.7%) had relatively short sleep duration throughout (low-stable group; mean range, 4.2to 4.9 hours); 8074 (15.4%) started with normal levels and experienced a decrease in sleep duration(normal-decreasing group; mean sleep duration decrease, 7.0 to 5.5 hours); and 3384 (6.4%) startedwith short sleep duration and experienced an increase in sleep duration (low-increasing group; meansleep duration increase, 4.9 to 6.9 hours). Mean (SD) probabilities for each individual being in thefinal group membership ranged from 0.70 (0.15) to 0.91 (0.13) across the trajectory groups. The basiccharacteristics of participants in 2010 by sleep duration trajectories are shown in Table 1.
During 352 413 person-years of follow-up (mean [SD] follow-up, 6.7 [1.1] years), a total of 4418participants died (n = 2361) or had a CVE (n = 2406). Sleep duration trajectories were significantlyassociated with the risk of CVEs and all-cause mortality (Table 2). Compared with the normal-stablegroup, who maintained a sleep duration of 7.0 to 8.0 hours per night for 4 years, low-stable andlow-increasing patterns were significantly associated with higher risk of first CVEs after adjustmentfor potential confounders. Adjusted HRs of CVEs were 1.22 (95% CI, 1.04-1.43) for the low-increasingpattern, 1.13 (95% CI, 0.97-1.32) for the normal-decreasing pattern, and 1.47 (95% CI, 1.05-2.05) forthe low-stable pattern. Relative to the normal-stable group, risk of all-cause mortality was
Figure. Sleep Duration Trajectories During 2006 to 2010 in Kailuan Study
2006 2008 2010
8
7
Slee
p du
ratio
n, h
Time, y
6
5
4
Normal stable (40 262)
Low increasing (3384)
Normal decreasing (8074)
Low stable (879)
The normal-stable sleep duration pattern ranged from7.4 to 7.5 hours per night; low-increasing pattern, meanincrease from 4.9 to 6.9 hours per night; normal-decreasing pattern, mean decrease from 7.0 to 5.5hours per night; and low-stable pattern, range of 4.9 to4.2 hours per night.
JAMA Network Open | Public Health Association of Habitual Sleep Duration Patterns With Risk of Cardiovascular Events and Mortality
JAMA Network Open. 2020;3(5):e205246. doi:10.1001/jamanetworkopen.2020.5246 (Reprinted) May 22, 2020 5/15
Downloaded From: https://jamanetwork.com/ on 01/03/2022
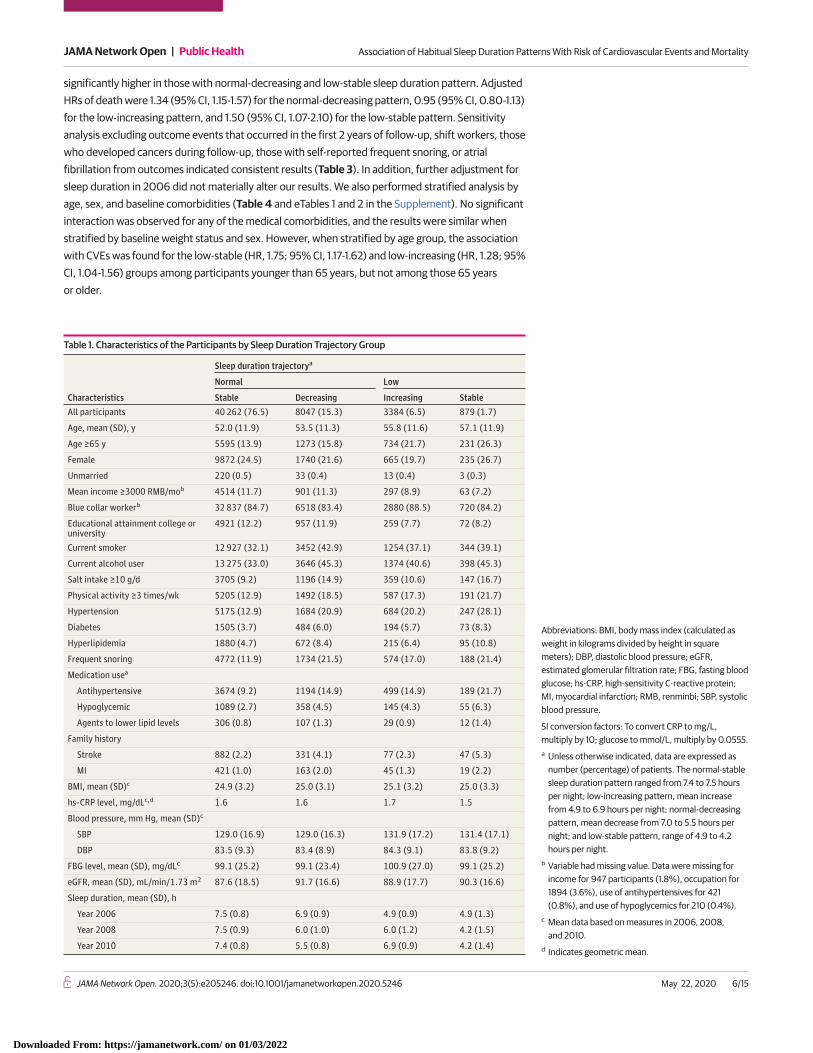
significantly higher in those with normal-decreasing and low-stable sleep duration pattern. AdjustedHRs of death were 1.34 (95% CI, 1.15-1.57) for the normal-decreasing pattern, 0.95 (95% CI, 0.80-1.13)for the low-increasing pattern, and 1.50 (95% CI, 1.07-2.10) for the low-stable pattern. Sensitivityanalysis excluding outcome events that occurred in the first 2 years of follow-up, shift workers, thosewho developed cancers during follow-up, those with self-reported frequent snoring, or atrialfibrillation from outcomes indicated consistent results (Table 3). In addition, further adjustment forsleep duration in 2006 did not materially alter our results. We also performed stratified analysis byage, sex, and baseline comorbidities (Table 4 and eTables 1 and 2 in the Supplement). No significantinteraction was observed for any of the medical comorbidities, and the results were similar whenstratified by baseline weight status and sex. However, when stratified by age group, the associationwith CVEs was found for the low-stable (HR, 1.75; 95% CI, 1.17-1.62) and low-increasing (HR, 1.28; 95%CI, 1.04-1.56) groups among participants younger than 65 years, but not among those 65 yearsor older.
Table 1. Characteristics of the Participants by Sleep Duration Trajectory Group
Characteristics
Sleep duration trajectorya
Normal Low
Stable Decreasing Increasing StableAll participants 40 262 (76.5) 8047 (15.3) 3384 (6.5) 879 (1.7)
Age, mean (SD), y 52.0 (11.9) 53.5 (11.3) 55.8 (11.6) 57.1 (11.9)
Age ≥65 y 5595 (13.9) 1273 (15.8) 734 (21.7) 231 (26.3)
Female 9872 (24.5) 1740 (21.6) 665 (19.7) 235 (26.7)
Unmarried 220 (0.5) 33 (0.4) 13 (0.4) 3 (0.3)
Mean income ≥3000 RMB/mob 4514 (11.7) 901 (11.3) 297 (8.9) 63 (7.2)
Blue collar workerb 32 837 (84.7) 6518 (83.4) 2880 (88.5) 720 (84.2)
Educational attainment college oruniversity
4921 (12.2) 957 (11.9) 259 (7.7) 72 (8.2)
Current smoker 12 927 (32.1) 3452 (42.9) 1254 (37.1) 344 (39.1)
Current alcohol user 13 275 (33.0) 3646 (45.3) 1374 (40.6) 398 (45.3)
Salt intake ≥10 g/d 3705 (9.2) 1196 (14.9) 359 (10.6) 147 (16.7)
Physical activity ≥3 times/wk 5205 (12.9) 1492 (18.5) 587 (17.3) 191 (21.7)
Hypertension 5175 (12.9) 1684 (20.9) 684 (20.2) 247 (28.1)
Diabetes 1505 (3.7) 484 (6.0) 194 (5.7) 73 (8.3)
Hyperlipidemia 1880 (4.7) 672 (8.4) 215 (6.4) 95 (10.8)
Frequent snoring 4772 (11.9) 1734 (21.5) 574 (17.0) 188 (21.4)
Medication usea
Antihypertensive 3674 (9.2) 1194 (14.9) 499 (14.9) 189 (21.7)
Hypoglycemic 1089 (2.7) 358 (4.5) 145 (4.3) 55 (6.3)
Agents to lower lipid levels 306 (0.8) 107 (1.3) 29 (0.9) 12 (1.4)
Family history
Stroke 882 (2.2) 331 (4.1) 77 (2.3) 47 (5.3)
MI 421 (1.0) 163 (2.0) 45 (1.3) 19 (2.2)
BMI, mean (SD)c 24.9 (3.2) 25.0 (3.1) 25.1 (3.2) 25.0 (3.3)
hs-CRP level, mg/dLc,d 1.6 1.6 1.7 1.5
Blood pressure, mm Hg, mean (SD)c
SBP 129.0 (16.9) 129.0 (16.3) 131.9 (17.2) 131.4 (17.1)
DBP 83.5 (9.3) 83.4 (8.9) 84.3 (9.1) 83.8 (9.2)
FBG level, mean (SD), mg/dLc 99.1 (25.2) 99.1 (23.4) 100.9 (27.0) 99.1 (25.2)
eGFR, mean (SD), mL/min/1.73 m2 87.6 (18.5) 91.7 (16.6) 88.9 (17.7) 90.3 (16.6)
Sleep duration, mean (SD), h
Year 2006 7.5 (0.8) 6.9 (0.9) 4.9 (0.9) 4.9 (1.3)
Year 2008 7.5 (0.9) 6.0 (1.0) 6.0 (1.2) 4.2 (1.5)
Year 2010 7.4 (0.8) 5.5 (0.8) 6.9 (0.9) 4.2 (1.4)
Abbreviations: BMI, body mass index (calculated asweight in kilograms divided by height in squaremeters); DBP, diastolic blood pressure; eGFR,estimated glomerular filtration rate; FBG, fasting bloodglucose; hs-CRP, high-sensitivity C-reactive protein;MI, myocardial infarction; RMB, renminbi; SBP, systolicblood pressure.
SI conversion factors: To convert CRP to mg/L,multiply by 10; glucose to mmol/L, multiply by 0.0555.a Unless otherwise indicated, data are expressed as
number (percentage) of patients. The normal-stablesleep duration pattern ranged from 7.4 to 7.5 hoursper night; low-increasing pattern, mean increasefrom 4.9 to 6.9 hours per night; normal-decreasingpattern, mean decrease from 7.0 to 5.5 hours pernight; and low-stable pattern, range of 4.9 to 4.2hours per night.
b Variable had missing value. Data were missing forincome for 947 participants (1.8%), occupation for1894 (3.6%), use of antihypertensives for 421(0.8%), and use of hypoglycemics for 210 (0.4%).
c Mean data based on measures in 2006, 2008,and 2010.
d Indicates geometric mean.
JAMA Network Open | Public Health Association of Habitual Sleep Duration Patterns With Risk of Cardiovascular Events and Mortality
JAMA Network Open. 2020;3(5):e205246. doi:10.1001/jamanetworkopen.2020.5246 (Reprinted) May 22, 2020 6/15
Downloaded From: https://jamanetwork.com/ on 01/03/2022

A U-shaped association of single sleep duration in 2010 with CVEs and death is shown ineFigure 2 in the Supplement. Participants with sleep duration of 7.0 to 8.0 hours per night had thelowest risk of all outcomes. After adjustment for potential confounders, short and long sleepdurations were associated with CVEs and death. Compared with sleeping 7.0 to less than 8.0 hoursper night, adjusted HRs for the composite outcomes were 1.24 (95% CI, 1.10-1.39) for those who sleptless than 6.0 hours per night, 1.08 (95% CI, 0.98-1.20) for those who slept 6.0 to less than 7.0 hoursper night, 1.32 (95% CI, 1.21-1.44) for those who slept 8.0 to less than 9.0 hours per night, and 1.45(95% CI, 1.13-1.87) for those who slept at least 9.0 hours per night. The results were similar for CVEsand all-cause mortality individually (eTable 3 in the Supplement). In contrast, mean sleep durationduring 2006 to 2010 was not associated with subsequent risk of CVEs. Longer sleep duration (HR for8.0 to <9.0 hours, 1.11 [95% CI, 1.00-1.23]; HR for �9 hours per night, 2.34 [95% CI, 1.46-3.72]) butnot shorter sleep duration (HR for <6 hours per night, 0.98 [95% CI, 0.84-1.14]; HR for 6 to <7 hoursper night, 0.99 [95% CI, 0.89-1.09]) was associated with the risk of all-cause mortality (eTable 4 inthe Supplement).
Table 2. Association of Sleep Duration Trajectories During 2006 to 2010With Cardiovascular Events and All-Cause Mortality
Outcome
Sleep duration trajectorya
Normal Low
Stable Decreasing Increasing StableCardiovascular events and all-cause mortality
No. of cases/person-years 3299/271 626 695/54 608 332/22 635 92/5849
Incidence rateb 1214.5 1272.7 1422.6 1572.9
Age- and sex-adjusted HR(95% CI)
1 [Reference] 1.01 (0.93-1.10) 1.03 (0.92-1.16) 1.09 (0.89-1.34)
Multivariable-adjusted HR(95% CI)c
1 [Reference] 1.25 (1.11-1.40) 1.07 (0.95-1.21) 1.48 (1.16-1.89)
Cardiovascular events
No. of cases/person-years 1793/271 945 366/54 656 197/22 658 50/5851
Incidence rateb 659.3 669.6 869.4 854.5
Age- and sex-adjusted HR(95% CI)
1 [Reference] 0.99 (0.88-1.10) 1.17 (1.01-1.36) 1.15 (0.87-1.53)
Multivariable-adjusted HR(95% CI)c
1 [Reference] 1.13 (0.97-1.32) 1.22 (1.04-1.43) 1.47 (1.05-2.05)
All-cause mortality
No. of cases/person years 1769/276 896 380/55 649 163/23 204 49/5984
Incidence rateb 638.9 682.8 702.4 818.8
Age- and sex-adjusted HR(95% CI)
1 [Reference] 1.03 (0.92-1.15) 0.89 (0.76-1.05) 1.02 (0.76-1.35)
Multivariable-adjusted HR(95% CI)c
1 [Reference] 1.34 (1.15-1.57) 0.95 (0.80-1.13) 1.50 (1.07-2.10)
Abbreviation: HR, hazard ratio.a The normal-stable sleep duration pattern ranged from 7.4 to 7.5 hours per night; low-increasing pattern, mean increase
from 4.9 to 6.9 hours per night; normal-decreasing pattern, mean decrease from 7.0 to 5.5 hours per night; andlow-stable pattern, range of 4.9 to 4.2 hours per night.
b Indicates per 100 000 person-years.c Adjusted for age, sex, marital status (single, married, or divorced), occupation (blue collar or white collar), mean income
(<50, 500-3000, or �3000 renminbi/mo), educational attainment (illiteracy or elementary, middle school, orcollege/university), physical activity (never, 1-2 times/wk, or �3 times/wk), smoking status (never, past, or current),alcohol consumption status (never, past, or current), salt intake (<6, 6-10, or >10 g/d), family history of stroke (yes or no),family history of myocardial infarction (yes or no), hypertension (yes or no), hyperlipidemia (yes or no), diabetes (yes orno), snoring frequency (never/rare, occasionally, or frequently), sleep duration in 2010, antihypertensive use (yes or no),hypoglycemic use (yes or no), use of agents to lower lipid levels (yes or no), body mass index (calculated as weight inkilograms divided by height in square meters; <18.5, 18.5 to <25.0, 25.0 to <30.0, or �30.0), fasting blood glucose level(<72, 72 to <101, 101 to <110, 110 to <126, or �126 mg/dL [to convert to mmol/L, multiply by 0.0555]), high-sensitivityC-reactive protein (<0.10, 0.10 to <0.30, 0.30 to <1.0, or �1.0 mg/dL [to convert to mg/L, multiply by 10]), systolic bloodpressure (<120, 120 to <140, or �140 mm Hg), diastolic blood pressure (<80, 80 to <90, or �90 mm Hg), and estimatedglomerular filtration rate (<30, 30 to <60, 60 to <90, or �90 mL/min/1.73 m2).
JAMA Network Open | Public Health Association of Habitual Sleep Duration Patterns With Risk of Cardiovascular Events and Mortality
JAMA Network Open. 2020;3(5):e205246. doi:10.1001/jamanetworkopen.2020.5246 (Reprinted) May 22, 2020 7/15
Downloaded From: https://jamanetwork.com/ on 01/03/2022

Discussion
The present study provides new findings suggesting that trajectories in sleep duration weresignificantly associated with the risk of the first CVEs and death, even after adjustment for a singlemeasure of baseline sleep duration, and supports conventional evidence that single measures ofsleep duration were associated with adverse health outcomes. Four heterogeneous trajectories insleep duration during a 4-year span were identified, and these patterns were associated withsubsequent risk of death and CVEs. Compared with the normal-stable duration trajectory, which isconsistent with a normal sleep pattern, low-increasing and low-stable duration trajectories were
Table 3. Sensitivity Analyses on Associations Between Sleep Duration Trajectory Group andthe First CVE and All-Cause Mortality
Outcomes
Sleep duration trajectory, HR (95% CI)a
Normal Low
Stable Decreasing Increasing StableSA1: Exclusion of participants who had events (CVEs or death) in the first 2 y of follow-up (n = 51 679)
CVEs 1 [Reference] 1.16 (0.97-1.38) 1.23(1.02-1.47) 1.39 (0.93-2.07)
Death 1 [Reference] 1.44 (1.21-1.72) 0.97 (0.81-1.18) 1.58 (1.08-2.32)
Total 1 [Reference] 1.29 (1.14-1.47) 1.07 (0.93-1.23) 1.42 (1.07-1.89)
SA2: Further adjusted for sleep duration in 2006 based on fully adjusted model
CVEs 1 [Reference] 1.12 (0.96-1.32) 1.19 (1.01-1.44) 1.42 (1.00-2.03)
Death 1 [Reference] 1.35 (1.15-1.58) 0.98 (0.80-1.20) 1.55 (1.08-2.21)
Total 1 [Reference] 1.25 (1.11-1.40) 1.08 (0.93-1.25) 1.49 (1.15-1.93)
SA3: Exclusion of shift workers (n = 50 559)b
CVEs 1 [Reference] 1.12 (0.96-1.31) 1.21 (1.03-1.42) 1.44 (1.03-2.02)
Death 1 [Reference] 1.34 (1.15-1.56) 0.95 (0.80-1.13) 1.48 (1.06-2.08)
Total 1 [Reference] 1.24 (1.10-1.39) 1.06 (0.94-1.20) 1.46 (1.14-1.86)
SA4: Exclusion of participants who developed cancers during follow-up (n = 52 425)
CVEs 1 [Reference] 1.13 (0.96-1.32) 1.22 (1.05-1.43) 1.44 (1.03-2.02)
Death 1 [Reference] 1.35 (1.16-1.58) 0.95 (0.80-1.13) 1.21 (1.07-2.11)
Total 1 [Reference] 1.25 (1.11-1.40) 1.07 (0.95-1.21) 1.47 (1.15-1.88)
SA5: Exclusion of those with self-reported frequent snoring (n = 45 331)
CVEs 1 [Reference] 1.18 (0.98-1.41) 1.19 (0.99-1.43) 1.56 (1.05-2.30)
Death 1 [Reference] 1.45 (1.21-1.73) 0.99 (0.82-1.19) 1.77 (1.21-2.58)
Total 1 [Reference] 1.34 (1.18-1.53) 1.06 (0.93-1.22) 1.72 (1.30-2.27)
SA6: Exclusion of atrial fibrillation from outcomes (n = 52 850)
CVEs 1 [Reference] 1.12 (0.95-1.31) 1.22 (1.04-1.44) 1.54 (1.09-2.17)
Death 1 [Reference] 1.34 (1.15-1.56) 0.94 (0.79-1.11) 1.55 (1.12-2.14)
Total 1 [Reference] 1.24 (1.11-1.40) 1.08 (0.95-1.22) 1.54 (1.21-1.97)
Abbreviations: CVE, cardiovascular event; HR, hazard ratio; SA, sensitivity analysis.a The normal-stable sleep duration pattern ranged from 7.4 to 7.5 hours per night; low-increasing pattern, mean increase
from 4.9 to 6.9 hours per night; normal-decreasing pattern, mean decrease from 7.0 to 5.5 hours per night; andlow-stable pattern, range of 4.9 to 4.2 hours per night. Models were adjusted for age, sex, marital status (single, married,or divorced), occupation (blue collar or white collar), mean income (<50, 500-3000, or �3000 renminbi/mo),educational attainment (illiteracy or elementary, middle school, or college/university), physical activity (never, 1-2times/wk, or �3 times/wk), smoking status (never, past, or current), alcohol consumption status (never, past, or current),salt intake (<6, 6-10, or >10 g/d), family history of stroke (yes or no), family history of myocardial infarction (yes or no),hypertension (yes or no), hyperlipidemia (yes or no), diabetes (yes or no), snoring frequency (never/rare, occasionally, orfrequently), sleep duration in 2010, antihypertensive use (yes or no), hypoglycemic use (yes or no), use of agents tolower lipid levels (yes or no), body mass index (calculated as weight in kilograms divided by height in square meters;<18.5, 18.5 to <25.0, 25.0 to <30.0, or �30.0), fasting blood glucose level (<72, 72 to <101, 101 to <110, 110 to <126, or�126 mg/dL [to convert to mmol/L, multiply by 0.0555]), high-sensitivity C-reactive protein (<.10, .10 to <.30, .30 to<1.0, or �1.0 mg/dL [to convert to mg/L, multiply by 10]), systolic blood pressure (<120, 120 to <140, or �140 mm Hg),diastolic blood pressure (<80, 80 to <90, or �90 mm Hg), and estimated glomerular filtration rate (<30, 30 to <60, 60to <90, or �90 mL/min/1.73 m2).
b Shift workers were self-reported in the 2016 survey.
JAMA Network Open | Public Health Association of Habitual Sleep Duration Patterns With Risk of Cardiovascular Events and Mortality
JAMA Network Open. 2020;3(5):e205246. doi:10.1001/jamanetworkopen.2020.5246 (Reprinted) May 22, 2020 8/15
Downloaded From: https://jamanetwork.com/ on 01/03/2022

Table 4. Association Between Sleep Duration Trajectory Groups and the Composite of First CVEs andAll-Cause Mortality, Stratified by Age, Sex, and Baseline Comorbidities
Variable
Sleep duration trajectory groupa
P value forinteraction
Normal Low
Stable Decreasing Increasing StableAge, y
<65 (n = 44 766)
.46
Incidence rateb 1967/237 614 416/46 802 170/18 133 47/4425
Fully adjusted model HR(95% CI)c
1 [Reference] 1.22(1.05-1.41)
1.12(0.95-1.33)
1.60(1.15-2.24)
≥65 (n = 7833)
Incidence rateb 1332/34 332 279/7854 162/4525 45/1423
Fully adjusted model HR(95% CI)c
1 [Reference] 1.28(1.06-1.53)
1.01(0.85-1.21)
1.39(0.97-2.00)
Sex
Male (n = 40 087)
.65
Incidence rateb 293/204 580 615/42 876 291/18 220 69/4318
Fully adjusted model HR(95% CI)c
1 [Reference] 1.24(1.10-1.41)
1.06(0.93-1.21)
1.38(1.04-1.82)
Female (n = 12 512)
Incidence rateb 366/67 357 80/11 780 41/4438 23/1533
Fully adjusted model HR(95% CI)c
1 [Reference] 1.23(0.87-1.74)
1.07(0.76-1.52)
2.03(1.14-3.61)
BMI
<25.0 (n = 27 346)
.68
Incidence rateb 1513/142 634 339/28 259 143/11 331 48/3206
Fully adjusted model HR(95% CI)c
1 [Reference] 1.32(1.11-1.56)
0.99(0.83-1.19)
1.49(1.05-2.12)
≥25.0 (n = 25253)
Incidence rateb 1786/129 293 356/26 393 189/11 321 44/2645
Fully adjusted model HR(95% CI)c
1 [Reference] 1.18(1.01-1.39)
1.13(0.96-1.33)
1.50(1.06-2.12)
Hypertension
Yes (n = 7790)
.20
Incidence rateb 732/33 668 224/11 047 113/4405 38/1602
Fully adjusted model HR(95% CI)c
1 [Reference] 1.07(0.87-1.32)
1.12(0.91-1.39)
1.35(0.91-2.01)
No (n = 44 775)
Incidence rateb 2567/238 106 470/43 564 219/18 226 54/4243
Fully adjusted model HR(95% CI)c
1 [Reference] 1.35(1.17-1.54)
1.04(0.90-1.21)
1.58(1.15-2.16)
Diabetes
Yes (n = 2256)
.15
Incidence rateb 250/9692 86/3141 29/1249 19/447
Fully adjusted model HR(95% CI)c
1 [Reference] 1.16(0.81-1.67)
0.87(0.56-1.36)
2.23(1.16-4.29)
No (n = 50 336)
Incidence rateb 3049/262 202 609/51 498 303/21 401 73/5404
Fully adjusted model HR(95% CI)c
1 [Reference] 1.26(1.11-1.42)
1.09(0.97-1.24)
1.37(1.05-1.79)
Hyperlipidemia
Yes (n = 2862)
.22
Incidence rateb 158/12 634 76/4469 20/1453 13/610
Fully adjusted model HR(95% CI)c
1 [Reference] 1.25(1.11-1.41)
1.08(0.96-1.23)
1.51(1.16-1.96)
No (n = 49 736)
Incidence rateb 3141/259 263 619/50 185 312/21 200 79/5240
Fully adjusted model HR(95% CI)c
1 [Reference] 1.17(0.79-1.72)
0.89(0.50-1.40)
1.10(0.52-2.34)
(continued)
JAMA Network Open | Public Health Association of Habitual Sleep Duration Patterns With Risk of Cardiovascular Events and Mortality
JAMA Network Open. 2020;3(5):e205246. doi:10.1001/jamanetworkopen.2020.5246 (Reprinted) May 22, 2020 9/15
Downloaded From: https://jamanetwork.com/ on 01/03/2022

associated with increased risk for CVEs, whereas low-stable and normal-decreasing trajectories wereassociated with increased risk for all-cause mortality. Participants who exhibited a low-stable sleeppattern, maintaining a nocturnal sleep duration of less than 5.0 hours during the 4-year assessmentperiod, had the highest risk of death and CVEs. A U-shaped association between single measures ofsleep duration at baseline and future adverse events was also observed. Participants with short (<6.0hours per night) and long (8.0 to <9.0 hours per night) sleep duration had increased risk of adversehealth outcomes, regardless of their earlier sleep patterns. The findings suggest that trajectories oflong-term sleep duration are associated with subsequent risk of CVEs and death besides one-offmeasures closer to the time of events.
This study is, to our knowledge, the first to investigate the association of longitudinal patternsof sleep duration with CVEs and all-cause mortality in a large prospective cohort. Previous studies ofthe association between sleep duration and health typically measured sleep duration at 1 point, fewstudies examined the effect of sleep duration change at 2 points, and none to our knowledgeconsidered the pattern of sleep duration during a prolonged period. Our results are supported by aprevious study showing that participants who experience a decrease or an increase in sleep durationmeasured at 2 phases had a higher risk of all-cause mortality.16 The present study extends thosefindings to demonstrate that not only is change of sleep duration across 2 points important, butcertain sleep duration trajectories were associated with CVEs and death. A decreasing sleep patternmay represent a progressive curtailment of sleep duration, facilitated by sleep disorders originatingfrom psychosocial causes and medical comorbidities. However, the association with death was notsignificantly altered after adjustment for sociodemographic variables, snoring frequency, and
Table 4. Association Between Sleep Duration Trajectory Groups and the Composite of First CVEs andAll-Cause Mortality, Stratified by Age, Sex, and Baseline Comorbidities (continued)
Variable
Sleep duration trajectory groupa
P value forinteraction
Normal Low
Stable Decreasing Increasing StableKidney function
eGFR<60 mL/min/1.73 m2
(n = 3314)
.60
Incidence rateb 462/18 037 51/1904 41/1334 9/226
Fully adjusted model HR(95% CI)c
1 [Reference] 1.94 (1.12-3.36)
1.15(0.74-1.77)
4.17(1.60-10.83)
eGFR≥60 mL/min/1.73 m2
(n = 49 285)Incidence rateb 2837/253 787 644/52 748 291/21 323 83/5624
Fully adjusted model HR(95% CI)c
1 [Reference] 1.22(1.08-1.37)
1.05(0.92-1.19)
1.41(1.09-1.82)
Abbreviations: BMI, body mass index (calculated as weight in kilograms divided by height in square meters); CVE,cardiovascular event; eGFR, estimated glomerular filtration rate; HR, hazard ratio.a The normal-stable sleep duration pattern ranged from 7.4 to 7.5 hours per night; low-increasing pattern, mean increase
from 4.9 to 6.9 hours per night; normal-decreasing pattern, mean decrease from 7.0 to 5.5 hours per night; andlow-stable pattern, range of 4.9 to 4.2 hours per night.
b Indicates per 100 000 person-years.c Adjusted for age, sex, marital status (single, married, or divorced), occupation (blue collar or white collar), mean income
(<50, 500-3000, or �3000 renminbi/mo), educational attainment (illiteracy or elementary, middle school, orcollege/university), physical activity (never, 1-2 times/wk, or �3 times/wk), smoking status (never, past, or current),alcohol consumption status (never, past, or current), salt intake (<6, 6-10, or >10 g/d), family history of stroke (yes or no),family history of myocardial infarction (yes or no), hypertension (yes or no), hyperlipidemia (yes or no), diabetes (yes orno), snoring frequency (never/rare, occasionally, or frequently), sleep duration in 2010, antihypertensive use (yes or no),hypoglycemic use (yes or no), use of agents to lower lipid levels (yes or no), body mass index (calculated as weight inkilograms divided by height in square meters; <18.5, 18.5 to <25.0, 25.0 to <30.0, or �30.0), fasting blood glucose level(<72, 72 to <101, 101 to <110, 110 to <126, or �126 mg/dL [to convert to mmol/L, multiply by 0.0555]), high-sensitivityC-reactive protein (<.10, .10 to <.30, .30 to <1.0, or �1.0 mg/dL [to convert to mg/L, multiply by 10]), systolic bloodpressure (<120, 120 to <140, or �140 mm Hg), diastolic blood pressure (<80, 80 to <90, or �90 mm Hg), and estimatedglomerular filtration rate (<30, 30 to <60, 60 to <90, or �90 mL/min/1.73 m2).
JAMA Network Open | Public Health Association of Habitual Sleep Duration Patterns With Risk of Cardiovascular Events and Mortality
JAMA Network Open. 2020;3(5):e205246. doi:10.1001/jamanetworkopen.2020.5246 (Reprinted) May 22, 2020 10/15
Downloaded From: https://jamanetwork.com/ on 01/03/2022

existing medical morbidity. Individuals who experienced an increasing sleep pattern may representthose who initially had inadequate sleep duration and then slept longer to compensate the sleepdebt. A recent study6 found that “sleeping in” cannot mitigate metabolic disruptions linked to sleepdeficit and may even make them worse. This finding suggests that sleep deprivation has long-termadverse consequences, which may not be ameliorated by sleep compensation. In addition, anincreasing duration sleep pattern may be simply a marker of subclinical disease, and the observedassociation with CVEs may be due to reverse causality. However, further excluding participants whohad events within the first 2 years did not alter the result.
We observed that a short-stable sleep pattern was associated with the highest risk of all-causemortality and CVEs. Similarly, findings from a working cohort17 showed that prolonged inadequatesleep duration (defined as sleep of <7.0 h/d in 2 phases 4 to 7 years apart) is associated with all-causedeath during a 25-year period. Participants who experienced the short-stable pattern may representthose with chronic sleep deprivation, including spontaneous short sleepers who stay up late andcompulsory short sleepers, such as shift workers or those with sleep problems. Further excludingpotential shift workers and those with self-reported frequent snoring resulted in similar findings,suggesting that long-term lack of sleep, per se, may have pernicious effects on health. Peoplereporting consistently sleeping 5.0 hours or less per night may be regarded as a higher-riskpopulation for CVE and mortality.
Some mechanisms may contribute to the association between chronic sleep curtailment andthe risk of CVEs and death. Evidence suggests that sleep debt has an adverse effect on carbohydratemetabolism and levels of endocrine hormones such as insulin, cortisol, and leptin, which maycontribute to the alterations of appetite and glucose metabolism and accelerate the development ofobesity and diabetes.18,19 Sleep restriction in adult men with normal habitual sleep patterns resultedin increased activity of the sympathetic nervous system, serum norepinephrine, andproinflammatory cytokines (interleukin 1β, interleukin 6, and C-reactive protein), which wereindependently associated with cardiovascular diseases and death.20,21 The mechanisms underlyingthe association between sleep extension and adverse outcomes are considered more speculative.Increased sleep duration may represent a marker of undiagnosed diseases or the effect ofuncontrolled comorbidity, such as obstructive sleep apnea, leading to the risk of mortality and CVEs.In addition, those who initially had inadequate sleep duration may have begun to sleep longer tocompensate for the sleep debt and may have developed an increased duration pattern. Evidence alsosuggests that those with a subjective long sleep pattern may have poor sleep efficiency, which wasassociated with increased risk of death.22 Further investigation is warranted to examine the potentialassociation of such increased sleep duration with health outcomes.
The findings from the present study provide unique insight into the association of long-termpatterns of sleep duration with CVEs and death. These heterogeneous trajectories may be useful todistinguish individuals at risk more accurately than single or mean measures of sleep duration. Forexample, although the association between short single-measure sleep duration and the risk of CVEsin our study replicated findings from previous evidence,23,24 we found the low-increasing patternbut not the normal-decreasing pattern was associated with the risk of CVEs. Moreover, thoseparticipants with patterns of short to increasing sleep still tended to have increased risk despiteapparently improving their sleep duration, indicating the lack of sleep may have long-term adverseconsequences and the importance of stable adequate sleep. In contrast, shorter mean sleep durationduring the 4-year interval was not associated with the risk of all-cause mortality. Charting thetrajectories of sleep duration in association with health outcomes may reveal additional informationthat cannot be captured by single or mean measurement. The better understanding of the effectand timing of change in sleep duration may help to identify populations with higher risk who can thenbe targeted with interventions to promote cardiovascular health and healthy sleep.
JAMA Network Open | Public Health Association of Habitual Sleep Duration Patterns With Risk of Cardiovascular Events and Mortality
JAMA Network Open. 2020;3(5):e205246. doi:10.1001/jamanetworkopen.2020.5246 (Reprinted) May 22, 2020 11/15
Downloaded From: https://jamanetwork.com/ on 01/03/2022

Strengths and LimitationsThe strengths of the present study include using longitudinal assessment of habitual sleep durationto examine the association of long-term sleep patterns with CVEs and mortality in a large community-based population. We also adjusted for mean body mass index, blood pressure, concentrations offasting blood glucose and high-sensitivity C-reactive protein and estimated glomerular filtration ratebased on 3 measures of these biomarkers across 4 years, as well as other cardiovascular risk factors,which may greatly reduce unmeasured residual confounding.
Several limitations of this study are worth noting. First, our cohort only included Chinese adultsfrom the Kailuan community, and most were male; therefore, findings may not be generalizable toother populations. However, similar associations between habitual sleep duration and the risk ofCVEs and mortality have been observed in individuals from multiple geographic regions withdifferent cultural backgrounds and income levels, suggesting the broad, generalizable nature of thedata.23,25 Second, potential bias might occur by using self-reported sleep duration as a substitute forobjective measures of sleep duration. However, the use of objective methods (eg, polysomnography)may not be feasible in large studies of a general population. Previous studies have shown thatsubjective estimates of sleep duration and sleep parameters monitored by actigraphy andpolysomnography are highly correlated.26,27 Importantly, sleep patterns were identified based onrepeated measures over time, which may reduce misclassification. Third, the lack of otherdimensions of sleep, such as sleep disorders (eg, sleep apnea and insomnia), daytime nap duration,and sleep quality, further limit investigation. We attempted to correct for sleep disorders by exclusionof individuals with frequent snoring and shift workers, which left the results unchanged. Daytimenap duration, as a compensation for sleep debt during the night or a habitual behavior, may furtherinfluence the risk of CVEs in individuals with specific nocturnal sleep duration.23 Although sleepquality also has been associated with the risk of adverse outcomes,10,24 previous studies28 reporteda strong association of a sleep duration of 7 to 8 hours with better sleep quality, and we intended tofocus on the duration of sleep because it is more likely to be a modifiable factor than sleep quality.28
Further studies with detailed sleep parameters are needed to replicate our findings. In addition,despite statistical adjustment for multiple potential covariates, residual confounding and reversecausality cannot be ruled out, and results should be interpreted with caution.
Conclusions
Altogether, the findings of this study provide new insights for the association of habitual sleepduration with CVEs and mortality, highlighting the importance of the temporal rather than staticbehavior of sleep duration. Sleep duration trajectories with lower or unstable patterns weresignificantly associated with increased risk of subsequent first CVEs and all-cause mortality.Additional studies are warranted to confirm the utility of specific sleep duration trajectories in riskprediction and to explore the effect of lifestyle modification and intervention on sleep trajectoriesand associated outcomes in routine clinical practice and public health settings.
ARTICLE INFORMATIONAccepted for Publication: March 11, 2020.
Published: May 22, 2020. doi:10.1001/jamanetworkopen.2020.5246
Open Access: This is an open access article distributed under the terms of the CC-BY License. © 2020 Wang Y-Het al. JAMA Network Open.
Corresponding Authors: Yan-Ping Bao, PhD, National Institute on Drug Dependence and Beijing Key Laboratoryof Drug Dependence, Peking University, 38 Xueyuan Rd, Beijing 100191, China ([email protected]); Shou-LingWu, MD, Department of Cardiology, Kailuan General Hospital, 57 Xinhua East Rd, Tangshan 063000, China([email protected]); Lin Lu, PhD, Institute of Mental Health, National Clinical Research Center for Mental Disorders,
JAMA Network Open | Public Health Association of Habitual Sleep Duration Patterns With Risk of Cardiovascular Events and Mortality
JAMA Network Open. 2020;3(5):e205246. doi:10.1001/jamanetworkopen.2020.5246 (Reprinted) May 22, 2020 12/15
Downloaded From: https://jamanetwork.com/ on 01/03/2022

Key Laboratory of Mental Health and /Peking University Sixth Hospital, Peking University, 51 HuayuanBei Rd,Beijing 100191, China ([email protected]).
Author Affiliations: National Institute on Drug Dependence and Beijing Key Laboratory of Drug Dependence,Peking University, Beijing, China (Y.-H. Wang, Q.-D. Lu, Shi, Bao); School of Public Health, Peking University, Beijing,China (Y.-H. Wang, Q.-D. Lu, Bao); Peking University Medical Informatics Center, Peking University, Beijing, China(J. Wang); Health Care Center, Kailuan Medical Group, Tangshan, China (Chen, Li); Department of Psychiatry andBehavioral Sciences, University of Washington, Seattle (Vitiello); Chinese Center for Health Education, Beijing,China (F. Wang); Sleep Medicine Center, Department of Respiratory and Critical Care Medicine, Mental HealthCenter and Translational Neuroscience Center, State Key Laboratory of Biotherapy, West China Hospital, SichuanUniversity, Chengdu, China (Tang); Institute of Mental Health, National Clinical Research Center for MentalDisorders, Key Laboratory of Mental Health and Peking University Sixth Hospital, Peking University, Beijing, China(L. Lu); Peking-Tsinghua Center for Life Sciences and International Data Group/McGovern Institute for BrainResearch, Peking University, Beijing, China (L. Lu); Department of Cardiology, Kailuan General Hospital, Tangshan,China (Wu).
Author Contributions: Drs Wu and Bao had full access to all the data in the study and take responsibility for theintegrity of the data and the accuracy of the data analysis. Drs Y-H. Wang and J. Wang and Drs L. Lu, Wu, and Baocontributed equally to the study.
Concept and design: Y.-H. Wang, J. Wang, F. Wang, Shi, L. Lu, Wu, Bao.
Acquisition, analysis, or interpretation of data: Y.-H. Wang, J. Wang, Chen, Li, Q.-D. Lu, Vitiello, F. Wang, Tang, L. Lu,Wu, Bao.
Drafting of the manuscript: Y.-H. Wang, J. Wang, F. Wang, Tang, Wu.
Critical revision of the manuscript for important intellectual content: Y.-H. Wang, Chen, Li, Q.-D. Lu, Vitiello, F. Wang,Shi, L. Lu, Wu, Bao.
Statistical analysis: Y.-H. Wang, J. Wang, Chen, F. Wang, Wu, Bao.
Obtained funding: L. Lu, Bao.
Administrative, technical, or material support: J. Wang, F. Wang, L. Lu, Bao.
Supervision: Tang, Shi, L. Lu, Bao.
Conflict of Interest Disclosures: None reported.
Funding/Support: This study was supported by grant 2019YFA0706200 from the National Key Research andDevelopment Program of China and grant 81761128036 from the National Natural Science Foundation of China–Canadian Institutes of Health Research Joint Health Research Program.
Role of the Funder/Sponsor: The sponsors had no role in the design and conduct of the study; collection,management, analysis, and interpretation of the data; preparation, review, or approval of the manuscript; anddecision to submit the manuscript for publication.
REFERENCES1. Jike M, Itani O, Watanabe N, Buysse DJ, Kaneita Y. Long sleep duration and health outcomes: a systematicreview, meta-analysis and meta-regression. Sleep Med Rev. 2018;39:25-36. doi:10.1016/j.smrv.2017.06.011
2. Itani O, Jike M, Watanabe N, Kaneita Y. Short sleep duration and health outcomes: a systematic review, meta-analysis, and meta-regression. Sleep Med. 2017;32:246-256. doi:10.1016/j.sleep.2016.08.006
3. Ohayon MM, Carskadon MA, Guilleminault C, Vitiello MV. Meta-analysis of quantitative sleep parameters fromchildhood to old age in healthy individuals: developing normative sleep values across the human lifespan. Sleep.2004;27(7):1255-1273. doi:10.1093/sleep/27.7.1255
4. Bin YS, Marshall NS, Glozier N. Secular trends in adult sleep duration: a systematic review. Sleep Med Rev. 2012;16(3):223-230. doi:10.1016/j.smrv.2011.07.003
5. Chen J, Patel SR, Redline S, et al. Weekly sleep trajectories and their associations with obesity and hypertensionin the Hispanic/Latino population. Sleep. 2018;41(10). doi:10.1093/sleep/zsy150
6. Depner CM, Melanson EL, Eckel RH, et al. Ad libitum weekend recovery sleep fails to prevent metabolicdysregulation during a repeating pattern of insufficient sleep and weekend recovery sleep. Curr Biol. 2019;29(6):957-967.e4. doi:10.1016/j.cub.2019.01.069
7. Zhang Q, Zhou Y, Gao X, et al. Ideal cardiovascular health metrics and the risks of ischemic and intracerebralhemorrhagic stroke. Stroke. 2013;44(9):2451-2456. doi:10.1161/STROKEAHA.113.678839
8. Li W, Jin C, Vaidya A, et al. Blood pressure trajectories and the risk of intracerebral hemorrhage and cerebralinfarction: a prospective study. Hypertension. 2017;70(3):508-514. doi:10.1161/HYPERTENSIONAHA.117.09479
JAMA Network Open | Public Health Association of Habitual Sleep Duration Patterns With Risk of Cardiovascular Events and Mortality
JAMA Network Open. 2020;3(5):e205246. doi:10.1001/jamanetworkopen.2020.5246 (Reprinted) May 22, 2020 13/15
Downloaded From: https://jamanetwork.com/ on 01/03/2022

9. World Medical Association. World Medical Association Declaration of Helsinki: ethical principles for medicalresearch involving human subjects. JAMA. 2013;310(20):2191-2194. doi:10.1001/jama.2013.281053
10. St-Onge MP, Grandner MA, Brown D, et al; American Heart Association Obesity, Behavior Change, Diabetes,and Nutrition Committees of the Council on Lifestyle and Cardiometabolic Health; Council on CardiovascularDisease in the Young; Council on Clinical Cardiology; and Stroke Council. Sleep duration and quality: impact onlifestyle behaviors and cardiometabolic health: a scientific statement from the American Heart Association.Circulation. 2016;134(18):e367-e386. doi:10.1161/CIR.0000000000000444
11. Hirshkowitz M, Whiton K, Albert SM, et al. National Sleep Foundation’s sleep time duration recommendations:methodology and results summary. Sleep Health. 2015;1(1):40-43. doi:10.1016/j.sleh.2014.12.010
12. Tunstall-Pedoe H, Kuulasmaa K, Amouyel P, Arveiler D, Rajakangas A-M, Pajak A. Myocardial infarction andcoronary deaths in the World Health Organization MONICA Project: registration procedures, event rates, and case-fatality rates in 38 populations from 21 countries in four continents. Circulation. 1994;90(1):583-612. doi:10.1161/01.CIR.90.1.583
13. Stroke W. Stroke–1989: recommendations on stroke prevention, diagnosis, and therapy: report of the WHOTask Force on Stroke and Other Cerebrovascular Disorders. Stroke. 1989;20(10):1407-1431. doi:10.1161/01.STR.20.10.1407
14. Levey AS, Stevens LA. Estimating GFR using the CKD Epidemiology Collaboration (CKD-EPI) creatinineequation: more accurate GFR estimates, lower CKD prevalence estimates, and better risk predictions. Am J KidneyDis. 2010;55(4):622-627. doi:10.1053/j.ajkd.2010.02.337
15. Jones BL, Nagin DS, Roeder K. A SAS procedure based on mixture models for estimating developmentaltrajectories. Sociol Methods Res. 2001;29(3):374-393. doi:10.1177/0049124101029003005
16. Ferrie JE, Shipley MJ, Cappuccio FP, et al. A prospective study of change in sleep duration: associations withmortality in the Whitehall II cohort. Sleep. 2007;30(12):1659-1666. doi:10.1093/sleep/30.12.1659
17. Heslop P, Smith GD, Metcalfe C, Macleod J, Hart C. Sleep duration and mortality: the effect of short or longsleep duration on cardiovascular and all-cause mortality in working men and women. Sleep Med. 2002;3(4):305-314. doi:10.1016/S1389-9457(02)00016-3
18. Spiegel K, Leproult R, Van Cauter E. Impact of sleep debt on metabolic and endocrine function. Lancet. 1999;354(9188):1435-1439. doi:10.1016/S0140-6736(99)01376-8
19. Spiegel K, Tasali E, Penev P, Van Cauter E. Brief communication: sleep curtailment in healthy young men isassociated with decreased leptin levels, elevated ghrelin levels, and increased hunger and appetite. Ann InternMed. 2004;141(11):846-850. doi:10.7326/0003-4819-141-11-200412070-00008
20. Dettoni JL, Consolim-Colombo FM, Drager LF, et al. Cardiovascular effects of partial sleep deprivation inhealthy volunteers. J Appl Physiol (1985). 2012;113(2):232-236. doi:10.1152/japplphysiol.01604.2011
21. Mullington JM, Haack M, Toth M, Serrador JM, Meier-Ewert HK. Cardiovascular, inflammatory, and metabolicconsequences of sleep deprivation. Prog Cardiovasc Dis. 2009;51(4):294-302. doi:10.1016/j.pcad.2008.10.003
22. Reinhard W, Plappert N, Zeman F, et al. Prognostic impact of sleep duration and sleep efficiency on mortality inpatients with chronic heart failure. Sleep Med. 2013;14(6):502-509. doi:10.1016/j.sleep.2012.12.014
23. Wang C, Bangdiwala SI, Rangarajan S, et al. Association of estimated sleep duration and naps with mortalityand cardiovascular events: a study of 116 632 people from 21 countries. Eur Heart J. 2019;40(20):1620-1629. doi:10.1093/eurheartj/ehy695
24. Domínguez F, Fuster V, Fernández-Alvira JM, et al. Association of sleep duration and quality with subclinicalatherosclerosis. J Am Coll Cardiol. 2019;73(2):134-144. doi:10.1016/j.jacc.2018.10.060
25. Cappuccio FP, Cooper D, D’Elia L, Strazzullo P, Miller MA. Sleep duration predicts cardiovascular outcomes:a systematic review and meta-analysis of prospective studies. Eur Heart J. 2011;32(12):1484-1492. doi:10.1093/eurheartj/ehr007
26. Lockley SW, Skene DJ, Arendt J. Comparison between subjective and actigraphic measurement of sleep andsleep rhythms. J Sleep Res. 1999;8(3):175-183. doi:10.1046/j.1365-2869.1999.00155.x
27. Signal TL, Gale J, Gander PH. Sleep measurement in flight crew: comparing actigraphic and subjectiveestimates to polysomnography. Aviat Space Environ Med. 2005;76(11):1058-1063.
28. Kripke DF, Simons RN, Garfinkel L, Hammond EC. Short and long sleep and sleeping pills: is increased mortalityassociated? Arch Gen Psychiatry. 1979;36(1):103-116. doi:10.1001/archpsyc.1979.01780010109014
SUPPLEMENT.eFigure 1. Flowchart of Participant Inclusion
JAMA Network Open | Public Health Association of Habitual Sleep Duration Patterns With Risk of Cardiovascular Events and Mortality
JAMA Network Open. 2020;3(5):e205246. doi:10.1001/jamanetworkopen.2020.5246 (Reprinted) May 22, 2020 14/15
Downloaded From: https://jamanetwork.com/ on 01/03/2022

eFigure 2. Restricted Spline Curves for Associations Between Baseline (2010) Sleep Duration and All-CauseMortality or Cardiovascular EventseTable 1. Association Between Sleep Duration Trajectory Groups and First Cardiovascular Events, Stratified by Age,Sex, BMI, Hypertension, Diabetes, Hyperlipidemia, and Kidney FunctioneTable 2. Association Between Sleep Duration Trajectory Groups and All-Cause Mortality, Stratified by Age, Sex,BMI, Hypertension, Diabetes, Hyperlipidemia, and Kidney FunctioneTable 3. Association of Baseline (2010) Sleep Duration and First Cardiovascular Events or All-Cause MortalityeTable 4. Association Between Cumulative Average Sleep Duration During 2006 to 2010 and First CardiovascularEvents or All-Cause Mortality
JAMA Network Open | Public Health Association of Habitual Sleep Duration Patterns With Risk of Cardiovascular Events and Mortality
JAMA Network Open. 2020;3(5):e205246. doi:10.1001/jamanetworkopen.2020.5246 (Reprinted) May 22, 2020 15/15
Downloaded From: https://jamanetwork.com/ on 01/03/2022


![Habitual Offender Laws - ncids.org Training/Kicking It Up... · Habitual Offender Laws Habitual Felon Law [G.S. 14-7.1 through 14-7.6] Being an habitual felon is not a crime but is](https://img.pdfslide.net/doc/110x75/5f51df19f815147c2902865d/habitual-offender-laws-ncids-trainingkicking-it-up-habitual-offender-laws.jpg)