Embed Size (px)
Citation preview
Association of Tropical Cirrus in the 10–15-km Layer with Deep Convective Sources:An Observational Study Combining Millimeter Radar Data and
Satellite-Derived Trajectories
GERALD G. MACE AND MIN DENG
University of Utah, Salt Lake City, Utah
BRIAN SODEN
Geophysical Fluid Dynamics Laboratory, Princeton, New Jersey
ED ZIPSER
University of Utah, Salt Lake City, Utah
(Manuscript received 12 October 2004, in final form 20 May 2005)
ABSTRACT
In this paper, millimeter cloud radar (MMCR) and Geosynchronous Meteorological Satellite (GMS) dataare combined to study the properties of tropical cirrus that are common in the 10–15-km layer of the tropicaltroposphere in the western Pacific. Millimeter cloud radar observations collected by the AtmosphericRadiation Measurement program on the islands of Manus and Nauru in the western and central equatorialPacific during a 12-month period spanning 1999 and 2000 show differences in cirrus properties: over Manus,where clouds above 7 km are observed 48% of the time, the cirrus are thicker and warmer on average andthe radar reflectivity and Doppler velocity are larger; over Nauru clouds above 7 km are observed 23% oftime. To explain the differences in cloud properties, the relationship between tropical cirrus and deepconvection is examined by combining the radar observations with GMS satellite-derived back trajectories.Using a data record of 1 yr, it is found that 47% of the cirrus observed over Manus can be traced to a deepconvective source within the past 12 h while just 16% of the cirrus observed over Nauru appear to have aconvective source within the previous 12 h. Of the cirrus that can be traced to deep convection, theevolution of the radar-observed cloud properties is examined as a function of apparent cloud age. The radarDoppler moments and ice water path of the observed cirrus at both sites generally decrease as the cirrus ageincrease. At Manus, it is found that cirrus during boreal winter typically advect over the site from thesoutheast from convection associated with the winter monsoon, while during boreal summer, the trajecto-ries are mainly from the northeast. The properties of these two populations of cirrus are found to bedifferent, with the winter cirrus having higher concentrations of smaller particles. Examining statistics of theregional convection using Tropical Rainfall Measuring Mission (TRMM), it is found that the properties ofthe winter monsoon convection in the cirrus source region are consistent with more intense convectioncompared to the convection in the summer source region.
1. Introduction
Upper-tropospheric ice-phase clouds in the Tropics(hereafter referred to as tropical cirrus) are character-ized by their extensive lateral and vertical coverage.These clouds impose a substantial large-scale radiative
effect on the earth’s climate system (Hartmann 1993).Up to 20% of the global Tropics are regularly coveredby extensive cirrus systems (Liou 1986), and thesecloud layers reduce the solar radiation reaching theearth’s surface due to reflection. These cloud layersalso absorb a portion of the upwelling infrared (IR)radiation emitted by the surface and lower atmosphereand emit IR radiation at a much lower temperature,hence effectively reducing the outgoing longwave ra-diation (OLR) and heating the atmosphere. The netradiative effect of tropical cirrus depends on several
Corresponding author address: Gerald G. Mace, Dept. of Me-teorology, University of Utah, 135 S 1460 E, Rm 819 (819 WBB),Salt Lake City, UT 84112-0110.E-mail: [email protected]
480 J O U R N A L O F T H E A T M O S P H E R I C S C I E N C E S VOLUME 63
© 2006 American Meteorological Society
JAS3627
factors including the properties of the underlying sur-face and atmosphere (Stephens et al. 1990), the cloudamount, cloud height, cloud geometrical thickness, icewater content (IWC), and the details of the ice crystalsize distribution (Stephens 2005). Tropical cirrusclouds, in particular, can have a unique tendency toproduce positive heating anomalies in the troposphere(Ackerman et al. 1988).
Cirrus also play a role in the maintenance of thewater vapor distribution in the Tropics. In the regionsof general subsidence well removed from deep convec-tion, cirrus moisten the upper troposphere and,thereby, regulate the heating rates and large-scale ver-tical motions of the Tropics (e.g., Sherwood 1996). Inthe vertical region bounded by the detrainment layer ofdeep convection and the stratosphere known as thetropopause transition layer (TTL), tropical cirrus helpregulate the water vapor concentrations entering thelower stratosphere in the Tropics (Jensen et al. 1996;Hartmann 2002; Dessler and Sherwood 2000)
However, the processes that lead to the formationand maintenance of tropical cirrus are not well under-stood primarily because few measurements of theirproperties exist. In early 1987, the stratosphere–troposphere exchange project (STEP) was carried outin the vicinity of Darwin, Australia, to investigate themechanisms controlling the formation and dissipationof cirrus anvils in connection with the observed extremedryness of the stratosphere. A significant portion oftropical cirrus clouds was found to have optical depthsgreater than about 6 (Liou et al. 1990). Knollenberg etal. (1993) measured IWC of up to 0.07 g m�3 at tem-peratures ranging from �60° to �90°C at the tops oftropical cumulonimbus. The Central Equatorial PacificExperiment (CEPEX) offered in situ measurements ofthe ice crystal size and concentration, and particle hab-its. The results (McFarquhar and Heymsfield 1996)showed that the cirrus properties are closely related tothe distance from the convective core where particleswith larger cross-sectional area are found near cloudbase and closer to the convection.
The Cirrus Regional Study of Tropical Anvil andCirrus Layers-Florida Area Cirrus Experiment(CRYSTAL-FACE) field campaign held during July2002 was designed to investigate the properties of con-vective systems and the resultant cirrus layers. With theexception of two flights into the Tropics on 9 and 26July, the cirrus anvils studied were derived from con-vection forced by intense solar heating of the FloridaPeninsula, so these cloud systems are not good surro-gates for maritime tropical convection. However, thecloud condensation nuclei (CCN) measurements (Van-Reken et al. 2003) indicated that the aerosol sampled
during the campaign was predominately marine in con-centration. The observed convection and cirrus anvilshad a much shorter lifetime, on the order of 3–5 h(Doelling et al. 2003), compared to that of tropical cir-rus observed using trajectory analysis of satellite obser-vations (Luo 2004). While field campaigns such asCRYSTAL-FACE are very useful, they tend to be lim-ited in space and time, making it difficult to generalizeour understanding of the cirrus formation, evolution,and dissipation processes.
Based on available observations and published re-ports, there appear to be two general classes of tropicalcirrus (Pfister et al. 2001). One class appears to be re-lated in some fashion to the detrainment of particlesand water vapor from cumulonimbus clouds since ittends to exist in the layer where most penetrative con-vection reaches a level of neutral buoyancy in the Trop-ics. However, evidence exists that much of this cloudi-ness may form and be maintained through dynamical orradiative processes other than direct detrainment ofwater from deep convective towers (Pfister et al. 2001;Massie et al. 2002). Another class of cirrus exists in thestable regions of the TTL and, while it may be relatedto deep convection (Hartmann 2002; Dessler and Yang,2003), it is likely not a direct outgrowth of the massdetrained from the convective clouds. Boehm and Ver-linde (2000) find evidence that the TTL cirrus is relatedto vertically propagating Kelvin and gravity waves,while Pfister et al. (2001) argue that these clouds couldbe formed through synoptic-scale ascent along isen-tropic surfaces.
The cloud genesis is very important because it shedslight on the processes that produce and maintain cloudproperties since it implies dynamical and meteorologi-cal information in the cloud-generating region. For ex-ample, thunderstorm anvil cases can involve strong up-drafts in the convective core, which tends to modulatethe characteristics of the particle size distributions thatare detrained into cirrus layers according to modelingstudies (Jensen et al. 1994). The fate of this anvil cirrus,especially for maritime clouds, is not well understood.
Pfister et al. (2001), using data from the TropicalOzone Transport Experiments/Vortex Ozone Trans-port Experiment (TOTE/VOTE) campaign, analyzedisentropic trajectories and temperature histories and re-ported that the thin quasi-laminar cirrus and some ofthe thick clouds may be formed by in situ cooling andthe thicker structured cirrus are more likely to be re-lated to deep convection blow-off. They also reportedthat at most 25% of the west-central tropical Pacific hasbeen directly influenced by convection within 10 days.
The distribution of tropical cirrus in relation to con-vection is also studied by Massie et al. (2002). By com-
FEBRUARY 2006 M A C E E T A L . 481
bining the Halogen Occulation Experiment (HALOE)extinction for cirrus and aerosols and Climate Diagnos-tics Center outgoing longwave radiation data, theyfound that deep convection occupies only 7% of theequatorial region. Ninety percent of the cirrus cloudsnear the tropopause are located outside of deep con-vective regions. From the 5-day back isentropic trajec-tories calculated from ECMWF temperature and windfields, they concluded that half of the HALOE cirrusobservations over the Maritime Continent are consis-tent with formation by convective blow-off, while theother half are consistent with in situ formation pro-cesses.
There are some similarities between these two stud-ies. First, both are focused on TTL cirrus, which under-represents the total population of all tropical cirrusclouds. Second, long-term (5–10 days) isentropic trajec-tories and temperature histories are applied to find thecirrus relationship to deep convection. Consequently,these long-term tracking studies involve large regionsof the Tropics, allowing them to examine cirrus prop-erties over long space and time scales but opening themup to the inherent uncertainties associated with isen-tropic trajectory analysis.
In this paper we examine the origin and properties ofnon-TTL cirrus on shorter time and space scales thanthe Massie et al. (2002) or Pfister et al. (2001) studies bycombining ground-based and satellite measurements.The questions we wish to address are whether, and towhat extent, anvil cirrus evolve from detrained massesof ice crystals into entities that can maintain themselvesthrough some set of dynamical and microphysical pro-cesses. The answers to these questions have implica-tions for how tropical cirrus act to maintain the humid-ity structure of the tropical upper troposphere and thefeedbacks these clouds have on the general circulation.Furthermore, from a practical standpoint, since the mi-crophysical properties of self-maintaining cirrus arelikely different from anvil layers, it is important to ad-dress how these clouds would be treated differently inremote sensing retrievals and in model parameteriza-tions from young detrained anvil layers.
The ground-based data used in this study were col-lected by the U.S. Department of Energy (DOE) At-mospheric Radiation Measurement program (ARM)(Ackerman and Stokes 2003) from two observationalfacilities in the tropical west Pacific (TWP). One facilitywas implemented on Manus Island, Papua New Guinea(2.058°S, 147.425°E), in 1996 and the other on the is-land of Nauru (0.521°S, 166.916°E) in 1998. Manus islocated within the heart of the Pacific warm pool wheredeep convection is frequent and widespread, whileNauru is located on the eastern edge of the warm pool
where deep convection is much more episodic. TheARM program installed 35-GHz cloud radars (MMCR)(Moran et al. 1998) on their TWP facilities in 1998(Nauru) and 1999 (Manus). To the ground-based ARMdata we add the hourly Geosynchronous Meteorologi-cal Satellite (GMS) Lagrangian trajectories, derivedfrom the technique described by Soden (1998), bywhich radiance patterns are followed for a 12-h periodof time. These trajectories provide unique insights intothe life cycle of cirrus observed at the two sites. Withthe back trajectories, we are able to follow cirrus fromits point of observation over the ARM sites to either itssource or until the back trajectory becomes unreliable(longer than 12 h).
The main issues we address in this paper are
1) the regional differences in the cirrus properties be-tween the Manus and Nauru sites using MMCR ob-servations,
2) the manner in which cirrus clouds at these two sitesare related to deep convection within the previous12 h using the millimeter radar data combined withthe satellite-derived trajectories,
3) the sensitivity of the properties of the tropical anvilcirrus (in this paper, anvil cirrus refers to those lay-ers that can be traced to deep convection within 12h using back trajectories) to the temporal durationfrom their last association with deep convection,
4) the seasonal dependence of the cirrus properties ob-served at Manus.
The paper is organized in the following manner: section2 compares the observed cirrus cloud properties be-tween Manus and Nauru using one year of MMCRdata. In section 3, the GMS satellite Lagrangian track-ing data are introduced, and a satellite-based techniqueto detect the occurrence of deep convection in GMS IRimagery is discussed. The association of tropical cirruswith deep convection is examined in section 4, and fi-nally in section 5, cirrus observed at Manus are groupedby season and studied in association with the propertiesof the regional convection using TRMM data. A sum-mary is presented in section 6.
2. Millimeter-wavelength cloud radar observations
In this section we explore the characteristics ofupper-tropospheric clouds observed at the tropicalARM sites with MMCR. The MMCR instruments (Mo-ran et al. 1998) are key components of the observa-tional suites at the ARM sites. They are zenith-pointingradars that operate at a frequency of 35 GHz and pos-sess Doppler capabilities. Since the MMCR is able to
482 J O U R N A L O F T H E A T M O S P H E R I C S C I E N C E S VOLUME 63
penetrate lower-level clouds and even light precipita-tion, the radar provides valuable information on cloudboundaries (e.g., cloud base, top). These radars are ver-tically pointing and have reasonable sensitivity to mostcirrus below the TTL. The study of Comstock et al.(2002) showed that the MMCR has sufficient sensitivityto observe most cirrus that occur below approximately15 km. Above 15 km, cirrus are often below the sensi-tivity threshold (��30 dBZ at this altitude) of the ra-dar. Fifteen kilometers roughly marks the lower bound-ary of the TTL since most maritime tropical convectiondetrains below this altitude (Dessler 2002). The cloudphysical temperature is obtained from regular radio-sonde measurements (two per day) at the ARM sites.
As an active remote sensor, the MMCR transmits apulse of millimeter-wave energy that propagatesthrough the atmosphere until cloud droplets or precipi-tation reflects Doppler-shifted energy back to theMMCR receiver (Clothiaux et al. 1995). A digital signalprocessor records these signals and the integratedDoppler spectrum power or radar reflectivity (Z ),mean Doppler velocity (Vd), and Doppler spectrumwidth (�d) are recorded. For solid spherical particlesthat are small with respect to the wavelength, the radarreflectivity, the zeroth moment of the Doppler spec-trum, can be described as
Z � �0
�
N�D� � D6 dD,
where N is the particle size distribution (L�1�m�1). Itshows that the radar reflectivity is very sensitive to thelargest particles in the size distribution. The Dopplerspectrum is interpreted as a convolution of the Dopplervelocity spectrum of the cloud particles with the prob-ability density function of air motions (Gossard 1994).Since quiet-air particle terminal velocity positively de-pends on the ratio of mass to area (Mitchell et al. 1997;Heymsfield and Iaquinta 2000), the mean Doppler ve-locity, the first moment of the Doppler spectrum, alsoprovides information on particle sizes and mass content(Mace et al. 2002). The spectrum width, the secondmoment of the Doppler spectrum, contains informationrelated to both the turbulence and the dispersion of theparticle size distribution.
Ice water content is another important property ofcirrus clouds because it is closely related to ice waterpath (IWP) and optical depth, which determines theshortwave (solar) radiative transfer through the cloudlayer. Liu and Illingworth (2000) analyzed publishedexponential relationships between IWC and radar re-flectivity and reported that retrieved IWC from Zthrough a power-law relationship, which is classified in
terms of temperature in 6-K steps, has bias less than30%. In this study, IWP is calculated by integratingIWC in the cloud layer, which is derived from radarreflectivity using those temperature-classified coeffi-cients.
One year of MMCR data (July 1999 to July 2000) areevaluated from both sites. We have found in our analy-sis of the Manus and Nauru MMCR data that a cali-bration error likely exists in the Manus data. In com-paring the data from the two sites we found a system-atic offset in the frequency distributions of variouscloud classes for which we could find no reasonablephysical explanation. Upon further investigation, wefound the lower reflectivity limit reported in the datafiles of the Manus radar (i.e., the noise floor) was 6 dBZlower than the noise floor of the MMCR at Nauru eventhough the radars are identical. In our subsequentanalysis, we therefore add 6 dBZ to the radar reflectiv-ity of the Manus radar. ARM instrument personnelconcur that this correction to the Manus data is reason-able (M. Miller 2005, personal communication).
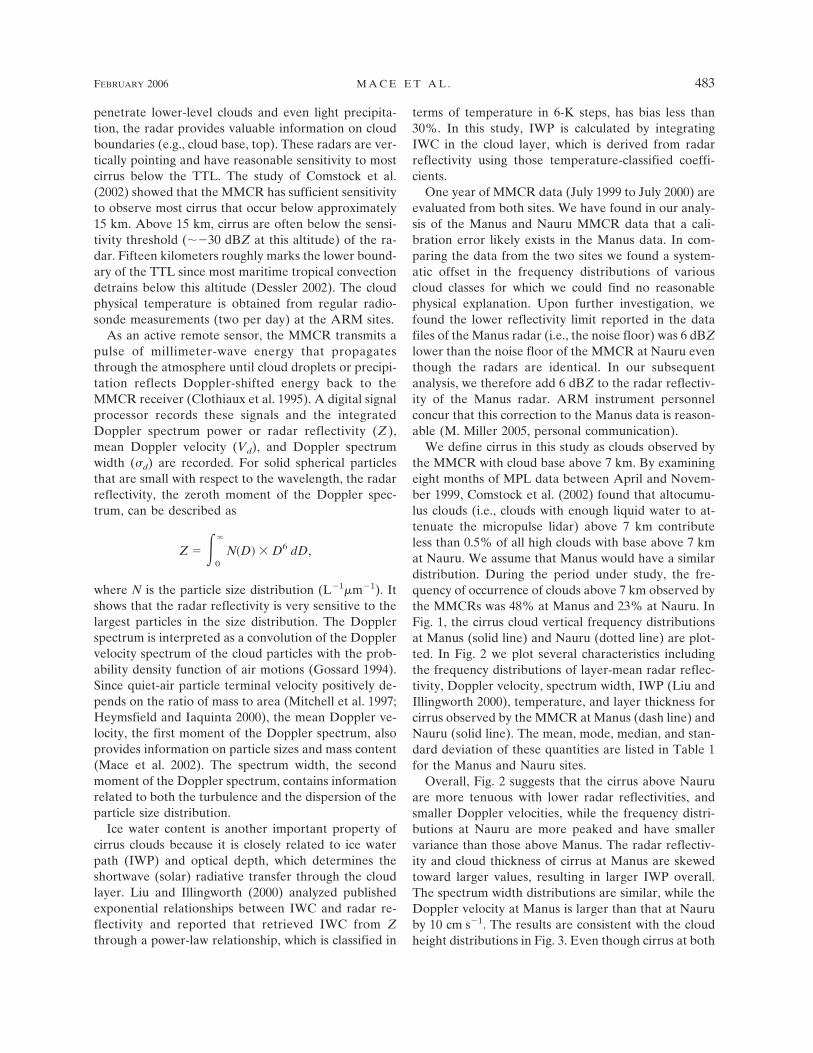
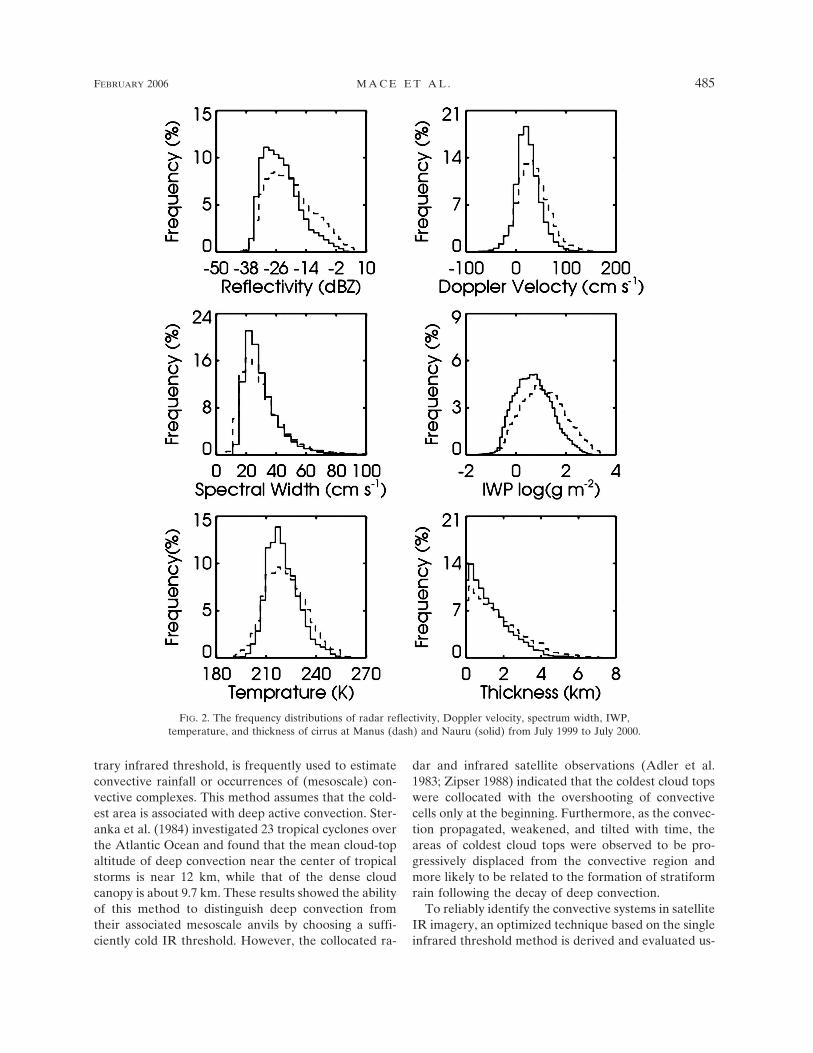
We define cirrus in this study as clouds observed bythe MMCR with cloud base above 7 km. By examiningeight months of MPL data between April and Novem-ber 1999, Comstock et al. (2002) found that altocumu-lus clouds (i.e., clouds with enough liquid water to at-tenuate the micropulse lidar) above 7 km contributeless than 0.5% of all high clouds with base above 7 kmat Nauru. We assume that Manus would have a similardistribution. During the period under study, the fre-quency of occurrence of clouds above 7 km observed bythe MMCRs was 48% at Manus and 23% at Nauru. InFig. 1, the cirrus cloud vertical frequency distributionsat Manus (solid line) and Nauru (dotted line) are plot-ted. In Fig. 2 we plot several characteristics includingthe frequency distributions of layer-mean radar reflec-tivity, Doppler velocity, spectrum width, IWP (Liu andIllingworth 2000), temperature, and layer thickness forcirrus observed by the MMCR at Manus (dash line) andNauru (solid line). The mean, mode, median, and stan-dard deviation of these quantities are listed in Table 1for the Manus and Nauru sites.
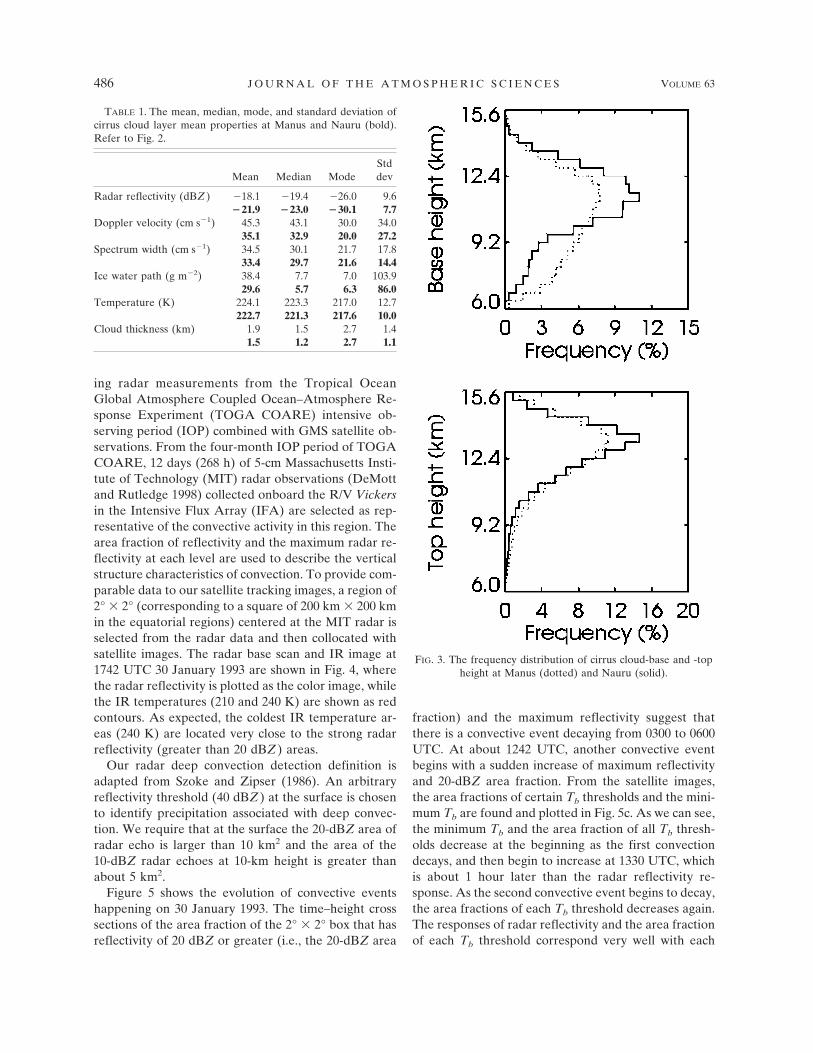
Overall, Fig. 2 suggests that the cirrus above Nauruare more tenuous with lower radar reflectivities, andsmaller Doppler velocities, while the frequency distri-butions at Nauru are more peaked and have smallervariance than those above Manus. The radar reflectiv-ity and cloud thickness of cirrus at Manus are skewedtoward larger values, resulting in larger IWP overall.The spectrum width distributions are similar, while theDoppler velocity at Manus is larger than that at Nauruby 10 cm s�1. The results are consistent with the cloudheight distributions in Fig. 3. Even though cirrus at both
FEBRUARY 2006 M A C E E T A L . 483
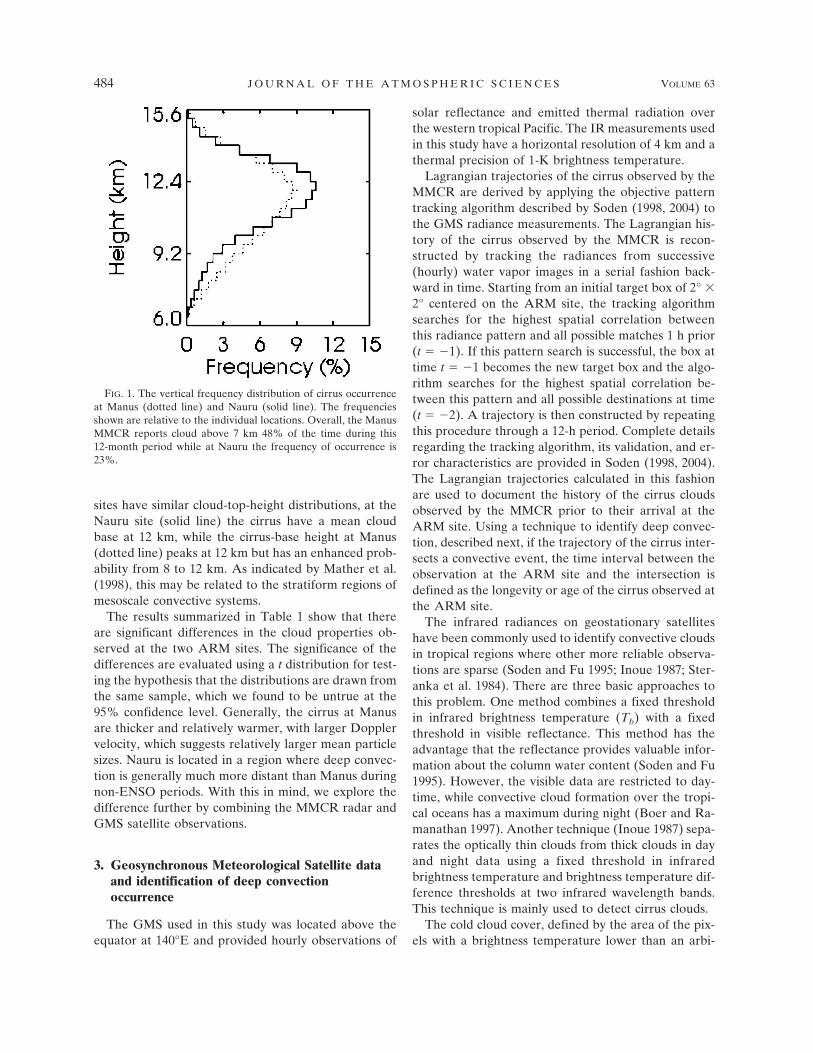
sites have similar cloud-top-height distributions, at theNauru site (solid line) the cirrus have a mean cloudbase at 12 km, while the cirrus-base height at Manus(dotted line) peaks at 12 km but has an enhanced prob-ability from 8 to 12 km. As indicated by Mather et al.(1998), this may be related to the stratiform regions ofmesoscale convective systems.
The results summarized in Table 1 show that thereare significant differences in the cloud properties ob-served at the two ARM sites. The significance of thedifferences are evaluated using a t distribution for test-ing the hypothesis that the distributions are drawn fromthe same sample, which we found to be untrue at the95% confidence level. Generally, the cirrus at Manusare thicker and relatively warmer, with larger Dopplervelocity, which suggests relatively larger mean particlesizes. Nauru is located in a region where deep convec-tion is generally much more distant than Manus duringnon-ENSO periods. With this in mind, we explore thedifference further by combining the MMCR radar andGMS satellite observations.
3. Geosynchronous Meteorological Satellite dataand identification of deep convectionoccurrence
The GMS used in this study was located above theequator at 140°E and provided hourly observations of
solar reflectance and emitted thermal radiation overthe western tropical Pacific. The IR measurements usedin this study have a horizontal resolution of 4 km and athermal precision of 1-K brightness temperature.
Lagrangian trajectories of the cirrus observed by theMMCR are derived by applying the objective patterntracking algorithm described by Soden (1998, 2004) tothe GMS radiance measurements. The Lagrangian his-tory of the cirrus observed by the MMCR is recon-structed by tracking the radiances from successive(hourly) water vapor images in a serial fashion back-ward in time. Starting from an initial target box of 2° �2° centered on the ARM site, the tracking algorithmsearches for the highest spatial correlation betweenthis radiance pattern and all possible matches 1 h prior(t � �1). If this pattern search is successful, the box attime t � �1 becomes the new target box and the algo-rithm searches for the highest spatial correlation be-tween this pattern and all possible destinations at time(t � �2). A trajectory is then constructed by repeatingthis procedure through a 12-h period. Complete detailsregarding the tracking algorithm, its validation, and er-ror characteristics are provided in Soden (1998, 2004).The Lagrangian trajectories calculated in this fashionare used to document the history of the cirrus cloudsobserved by the MMCR prior to their arrival at theARM site. Using a technique to identify deep convec-tion, described next, if the trajectory of the cirrus inter-sects a convective event, the time interval between theobservation at the ARM site and the intersection isdefined as the longevity or age of the cirrus observed atthe ARM site.
The infrared radiances on geostationary satelliteshave been commonly used to identify convective cloudsin tropical regions where other more reliable observa-tions are sparse (Soden and Fu 1995; Inoue 1987; Ster-anka et al. 1984). There are three basic approaches tothis problem. One method combines a fixed thresholdin infrared brightness temperature (Tb) with a fixedthreshold in visible reflectance. This method has theadvantage that the reflectance provides valuable infor-mation about the column water content (Soden and Fu1995). However, the visible data are restricted to day-time, while convective cloud formation over the tropi-cal oceans has a maximum during night (Boer and Ra-manathan 1997). Another technique (Inoue 1987) sepa-rates the optically thin clouds from thick clouds in dayand night data using a fixed threshold in infraredbrightness temperature and brightness temperature dif-ference thresholds at two infrared wavelength bands.This technique is mainly used to detect cirrus clouds.
The cold cloud cover, defined by the area of the pix-els with a brightness temperature lower than an arbi-
FIG. 1. The vertical frequency distribution of cirrus occurrenceat Manus (dotted line) and Nauru (solid line). The frequenciesshown are relative to the individual locations. Overall, the ManusMMCR reports cloud above 7 km 48% of the time during this12-month period while at Nauru the frequency of occurrence is23%.
484 J O U R N A L O F T H E A T M O S P H E R I C S C I E N C E S VOLUME 63
trary infrared threshold, is frequently used to estimateconvective rainfall or occurrences of (mesoscale) con-vective complexes. This method assumes that the cold-est area is associated with deep active convection. Ster-anka et al. (1984) investigated 23 tropical cyclones overthe Atlantic Ocean and found that the mean cloud-topaltitude of deep convection near the center of tropicalstorms is near 12 km, while that of the dense cloudcanopy is about 9.7 km. These results showed the abilityof this method to distinguish deep convection fromtheir associated mesoscale anvils by choosing a suffi-ciently cold IR threshold. However, the collocated ra-
dar and infrared satellite observations (Adler et al.1983; Zipser 1988) indicated that the coldest cloud topswere collocated with the overshooting of convectivecells only at the beginning. Furthermore, as the convec-tion propagated, weakened, and tilted with time, theareas of coldest cloud tops were observed to be pro-gressively displaced from the convective region andmore likely to be related to the formation of stratiformrain following the decay of deep convection.
To reliably identify the convective systems in satelliteIR imagery, an optimized technique based on the singleinfrared threshold method is derived and evaluated us-
FIG. 2. The frequency distributions of radar reflectivity, Doppler velocity, spectrum width, IWP,temperature, and thickness of cirrus at Manus (dash) and Nauru (solid) from July 1999 to July 2000.
FEBRUARY 2006 M A C E E T A L . 485
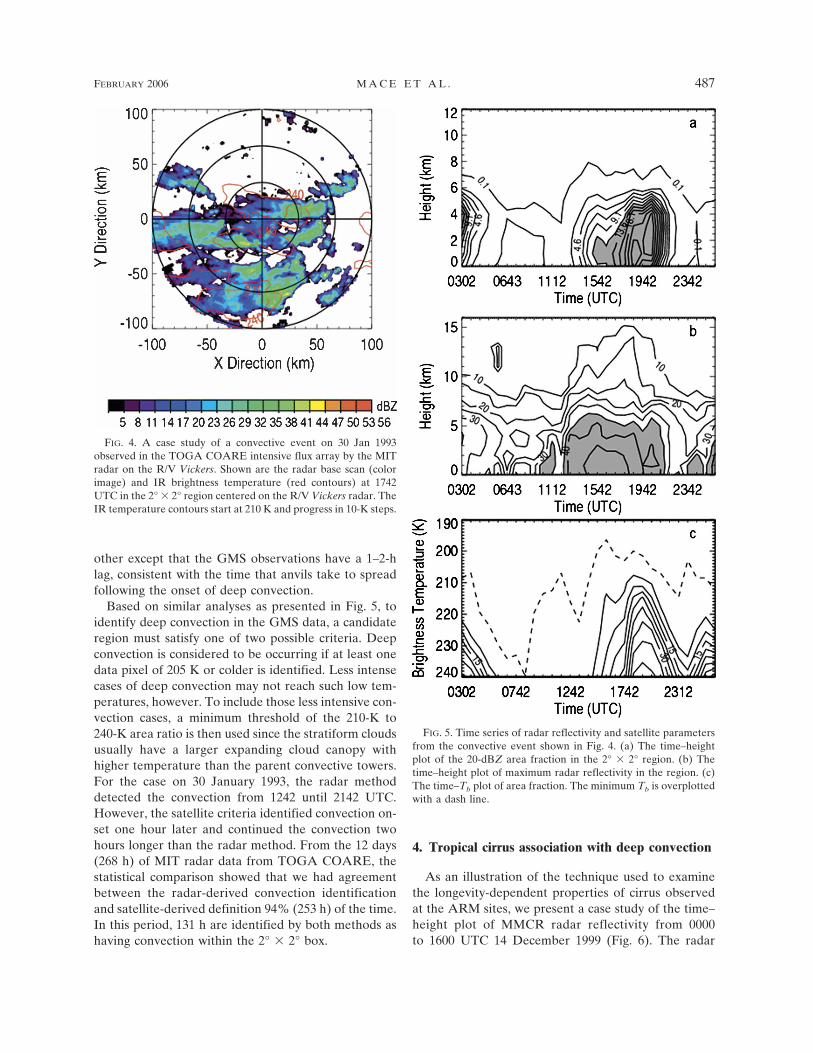
ing radar measurements from the Tropical OceanGlobal Atmosphere Coupled Ocean–Atmosphere Re-sponse Experiment (TOGA COARE) intensive ob-serving period (IOP) combined with GMS satellite ob-servations. From the four-month IOP period of TOGACOARE, 12 days (268 h) of 5-cm Massachusetts Insti-tute of Technology (MIT) radar observations (DeMottand Rutledge 1998) collected onboard the R/V Vickersin the Intensive Flux Array (IFA) are selected as rep-resentative of the convective activity in this region. Thearea fraction of reflectivity and the maximum radar re-flectivity at each level are used to describe the verticalstructure characteristics of convection. To provide com-parable data to our satellite tracking images, a region of2° � 2° (corresponding to a square of 200 km � 200 kmin the equatorial regions) centered at the MIT radar isselected from the radar data and then collocated withsatellite images. The radar base scan and IR image at1742 UTC 30 January 1993 are shown in Fig. 4, wherethe radar reflectivity is plotted as the color image, whilethe IR temperatures (210 and 240 K) are shown as redcontours. As expected, the coldest IR temperature ar-eas (240 K) are located very close to the strong radarreflectivity (greater than 20 dBZ) areas.
Our radar deep convection detection definition isadapted from Szoke and Zipser (1986). An arbitraryreflectivity threshold (40 dBZ) at the surface is chosento identify precipitation associated with deep convec-tion. We require that at the surface the 20-dBZ area ofradar echo is larger than 10 km2 and the area of the10-dBZ radar echoes at 10-km height is greater thanabout 5 km2.
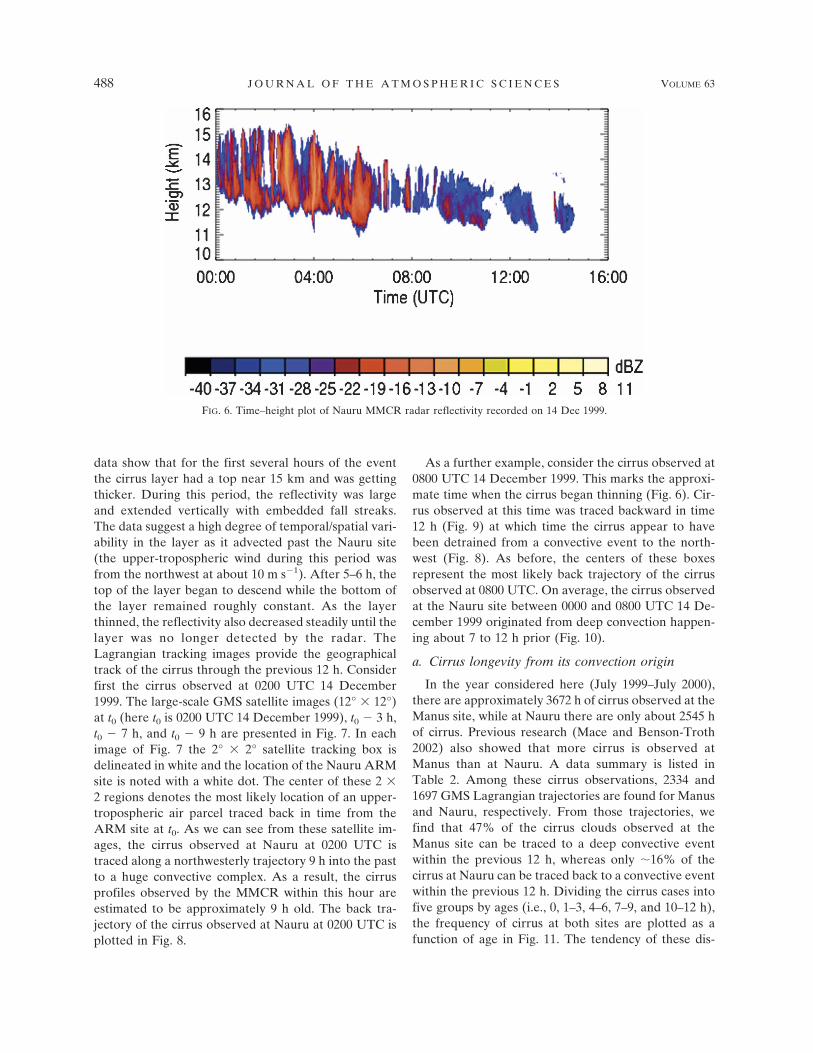
Figure 5 shows the evolution of convective eventshappening on 30 January 1993. The time–height crosssections of the area fraction of the 2° � 2° box that hasreflectivity of 20 dBZ or greater (i.e., the 20-dBZ area
fraction) and the maximum reflectivity suggest thatthere is a convective event decaying from 0300 to 0600UTC. At about 1242 UTC, another convective eventbegins with a sudden increase of maximum reflectivityand 20-dBZ area fraction. From the satellite images,the area fractions of certain Tb thresholds and the mini-mum Tb are found and plotted in Fig. 5c. As we can see,the minimum Tb and the area fraction of all Tb thresh-olds decrease at the beginning as the first convectiondecays, and then begin to increase at 1330 UTC, whichis about 1 hour later than the radar reflectivity re-sponse. As the second convective event begins to decay,the area fractions of each Tb threshold decreases again.The responses of radar reflectivity and the area fractionof each Tb threshold correspond very well with each
TABLE 1. The mean, median, mode, and standard deviation ofcirrus cloud layer mean properties at Manus and Nauru (bold).Refer to Fig. 2.
Mean Median ModeStddev
Radar reflectivity (dBZ ) �18.1 �19.4 �26.0 9.6�21.9 �23.0 �30.1 7.7
Doppler velocity (cm s�1) 45.3 43.1 30.0 34.035.1 32.9 20.0 27.2
Spectrum width (cm s�1) 34.5 30.1 21.7 17.833.4 29.7 21.6 14.4
Ice water path (g m�2) 38.4 7.7 7.0 103.929.6 5.7 6.3 86.0
Temperature (K) 224.1 223.3 217.0 12.7222.7 221.3 217.6 10.0
Cloud thickness (km) 1.9 1.5 2.7 1.41.5 1.2 2.7 1.1
FIG. 3. The frequency distribution of cirrus cloud-base and -topheight at Manus (dotted) and Nauru (solid).
486 J O U R N A L O F T H E A T M O S P H E R I C S C I E N C E S VOLUME 63
other except that the GMS observations have a 1–2-hlag, consistent with the time that anvils take to spreadfollowing the onset of deep convection.
Based on similar analyses as presented in Fig. 5, toidentify deep convection in the GMS data, a candidateregion must satisfy one of two possible criteria. Deepconvection is considered to be occurring if at least onedata pixel of 205 K or colder is identified. Less intensecases of deep convection may not reach such low tem-peratures, however. To include those less intensive con-vection cases, a minimum threshold of the 210-K to240-K area ratio is then used since the stratiform cloudsusually have a larger expanding cloud canopy withhigher temperature than the parent convective towers.For the case on 30 January 1993, the radar methoddetected the convection from 1242 until 2142 UTC.However, the satellite criteria identified convection on-set one hour later and continued the convection twohours longer than the radar method. From the 12 days(268 h) of MIT radar data from TOGA COARE, thestatistical comparison showed that we had agreementbetween the radar-derived convection identificationand satellite-derived definition 94% (253 h) of the time.In this period, 131 h are identified by both methods ashaving convection within the 2° � 2° box.
4. Tropical cirrus association with deep convection
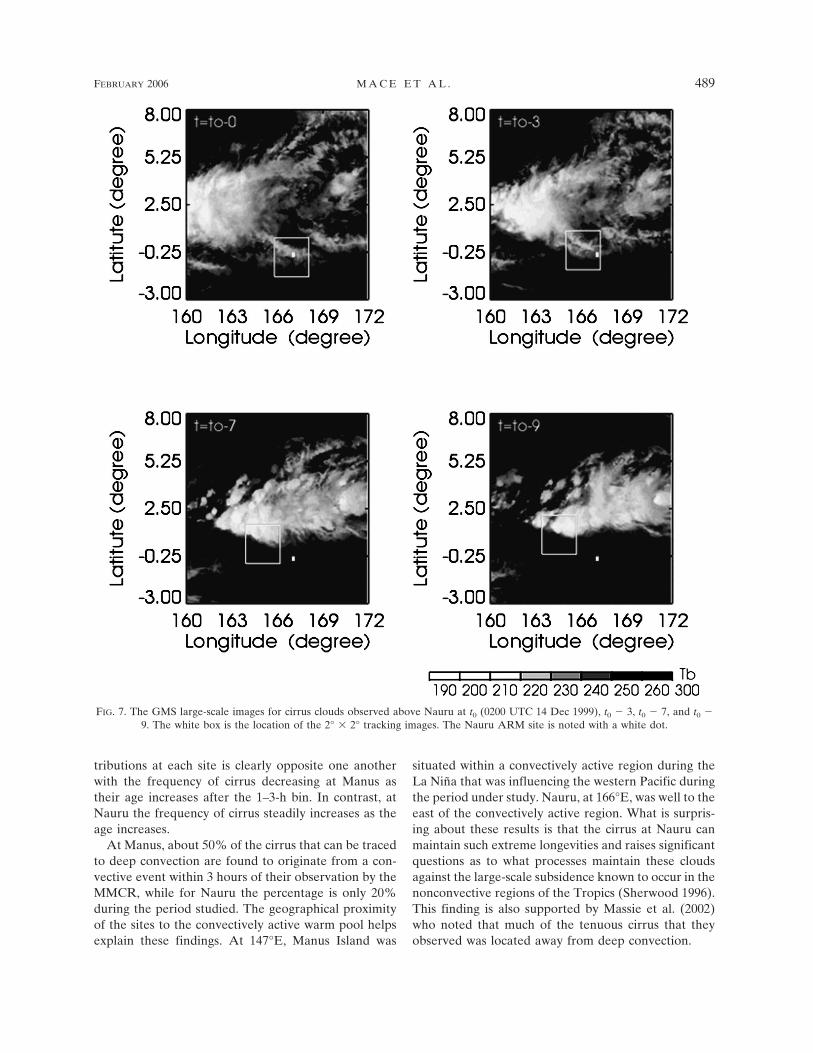
As an illustration of the technique used to examinethe longevity-dependent properties of cirrus observedat the ARM sites, we present a case study of the time–height plot of MMCR radar reflectivity from 0000to 1600 UTC 14 December 1999 (Fig. 6). The radar
FIG. 4. A case study of a convective event on 30 Jan 1993observed in the TOGA COARE intensive flux array by the MITradar on the R/V Vickers. Shown are the radar base scan (colorimage) and IR brightness temperature (red contours) at 1742UTC in the 2° � 2° region centered on the R/V Vickers radar. TheIR temperature contours start at 210 K and progress in 10-K steps.
FIG. 5. Time series of radar reflectivity and satellite parametersfrom the convective event shown in Fig. 4. (a) The time–heightplot of the 20-dBZ area fraction in the 2° � 2° region. (b) Thetime–height plot of maximum radar reflectivity in the region. (c)The time–Tb plot of area fraction. The minimum Tb is overplottedwith a dash line.
FEBRUARY 2006 M A C E E T A L . 487
Fig 4 live 4/C
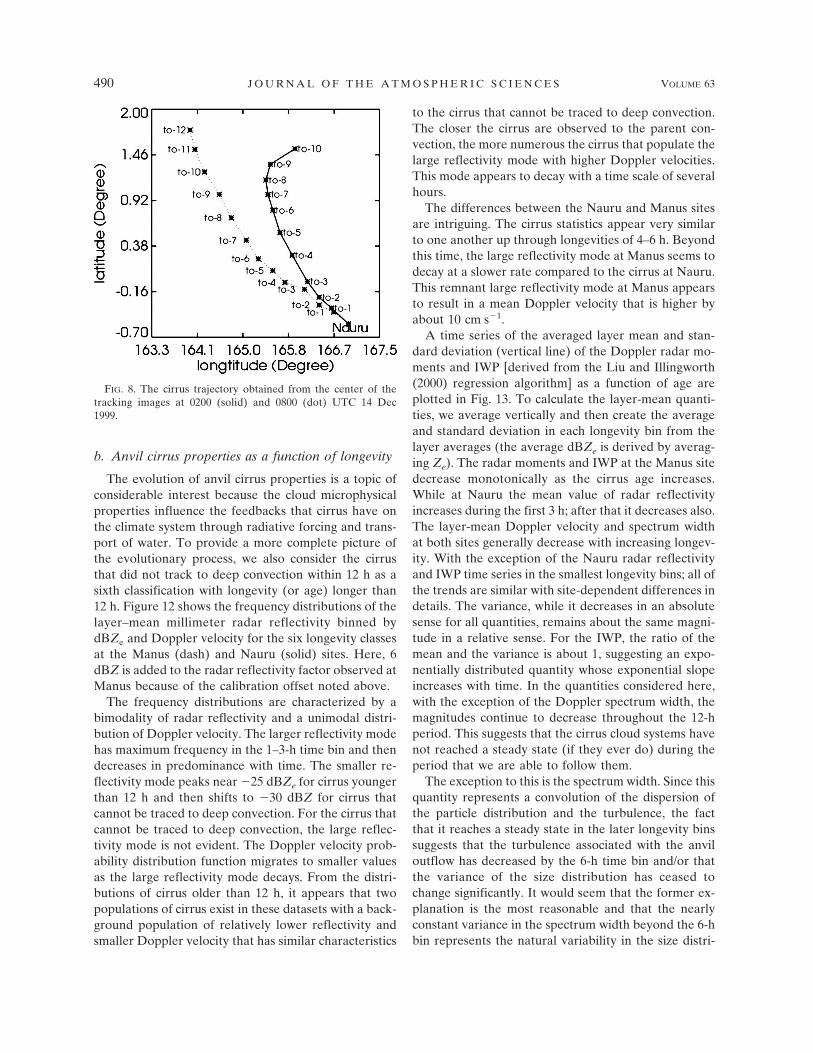
data show that for the first several hours of the eventthe cirrus layer had a top near 15 km and was gettingthicker. During this period, the reflectivity was largeand extended vertically with embedded fall streaks.The data suggest a high degree of temporal/spatial vari-ability in the layer as it advected past the Nauru site(the upper-tropospheric wind during this period wasfrom the northwest at about 10 m s�1). After 5–6 h, thetop of the layer began to descend while the bottom ofthe layer remained roughly constant. As the layerthinned, the reflectivity also decreased steadily until thelayer was no longer detected by the radar. TheLagrangian tracking images provide the geographicaltrack of the cirrus through the previous 12 h. Considerfirst the cirrus observed at 0200 UTC 14 December1999. The large-scale GMS satellite images (12° � 12°)at t0 (here t0 is 0200 UTC 14 December 1999), t0 � 3 h,t0 � 7 h, and t0 � 9 h are presented in Fig. 7. In eachimage of Fig. 7 the 2° � 2° satellite tracking box isdelineated in white and the location of the Nauru ARMsite is noted with a white dot. The center of these 2 �2 regions denotes the most likely location of an upper-tropospheric air parcel traced back in time from theARM site at t0. As we can see from these satellite im-ages, the cirrus observed at Nauru at 0200 UTC istraced along a northwesterly trajectory 9 h into the pastto a huge convective complex. As a result, the cirrusprofiles observed by the MMCR within this hour areestimated to be approximately 9 h old. The back tra-jectory of the cirrus observed at Nauru at 0200 UTC isplotted in Fig. 8.
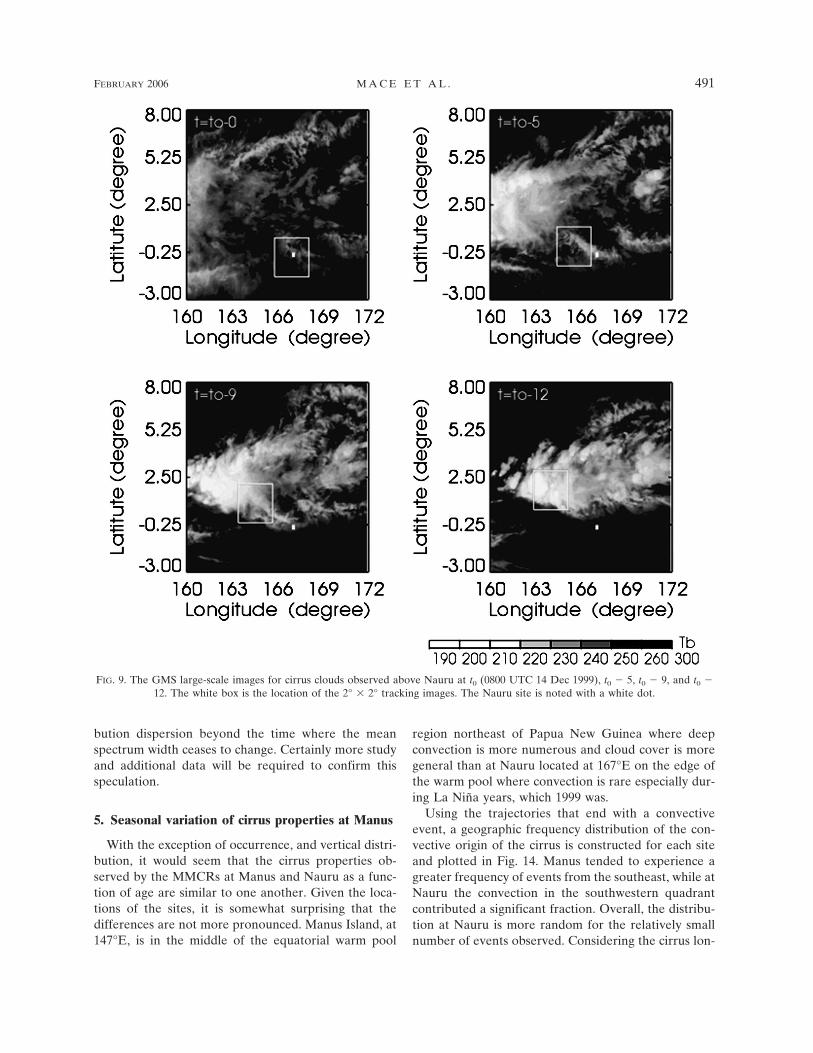
As a further example, consider the cirrus observed at0800 UTC 14 December 1999. This marks the approxi-mate time when the cirrus began thinning (Fig. 6). Cir-rus observed at this time was traced backward in time12 h (Fig. 9) at which time the cirrus appear to havebeen detrained from a convective event to the north-west (Fig. 8). As before, the centers of these boxesrepresent the most likely back trajectory of the cirrusobserved at 0800 UTC. On average, the cirrus observedat the Nauru site between 0000 and 0800 UTC 14 De-cember 1999 originated from deep convection happen-ing about 7 to 12 h prior (Fig. 10).
a. Cirrus longevity from its convection origin
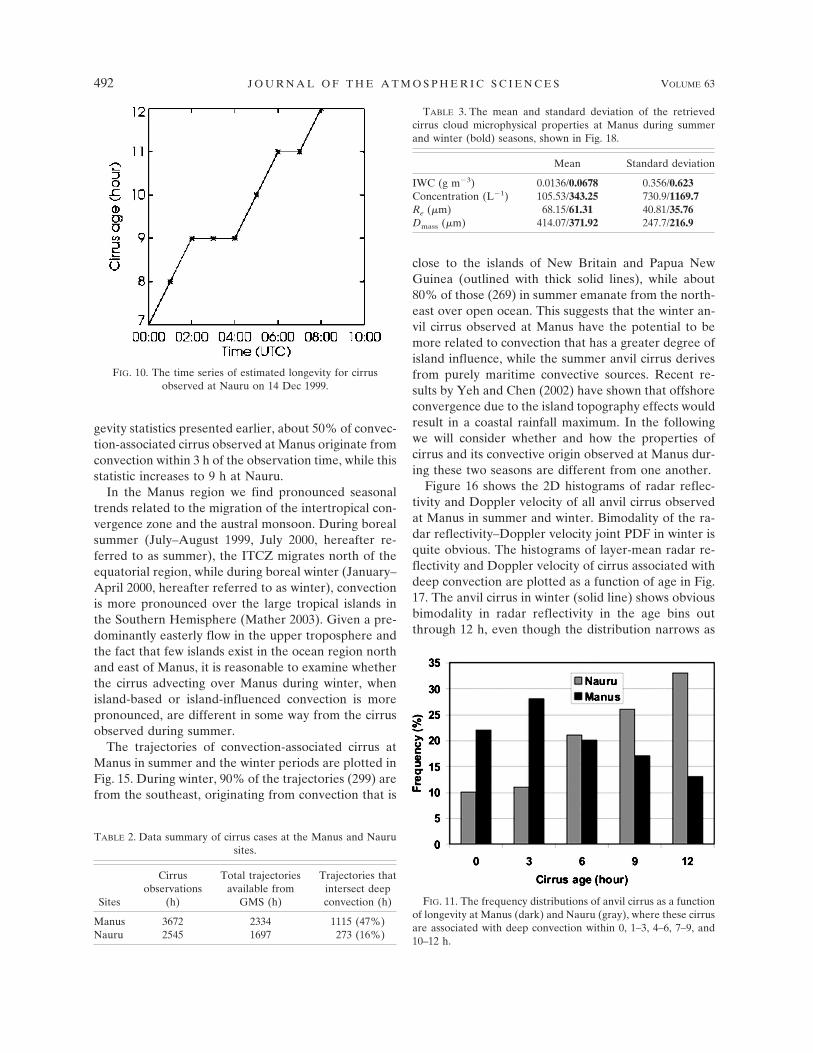
In the year considered here (July 1999–July 2000),there are approximately 3672 h of cirrus observed at theManus site, while at Nauru there are only about 2545 hof cirrus. Previous research (Mace and Benson-Troth2002) also showed that more cirrus is observed atManus than at Nauru. A data summary is listed inTable 2. Among these cirrus observations, 2334 and1697 GMS Lagrangian trajectories are found for Manusand Nauru, respectively. From those trajectories, wefind that 47% of the cirrus clouds observed at theManus site can be traced to a deep convective eventwithin the previous 12 h, whereas only �16% of thecirrus at Nauru can be traced back to a convective eventwithin the previous 12 h. Dividing the cirrus cases intofive groups by ages (i.e., 0, 1–3, 4–6, 7–9, and 10–12 h),the frequency of cirrus at both sites are plotted as afunction of age in Fig. 11. The tendency of these dis-
FIG. 6. Time–height plot of Nauru MMCR radar reflectivity recorded on 14 Dec 1999.
488 J O U R N A L O F T H E A T M O S P H E R I C S C I E N C E S VOLUME 63
Fig 6 live 4/C
tributions at each site is clearly opposite one anotherwith the frequency of cirrus decreasing at Manus astheir age increases after the 1–3-h bin. In contrast, atNauru the frequency of cirrus steadily increases as theage increases.
At Manus, about 50% of the cirrus that can be tracedto deep convection are found to originate from a con-vective event within 3 hours of their observation by theMMCR, while for Nauru the percentage is only 20%during the period studied. The geographical proximityof the sites to the convectively active warm pool helpsexplain these findings. At 147°E, Manus Island was
situated within a convectively active region during theLa Niña that was influencing the western Pacific duringthe period under study. Nauru, at 166°E, was well to theeast of the convectively active region. What is surpris-ing about these results is that the cirrus at Nauru canmaintain such extreme longevities and raises significantquestions as to what processes maintain these cloudsagainst the large-scale subsidence known to occur in thenonconvective regions of the Tropics (Sherwood 1996).This finding is also supported by Massie et al. (2002)who noted that much of the tenuous cirrus that theyobserved was located away from deep convection.
FIG. 7. The GMS large-scale images for cirrus clouds observed above Nauru at t0 (0200 UTC 14 Dec 1999), t0 � 3, t0 � 7, and t0 �9. The white box is the location of the 2° � 2° tracking images. The Nauru ARM site is noted with a white dot.
FEBRUARY 2006 M A C E E T A L . 489
b. Anvil cirrus properties as a function of longevity
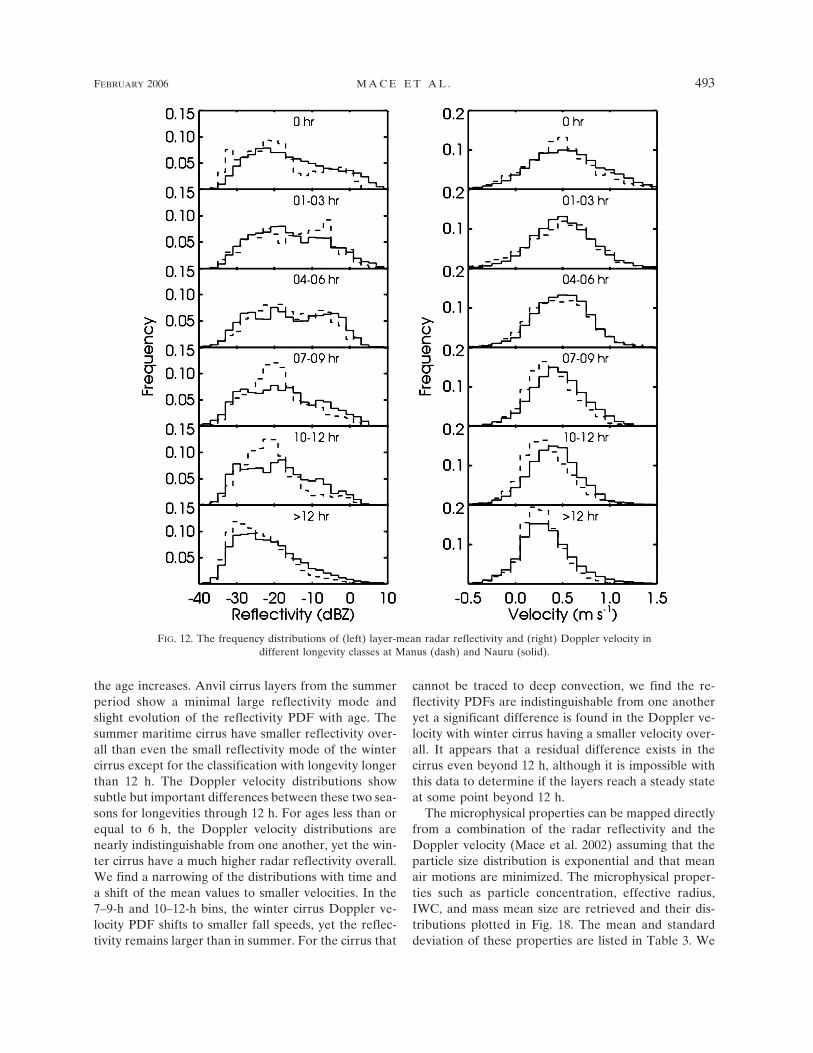
The evolution of anvil cirrus properties is a topic ofconsiderable interest because the cloud microphysicalproperties influence the feedbacks that cirrus have onthe climate system through radiative forcing and trans-port of water. To provide a more complete picture ofthe evolutionary process, we also consider the cirrusthat did not track to deep convection within 12 h as asixth classification with longevity (or age) longer than12 h. Figure 12 shows the frequency distributions of thelayer–mean millimeter radar reflectivity binned bydBZe and Doppler velocity for the six longevity classesat the Manus (dash) and Nauru (solid) sites. Here, 6dBZ is added to the radar reflectivity factor observed atManus because of the calibration offset noted above.
The frequency distributions are characterized by abimodality of radar reflectivity and a unimodal distri-bution of Doppler velocity. The larger reflectivity modehas maximum frequency in the 1–3-h time bin and thendecreases in predominance with time. The smaller re-flectivity mode peaks near �25 dBZe for cirrus youngerthan 12 h and then shifts to �30 dBZ for cirrus thatcannot be traced to deep convection. For the cirrus thatcannot be traced to deep convection, the large reflec-tivity mode is not evident. The Doppler velocity prob-ability distribution function migrates to smaller valuesas the large reflectivity mode decays. From the distri-butions of cirrus older than 12 h, it appears that twopopulations of cirrus exist in these datasets with a back-ground population of relatively lower reflectivity andsmaller Doppler velocity that has similar characteristics
to the cirrus that cannot be traced to deep convection.The closer the cirrus are observed to the parent con-vection, the more numerous the cirrus that populate thelarge reflectivity mode with higher Doppler velocities.This mode appears to decay with a time scale of severalhours.
The differences between the Nauru and Manus sitesare intriguing. The cirrus statistics appear very similarto one another up through longevities of 4–6 h. Beyondthis time, the large reflectivity mode at Manus seems todecay at a slower rate compared to the cirrus at Nauru.This remnant large reflectivity mode at Manus appearsto result in a mean Doppler velocity that is higher byabout 10 cm s�1.
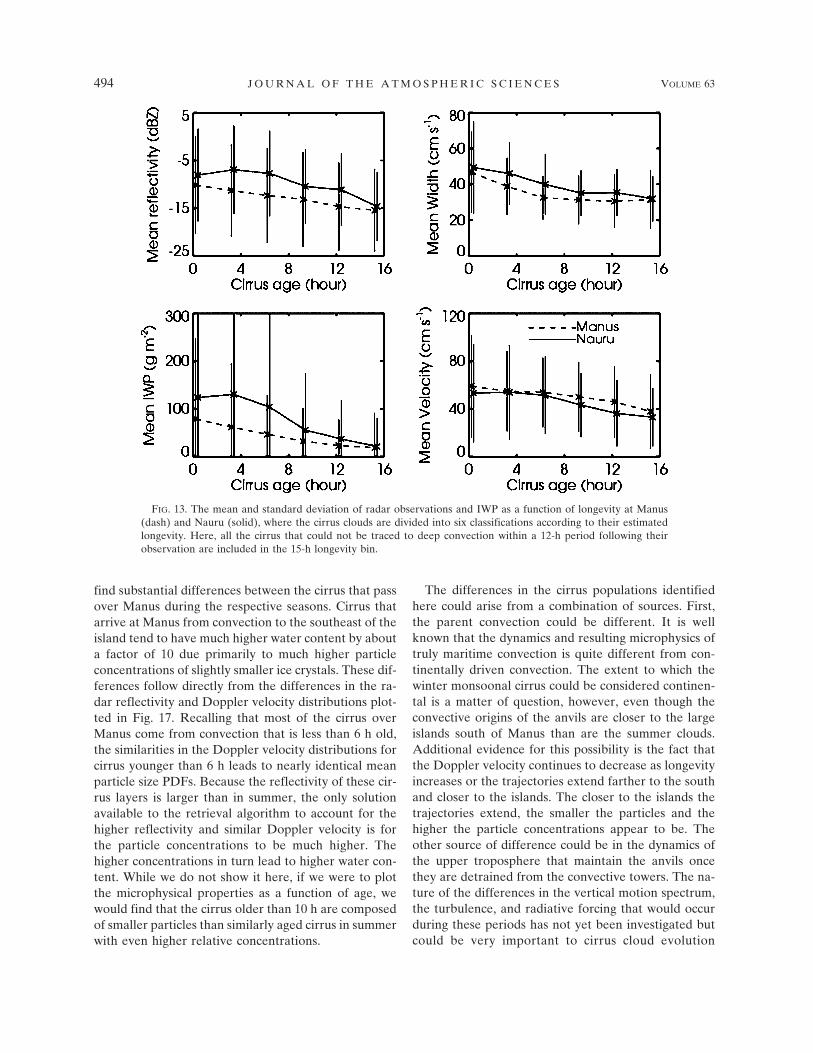
A time series of the averaged layer mean and stan-dard deviation (vertical line) of the Doppler radar mo-ments and IWP [derived from the Liu and Illingworth(2000) regression algorithm] as a function of age areplotted in Fig. 13. To calculate the layer-mean quanti-ties, we average vertically and then create the averageand standard deviation in each longevity bin from thelayer averages (the average dBZe is derived by averag-ing Ze). The radar moments and IWP at the Manus sitedecrease monotonically as the cirrus age increases.While at Nauru the mean value of radar reflectivityincreases during the first 3 h; after that it decreases also.The layer-mean Doppler velocity and spectrum widthat both sites generally decrease with increasing longev-ity. With the exception of the Nauru radar reflectivityand IWP time series in the smallest longevity bins; all ofthe trends are similar with site-dependent differences indetails. The variance, while it decreases in an absolutesense for all quantities, remains about the same magni-tude in a relative sense. For the IWP, the ratio of themean and the variance is about 1, suggesting an expo-nentially distributed quantity whose exponential slopeincreases with time. In the quantities considered here,with the exception of the Doppler spectrum width, themagnitudes continue to decrease throughout the 12-hperiod. This suggests that the cirrus cloud systems havenot reached a steady state (if they ever do) during theperiod that we are able to follow them.
The exception to this is the spectrum width. Since thisquantity represents a convolution of the dispersion ofthe particle distribution and the turbulence, the factthat it reaches a steady state in the later longevity binssuggests that the turbulence associated with the anviloutflow has decreased by the 6-h time bin and/or thatthe variance of the size distribution has ceased tochange significantly. It would seem that the former ex-planation is the most reasonable and that the nearlyconstant variance in the spectrum width beyond the 6-hbin represents the natural variability in the size distri-
FIG. 8. The cirrus trajectory obtained from the center of thetracking images at 0200 (solid) and 0800 (dot) UTC 14 Dec1999.
490 J O U R N A L O F T H E A T M O S P H E R I C S C I E N C E S VOLUME 63
bution dispersion beyond the time where the meanspectrum width ceases to change. Certainly more studyand additional data will be required to confirm thisspeculation.
5. Seasonal variation of cirrus properties at Manus
With the exception of occurrence, and vertical distri-bution, it would seem that the cirrus properties ob-served by the MMCRs at Manus and Nauru as a func-tion of age are similar to one another. Given the loca-tions of the sites, it is somewhat surprising that thedifferences are not more pronounced. Manus Island, at147°E, is in the middle of the equatorial warm pool
region northeast of Papua New Guinea where deepconvection is more numerous and cloud cover is moregeneral than at Nauru located at 167°E on the edge ofthe warm pool where convection is rare especially dur-ing La Niña years, which 1999 was.
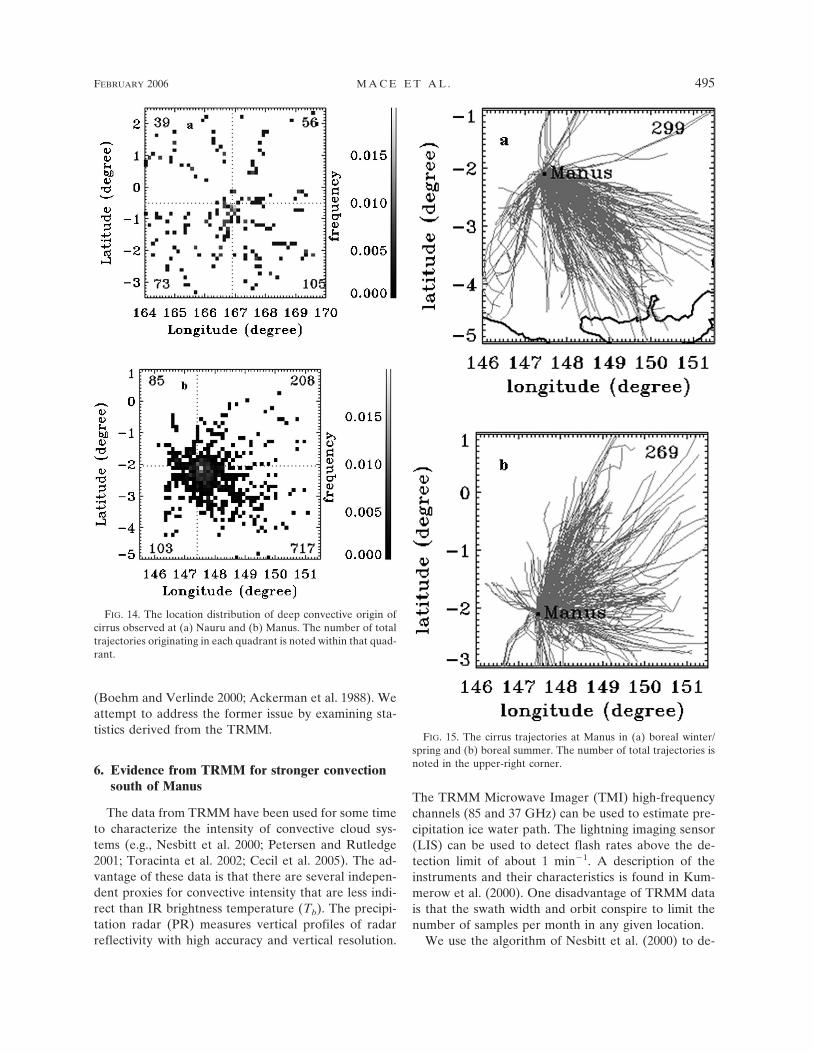
Using the trajectories that end with a convectiveevent, a geographic frequency distribution of the con-vective origin of the cirrus is constructed for each siteand plotted in Fig. 14. Manus tended to experience agreater frequency of events from the southeast, while atNauru the convection in the southwestern quadrantcontributed a significant fraction. Overall, the distribu-tion at Nauru is more random for the relatively smallnumber of events observed. Considering the cirrus lon-
FIG. 9. The GMS large-scale images for cirrus clouds observed above Nauru at t0 (0800 UTC 14 Dec 1999), t0 � 5, t0 � 9, and t0 �12. The white box is the location of the 2° � 2° tracking images. The Nauru site is noted with a white dot.
FEBRUARY 2006 M A C E E T A L . 491
gevity statistics presented earlier, about 50% of convec-tion-associated cirrus observed at Manus originate fromconvection within 3 h of the observation time, while thisstatistic increases to 9 h at Nauru.
In the Manus region we find pronounced seasonaltrends related to the migration of the intertropical con-vergence zone and the austral monsoon. During borealsummer (July–August 1999, July 2000, hereafter re-ferred to as summer), the ITCZ migrates north of theequatorial region, while during boreal winter (January–April 2000, hereafter referred to as winter), convectionis more pronounced over the large tropical islands inthe Southern Hemisphere (Mather 2003). Given a pre-dominantly easterly flow in the upper troposphere andthe fact that few islands exist in the ocean region northand east of Manus, it is reasonable to examine whetherthe cirrus advecting over Manus during winter, whenisland-based or island-influenced convection is morepronounced, are different in some way from the cirrusobserved during summer.
The trajectories of convection-associated cirrus atManus in summer and the winter periods are plotted inFig. 15. During winter, 90% of the trajectories (299) arefrom the southeast, originating from convection that is
close to the islands of New Britain and Papua NewGuinea (outlined with thick solid lines), while about80% of those (269) in summer emanate from the north-east over open ocean. This suggests that the winter an-vil cirrus observed at Manus have the potential to bemore related to convection that has a greater degree ofisland influence, while the summer anvil cirrus derivesfrom purely maritime convective sources. Recent re-sults by Yeh and Chen (2002) have shown that offshoreconvergence due to the island topography effects wouldresult in a coastal rainfall maximum. In the followingwe will consider whether and how the properties ofcirrus and its convective origin observed at Manus dur-ing these two seasons are different from one another.
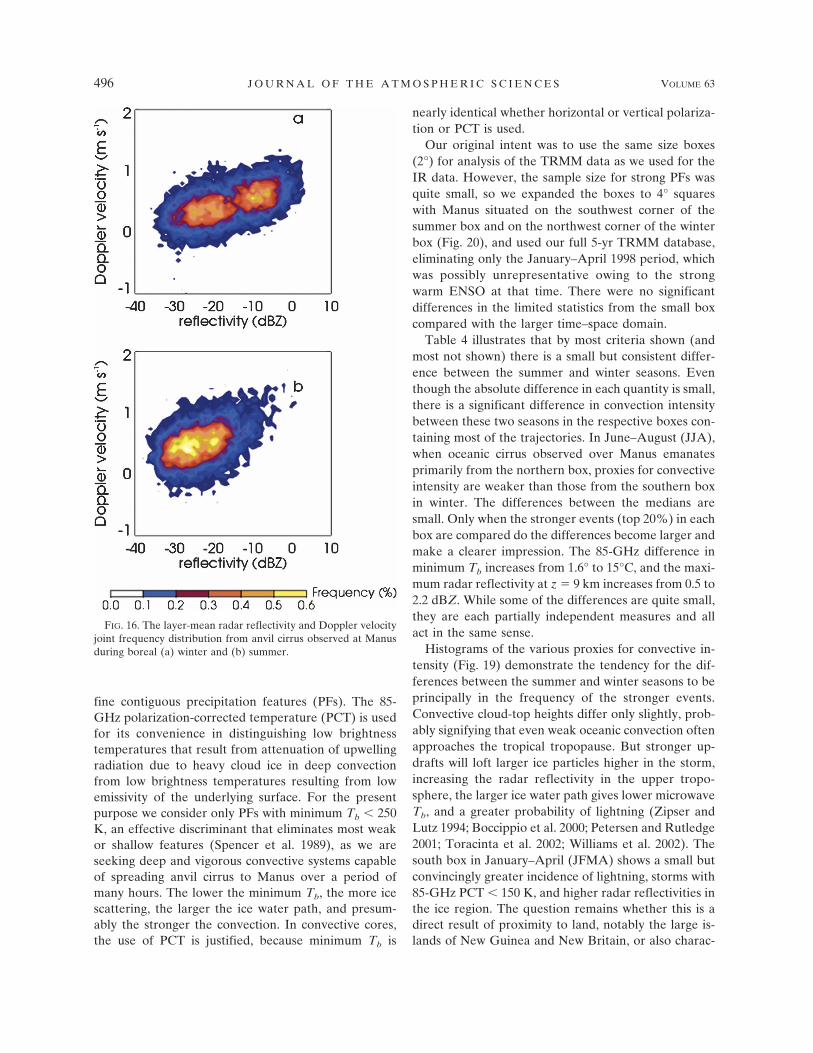
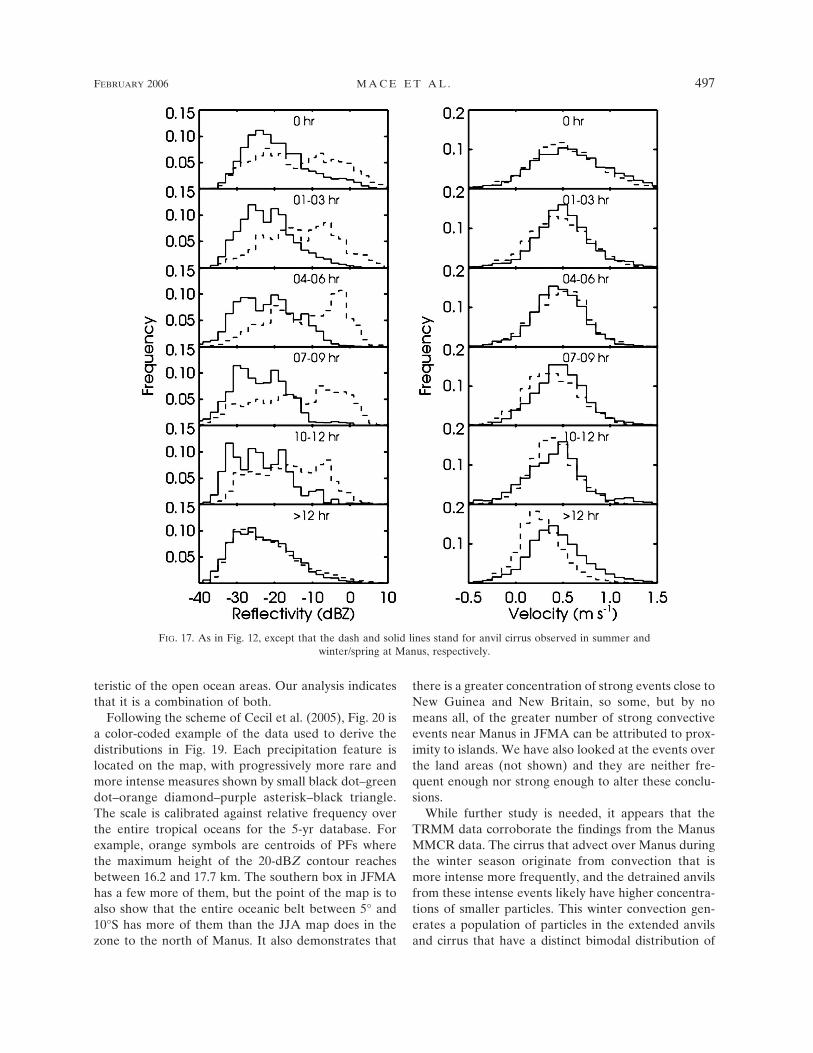
Figure 16 shows the 2D histograms of radar reflec-tivity and Doppler velocity of all anvil cirrus observedat Manus in summer and winter. Bimodality of the ra-dar reflectivity–Doppler velocity joint PDF in winter isquite obvious. The histograms of layer-mean radar re-flectivity and Doppler velocity of cirrus associated withdeep convection are plotted as a function of age in Fig.17. The anvil cirrus in winter (solid line) shows obviousbimodality in radar reflectivity in the age bins outthrough 12 h, even though the distribution narrows as
FIG. 11. The frequency distributions of anvil cirrus as a functionof longevity at Manus (dark) and Nauru (gray), where these cirrusare associated with deep convection within 0, 1–3, 4–6, 7–9, and10–12 h.
TABLE 2. Data summary of cirrus cases at the Manus and Naurusites.
Sites
Cirrusobservations
(h)
Total trajectoriesavailable from
GMS (h)
Trajectories thatintersect deepconvection (h)
Manus 3672 2334 1115 (47%)Nauru 2545 1697 273 (16%)
TABLE 3. The mean and standard deviation of the retrievedcirrus cloud microphysical properties at Manus during summerand winter (bold) seasons, shown in Fig. 18.
Mean Standard deviation
IWC (g m�3) 0.0136/0.0678 0.356/0.623Concentration (L�1) 105.53/343.25 730.9/1169.7Re (�m) 68.15/61.31 40.81/35.76Dmass (�m) 414.07/371.92 247.7/216.9
FIG. 10. The time series of estimated longevity for cirrusobserved at Nauru on 14 Dec 1999.
492 J O U R N A L O F T H E A T M O S P H E R I C S C I E N C E S VOLUME 63
the age increases. Anvil cirrus layers from the summerperiod show a minimal large reflectivity mode andslight evolution of the reflectivity PDF with age. Thesummer maritime cirrus have smaller reflectivity over-all than even the small reflectivity mode of the wintercirrus except for the classification with longevity longerthan 12 h. The Doppler velocity distributions showsubtle but important differences between these two sea-sons for longevities through 12 h. For ages less than orequal to 6 h, the Doppler velocity distributions arenearly indistinguishable from one another, yet the win-ter cirrus have a much higher radar reflectivity overall.We find a narrowing of the distributions with time anda shift of the mean values to smaller velocities. In the7–9-h and 10–12-h bins, the winter cirrus Doppler ve-locity PDF shifts to smaller fall speeds, yet the reflec-tivity remains larger than in summer. For the cirrus that
cannot be traced to deep convection, we find the re-flectivity PDFs are indistinguishable from one anotheryet a significant difference is found in the Doppler ve-locity with winter cirrus having a smaller velocity over-all. It appears that a residual difference exists in thecirrus even beyond 12 h, although it is impossible withthis data to determine if the layers reach a steady stateat some point beyond 12 h.
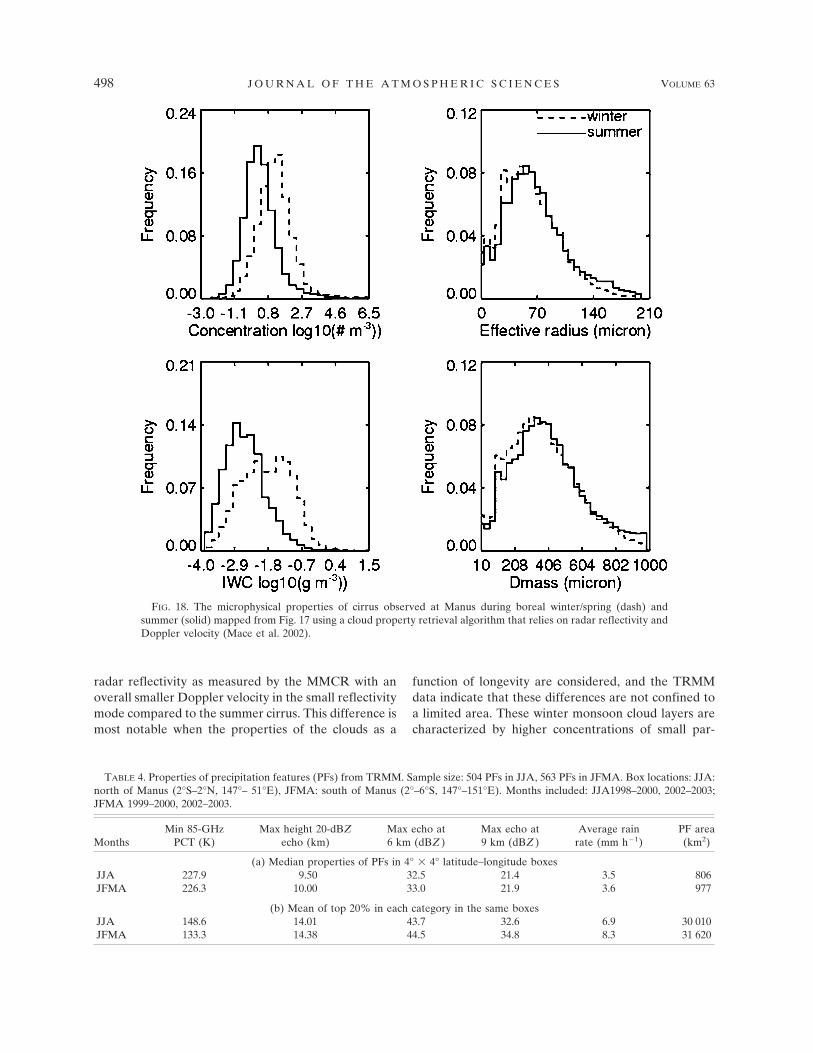
The microphysical properties can be mapped directlyfrom a combination of the radar reflectivity and theDoppler velocity (Mace et al. 2002) assuming that theparticle size distribution is exponential and that meanair motions are minimized. The microphysical proper-ties such as particle concentration, effective radius,IWC, and mass mean size are retrieved and their dis-tributions plotted in Fig. 18. The mean and standarddeviation of these properties are listed in Table 3. We
FIG. 12. The frequency distributions of (left) layer-mean radar reflectivity and (right) Doppler velocity indifferent longevity classes at Manus (dash) and Nauru (solid).
FEBRUARY 2006 M A C E E T A L . 493
find substantial differences between the cirrus that passover Manus during the respective seasons. Cirrus thatarrive at Manus from convection to the southeast of theisland tend to have much higher water content by abouta factor of 10 due primarily to much higher particleconcentrations of slightly smaller ice crystals. These dif-ferences follow directly from the differences in the ra-dar reflectivity and Doppler velocity distributions plot-ted in Fig. 17. Recalling that most of the cirrus overManus come from convection that is less than 6 h old,the similarities in the Doppler velocity distributions forcirrus younger than 6 h leads to nearly identical meanparticle size PDFs. Because the reflectivity of these cir-rus layers is larger than in summer, the only solutionavailable to the retrieval algorithm to account for thehigher reflectivity and similar Doppler velocity is forthe particle concentrations to be much higher. Thehigher concentrations in turn lead to higher water con-tent. While we do not show it here, if we were to plotthe microphysical properties as a function of age, wewould find that the cirrus older than 10 h are composedof smaller particles than similarly aged cirrus in summerwith even higher relative concentrations.
The differences in the cirrus populations identifiedhere could arise from a combination of sources. First,the parent convection could be different. It is wellknown that the dynamics and resulting microphysics oftruly maritime convection is quite different from con-tinentally driven convection. The extent to which thewinter monsoonal cirrus could be considered continen-tal is a matter of question, however, even though theconvective origins of the anvils are closer to the largeislands south of Manus than are the summer clouds.Additional evidence for this possibility is the fact thatthe Doppler velocity continues to decrease as longevityincreases or the trajectories extend farther to the southand closer to the islands. The closer to the islands thetrajectories extend, the smaller the particles and thehigher the particle concentrations appear to be. Theother source of difference could be in the dynamics ofthe upper troposphere that maintain the anvils oncethey are detrained from the convective towers. The na-ture of the differences in the vertical motion spectrum,the turbulence, and radiative forcing that would occurduring these periods has not yet been investigated butcould be very important to cirrus cloud evolution
FIG. 13. The mean and standard deviation of radar observations and IWP as a function of longevity at Manus(dash) and Nauru (solid), where the cirrus clouds are divided into six classifications according to their estimatedlongevity. Here, all the cirrus that could not be traced to deep convection within a 12-h period following theirobservation are included in the 15-h longevity bin.
494 J O U R N A L O F T H E A T M O S P H E R I C S C I E N C E S VOLUME 63
(Boehm and Verlinde 2000; Ackerman et al. 1988). Weattempt to address the former issue by examining sta-tistics derived from the TRMM.
6. Evidence from TRMM for stronger convectionsouth of Manus
The data from TRMM have been used for some timeto characterize the intensity of convective cloud sys-tems (e.g., Nesbitt et al. 2000; Petersen and Rutledge2001; Toracinta et al. 2002; Cecil et al. 2005). The ad-vantage of these data is that there are several indepen-dent proxies for convective intensity that are less indi-rect than IR brightness temperature (Tb). The precipi-tation radar (PR) measures vertical profiles of radarreflectivity with high accuracy and vertical resolution.
The TRMM Microwave Imager (TMI) high-frequencychannels (85 and 37 GHz) can be used to estimate pre-cipitation ice water path. The lightning imaging sensor(LIS) can be used to detect flash rates above the de-tection limit of about 1 min�1. A description of theinstruments and their characteristics is found in Kum-merow et al. (2000). One disadvantage of TRMM datais that the swath width and orbit conspire to limit thenumber of samples per month in any given location.
We use the algorithm of Nesbitt et al. (2000) to de-
FIG. 14. The location distribution of deep convective origin ofcirrus observed at (a) Nauru and (b) Manus. The number of totaltrajectories originating in each quadrant is noted within that quad-rant.
FIG. 15. The cirrus trajectories at Manus in (a) boreal winter/spring and (b) boreal summer. The number of total trajectories isnoted in the upper-right corner.
FEBRUARY 2006 M A C E E T A L . 495
fine contiguous precipitation features (PFs). The 85-GHz polarization-corrected temperature (PCT) is usedfor its convenience in distinguishing low brightnesstemperatures that result from attenuation of upwellingradiation due to heavy cloud ice in deep convectionfrom low brightness temperatures resulting from lowemissivity of the underlying surface. For the presentpurpose we consider only PFs with minimum Tb 250K, an effective discriminant that eliminates most weakor shallow features (Spencer et al. 1989), as we areseeking deep and vigorous convective systems capableof spreading anvil cirrus to Manus over a period ofmany hours. The lower the minimum Tb, the more icescattering, the larger the ice water path, and presum-ably the stronger the convection. In convective cores,the use of PCT is justified, because minimum Tb is
nearly identical whether horizontal or vertical polariza-tion or PCT is used.
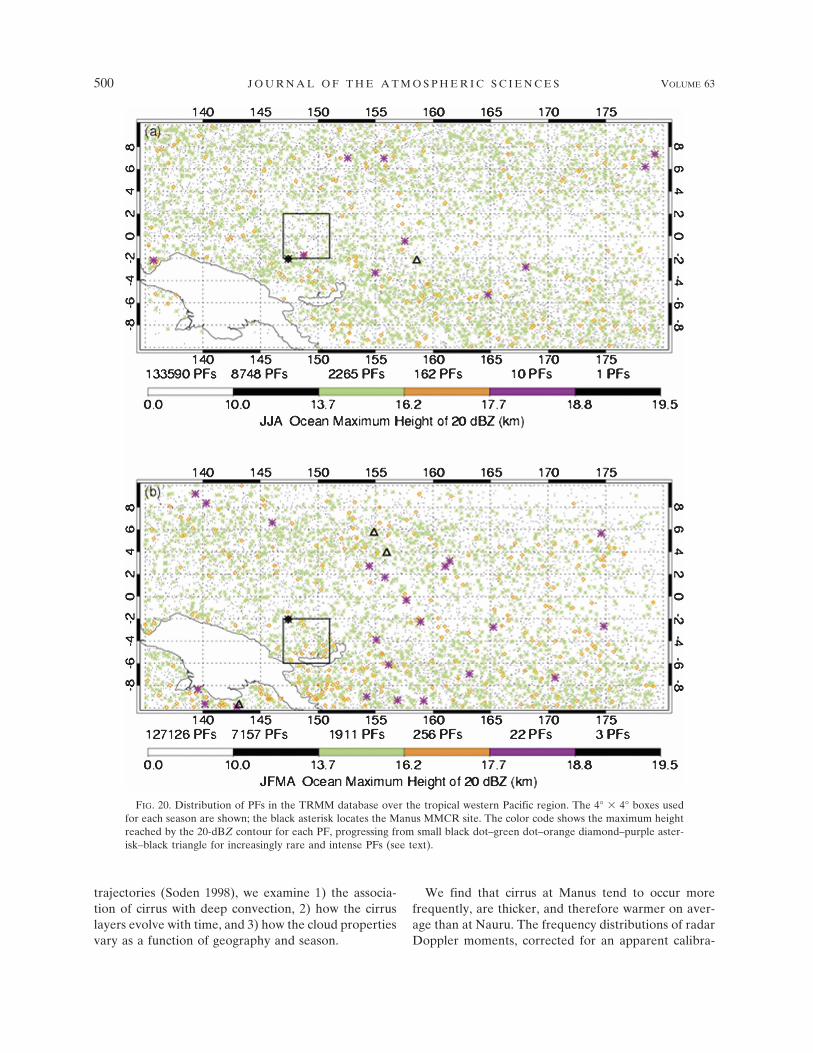
Our original intent was to use the same size boxes(2°) for analysis of the TRMM data as we used for theIR data. However, the sample size for strong PFs wasquite small, so we expanded the boxes to 4° squareswith Manus situated on the southwest corner of thesummer box and on the northwest corner of the winterbox (Fig. 20), and used our full 5-yr TRMM database,eliminating only the January–April 1998 period, whichwas possibly unrepresentative owing to the strongwarm ENSO at that time. There were no significantdifferences in the limited statistics from the small boxcompared with the larger time–space domain.
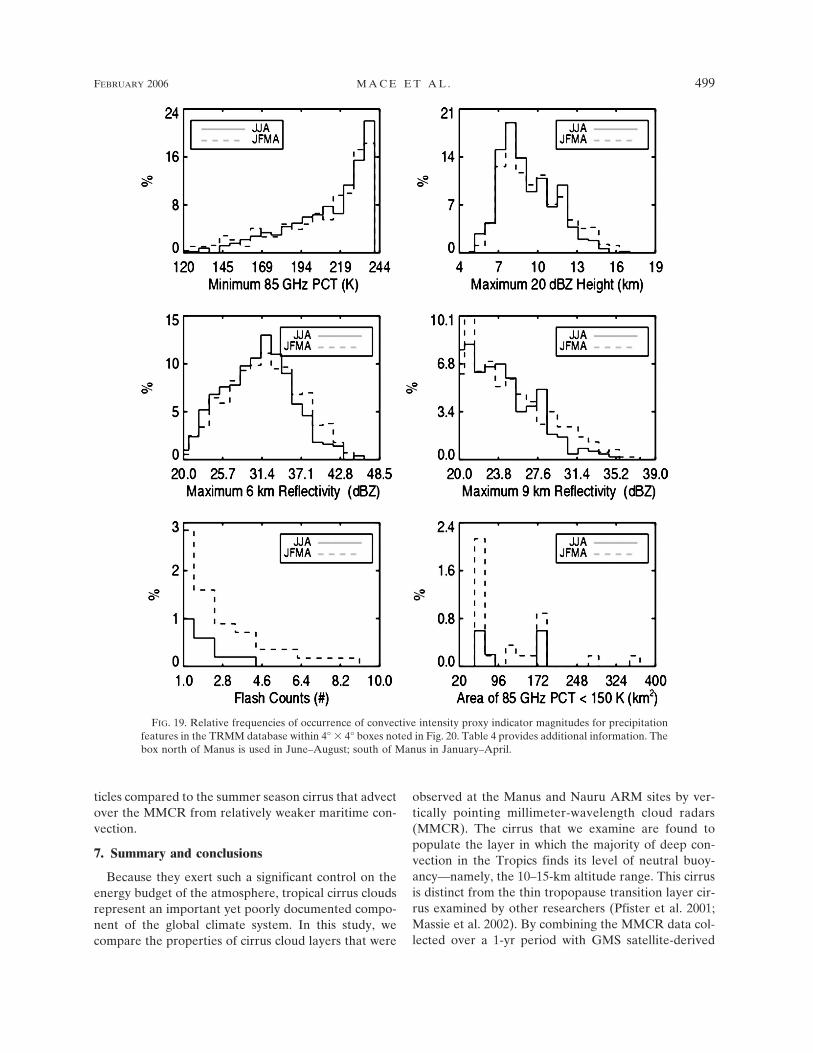
Table 4 illustrates that by most criteria shown (andmost not shown) there is a small but consistent differ-ence between the summer and winter seasons. Eventhough the absolute difference in each quantity is small,there is a significant difference in convection intensitybetween these two seasons in the respective boxes con-taining most of the trajectories. In June–August (JJA),when oceanic cirrus observed over Manus emanatesprimarily from the northern box, proxies for convectiveintensity are weaker than those from the southern boxin winter. The differences between the medians aresmall. Only when the stronger events (top 20%) in eachbox are compared do the differences become larger andmake a clearer impression. The 85-GHz difference inminimum Tb increases from 1.6° to 15°C, and the maxi-mum radar reflectivity at z � 9 km increases from 0.5 to2.2 dBZ. While some of the differences are quite small,they are each partially independent measures and allact in the same sense.
Histograms of the various proxies for convective in-tensity (Fig. 19) demonstrate the tendency for the dif-ferences between the summer and winter seasons to beprincipally in the frequency of the stronger events.Convective cloud-top heights differ only slightly, prob-ably signifying that even weak oceanic convection oftenapproaches the tropical tropopause. But stronger up-drafts will loft larger ice particles higher in the storm,increasing the radar reflectivity in the upper tropo-sphere, the larger ice water path gives lower microwaveTb, and a greater probability of lightning (Zipser andLutz 1994; Boccippio et al. 2000; Petersen and Rutledge2001; Toracinta et al. 2002; Williams et al. 2002). Thesouth box in January–April (JFMA) shows a small butconvincingly greater incidence of lightning, storms with85-GHz PCT 150 K, and higher radar reflectivities inthe ice region. The question remains whether this is adirect result of proximity to land, notably the large is-lands of New Guinea and New Britain, or also charac-
FIG. 16. The layer-mean radar reflectivity and Doppler velocityjoint frequency distribution from anvil cirrus observed at Manusduring boreal (a) winter and (b) summer.
496 J O U R N A L O F T H E A T M O S P H E R I C S C I E N C E S VOLUME 63
Fig 16 live 4/C
teristic of the open ocean areas. Our analysis indicatesthat it is a combination of both.
Following the scheme of Cecil et al. (2005), Fig. 20 isa color-coded example of the data used to derive thedistributions in Fig. 19. Each precipitation feature islocated on the map, with progressively more rare andmore intense measures shown by small black dot–greendot–orange diamond–purple asterisk–black triangle.The scale is calibrated against relative frequency overthe entire tropical oceans for the 5-yr database. Forexample, orange symbols are centroids of PFs wherethe maximum height of the 20-dBZ contour reachesbetween 16.2 and 17.7 km. The southern box in JFMAhas a few more of them, but the point of the map is toalso show that the entire oceanic belt between 5° and10°S has more of them than the JJA map does in thezone to the north of Manus. It also demonstrates that
there is a greater concentration of strong events close toNew Guinea and New Britain, so some, but by nomeans all, of the greater number of strong convectiveevents near Manus in JFMA can be attributed to prox-imity to islands. We have also looked at the events overthe land areas (not shown) and they are neither fre-quent enough nor strong enough to alter these conclu-sions.
While further study is needed, it appears that theTRMM data corroborate the findings from the ManusMMCR data. The cirrus that advect over Manus duringthe winter season originate from convection that ismore intense more frequently, and the detrained anvilsfrom these intense events likely have higher concentra-tions of smaller particles. This winter convection gen-erates a population of particles in the extended anvilsand cirrus that have a distinct bimodal distribution of
FIG. 17. As in Fig. 12, except that the dash and solid lines stand for anvil cirrus observed in summer andwinter/spring at Manus, respectively.
FEBRUARY 2006 M A C E E T A L . 497
radar reflectivity as measured by the MMCR with anoverall smaller Doppler velocity in the small reflectivitymode compared to the summer cirrus. This difference ismost notable when the properties of the clouds as a
function of longevity are considered, and the TRMMdata indicate that these differences are not confined toa limited area. These winter monsoon cloud layers arecharacterized by higher concentrations of small par-
TABLE 4. Properties of precipitation features (PFs) from TRMM. Sample size: 504 PFs in JJA, 563 PFs in JFMA. Box locations: JJA:north of Manus (2°S–2°N, 147°– 51°E), JFMA: south of Manus (2°–6°S, 147°–151°E). Months included: JJA1998–2000, 2002–2003;JFMA 1999–2000, 2002–2003.
MonthsMin 85-GHz
PCT (K)Max height 20-dBZ
echo (km)Max echo at6 km (dBZ )
Max echo at9 km (dBZ )
Average rainrate (mm h�1)
PF area(km2)
(a) Median properties of PFs in 4° � 4° latitude–longitude boxesJJA 227.9 9.50 32.5 21.4 3.5 806JFMA 226.3 10.00 33.0 21.9 3.6 977
(b) Mean of top 20% in each category in the same boxesJJA 148.6 14.01 43.7 32.6 6.9 30 010JFMA 133.3 14.38 44.5 34.8 8.3 31 620
FIG. 18. The microphysical properties of cirrus observed at Manus during boreal winter/spring (dash) andsummer (solid) mapped from Fig. 17 using a cloud property retrieval algorithm that relies on radar reflectivity andDoppler velocity (Mace et al. 2002).
498 J O U R N A L O F T H E A T M O S P H E R I C S C I E N C E S VOLUME 63
ticles compared to the summer season cirrus that advectover the MMCR from relatively weaker maritime con-vection.
7. Summary and conclusions
Because they exert such a significant control on theenergy budget of the atmosphere, tropical cirrus cloudsrepresent an important yet poorly documented compo-nent of the global climate system. In this study, wecompare the properties of cirrus cloud layers that were
observed at the Manus and Nauru ARM sites by ver-tically pointing millimeter-wavelength cloud radars(MMCR). The cirrus that we examine are found topopulate the layer in which the majority of deep con-vection in the Tropics finds its level of neutral buoy-ancy—namely, the 10–15-km altitude range. This cirrusis distinct from the thin tropopause transition layer cir-rus examined by other researchers (Pfister et al. 2001;Massie et al. 2002). By combining the MMCR data col-lected over a 1-yr period with GMS satellite-derived
FIG. 19. Relative frequencies of occurrence of convective intensity proxy indicator magnitudes for precipitationfeatures in the TRMM database within 4° � 4° boxes noted in Fig. 20. Table 4 provides additional information. Thebox north of Manus is used in June–August; south of Manus in January–April.
FEBRUARY 2006 M A C E E T A L . 499
trajectories (Soden 1998), we examine 1) the associa-tion of cirrus with deep convection, 2) how the cirruslayers evolve with time, and 3) how the cloud propertiesvary as a function of geography and season.
We find that cirrus at Manus tend to occur morefrequently, are thicker, and therefore warmer on aver-age than at Nauru. The frequency distributions of radarDoppler moments, corrected for an apparent calibra-
FIG. 20. Distribution of PFs in the TRMM database over the tropical western Pacific region. The 4° � 4° boxes usedfor each season are shown; the black asterisk locates the Manus MMCR site. The color code shows the maximum heightreached by the 20-dBZ contour for each PF, progressing from small black dot–green dot–orange diamond–purple aster-isk–black triangle for increasingly rare and intense PFs (see text).
500 J O U R N A L O F T H E A T M O S P H E R I C S C I E N C E S VOLUME 63
Fig 20 live 4/C
tion error at Manus, also show differences with overalllarger radar reflectivity and Doppler velocity at Manus,while the cirrus at Nauru appear to be more uniformwith less variability than the cirrus over Manus. Giventhe geographical locations of the ARM sites, these find-ings are not surprising.
To further explore these differences, we examinedthe association of the observed cirrus with deep con-vection by combining the MMCR observations withtrajectories derived from GMS data. The 12-h satelliteback trajectories allowed us to explore the cirrus his-tory and hence helped us to investigate their associationwith deep convection. From the one-year dataset, wefound that less than half of the observed cirrus at theARM sites can be traced to deep convection within a12-h period. Cirrus at Manus are associated with deepconvection more often (47% of all cirrus observed)than at Nauru (16%). These results are significant be-cause they suggest that cirrus in the Tropics mustevolve in some way from detrained anvils into entitiesthat are maintained by some other dynamical process(i.e., Lilly 1988; Sherwood 1996) that allows the layersto persist for extended periods of time. Consider that anice crystal with a terminal velocity of 20 cm s�1 (a lowrough average from the MMCR) would take just 6 h todescend 5 km through the layer of peak cirrus occur-rence and 12 h to fall from 15 km to the freezing level.
The cirrus properties show a distinct evolution withlayer age from a deep convective origin. The radar mo-ments and IWP of the cirrus at both sites generally varyin a remarkably similar way (Figs. 13 and 14). Theyoung anvil cirrus tend to have a bimodal distributionof radar reflectivity and broad PDFs of Doppler veloc-ity and Doppler spectrum width. As the anvils age, thebimodal structure of the reflectivity PDF evolves into amore unimodal distribution as the large reflectivitymode decays. As this occurs, the velocity and spectrumwidth PDFs narrow and migrate to lower values. Thisevolution continues through 12 h for the reflectivity andDoppler velocity. However, the spectrum width reachesa minimum at 6 h, implying perhaps that the turbulenceassociated with the initial detrainment (Lilly 1988) hassmoothed to a background level. It may also be the casethat the signal processing of the radar observations isunable to resolve further decrease in the spectrumwidth.
The temporal evolution of cirrus also seems to besensitive to the properties of the parent deep convec-tion. We divide the trajectories by season at Manuswhere, during boreal winter, the trajectories emanatefrom convection that occurs to the south and east of theisland, while during boreal summer the trajectoriesoriginate in the maritime regions north and east of the
island. We found distinct differences between thesepopulations with winter cirrus having overall higher wa-ter contents and also higher concentrations of smallparticles compared to the summer season maritime cir-rus. These findings are consistent with TRMM data thatshow evidence for a higher frequency of more intenseconvection south and east of Manus during the wintermonsoon compared to summer. The TRMM data alsoindicate that the stronger convection to the south ispartly influenced by the proximity to large islands, butthat this stronger winter monsoon convection extendsfar to the east as well. While the causes of these differ-ences are unknown at this time, we can conclude that, ifwe are to understand and model the effect of tropicalcirrus on the radiation and water budgets in the Trop-ics, both the nature of the parent deep convection andthe dynamical maintenance of the cirrus layers must becorrectly accounted for.
Although this research provides some limited insightinto the nature and evolution of tropical cirrus in rela-tion to deep convection, this study is compiled fromobservations collected during a fairly short period oftime during the waning months of a strong La Niñaepisode. By considering the data as a statistical entity,we are making an implicit assumption that the datasetrepresents a statistically stationary snapshot of tropicalcirrus and that, by categorizing the cirrus based on lon-gevity, we can gain information on the evolution ofthese clouds during their existence. If the processes,presumably driven by the very largest dynamical scales,were changing with time over the entire basin, then ourimplicit assumptions may not be valid. Therefore, con-sideration of additional years of data will be required toconfirm these results. Beyond simply examining moredata, these observational results should be combinedwith process modeling of tropical cirrus evolution. Ex-ploiting the synergy of observations and cloud-scalemodeling is essential if our understanding of the pro-cesses leading to the observed evolution of tropical cir-rus is to be improved so that parameterizations in cli-mate models can eventually be considered realistic.
Acknowledgments. This research has been supportedby the Environmental Science Division of the U.S. De-partment of Energy (Grants DE-FG0398ER62571 andDE-FG02-05ER64035). Data were obtained from theAtmospheric Radiation Measurement Program spon-sored by the U.S. Department of Energy, Office of Sci-ence, Office of Biological and Environmental Re-search, Environmental Science Division. Analysis ofthe TRMM data was supported by the NASA TRMMOffice under grant NAG5-136280682. TRMM data as-sistance was provided by Yaping Li and especially
FEBRUARY 2006 M A C E E T A L . 501
Chuntao Liu. We gratefully acknowledge many insight-ful conversations with Dr. Steve Krueger during theearly phases of this research. Paul F. Hein assisted gen-erously in the acquisition and interpretation of the MITradar data.
REFERENCES
Ackerman, T. P., and G. Stokes, 2003: The atmospheric radiationmeasurement program. Phys. Today, 56, 38–45.
——, K.-N, Liou, F. P. J. Valero, and L. Pfister, 1988: Heatingrates in tropical anvils. J. Atmos. Sci., 45, 1606–1623.
Adler, R. F., M. J. Markus, G. Szejwach, W. E. Shenk, and D. D.Fenn, 1983: Thunderstorm top structure observed by aircraftover flights with an infrared radiometer. J. Climate Appl.Meteor., 22, 579–593.
Boccippio, D. J., S. J. Goodman, and S. Heckman, 2000: Regionaldifferences in tropical lightning observations. J. Appl. Me-teor., 39, 2231–2248.
Boehm, M. T., and J. Verlinde, 2000: Stratospheric influence onupper tropospheric tropical cirrus. Geophys. Res. Lett., 27,3209–3212.
Boer, E. R., and V. Ramanathan, 1997: Lagrangian approach forderiving cloud characteristics from satellite observations andits implications to cloud parameterization. J. Geophys. Res.,102, 21 383–21 399.
Cecil, D. J., S. J. Goodman, D. J. Boccippio, E. J. Zipser, andS. W. Nesbitt, 2005: Three years of TRMM precipitation fea-tures. Part 1: Radar, radiometric, and lightning characteris-tics. Mon. Wea. Rev., 133, 543–566.
Clothiaux, E. E., M. A. Miller, B. A. Albrecht, T. P. Ackerman, J.Velinde, D. M. Babb, R. M. Peters, and W. J. Syrett, 1995:An evaluation of a 94-GHz radar for remote sensing of cloudproperties. J. Atmos. Oceanic Technol., 12, 201–229.
Comstock, J. M., T. P. Ackerman, and G. G. Mace, 2002: Ground-based lidar and radar remote sensing of tropical cirrus cloudsat Nauru Island: Cloud statistics and radiative impacts. J.Geophys. Res., 107, 4714, doi:10.1029/2002JD002203.
DeMott, C. A., and S. A. Rutledge, 1998: The vertical structure ofTOGA COARE convection. Part I: radar echo distributions.J. Atmos. Sci., 55, 2730–2747.
Dessler, A. E., 2002: The effect of deep-tropical convection on thetropical tropopause layer. J. Geophys. Res., 107, 4033,doi:10.1029/2001JD000511.
——, and S. C. Sherwood, 2000: Simulation of tropical upper tro-pospheric humidity. J. Geophys. Res., 106, 20 155–20 163.
——, and P. Yang, 2003: The distribution of tropical thin cirrusclouds inferred from Terra MODIS data. J. Climate, 16, 1241–1247.
Doelling, D. R., M. M. Khaiyher, D. A. Spangenburg, M. L. Nor-deen, V. Chakrapani, A. V. Gambgheer, J. Huang, and P.Minnis, 2003: The evolution of convective cloud systems de-termined by GOES-8 during CRYSTAL-FACE. Proc.CRYSTAL-FACE Science Team Meeting, Salt Lake City,UT, NASA.
Gossard, E. E., 1994: Measurement of cloud droplet size spectraby Doppler radar. J. Atmos. Oceanic Technol., 11, 712–726.
Hartmann, D. L., 1993: Radiative effects of clouds on Earth’s cli-mate. Aerosol–Cloud–Climate Interactions, P. V. Hobbs, Ed.,International Geophysical Series 54, Academic Press, 151–173.
——, 2002: Tropical surprise (climate change causes). Science,295, 811–812.
Heymsfield, A. J., and J. Iaquinta, 2000: Cirrus crystal terminalvelocities. J. Atmos. Sci., 57, 916–938.
Inoue, T., 1987: A cloud type classification with NOAA-7 splitwindow measurements. J. Geophys. Res., 92, 3991–4000.
Jensen, E. J., O. B. Toon, W. S. Kinne, and A. J. Heymsfield,1994: Microphysical modeling of cirrus, 1. Comparison with1986 FIRE IFO measurements. J. Geophys. Res., 99, 10 421–10 442.
——, ——, H. B. Selkirk, J. D. Spinhirne, and M. R. Schoeberl,1996: On the formation and persistence of subvisible cirrusclouds near the tropical tropopause. J. Geophys. Res., 101,21 361–21 375.
Knollenberg, R. G., K. Kelly, and J. C. Wilson, 1993: Measure-ments of high number densities of ice crystal populations intropical stratospheric cumulonimbus anvils. J. Geophys. Res.,98, 8639–8664.
Kummerow, C., and Coauthors, 2000: The status of the TropicalRain Measuring Mission (TRMM) after 2 years in orbit. J.Appl. Meteor., 39, 1965–1982.
Lilly, D. K., 1988: Cirrus outflow dynamics. J. Atmos. Sci., 45,1594–1605.
Liou, K.-N., 1986: Influence of cirrus clouds on weather and cli-mate processes: A global perspective. Mon. Wea. Rev., 114,1167–1200.
——, S. C. Ou, Y. Takano, F. P. J. Valero, and T. P. Ackerman,1990: Remote sounding of the tropical cirrus cloud tempera-ture and optical depth using 6.5 and 10.5 �m radiometersduring the STEP. J. Appl. Meteor., 29, 716–726.
Liu, C. L., and A. J. Illingworth, 2000: Toward more accurate re-trieval of ice water content from radar measurements ofclouds. J. Appl. Meteor., 39, 1130–1146.
Luo, Z. Z., 2004: Characterizing tropical cirrus life cycle, evolu-tion, and interaction with upper-tropospheric water vaporusing Lagrangian trajectory analysis of satellite observation.J. Climate, 17, 4541–4563.
Mace, G. G., and S. Benson-Troth, 2002: Cloud-layer overlapcharacteristics derived from long-term cloud radar data. J.Climate, 15, 2505–2515.
——, A. J. Heymsfield, and M. Poellot, 2002: On retrieving themicrophysical properties of cirrus clouds using the momentsof the millimeter-wavelength Doppler spectrum. J. Geophys.Res., 107, 4815, doi:10.1029/2001JD001308.
Massie, S., A. Gettelman, W. Randel, and D. Baumgardner, 2002:Distribution of tropical cirrus in relation to convection. J.Geophys. Res., 107, 4591–4607.
Mather, J. H., 2003: Patterns of convection in the tropical westernPacific. Proc. 13th ARM Science Team Meeting, Broomfield,CO, U.S. Department of Energy.
——, T. A. Ackerman, and M. P. Jensen, 1998: Characteristics ofthe atmospheric state and the surface radiation budget at thetropical western pacific ARM site. Geophys. Res. Lett., 25,4513–4516.
McFarquhar, G. M., and A. J. Heymsfield, 1996: Microphysicalcharacteristics of three anvils sampled during the CentralEquatorial Pacific Experiment. J. Atmos. Sci., 53, 2401–2423.
Mitchell, D. L., S. K. Chai, Y. L. Liu, A. J. Heymsfield, and Y.Dong, 1997: Modeling cirrus cloud. Part 1: Treatment of bi-modal size spectra and cases study analysis. J. Atmos. Sci., 54,1710–1723.
502 J O U R N A L O F T H E A T M O S P H E R I C S C I E N C E S VOLUME 63
Moran, K. P., B. E. Martner, M. J. Post, R. A. Kropfli, D. C.Welsh, and K. B. Widener, 1998: An unattended cloud pro-filing radar for use in climate research. Bull. Amer. Meteor.Soc., 79, 443–455.
Nesbitt, S. W., E. J. Zipser, and D. J. Cecil, 2000: A census ofprecipitation features in the tropics using TRMM: Radar, icescattering, and lightning observations. J. Climate, 13, 4087–4106.
Petersen, W. A., and S. A. Rutledge, 2001: Regional variability intropical convection: Observations from TRMM. J. Climate,14, 3566–3586.
Pfister, L., and Coauthors, 2001: Aircraft observation of thin cir-rus clouds near the tropical tropopause. J. Geophys. Res., 106,9765–9786.
Sherwood, S. C., 1996: Maintenance of the free-tropospherictropical water vapor distribution. Part I: Clear regime budget.J. Climate, 9, 2903–2918.
Soden, B. J., 1998: Tracking upper tropospheric water vapor ra-diances: a satellite perspective. J. Geophys. Res., 103, 17 069–17 081.
——, 2004: The impact of tropical convection and cirrus on uppertropospheric humidity: A lagrangian analysis of satellite mea-surements. Geophys. Res. Lett., 31, L20104, doi:10.1029/2004GL020980.
——, and R. Fu, 1995: A satellite analysis of deep convection,upper-tropospheric humidity, and the greenhouse effect. J.Climate, 8, 2333–2351.
Spencer, R. W., H. M. Goodman, and R. E. Hood, 1989: Precipi-tation retrieval over land and ocean with the SSM/I: Identi-fication and characteristics of the scattering signal. J. Atmos.Oceanic Technol., 6, 254–273.
Stephens, G. L., 2005: Cloud feedbacks in the climate system: Acritical review. J. Climate, 18, 237–273.
——, S. C. Tsay, P. W. Stackhouse, and P. J. Flatau, 1990: Therelevance of the microphysical and radiative properties ofcirrus clouds to climate and climatic feedback. J. Atmos. Sci.,47, 1742–1753.
Steranka, J., E. B. Rodgers, and R. C. Gentry, 1984: Diurnalvariation of Atlantic Ocean tropical cyclone cloud distribu-tion inferred from geostationary satellite infrared measure-ments. Mon. Wea. Rev., 112, 2338–2344.
Szoke, E. J., and E. J. Zipser, 1986: A radar study of convectivecells in mesoscale systems in GATE. Part II: Life cycles ofconvective cells. J. Atmos. Sci., 43, 199–218.
Toracinta, E. R., E. J. Zipser, D. J. Cecil, and S. W. Nesbitt, 2002:Radar, passive microwave, and lightning characteristics ofprecipitating systems in the Tropics. Mon. Wea. Rev., 130,802–824.
VanReken, T. M., T. A. Rissman, G. C. Roberts, V. Varutbankul,H. H. Jonsson, R. C. Flagan, and J. H. Seinfeld, 2003: Towardaerosol/cloud condensation nuclei (CCN) closure duringCRYSTAL-FACE. J. Geophys. Res., 108, 4633, doi:10.1029/2003JD003582.
Williams, E., and Coauthors, 2002: Contrasting convective re-gimes over the Amazon: Implications for cloud electrifica-tion. J. Geophys. Res., 107, 8082, doi:10.1029/2001JD000380.
Yeh, H., and Y. Chen, 2002: The role of offshore convergence oncoastal rainfall during TAMEX IOP 3. Mon. Wea. Rev., 130,2709–2730.
Zipser, E. J., 1988: The evolution of mesoscale convective sys-tems: Evidence from radar and satellite observations. Tropi-cal Rainfall Measurements, J. Theon and N. Fugono, Eds., A.Deepak Publishing, 159–166.
——, and K. Lutz, 1994: The vertical profile of radar reflectivity ofconvective cells: A strong indicator of storm intensity andlightning probability? Mon. Wea. Rev., 122, 1751–1759.
FEBRUARY 2006 M A C E E T A L . 503