Embed Size (px)
Citation preview

RESEARCH ARTICLE Open Access
Associations between dietary patterns and10-year cardiovascular disease risk scorelevels among Chinese coal miners——across-sectional studyQian Sun1, Jin-Sha Ma1, Hui Wang1, Shu-Hong Xu2, Jun-Kang Zhao1, Qian Gao1, Jian-Jun Huang3 andTong Wang1*
Abstract
Background: Diet-related cardiovascular diseases have produced a large health burden in China. Coal miners are ahigh-risk population for cardiovascular disease, but there is little evidence concerning associations between coalminers’ dietary patterns and their 10-year cardiovascular disease risk score levels.
Methods: The study included 2632 participants and focused on dietary patterns associated with higher 10-yearcardiovascular disease risk score levels. A valid semi-quantitative food frequency questionnaire was used to collectdata regarding dietary intake, and dietary patterns were identified using factor analysis combined with clusteranalysis. Logistic regression was used to assess associations between dietary patterns and 10-year cardiovasculardisease risk score levels.
Results: For ground workers, compared with the ‘Healthy’ pattern, the ‘High-salt’ and ‘Refined grains’ patterns weresignificantly associated with higher 10-year atherosclerotic cardiovascular disease risk score level (OR: 1.50, 95% CI:1.02–2.21; OR: 1.92, 95% CI: 1.26–2.93) and 10-year ischemic cardiovascular disease risk score level (OR: 2.18, 95% CI:1.25–3.80; OR: 2.64, 95% CI: 1.48–4.72) adjusted for gender, and behavioural and socioeconomic factors. The ‘High-fat and salt’ pattern was significantly associated with higher 10-year ischemic cardiovascular disease risk score level(OR: 1.97, 95% CI: 1.13–3.42). For underground workers, the ‘High-salt’ pattern was significantly associated withhigher 10-year atherosclerotic cardiovascular disease risk score level (OR: 1.65, 95% CI: 1.16–2.36) and 10-yearischemic cardiovascular disease risk score level (OR: 1.76, 95% CI: 1.09–2.84).
Conclusions: This study provides evidence for dietary patterns associated with higher 10-year cardiovasculardisease risk score levels in Chinese miners, and facilitates relevant departments in designing effective dietaryguidelines to ameliorate dietary structures.
Keywords: Dietary pattern, 10-year atherosclerosis cardiovascular disease risk score level, 10-year ischemiccardiovascular diseases risk score level
© The Author(s). 2019 Open Access This article is distributed under the terms of the Creative Commons Attribution 4.0International License (http://creativecommons.org/licenses/by/4.0/), which permits unrestricted use, distribution, andreproduction in any medium, provided you give appropriate credit to the original author(s) and the source, provide a link tothe Creative Commons license, and indicate if changes were made. The Creative Commons Public Domain Dedication waiver(http://creativecommons.org/publicdomain/zero/1.0/) applies to the data made available in this article, unless otherwise stated.
* Correspondence: [email protected] of Health Statistics, School of Public Health, Shanxi MedicalUniversity, 56 Xinjiannanlu Street, Taiyuan 030001, ChinaFull list of author information is available at the end of the article
Sun et al. BMC Public Health (2019) 19:1704 https://doi.org/10.1186/s12889-019-8070-9

BackgroundCurrently, cardiovascular disease (CVD) accounts forabout one-third of all deaths worldwide [1]. In China,CVD is the leading cause of death and disease burden[2–4], and two out of five deaths are attributed to CVD[3]. The mortality, incidence, and prevalence of diet-related CVD have been increasing over the past 30 years,and now the number of CVD patients has reached 290million [3]. Among CVDs, atherosclerosis cardiovasculardiseases (ASCVD) have remained at a high prevalence,and ischemic cardiovascular diseases (ICVD) have pro-duced large health burden [2, 5]. Each CVD is undesir-able for maintaining a healthy population, and previousstudies have shown that coal mining areas have higherCVD risk and mortality than non-coal mining areas [6–8], so to improve the primary prevention of CVD, coalminers’ health should be taken seriously.In recent years, the global food system and food supply
have been shifting rapidly [9]. The Chinese diet used tobe characterized by coarse grains, but now it has beentransformed into a dietary structure based on refinedcarbohydrates [10]. At the same time, because of im-provements in living conditions, consumption of meat inthe diet has increased significantly [11, 12]. Dietaryhabits play a key role in CVD primordial prevention[13], and a diet high in fat or refined foods is clearly notconducive to the control or prevention of CVD [14].Coal miners are characterized by lower socioeconomicstatus and education levels compared to the generalpopulation, and for these reasons, coal miners are morelikely to have poor eating habits [15]. Therefore, it is ne-cessary to pay attention to the suboptimal diet of coalminers for CVD prevention. Current evidence on theimpact of coal miners’ dietary pattern on CVD is scant.Therefore, this study focused on the dietary patterns as-sociated with 10-year CVD risk score levels, so it mayoffer potential benefits for primary prevention of CVDin miners by identifying suboptimal diets, and facilitaterelevant departments in designing effective dietaryguidelines.Considering the potential influence of work environ-
ment [16, 17], this study stratified the participants basedon workplace and identified the dietary patterns associ-ated with higher 10-year CVD risk score levels, including10-year ASCVD and ICVD risk score levels, separately.
MethodsStudy populationParticipants were drawn from The TONGMEI study,which was designed to investigate coal miners’ healthstatus and was conducted in 2013 in Shanxi Province inChina. This study enrolled 3265 people aged between 35and 65 years old. Of these, 30 people with self-reportedcardiovascular events, 104 people with insufficient data
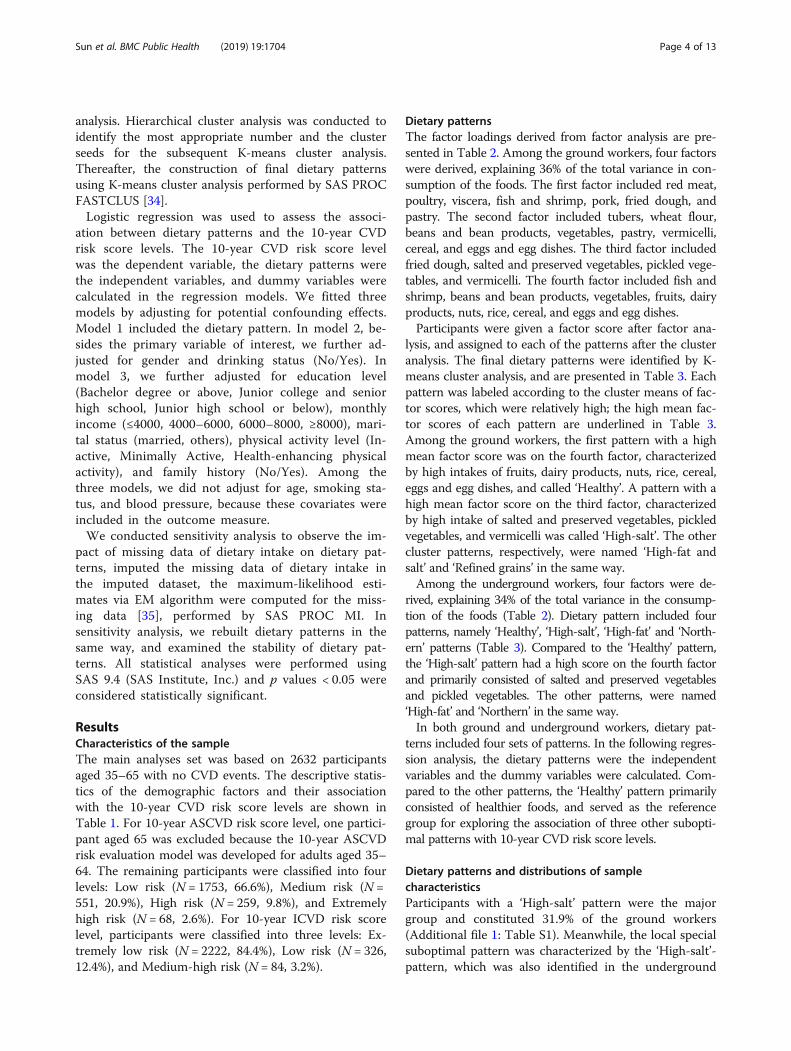
about baseline information, 274 people with missingdata about one or more variables of diet required in theanalysis, and 225 people with abnormal values of diet orphysical activity information identified by relative guide-lines, were excluded from the analysis [18]. Therefore,the current analyses were based on data from 2632people. The sampling of the TONGMEI study, a cross-sectional study, has been described in detail elsewhere[19]. A flowchart presents the analytical sample, exclud-ing ineligible individuals (Fig. 1).
Assessment of general information and covariatesData on general information including marital status,education level, monthly income, work type, alcoholconsumption, and family history of illness were collectedusing a self-administered baseline questionnaire. Inaddition, the physical activity level was assessed by theinternational physical activity questionnaire includingwork-related activity, housework activity, leisure,transport-related activity, exercise, sitting posture, andsleeping time. Details on the collection of blood samplesand measurement of anthropometrics indicators havebeen previously published [19]. The blood pressure (BP)of participants was categorized into Normal (systolic BP(SBP) < 120 mmHg and diastolic BP (DBP) < 80mmHg),Elevated (SBP ≥ 120 mmHg or DBP ≥ 80 mmHg), andHypertension (SBP ≥ 140 mmHg or DBP ≥ 90mm) [20].Body mass index (BMI) was computed as weight dividedby the square of height. Alcohol users were defined asthose consuming alcohol at least once per month in thepast year [21]. Smokers were defined as those smoking
Fig. 1. Flowchart of participants through the study
Sun et al. BMC Public Health (2019) 19:1704 Page 2 of 13

at least one cigarette per day during the past month[22]. The workplace of miners was divided into groundand underground; ground workers engaged in coaltransportation, operation management, communication,power supply, and some office jobs. Undergroundworkers mainly engaged in machinery driving, reserves,and some auxiliary jobs.
Cardiovascular risk score levelsThe 10-year CVD risk scores include 10-year ICVD andASCVD risk scores, which are effective tools with goodperformance for 10-year CVD risk prediction among theChinese population [23]. Meanwhile, 10-year CVD riskscores were recommended for application in CVD screen-ing by the Chinese Guidelines for the Prevention ofCardiovascular Diseases [24, 25]. The 10-year CVD riskscores were calculated by the specific risk evaluationmodels, further converted into absolute risk (%), andgraded into risk levels according to the relevant guidelines.The 10-year ASCVD risk was defined as the probability ofdeveloping the first ASCVD event over a 10-year periodamong people free from ASCVD at the beginning [26].The 10-year ASCVD risk score was calculated by the sex-specific evaluation figure of ASCVD risk developed by theJoint Committee of Dyslipidemia Management [27]; therisk factors included in evaluation models were age, BP,total cholesterol (TC), low-density lipoprotein cholesterol,high-density lipoprotein cholesterol, current smoking sta-tus, and diabetes. In additions, four risk levels were deter-mined according to the guideline: Low risk (< 5%),Medium risk (5–9%), High risk (10–19%), and Extremelyhigh risk (≥20%) [27].The 10-year ICVD risk was defined as the probability of
developing the first ICVD event over a 10-year periodamong people free from ICVD at the beginning [24]. The10-year ICVD risk score was calculated using a sex-specific evaluation sheet published by the Chinese Societyof Cardiology of the Chinese Medical Association [24],and updated based on a previous study [28]; the risk fac-tors included in evaluation models were age, SBP, BMI,TC, current smoking status, and diabetes. Additionally,the following three risk levels were determined: Extremelylow risk (≤5%), Low risk (5–10%), and Medium-high risk(≥10%) [24].
Dietary assessmentDietary data were collected from the semi-quantitativeFFQ [19]. All of the risk factors and FFQ were collectedin the same year. To minimize participants’ recall bias asmuch as possible, this study made a commitment to pro-vide each participant with a health report to increasetheir motivation to answer accurately, and provided uni-form metrics of food consumption and different portionsof foods for reference by participants at the survey site.
Food items consumed frequently in the population werecategorized into 20 categories including rice, wheatflour, cereal, tubers(e.g. white potatoes), fried dough,pork, red meat, poultry, viscera, fish and shrimp, dairyproducts, beans and bean products, egg and egg dishes,vegetables, pickled vegetables, salted and preserved vege-tables, vermicelli, pastry, fruits, and nuts [19]. Partici-pants were asked to recall the portion size, frequency,and cycle of 20 food categories for the past year. Thetraditional Chinese unit Liang was used to measure theportion size, participants were helped to estimate sizesaccurately, and finally converted to grams (e.g. 1 Liang =50 g). Information on the cycle of consumption for eachfood category was collected by using five categories(never, daily, weekly, monthly, and yearly). Finally, themean intake in grams/day of each food category wasassessed based on portion size, frequency, and cycle.
Dietary pattern identificationDietary patterns were derived by an exploratory approachof factor analysis combined with cluster analysis, a methodthat has been widely used in the construction of dietarypatterns [29, 30]. Factor analysis identified food groupsthat were frequently consumed together. Four factorswere retained in ground and underground workers, bycombining with the Akaike information criterion value,Schwarz Bayesian criterion value (which produces fewerfactors with less significance) [31], scree test, and eigen-values. Foods with factor loading ≥0.2 were retained aftervarimax rotation, while foods with factor loading ≥0.35were considered highly important to each factor [32].Participants were assigned a factor score computed for de-tecting the actual underlying and unobservable factor [33];meanwhile, the factor scores were used in the cluster ana-lysis after being standardized.The number and cluster seeds of clusters were deter-
mined through hierarchical cluster analysis, and the finalclusters (patterns) were identified by K-means clusteranalysis. All participants were assigned to one of theclusters (patterns), and the descriptive names wereassigned for each pattern according to the cluster meansof factors scores that contributed relatively highly [34].
Statistical analysesThis study stratified the participants based on theworkplace and identified the dietary patterns, separ-ately. Descriptive statistics were used to examine theassociation of each risk score level with demographicand lifestyle variables.The dietary patterns of workers in the two workplaces
were generated by factor analysis combined with clusteranalysis. Each participant received a factor score by fac-tor analysis implemented in SAS PROC FACTOR, andthe factor scores were standardized prior to the cluster
Sun et al. BMC Public Health (2019) 19:1704 Page 3 of 13
analysis. Hierarchical cluster analysis was conducted toidentify the most appropriate number and the clusterseeds for the subsequent K-means cluster analysis.Thereafter, the construction of final dietary patternsusing K-means cluster analysis performed by SAS PROCFASTCLUS [34].Logistic regression was used to assess the associ-
ation between dietary patterns and the 10-year CVDrisk score levels. The 10-year CVD risk score levelwas the dependent variable, the dietary patterns werethe independent variables, and dummy variables werecalculated in the regression models. We fitted threemodels by adjusting for potential confounding effects.Model 1 included the dietary pattern. In model 2, be-sides the primary variable of interest, we further ad-justed for gender and drinking status (No/Yes). Inmodel 3, we further adjusted for education level(Bachelor degree or above, Junior college and seniorhigh school, Junior high school or below), monthlyincome (≤4000, 4000–6000, 6000–8000, ≥8000), mari-tal status (married, others), physical activity level (In-active, Minimally Active, Health-enhancing physicalactivity), and family history (No/Yes). Among thethree models, we did not adjust for age, smoking sta-tus, and blood pressure, because these covariates wereincluded in the outcome measure.We conducted sensitivity analysis to observe the im-
pact of missing data of dietary intake on dietary pat-terns, imputed the missing data of dietary intake inthe imputed dataset, the maximum-likelihood esti-mates via EM algorithm were computed for the miss-ing data [35], performed by SAS PROC MI. Insensitivity analysis, we rebuilt dietary patterns in thesame way, and examined the stability of dietary pat-terns. All statistical analyses were performed usingSAS 9.4 (SAS Institute, Inc.) and p values < 0.05 wereconsidered statistically significant.
ResultsCharacteristics of the sampleThe main analyses set was based on 2632 participantsaged 35–65 with no CVD events. The descriptive statis-tics of the demographic factors and their associationwith the 10-year CVD risk score levels are shown inTable 1. For 10-year ASCVD risk score level, one partici-pant aged 65 was excluded because the 10-year ASCVDrisk evaluation model was developed for adults aged 35–64. The remaining participants were classified into fourlevels: Low risk (N = 1753, 66.6%), Medium risk (N =551, 20.9%), High risk (N = 259, 9.8%), and Extremelyhigh risk (N = 68, 2.6%). For 10-year ICVD risk scorelevel, participants were classified into three levels: Ex-tremely low risk (N = 2222, 84.4%), Low risk (N = 326,12.4%), and Medium-high risk (N = 84, 3.2%).
Dietary patternsThe factor loadings derived from factor analysis are pre-sented in Table 2. Among the ground workers, four factorswere derived, explaining 36% of the total variance in con-sumption of the foods. The first factor included red meat,poultry, viscera, fish and shrimp, pork, fried dough, andpastry. The second factor included tubers, wheat flour,beans and bean products, vegetables, pastry, vermicelli,cereal, and eggs and egg dishes. The third factor includedfried dough, salted and preserved vegetables, pickled vege-tables, and vermicelli. The fourth factor included fish andshrimp, beans and bean products, vegetables, fruits, dairyproducts, nuts, rice, cereal, and eggs and egg dishes.Participants were given a factor score after factor ana-
lysis, and assigned to each of the patterns after the clusteranalysis. The final dietary patterns were identified by K-means cluster analysis, and are presented in Table 3. Eachpattern was labeled according to the cluster means of fac-tor scores, which were relatively high; the high mean fac-tor scores of each pattern are underlined in Table 3.Among the ground workers, the first pattern with a highmean factor score was on the fourth factor, characterizedby high intakes of fruits, dairy products, nuts, rice, cereal,eggs and egg dishes, and called ‘Healthy’. A pattern with ahigh mean factor score on the third factor, characterizedby high intake of salted and preserved vegetables, pickledvegetables, and vermicelli was called ‘High-salt’. The othercluster patterns, respectively, were named ‘High-fat andsalt’ and ‘Refined grains’ in the same way.Among the underground workers, four factors were de-
rived, explaining 34% of the total variance in the consump-tion of the foods (Table 2). Dietary pattern included fourpatterns, namely ‘Healthy’, ‘High-salt’, ‘High-fat’ and ‘North-ern’ patterns (Table 3). Compared to the ‘Healthy’ pattern,the ‘High-salt’ pattern had a high score on the fourth factorand primarily consisted of salted and preserved vegetablesand pickled vegetables. The other patterns, were named‘High-fat’ and ‘Northern’ in the same way.In both ground and underground workers, dietary pat-
terns included four sets of patterns. In the following regres-sion analysis, the dietary patterns were the independentvariables and the dummy variables were calculated. Com-pared to the other patterns, the ‘Healthy’ pattern primarilyconsisted of healthier foods, and served as the referencegroup for exploring the association of three other subopti-mal patterns with 10-year CVD risk score levels.
Dietary patterns and distributions of samplecharacteristicsParticipants with a ‘High-salt’ pattern were the majorgroup and constituted 31.9% of the ground workers(Additional file 1: Table S1). Meanwhile, the local specialsuboptimal pattern was characterized by the ‘High-salt’-pattern, which was also identified in the underground
Sun et al. BMC Public Health (2019) 19:1704 Page 4 of 13

Table
1Thede
scrip
tivestatisticsof
demog
raph
icfactorsandtheirassociationwith
10-yearCVD
riskscorelevelsa
Dem
ograph
icFactors
10-yearICVD
riskscorelevelN
(%)
χ2P
10-yearASC
VDriskscorelevelN
(%)
χ2P
Extrem
elylow
risk
N=2222(84.4)
Low
risk
N=326(12.4)
Med
ium-highrisk
N=84(3.2)
Low
risk
N=1753(66.6)
Med
ium
risk
N=551(20.9)
Highrisk
N=259(9.8)
Extrem
elyhigh
risk
N=68(2.6)
Age
387.1
<.0001
573.9
<.0001
35–44
1125(50.6)
23(7.1)
6(7.1)
989(56.4)
125(22.7)
31(11.9)
9(13.1)
45–54
934(42.0)
196(60.1)
46(54.8)
717(40.9)
261(47.4)
160(61.8)
38(55.9)
≥55
163(7.4)
107(32.8)
32(38.1)
47(2.7)
165(29.9)
68(26.3)
21(30.9)
Gen
der
49.4
<.0001
133.2
<.0001
male
1853(83.4)
312(95.7)
84(100)
1401(79.9)
521(94.6)
258(99.6)
68(100.0)
female
369(16.6)
14(4.3)
352(20.1)
30(5.4)
1(0.4)
0(0.0)
Maritalstatus
2.3
0.31
6.9
0.07
married
2168(97.6)
322(98.8)
83(98.8)
1705(97.3)
545(98.9)
254(98.1)
68(100.0)
othe
rs54(2.4)
4(1.2)
1(1.2)
48(2.7)
6(1.1)
5(1.9)
0(0.0)
Educationallevel
40.5
<.0001
36.9
<.0001
Bachelor
degree
orabove
194(8.7)
8(2.5)
3(3.6)
160(9.1)
34(6.2)
8(3.1)
3(4.4)
Junior
college
andsenior
high
scho
ol1310(58.9)
174(53.4)
37(44.1)
1041(59.4)
309(56.1)
143(55.2)
28(41.2)
Junior
high
scho
olor
below
718(32.3)
144(44.2)
44(52.4)
552(31.5)
208(37.8)
108(41.7)
37(54.4)
Mon
thlyincome(RMB)
13.1
0.0416
19.4
0.0220
≤4000
561(25.3)
104(31.9)
25(29.8)
442(25.2)
150(27.2)
80(30.9)
17(25.0)
4000–6000
959(43.2)
147(45.1)
37(44.1)
754(43.0)
234(42.5)
129(49.8)
26(38.2)
6000–8000
509(22.9)
54(16.6)
17(20.2)
409(23.3)
119(21.6)
35(13.5)
17(25.0)
≥8000
193(8.7)
21(6.4)
5(5.9)
148(8.4)
48(8.7)
15(5.8)
8(11.8)
Smoke
94.0
<.0001
113.0
<.0001
No
1027(46.2)
68(20.9)
16(19.1)
856(48.8)
182(33.0)
69(26.6)
4(5.9)
yes
1195(53.8)
258(79.1)
68(80.9)
897(51.2)
369(66.9)
190(73.4)
64(94.1)
Drin
k46.4
<.0001
67.9
<.0001
No
1346(60.6)
152(46.6)
27(32.1)
1105(63.0)
284(51.5)
113(43.6)
22(32.4)
Yes
876(39.4)
174(53.4)
57(67.9)
648(36.9)
267(48.5)
146(56.4)
46(67.7)
BMI(kg/m2)
87.2
<.0001
61.1
<.0001
≤23
688(30.9)
49(15.0)
12(14.3)
565(32.2)
122(22.1)
45(17.4)
17(25)
23–27.5
1111(50.0)
158(48.5)
37(44.1)
865(49.3)
277(50.3)
136(52.5)
27(39.7)
>27.5
423(19.0)
119(36.5)
35(41.7)
323(18.4)
152(27.6)
78(30.1)
24(35.3)
BP553.3
<.0001
1321.8
<.0001
Normal
715(32.2)
0(0.0)
0(0.0)
658(37.5)
55(9.9)
1(0.4)
0(0.0)
Sun et al. BMC Public Health (2019) 19:1704 Page 5 of 13

Table
1Thede
scrip
tivestatisticsof
demog
raph
icfactorsandtheirassociationwith
10-yearCVD
riskscorelevelsa(Con
tinued)
Dem
ograph
icFactors
10-yearICVD
riskscorelevelN
(%)
χ2P
10-yearASC
VDriskscorelevelN
(%)
χ2P
Extrem
elylow
risk
N=2222(84.4)
Low
risk
N=326(12.4)
Med
ium-highrisk
N=84(3.2)
Low
risk
N=1753(66.6)
Med
ium
risk
N=551(20.9)
Highrisk
N=259(9.8)
Extrem
elyhigh
risk
N=68(2.6)
Elevated
964(43.4)
73(22.4)
0(0.0)
906(51.7)
131(23.8)
0(0.0)
0(0.0)
Hypertension
543(24.4)
253(77.6)
84(100.0)
189(10.8)
365(66.2)
258(99.6)
68(100.0)
Workplace
1.9
0.17
4.4
0.22
Groun
d1024(46.1)
161(49.4)
43(51.2)
803(45.8)
278(50.5)
117(45.2)
29(42.7)
Und
ergrou
nd1198(53.9)
165(50.6)
41(48.8)
950(54.2)
273(49.6)
142(54.8)
39(57.4)
Physicalactivity
level
7.4
0.12
9.1
0.16
Inactive
36(1.6)
12(3.7)
2(2.4)
26(1.5)
14(2.5)
8(3.1)
2(2.9)
Minim
allyActive
672(30.2)
100(30.7)
22(26.2)
520(29.7)
169(30.7)
88(33.9)
16(23.5)
Health
-enh
ancing
physicalactivity
1514(68.1)
214(65.6)
60(71.4)
1207(68.9)
368(66.8)
163(62.9)
50(73.)
Family
history
4.3
0.12
3.2
0.37
No
1312(59.1)
183(56.1)
41(48.8)
1031(58.8)
324(58.8)
147(56.8)
33(48.5)
Yes
910(40.9)
143(43.9)
43(51.2)
722(41.2)
227(41.2)
112(43.2)
35(51.5)
aCV
Dcardiovascular
diseases,A
SCVD
athe
rosclerosiscardiovascular
diseases,ICV
Dischem
iccardiovascular
disease
Sun et al. BMC Public Health (2019) 19:1704 Page 6 of 13

workers. In addition, participants with a ‘High-fat’ pat-tern were the major group, and constituted 31.1% of theunderground workers (Additional file 1: Table S1).
Dietary patterns and 10-year CVD risk score levelsFor all logistic regression analyses, the ‘Healthy’ patternswere served as the reference group both in ground andunderground workers. After adjusting for all covariates,among the ground workers, the ‘High-salt’ pattern (OR:1.50; 95% CI: 1.02–2.21) and ‘Refined grains’ pattern(OR: 1.92; 95% CI: 1.26–2.93) were significantly associ-ated with higher 10-year ASCVD risk score levels afteradjusting for all covariates. Among the undergroundworkers, the ‘High-salt’ pattern was significantly associ-ated with higher 10-year ASCVD risk score levels (OR:1.65; 95% CI: 1.16–2.36) (Table 4), and the associationwas still statistically significant in sensitivity analyses(Additional file 1: Table S2).
Table 3 Cluster means of factor scores according to clusters forminersa
Dietary pattern Factors
Factor1 Factor2 Factor3 Factor4
Ground worker
Healthy −0.13 − 0.49 −1.11 0.61
High-fat and salt 0.97 −0.06 0.54 0.16
High-salt −0.82 0.17 0.64 0.14
Refined grains 0.03 0.43 −0.68 −1.36
Underground worker
Healthy −0.13 0.01 0.43 −1.27
Northern −0.79 0.45 0.04 0.58
High-fat 0.96 0.27 −0.02 0.29
High-salt −0.19 −1.48 −0.72 0.22aThe high mean factor scores of each pattern are underlined
Table 2 Factors and factor loadings derived from FFQ among minersa
Foods Ground worker Underground worker
Factor 1:Meat, Friedfood
Factor 2:Refined grain,Tubers
Factor3:salt,processedvegetables
Factor 4:Cereal,Fruits
Factor1: Redmeat, Viscera
Factor2: Beans,Vegetables,Tubers
Factor3: Cereal,Fruits, Dairyproducts
Factor4: salt,processedvegetables
Red meat 0.71 0.69
Poultry 0.64 0.56
Viscera 0.59 0.59 0.25
Fish and shrimp 0.58 0.31 0.58 0.26
Pork 0.46 0.45
Fried dough 0.36 0.34 0.32 0.35
Tubers 0.59 0.43 0.26
Wheat Flour 0.57 0.35
Beans and beanproducts
0.56 0.20 0.59
Vegetables 0.55 0.20 0.57
Pastry 0.24 0.42 0.45
Salted andpreservedvegetables
0.81 0.83
Pickledvegetables
0.78 0.82
Vermicelli 0.29 0.35 0.47
Fruits 0.68 0.50
Dairy products 0.52 0.50
Nuts 0.45 0.22 0.34
Rice 0.37 0.53
Cereal 0.29 0.35 0.57
Eggs and eggdishes
0.27 0.32 0.23 0.24 0.26
Eigen value 2.65 1.80 1.50 1.25 2.52 1.67 1.39 1.29aOnly factor loadings ≥0.2 are presented. The factor loadings ≥0.35 are underlined
Sun et al. BMC Public Health (2019) 19:1704 Page 7 of 13

Table
4Associatio
nsbe
tweendietarypatterns
and10-yearASC
VDriskscorelevelfor
minersa
ICVD
risk
score
level
Groun
dworkers
N=1227
P value
Und
ergrou
ndworkers
N=1404
P value
Health
ypattern
High-fatandsaltpattern
High-saltpattern
Refined
grains
pattern
Health
ypattern
Northern
Pattern
High-fatpattern
High-saltpattern
N(%)
273(22.2)
359(29.2)
392(31.9)
203(16.5)
333(23.7)
421(29.9)
437(31.1)
213(15.2)
Mod
el1
1.00
2.52
(1.76–3.59)
P<.0001
1.76
(1.23–2.52)
P=0.0020
3.69
(2.49–5.47)
P<.0001
<.0001
1.00
1.15
(0.85–1.57)
P=0.359
1.03
(0.76–1.39)
P=0.865
1.74
(1.23–2.48)
P=0.0019
0.0050
Mod
el2
1.00
1.48
(1.01–2.16)
P=0.0448
1.64
(1.12–2.40)
P=0.0113
2.17
(1.44–3.28)
P=0.0002
0.0016
1.00
1.17
(0.86–1.59)
P=0.315
0.98
(0.72–1.33)
P=0.888
1.68
(1.18–2.38)
P=0.0040
0.0066
Mod
el3
1.00
1.29
(0.88–1.91)
P=0.188
1.50
(1.02–2.21)
P=0.0399
1.92
(1.26–2.93)
P=0.0023
0.0168
1.00
1.05
(0.77–1.44)
P=0.762
0.98
(0.72–1.34)
P=0.896
1.65
(1.16–2.36)
P=0.0057
0.0086
a ASC
VDathe
rosclerosiscardiovascular
diseases.;Mod
el1includ
edthedietarypa
ttern.
Mod
el2ad
justed
forge
nder
anddrinking
status.M
odel
3ad
dsed
ucationlevel,mon
thly
income,
BMI,marita
lstatus,ph
ysical
activ
itylevela
ndfamily
historyto
theab
ove
Sun et al. BMC Public Health (2019) 19:1704 Page 8 of 13

Among the ground workers, compared with the‘Healthy’ pattern, the ‘High-fat and salt’ pattern (OR:1.97; 95% CI: 1.13–3.42), ‘High-salt’ pattern (OR: 2.18;95% CI: 1.25–3.80), and ‘Refined grains’ pattern (OR:2.64; 95% CI: 1.48–4.72) were significantly associatedwith higher 10-year ICVD risk score levels. Among theunderground workers, the ‘High-salt’ pattern was signifi-cantly associated with higher 10-year ICVD risk scorelevels (OR: 1.76; 95% CI: 1.09–2.84), whereas neither the‘Northern’ (OR: 1.21; 95% CI: 0.78–1.85) and ‘High-fat’patterns (OR: 1.11; 95% CI: 0.72–1.73) showed a signifi-cant association with 10-year ICVD risk score levels inthe adjusted analysis (Table 5). In sensitivity analysis,nearly all dietary patterns were still significantly associ-ated with higher 10-year ICVD risk score levels, exceptfor the ‘High-fat and salt’ pattern (Additional file 1:Table S3).
DiscussionIn previous studies, more attention was paid to coalminers’ occupational injuries and other poor health sta-tus [36, 37], but little evidence concerning coal miners’CVDs has been reported. Previous research showed thatcoal mining areas are associated with poorer health sta-tus and higher incidence of CVD [38, 39], so primaryprevention for coal miners should be taken seriously.Dietary habits are recognized as a key modifiable factorin CVD prevention [40]. Given the complexity of diet,there may be stronger effects on health of overall dietthan any single component [40]. Therefore, research fo-cused on single foods or nutrients related to coal miners’health is not enough [41, 42], and it is important tostudy not only individual foods or nutrients, but also theeffects of the entire diet [14].This study focused on the whole dietary pattern associ-
ated with 10-year CVD risk score levels and presented dif-ferent dietary patterns in ground and undergroundworkers, the dietary differences may due to social net-works or work pressure [43]. The majority of coal minersin this study had extremely low and low cardiovascularrisk score levels, but low risk does not mean no risk. Toprevent CVD risk from developing from low to high, moreattention should be given to CVD prevention.Three suboptimal diets associated with higher 10-year
CVD risk score levels were identified in this study. Thelocal special suboptimal pattern was ‘High-salt’ charac-terized by salted and preserved vegetables and pickledvegetables. A positive association was found between the‘High-salt’ pattern and 10-year ASCVD risk score levelsboth in ground and underground workers, and the oddsratios were 1.50 (95% CI: 1.02–2.21) and 1.65 (95% CI:1.16–2.36), respectively. The ‘High-salt’ pattern was alsoassociated with higher 10-year ICVD risk score levels.This finding is consistent with evidence that a salt-rich
diet is related to cardiovascular events in non-coal min-ing areas [44, 45]. However, there are differences in thefood combinations of diets in different populations.Compared with salt-rich diets in Western countries, the‘High-salt’ pattern identified in this study was mainlycharacterized by salted and preserved vegetables andpickled vegetables, not manufactured foods [46]. A highsalt intake is not conducive to blood pressure control,and is positively related to CVD [44], which is consistentwith our finding. Because of the sociocultural factors, a‘High-salt’ pattern remains pervasive in Chinese diets,and was also identified in the Henan Rural Cohort Studyof China [47]. Although dietary salt intake has shown adownward trend in recent years, it is still more thantwice the recommended amount (China: < 6 g/day,WHO: < 5 g/day) [3]. Given Chinese taste preferences,specific strategies should be designed to improve theirdietary structure to prevent CVD, alternative techniquesof food cooking should be advanced instead of pickling,and it is essential to find alternatives to replace salt incooking, reduce dietary salt intake, and retain the nutri-ents in foods [3, 48].Chinese traditional diets used to be dominated by
coarse food grains (e.g. maize, sorghum, etc.), and noware loaded highly with refined grains (e.g. white rice,wheat flour, etc.) [12]. The shift in dietary pattern isclearly detrimental to CVD prevention. Poor-quality car-bohydrates are associated with CVD risk [10]. As the re-sults showed, the ‘refined grains’ pattern, characterizedby wheat flour, pastry, and other starch-rich foods, waspositively associated with 10-year ASCVD (OR: 1.92,95% CI: 1.26–2.93) and 10-year ICVD risk score level(OR: 2.64, 95% CI: 1.48–4.72). Refined food diets havealso been identified in northern of China [49], and evenin other Asian countries, refined food diets related toCVD risk have also been reported [50]. Currently, re-fined foods account for a large portion of global dietarypatterns. In the United States, nearly three in fourAmericans consume too many refined foods, such aswhite bread and corn flakes instead of white rice andpastry [14, 51]. Refined foods have similar metaboliccharacteristics as high-starch vegetables (e.g. white pota-toes), and can be digested rapidly without a fiber-richstructure [14]. Whether it is white bread in Western di-ets or pastry in Chinese diets, all of these will producebrisk rises in blood glucose and induce multiple adversemanifestations associated with cardiovascular events[52–54]. Consequently, reducing refined grain consump-tion in the diet for cardiovascular health are major diet-ary priorities, based on their adverse effects andprevalence in modern diets [14].The association between a high-fat diet characterized
by high intake of meats and CVD risk is complicated, asthe category and ingredients of the meats have effects on
Sun et al. BMC Public Health (2019) 19:1704 Page 9 of 13
Table
5Associatio
nsbe
tweenpatterns
and10-yearICVD
riskscorelevelfor
minersa
ICVD
risk
score
level
Groun
dworkers
N=1228
Pvalue
Und
ergrou
ndworkers
N=1404
Pvalue
Health
ypattern
High-fatand
saltpattern
High-salt
pattern
Refined
grains
pattern
Health
ypattern
Northern
Pattern
High-fat
pattern
High-salt
pattern
N(%)
273(22.2)
359(29.2)
392(31.9)
204(16.6)
333(23.7)
421(29.9)
437(31.1)
213(15.2)
Mod
el1
1.00
3.24
(1.91–5.53)
P<.0001
2.44
(1.42–4.18)
P=0.0012
4.72
(2.69–8.25)
P<.0001
<.0001
1.00
1.34
(0.88–2.05)
P=0.173
1.13
(0.74–1.74)
P=0.572
1.89
(1.18–3.02)
P=0.0079
0.0356
Mod
el2
1.00
2.06
(1.19–3.56)
P=0.0097
2.33
(1.34–4.05)
P=0.0027
2.97
(1.68–5.28)
P=0.0002
0.0013
1.00
1.37
(0.89–2.09)
P=0.147
1.06
(0.69–1.64)
P=0.781
1.79
(1.12–2.87)
P=0.0155
0.0426
Mod
el3
1.00
1.97
(1.13–3.42)
P=0.0162
2.18
(1.25–3.80)
P=0.0062
2.64
(1.48–4.72)
P=0.0010
0.0113
1.00
1.21
(0.78–1.85)
P=0.394
1.11
(0.72–1.73)
P=0.637
1.76
(1.09–2.84)
P=0.0202
0.0881
a ICV
D,ische
miccardiovascular
disease.;M
odel
1includ
edthedietarypa
ttern.
Mod
el2ad
justed
forge
nder
anddrinking
status.M
odel
3ad
dsed
ucationlevel,mon
thlyincome,
marita
lstatus,ph
ysical
activ
itylevela
ndfamily
historyto
theab
ove
Sun et al. BMC Public Health (2019) 19:1704 Page 10 of 13

CVD risk, such as sodium and heme iron [14]. Fanelliet al. found that ‘Western’ diets along with meats andsandwiches, in African-Americans were associated withhigher 10-year ASCVD risk [26]. Among the under-ground workers, like the ‘Northern’ pattern, the ‘High-fat’ pattern had high factor loadings, not only on meats,but also on vegetables and beans. That may explain whythere was no significant association between these dietsand 10-year CVD risk score levels. Although there aremany controversies, it has been established that certainfoods, including processed meats and fried products, arepositively associated with CVD risk [55, 56]. Intake offish and nuts is inversely related to CVD risk [57–59].Thus, it would be prudent to choose consume more fishand nuts, and avoid fried foods.Participants in study all had the same demographic
characteristics and would be likely to have shared similargenetic characteristics. Suboptimal diets that are posi-tively associated with CVD have diverse characteristicsin different occupations and regions [14], so it is import-ant to examine dietary patterns in different populationswith various sociocultural backgrounds. This study hadtwo strengths. First, this study focused on CVD preven-tion, and identified the potentially high-risk group bycalculating 10-year CVD risk score, which combinedsome major adverse cardiovascular events that will occurmore frequently than single cardiovascular events [60].Second, considering the complexity of diet, this study fo-cused on dietary patterns instead of single foods or nu-trients, providing evidence that suboptimal dietarypatterns are associated with higher CVD risk scorelevels, conforming to current research trends in publichealth.This study has certain limitations. A major limitation
of its cross-section design is that causal inferences can-not be made. Thus, the long-term impact of dietary pat-terns on CVD need to be further confirmed [33]. Inaddition, over/underestimation due to recall bias mayhave been possible in this study, as the collection of dataregarding food intake was dependent on the participants’memories and motivation. Finally, there is the inherentsubjectivity of both factor and cluster analysis derivedpatterns in the study.
ConclusionsIn conclusion, this study showed that dietary patternswere associated with 10-year CVD risk score levels,which is consistent with previous studies conductedoutside of China. Diet is a major modifiable factor inCVD prevention. This study provides evidence tofood-based dietary guidelines that can be used toameliorate people’s dietary habits. However, furtherstudy is also needed to confirm the long-term impactof these dietary patterns.
Supplementary informationSupplementary information accompanies this paper at https://doi.org/10.1186/s12889-019-8070-9.
Additional file 1 : Table S1 Demographic characteristics describedbased on four patterns. Table S2: Associations between patterns and 10-year ASCVD risk score level for miners in imputed dataset. Table S3:Associations between patterns and 10-year ICVD risk score level forminers in imputed dataset.
AbbreviationsASCVD: atherosclerosis cardiovascular disease; BMI: body mass index;BP: blood pressure; CVD: cardiovascular disease; DBP: diastolic bloodpressure; FFQ: food frequency questionnaire; ICVD: ischemic cardiovasculardisease; KMO: Kaiser-Meyer-Olkin; SBP: systolic blood pressure; TC: totalcholesterol
AcknowledgementsAuthors gratefully acknowledge the coalmine workers in our study for theirtime and participation. Authors would also like to acknowledge allinterviewers for survey data collection work.
Authors’ contributionsTW and J-JH were responsible for the study concept and design. S-HX, J-SM,QS, HW cleared the data. HW, QG managed the data. QS, S-HX, J-KZ, HW per-formed statistical analysis. QS wrote the manuscript. TW reviewed and editedthe manuscript. All authors read and approved the final manuscript.
FundingThis research was funded from the National Natural Science Foundation ofChina (item number: 81872715). The funding body played no role in thedesign of the study and collection, analysis, and interpretation of data and inwriting the manuscript.
Availability of data and materialsThe data that support the findings of this study are available from thecorresponding author upon reasonable request.
Ethics approval and consent to participateThe study was approved by Shanxi Medical University Ethics Committee andobtained written consent from each individual.
Consent for publicationNo applicable.
Competing interestsThe authors declare that they have no competing interests.
Author details1Department of Health Statistics, School of Public Health, Shanxi MedicalUniversity, 56 Xinjiannanlu Street, Taiyuan 030001, China. 2Shaoxing Centerfor Diseases Prevention and Control, Shaoxing City 312000, ZhejiangProvince, China. 3Department of Neurosurgery, General Hospital of DatongCoal Mining Group, Datong 037000, China.
Received: 15 August 2019 Accepted: 11 December 2019
References1. Joseph P, Leong D, McKee M, Anand SS, Schwalm JD, Teo K, et al. Reducing
the global burden of cardiovascular disease, part 1: the epidemiology andrisk factors. Circ Res. 2017;121:677–94. https://doi.org/10.1161/circresaha.117.308903.
2. Zhou M, Wang H, Zhu J, Chen W, Wang L, Liu S, et al. Cause-specificmortality for 240 causes in China during 1990-2013: a systematicsubnational analysis for the global burden of disease study 2013. Lancet.2016;387:251–72. https://doi.org/10.1016/s0140-6736(15)00551-6.
3. National Center for Cardiovascular Diseases. Report on cardiovasculardiseases in China (2017). 2017. http://www.nccd.org.cn/News/Columns/Index/1089. Access Aug 13, 2018.
Sun et al. BMC Public Health (2019) 19:1704 Page 11 of 13

4. He J, Gu D, Wu X, Reynolds K, Duan X, Yao C, et al. Major causes of deathamong men and women in China. N Engl J Med. 2005;353:1124–34. https://doi.org/10.1056/NEJMsa050467.
5. Wang W, Jiang B, Sun H, Ru X, Sun D, Wang L, et al. Prevalence, incidence,and mortality of stroke in China: results from a nationwide population-based survey of 480 687 adults. Circulation. 2017;135:759–71. https://doi.org/10.1161/CIRCULATIONAHA.116.025250.
6. Hendryx M, Zullig KJ. Higher coronary heart disease and heart attackmorbidity in Appalachian coal mining regions. Prev Med. 2009;49:355–9.https://doi.org/10.1016/j.ypmed.2009.09.011.
7. Hendryx M. Mortality from heart, respiratory, and kidney disease in coalmining areas of Appalachia. Int Arch Occup Environ Health. 2009;82:243–9.https://doi.org/10.1007/s00420-008-0328-y.
8. Esch L, Hendryx M. Chronic cardiovascular disease mortality in mountaintopmining areas of central Appalachian states. J Rural Health. 2011;27:350–7.https://doi.org/10.1111/j.1748-0361.2011.00361.x.
9. Imamura F, Micha R, Khatibzadeh S, Fahimi S, Shi P, Powles J, et al. Dietaryquality among men and women in 187 countries in 1990 and 2010: asystematic assessment. Lancet Glob Health. 2015;3:e132–42. https://doi.org/10.1016/s2214-109x(14)70381-x.
10. Rebello SA, Koh H, Chen C, Naidoo N, Odegaard AO, Koh WP, et al. Amount,type, and sources of carbohydrates in relation to ischemic heart diseasemortality in a Chinese population: a prospective cohort study. Am J ClinNutr. 2014;100:53–64. https://doi.org/10.3945/ajcn.113.076273.
11. Anand SS, Hawkes C, de Souza RJ, Mente A, Dehghan M, Nugent R, et al.Food consumption and its impact on cardiovascular disease: importance ofsolutions focused on the globalized food system: a report from theworkshop convened by the world heart federation. J Am Coll Cardiol. 2015;66:1590–614. https://doi.org/10.1016/j.jacc.2015.07.050.
12. Li LM, Rao KQ, Kong LZ, Yao CH, Xiang HD, Zhai FY, et al. A description onthe Chinese national nutrition and health survey in 2002. Zhonghua LiuXing Bing Xue Za Zhi. 2005;26:478–84.
13. Hong KN, Fuster V, Rosenson RS, Rosendorff C, Bhatt DL. How low togo with glucose, cholesterol, and blood pressure in primary preventionof CVD. J Am Coll Cardiol. 2017;70:2171–85. https://doi.org/10.1016/j.jacc.2017.09.001.
14. Mozaffarian D. Dietary and policy priorities for cardiovascular disease,diabetes, and obesity: a comprehensive review. Circulation. 2016;133:187–225. https://doi.org/10.1161/CIRCULATIONAHA.115.018585.
15. Dos Santos M, Penteado JO, Soares MCF, Muccillo-Baisch AL, Da Silva-JúniorFMR. Association between DNA damage, dietary patterns, nutritional status,and non-communicable diseases in coal miners. Environ Sci Pollut Res Int.2019;26:15600–7. https://doi.org/10.1007/s11356-019-04922-8.
16. Schulte PA, Wagner GR, Ostry A, Blanciforti LA, Cutlip RG, Krajnak KM, et al.Work, obesity, and occupational safety and health. Am J Public Health. 2007;97:428–36. https://doi.org/10.2105/ajph.2006.086900.
17. Yuichi Yamada MI. Ikiko Tsuritani. Prevention of weight gain and obesity inoccupational populations: a new target of health promotion services atworksites. J Occup Health. 2002;44:373–84. https://doi.org/10.1539/joh.44.373.
18. Fan M, Lyu J, He P. Chinese guidelines for data processing and analysisconcerning the International Physical Activity Questionnaire. Zhonghua LiuXing Bing Xue Za Zhi. 2014;35:961–4.
19. Xu SH, Qiao N, Huang JJ, Sun CM, Cui Y, Tian SS, et al. Gender differences indietary patterns and their association with the prevalence of metabolicsyndrome among Chinese: a cross-Sectional Study. Nutrients. 2016;8:180.https://doi.org/10.3390/nu8040180.
20. Writing Group of 2018 Chinese Guidelines for the Management ofHypertension CHL, Chinese Society of Cardiology, Chinese MedicalDoctor Association Hypertension Committee, Hypertension Branch ofChina International Exchange and Promotive Association for Medicaland Health Care, Hypertension Branch of Chinese Geriatric MedicalAssociation. 2018 Chinese guidelines for the management ofhypertension. Chin J Cardiovasc Med. 2019;24:24–56. https://doi.org/10.3969/j.issn.1007-5410.2019.01.002.
21. Xiang YT, Ma X, Lu JY, Cai ZJ, Li SR, Xiang YQ, et al. Alcohol-relateddisorders in Beijing, China: prevalence, socio-demographic correlates, andunmet need for treatment. Alcohol Clin Exp Res. 2009;33:1111–8. https://doi.org/10.1111/j.1530-0277.2009.00933.x.
22. Lasser K, Boyd JW, Woolhandler S, Himmelstein DU, McCormick D, Bor DH.Smoking and mental illness: a population-based prevalence study. JAMA.2000;284:2606–10. https://doi.org/10.1001/jama.284.20.2606.
23. Chinese College of Cardiovascular Physician, Editorial Board of ChineseJournal of Internal Medicine. Chinese expert consensus on primaryprevention of cardiovascular disease. Zhonghua Nei Ke Za Zhi. 2010;49:174–85. https://doi.org/10.3760/cma.j.issn.0578-1426.2010.02.031.
24. Chinese Society of Cardiology of Chinese Medical Association, Editorial Boardof Chinese Journal of Cardiology. Chinese guidelines for prevention ofcardiovascular diseases. Zhonghua Xin Xue Guan Bing Za Zhi. 2011;39:3–22.
25. Task Force on Chinese Guidelines for the Prevention of CardiovascularDiseases(2017), Editorial Board of Chinese Journal of Cardiology. Chineseguidelines for the prevention of cardiovascular diseases(2017). ZhonghuaXin Xue Guan Bing Za Zhi. 2018;46:10–25. https://doi.org/10.3760/cma.j.issn.0253-3758.2018.01.004.
26. Fanelli KM, Bodt BA, Stave SE, Zonderman AB, Evans MK. Dietary patternsassociated with lower 10-year atherosclerotic cardiovascular disease riskamong urban African-American and white adults consuming western diets.Nutrients. 2018;10:158. https://doi.org/10.3390/nu10020158.
27. Joint Committee Issued Chinese Guideline for the Management ofDyslipidemia in Adults. 2016 Chinese guideline for the management ofdyslipidemia in adults. Zhonghua Xin Xue Guan Bing Za Zhi. 2016;44:833–53. https://doi.org/10.3760/cma.j.issn.0253-3758.2016.10.005.
28. Wu Y, Liu X, Li X, Li Y, Zhao L, Chen Z, et al. Estimation of 10-year risk offatal and nonfatal ischemic cardiovascular diseases in Chinese adults.Circulation. 2006;114:2217–25. https://doi.org/10.1161/circulationaha.105.607499.
29. He Y, Li Y, Lai J, Wang D, Zhang J, Fu P, et al. Dietary patterns as comparedwith physical activity in relation to metabolic syndrome among Chineseadults. Nutr Metab Cardiovasc Dis. 2013;23:920–8. https://doi.org/10.1016/j.numecd.2012.09.001.
30. He Y, Ma G, Zhai F, Li Y, Hu Y, Feskens EJ, et al. Dietary patterns and glucosetolerance abnormalities in Chinese adults. Diabetes Care. 2009;32:1972–6.https://doi.org/10.2337/dc09-0714.
31. Hu L. SAS statistical analysis tutorial. Beijing: Publishing House of ElectronicsIndustry; 2010. p. 468–77.
32. Stricker MD, Onland-Moret NC, Boer JM, van der Schouw YT, VerschurenWM, May AM, et al. Dietary patterns derived from principal component- andk-means cluster analysis: long-term association with coronary heart diseaseand stroke. Nutr Metab Cardiovasc Dis. 2013;23:250–6. https://doi.org/10.1016/j.numecd.2012.02.006.
33. Schulze MB, Hoffmann K. Methodological approaches to study dietarypatterns in relation to risk of coronary heart disease and stroke. Br J Nutr.2006;95:860–9. https://doi.org/10.1079/bjn20061731.
34. Newby PK, Tucker KL. Empirically derived eating patterns using factor orcluster analysis: a review. Nutr Rev. 2004;62:177–203.
35. Dempster AP, Laird NM, Rubin DB. Maximum likelihood from incompletedata via the EM algorithm. J R Stat Soc Ser B Stat Methodol. 1977;39:1–38.
36. Bhattacherjee A, Kunar BM, Baumann M, Chau N. The role of occupationalactivities and work environment in occupational injury and interplay ofpersonal factors in various age groups among Indian and Frenchcoalminers. Int J Occup Med Environ Health. 2013;26:910–29. https://doi.org/10.2478/s13382-013-0165-4.
37. Deng M, Wu F, Wang J, Sun L. Musculoskeletal disorders, personality traits,psychological distress, and accident proneness of Chinese coal miners.Work. 2017;57:441–9. https://doi.org/10.3233/wor-172569.
38. Hendryx M, Ahern MM. Relations between health indicators and residentialproximity to coal mining in West Virginia. Am J Public Health. 2008;98:669–71. https://doi.org/10.2105/ajph.2007.113472.
39. Alexander HM, Balding DJ, Dobson AJ, Gibberd RW, Lloyd DM, Leeder SR.Risk factors and heart disease mortality. A regional perspective. Med J Aust.1986;144:20–2. https://doi.org/10.5694/j.1326-5377.1986.tb113625.x.
40. Schulze MB, Martinez-Gonzalez MA, Fung TT, Lichtenstein AH, Forouhi NG.Food based dietary patterns and chronic disease prevention. BMJ. 2018;361:k2396. https://doi.org/10.1136/bmj.k2396.
41. Bilici S, Saglam F, Beyhan Y, Barut-Uyar B, Dikmen D, Goktas Z, et al. Energyexpenditure and nutritional status of coal miners: a cross-sectional study.Arch Environ Occup Health. 2016;71:293–9. https://doi.org/10.1080/19338244.2015.1095152.
42. Swartz S, Konishi F, Sanjabi P. Dietary assessment of coal miners in southernIllinois. Am J Clin Nutr. 1978;31:1465–8. https://doi.org/10.1093/ajcn/31.8.1465.
43. Brug J, Kremers SP, Lenthe F, Ball K, Crawford D. Environmentaldeterminants of healthy eating: in need of theory and evidence. Proc NutrSoc. 2008;67:307–16. https://doi.org/10.1017/S0029665108008616.
Sun et al. BMC Public Health (2019) 19:1704 Page 12 of 13

44. Strazzullo P, D'Elia L, Kandala NB, Cappuccio FP. Salt intake, stroke, andcardiovascular disease: meta-analysis of prospective studies. BMJ. 2009;339:b4567. https://doi.org/10.1136/bmj.b4567.
45. Li XY, Cai XL, Bian PD, Hu LR. High salt intake and stroke: meta-analysis ofthe epidemiologic evidence. CNS Neurosci Ther. 2012;18:691–701. https://doi.org/10.1111/j.1755-5949.2012.00355.x.
46. Brown IJ, Tzoulaki I, Candeias V, Elliott P. Salt intakes around the world:implications for public health. Int J Epidemiol. 2009;38:791–813. https://doi.org/10.1093/ije/dyp139.
47. Abdulai T, Li Y, Zhang H, Tu R, Liu X, Zhang L, et al. Prevalence of impairedfasting glucose, type 2 diabetes and associated risk factors in undiagnosedChinese rural population: the Henan rural cohort study. BMJ Open. 2019;9:e029628. https://doi.org/10.1136/bmjopen-2019-029628.
48. D'Elia L, Barba G, Cappuccio FP, Strazzullo P. Potassium intake, stroke, andcardiovascular disease a meta-analysis of prospective studies. J Am CollCardiol. 2011;57:1210–9. https://doi.org/10.1016/j.jacc.2010.09.070.
49. Huang L, Shang L, Yang W, Li D, Qi C, Xin J, et al. High starchy food intake mayincrease the risk of adverse pregnancy outcomes: a nested case-control studyin the Shaanxi province of northwestern China. BMC Pregnancy Childbirth.2019;19:362. https://doi.org/10.1186/s12884-019-2524-z.
50. Mohan V, Radhika G, Vijayalakshmi P, Sudha V. Can the diabetes/cardiovascular disease epidemic in India be explained, at least in part, byexcess refined grain (rice) intake? Indian J Med Res. 2010;131:369–72.https://doi.org/10.3109/13814780903580307.
51. Dietary Guidelines Advisory Committee. Scientific report of the 2015 dietaryguidelines advisory committee. 2015. http://www.health.gov/dietaryguidelines/2015-scientific-report/. Accessed Mar 25 2015.
52. Mirrahimi A, de Souza RJ, Chiavaroli L, Sievenpiper JL, Beyene J, Hanley AJ,et al. Associations of glycemic index and load with coronary heart diseaseevents: a systematic review and meta-analysis of prospective cohorts. J AmHeart Assoc. 2012;1:e000752. https://doi.org/10.1161/jaha.112.000752.
53. Atkinson FS, Foster-Powell K, Brand-Miller JC. International tables ofglycemic index and glycemic load values: 2008. Diabetes Care. 2008;31:2281–3. https://doi.org/10.2337/dc08-1239.
54. Bhupathiraju SN, Tobias DK, Malik VS, Pan A, Hruby A, Manson JE, et al.Glycemic index, glycemic load, and risk of type 2 diabetes: results from 3large US cohorts and an updated meta-analysis. Am J Clin Nutr. 2014;100:218–32. https://doi.org/10.3945/ajcn.113.079533.
55. Micha R, Wallace SK, Mozaffarian D. Red and processed meat consumptionand risk of incident coronary heart disease, stroke, and diabetes mellitus: asystematic review and meta-analysis. Circulation. 2010;121:2271–83. https://doi.org/10.1161/CIRCULATIONAHA.109.924977.
56. Micha R, Michas G, Lajous M, Mozaffarian D. Processing of meats andcardiovascular risk: time to focus on preservatives. BMC Med. 2013;11:136.https://doi.org/10.1186/1741-7015-11-136.
57. Aune D, Keum N, Giovannucci E, Fadnes LT, Boffetta P, Greenwood DC,et al. Nut consumption and risk of cardiovascular disease, total cancer, all-cause and cause-specific mortality: a systematic review and dose-responsemeta-analysis of prospective studies. BMC Med. 2016;14:207. https://doi.org/10.1186/s12916-016-0730-3.
58. Eneroth H, Wallin S, Leander K, Nilsson Sommar J, Akesson A. Risks andbenefits of increased nut consumption: cardiovascular health benefitsoutweigh the burden of carcinogenic effects attributed to aflatoxin b(1)exposure. Nutrients. 2017;9:E1355. https://doi.org/10.3390/nu9121355.
59. He K, Song Y, Daviglus ML, Liu K, Van Horn L, Dyer AR, et al. Fish consumptionand incidence of stroke: a meta-analysis of cohort studies. Stroke. 2004;35:1538–42. https://doi.org/10.1161/01.STR.0000130856.31468.47.
60. Irony TZ. The “utility” in composite outcome measures: measuring what isimportant to patients. JAMA. 2017;318:1820–1. https://doi.org/10.1001/jama.2017.14001.
Publisher’s NoteSpringer Nature remains neutral with regard to jurisdictional claims inpublished maps and institutional affiliations.
Sun et al. BMC Public Health (2019) 19:1704 Page 13 of 13


![Mining Frequent patterns, Associations & Correlations [Part-2]Mining Frequent patterns, Associations & Correlations [Part-2] Shubham kumar Dept. of CS&IT MGCU Bihar •](https://img.pdfslide.net/doc/110x75/61393ad1a4cdb41a985b9189/mining-frequent-patterns-associations-correlations-part-2-mining-frequent.jpg)