Embed Size (px)
Citation preview

RESEARCH ARTICLE Open Access
Associations of discretionary screen timewith mortality, cardiovascular disease andcancer are attenuated by strength, fitnessand physical activity: findings from the UKBiobank studyCarlos A. Celis-Morales1, Donald M. Lyall2, Lewis Steell1, Stuart R. Gray1, Stamatina Iliodromiti1, Jana Anderson2,Daniel F. Mackay2, Paul Welsh1, Thomas Yates3,4, Jill P. Pell2†, Naveed Sattar1† and Jason M. R. Gill1*†
Abstract
Background: Discretionary screen time (time spent viewing a television or computer screen during leisure time) isan important contributor to total sedentary behaviour, which is associated with increased risk of mortality andcardiovascular disease (CVD). The aim of this study was to determine whether the associations of screen timewith cardiovascular disease and all-cause mortality were modified by levels of cardiorespiratory fitness, grip strength orphysical activity.
Methods: In total, 390,089 participants (54% women) from the UK Biobank were included in this study. All-causemortality, CVD and cancer incidence and mortality were the main outcomes. Discretionary television (TV) viewing, personalcomputer (PC) screen time and overall screen time (TV + PC time) were the exposure variables. Grip strength, fitness andphysical activity were treated as potential effect modifiers.
Results: Altogether, 7420 participants died, and there were 22,210 CVD events, over a median of 5.0 years follow-up(interquartile range 4.3 to 5.7; after exclusion of the first 2 years from baseline in the landmark analysis). All discretionaryscreen-time exposures were significantly associated with all health outcomes. The associations of overall discretionaryscreen time with all-cause mortality and incidence of CVD and cancer were strongest amongst participants in the lowesttertile for grip strength (all-cause mortality hazard ratio per 2-h increase in screen time (1.31 [95% confidence interval: 1.22–1.43], p < 0.0001; CVD 1.21 [1.13–1.30], p = 0.0001; cancer incidence 1.14 [1.10–1.19], p < 0.0001) and weakestamongst those in the highest grip-strength tertile (all-cause mortality 1.04 [0.95–1.14], p = 0.198; CVD 1.05 [0.99–1.11],p = 0.070; cancer 0.98 [0.93–1.05], p = 0.771). Similar trends were found for fitness (lowest fitness tertile: all-causemortality 1.23 [1.13–1.34], p = 0.002 and CVD 1.10 [1.02–1.22], p = 0.010; highest fitness tertile: all-cause mortality 1.12 [0.96–1.28], p = 0.848 and CVD 1.01 [0.96–1.07], p = 0.570). Similar findings were found for physical activity for all-causemortality and cancer incidence.(Continued on next page)
* Correspondence: [email protected]†Equal contributors1BHF Glasgow Cardiovascular Research Centre, Institute of Cardiovascular andMedical Sciences, College of Medical, Veterinary and Life Sciences, Universityof Glasgow, Glasgow G12 8TA, UKFull list of author information is available at the end of the article
© The Author(s). 2018 Open Access This article is distributed under the terms of the Creative Commons Attribution 4.0International License (http://creativecommons.org/licenses/by/4.0/), which permits unrestricted use, distribution, andreproduction in any medium, provided you give appropriate credit to the original author(s) and the source, provide a link tothe Creative Commons license, and indicate if changes were made. The Creative Commons Public Domain Dedication waiver(http://creativecommons.org/publicdomain/zero/1.0/) applies to the data made available in this article, unless otherwise stated.
Celis-Morales et al. BMC Medicine (2018) 16:77 https://doi.org/10.1186/s12916-018-1063-1

(Continued from previous page)
Conclusions: The associations between discretionary screen time and adverse health outcomes were strongest inthose with low grip strength, fitness and physical activity and markedly attenuated in those with the highest levels ofgrip strength, fitness and physical activity. Thus, if these associations are causal, the greatest benefits from healthpromotion interventions to reduce discretionary screen time may be seen in those with low levels of strength, fitnessand physical activity.
Keywords: Mortality, Cardiovascular, Screen time, Screen-time, Physical activity, Fitness, Strength
BackgroundLow levels of physical activity [1] and high levels of seden-tary behaviour (overall sitting and discretionary televisionviewing and computer use) [2–4] both have strong associa-tions with a number of adverse health outcomes, includingmortality and cardiovascular disease (CVD). There is alsostrong evidence that low levels of cardiorespiratory fitness[5] and muscular strength [6–9] are associated with similaradverse health outcomes. It has been suggested that the as-sociations of physical activity and sedentary behaviour withhealth outcomes are largely independent [1, 2, 10]. How-ever, a recent meta-analysis indicated that the adverse ef-fects of sitting time and television (TV) viewing onmortality were not observed in individuals with high levelsof physical activity [10]. This observation indicates that therisks associated with sedentary behaviour are not ubiqui-tous, since individuals with low physical activity experiencethe greatest adverse effects. Using data from UK Biobank,which includes almost 500,000 participants with data ongrip strength and over 60,000 participants with data on car-diorespiratory fitness, we recently reported that the adverseassociation of low levels of physical activity with mortalityand CVD events are substantially stronger in individualswith low levels of grip strength and/or cardiorespiratory fit-ness. This impies that the benefits of physical activity maybe greatest amongst individuals with lower levels of func-tional capacity, but relatively modest in those with alreadyhigh levels of functional capacity, who were at low risk irre-spective of physical activity levels [9]. This has implicationsfor public health guidance, as it suggests that specificallytargeting those with low fitness and strength to increasetheir physical activity levels may be an effective approach toreduce population risk [9]. We hypothesised that a similarpattern would be evident for discretionary screen-time be-haviours such as TV viewing and personal computer (PC)screen time, with the adverse effects of high levels of screentime being greatest in those with low levels of strength, fit-ness and physical activity [10].The aim of this study was, therefore, to determine
whether the associations of screen time (TV viewing plusPC screen time) with mortality and CVD and cancer inci-dence was moderated by grip strength, cardiorespiratoryfitness and physical activity using data from UK Bio-bank—a large prospective population-based study. Screen
time (i.e. time spent viewing a TV or PC screen duringleisure time), which represents a substantial proportion oftotal sedentary behaviour during leisure time [11, 12], wasused as a measure of screen-time-related behaviours.
MethodsStudy designBetween April 2007 and December 2010, UK Biobankrecruited 502,655 participants (5.5% response rate), aged40–69 years, from the general population [13]. Partici-pants attended one of 22 assessment centres acrossEngland, Wales and Scotland [14, 15], where they com-pleted a touch-screen questionnaire, had physical mea-surements taken and provided biological samples, asdescribed in detail elsewhere [14, 15]. In this prospectivepopulation-based study, all-cause mortality, CVD inci-dence and mortality, and cancer incidence and mortalitywere the main outcomes. The duration of overall discre-tionary screen time (TV viewing plus leisure PC screentime), and TV viewing and leisure PC screen time separ-ately were the exposures of interest. Socio-demographicfactors (age, sex, ethnicity, Townsend deprivation index,professional qualifications, income and employment),smoking status, body mass index (BMI) categories, phys-ical activity, grip strength, sleep duration and dietary in-take were treated as potential confounders, as weresystolic blood pressure, medication history for glucose,cholesterol and blood pressure as well as prevalent dia-betes and hypertension at baseline. Grip strength, car-diorespiratory fitness and physical activity were treatedas potential effect modifiers. To minimise potential re-verse causality, all analyses were conducted using a land-mark analysis excluding events occurring in the first2 years of follow-up. Moreover, participants with base-line medical diagnoses of depression, chronic obstructivepulmonary disease (COPD), chronic asthma, chronicliver diseases, alcohol problems, substance abuse, eatingdisorders, schizophrenia, cognitive impartment, Parkin-son’s disease, dementia, chronic pain syndrome, heartdiseases or cancer were excluded (n = 103,755).
ProceduresDate of death was obtained from death certificates held bythe National Health Service (NHS) Information Centre
Celis-Morales et al. BMC Medicine (2018) 16:77 Page 2 of 14
(England and Wales) and the NHS Central RegisterScotland (Scotland). Date and cause of hospital admis-sions were identified via record linkage to Health EpisodeStatistics (England and Wales) and to the Scottish Mor-bidity Records (Scotland). Detailed information regardingthe linkage procedure can be found at http://biobank.ct-su.ox.ac.uk/crystal/label.cgi?id=2000. At the time of ana-lysis, mortality data were available up to 31 January 2016.The mortality analysis was, therefore, censored at this dateor date of death if this occurred earlier. Hospital admis-sion data were available until 31 March 2015, resulting indisease-specific analyses being censored at this date, orthe date of hospital admission or death if these occurredearlier. Follow-up information on cancer was obtained vialinkage to three routine administrative databases, death cer-tificates, hospital admissions and cancer registrations, withcomplete follow-up available until 31 March 2015. CVDwas defined as a hospital admission or death with ICD-10code I05-I89.9. All-cause cancer was defined as an ICD-10code of C0.0-C9.9, D3.7-9 or D4.0-8.At baseline assessment, screen time and physical activ-
ity were recorded among participants recruited fromAugust 2009 using a touch-screen, self-completed ques-tionnaire. Participants were asked: ‘In a typical day, howmany hours do you spend watching TV?’ They were alsoasked about time spent using a computer: ‘In a typicalday, how many hours do you spend using the computer?(Do not include using a computer at work)'. For thisstudy, we derived a discretionary screen-time variablethat combined TV viewing and leisure PC screen time inhours per day.Physical activity was based on the International Phys-
ical Activity Questionnaire (IPAQ) short form [16], withparticipants reporting the frequency and duration ofwalking and moderate and vigorous activity undertakenin a typical week [16]. Data were analysed in accordancewith the IPAQ scoring protocol [17] and total physicalactivity was computed as the sum of walking and moder-ate and vigorous activity, measured as metabolic equiva-lent (MET, hours/week). Participants were excludedfrom the analyses if they recorded implausible values,that is, if the sum of their total physical activity, sleepingtime and total screen time exceeded 24 h (n = 705 partic-ipants were excluded) [9].Grip strength was assessed using a Jamar J00105 hy-
draulic hand dynamometer and the mean of three mea-surements for each hand were used. Grip strength wasmeasured in kilograms. Fitness test data were introducedinto UK Biobank from August 2009, so these data areavailable only in a subgroup of 74,836 participants. Inthese individuals, cardiorespiratory fitness was assessedusing a sub-maximal 6-min incremental ramp cycle erg-ometer test with workload calculated according to age,height, weight, resting heart rate and sex, and heart rate
monitored via a four-lead electrocardiogram, as previ-ously reported, with the aim of achieving a final workrate of 50% of predicted maximal power [9]. Tests wereterminated if heart rate exceeded 75% of theage-predicted maximum. In individuals with systolicblood pressure between 160 and 179 mmHg or diastolicblood pressure between 95 and 109 mmHg or who an-swered ‘yes’ or ‘unsure’ to the question ‘Has a doctorever said that you have a heart condition and shouldonly do physical activity recommended by a doctor’, thetest protocol was modified to achieve a final work rateof 35% of predicted maximal power (n = 8932). Fitnesswas not measured in individuals who were not able towalk or cycle unaided for 10 min, were pregnant or hadhigh blood pressure (systolic blood pressure ≥180 mmHgor diastolic blood pressure ≥110 mmHg) (n = 358) or ifthe equipment failed (n = 643). The work rate at max-imal heart rate was estimated by extrapolating thepre-exercise heart rate (i.e. at work rate zero watts) andthe heart rate and work rate at the end of the test to theage-predicted maximal heart rate (208 – 0.7 × age) [18]assuming a linear relationship [19]. The linear nature ofthe work rate vs heart rate relationship means that theestimated maximal work rate for an individual should beindependent of the work rate achieved during the exer-cise test. Maximal oxygen uptake (i.e. at maximal heartrate) was estimated from the regression equation for therelationship between work rate and oxygen uptake (oxy-gen uptake (in ml.kg− 1.min− 1) = 7 + (10.8 × work rate (inwatts))/body mass (in kilograms)) [20] and thenexpressed in terms of maximal MET (where 1 MET ≡3.5 ml.kg− 1.min− 1).Dietary information was collected via a self-reported
dietary questionnaire (Oxford WebQ) [21, 22]. Partici-pants were asked how many portions of specified foodsthey generally ate. Subjective sleep duration was obtainedby asking: ‘About how many hours sleep do you get inevery 24 hours?’ Based on the answer, we derived a cat-egorical sleep duration variable (short sleeper <7 h.day− 1,normal sleeper 7–9 h.day− 1 or long sleeper >9 h.day− 1).Area-based socioeconomic status was derived from post-code of residence using the Townsend score, which is de-rived from census data on housing, employment, socialclass and car availability [23]. Other socio-demographicinformation such as employment (paid employment, re-tired, unable to work, unemployed, student and other),professional qualifications (college or university, A or Olevels, GCSE, CSEs or equivalent levels) and income(<£18,000, £18,000–29,999, £30,000–51,999, £52,000–100,000 and >£100,000) were self-reported at baseline.Age was calculated from dates of birth and baseline as-sessment. Ethnicity was self-reported and smoking statuswas categorised into never, former and current smoking.Medical history (physician diagnosis of long-standing
Celis-Morales et al. BMC Medicine (2018) 16:77 Page 3 of 14

illness, depression, stroke, angina, myocardial infarction,hypertension, cancer and diabetes) and medication history(for diabetes, cholesterol and hypertension) were collectedfrom the self-completed baseline assessment question-naire. Height, body weight and waist circumference weremeasured by trained nurses during the baseline assess-ment. Body composition (percentage body fat) was mea-sured using standardised bio-impedance protocols. BMIwas calculated as (weight/height2) and the World HealthOrganization criteria [24] were used to classify BMI intounderweight <18.5, normal weight 18.5–24.9, overweight25.0–29.9 and obese ≥30.0 kg.m− 2. Central obesity wasdefined as waist circumference >88 cm for womenand >102 cm for men. Further details of thesemeasurements can be found in the UK Biobank onlineprotocol (http://www.ukbiobank.ac.uk/resources/) and oursupplementary material. The numbers of participantswith missing data for covariates are described inAdditional file 1: Table S1.
Statistical analysesThe associations between hours of overall discretionaryscreen time, TV viewing and PC screen time per day andhealth outcomes were explored using Cox-proportionalhazard models with years of follow-up as the time scale.Analyses were performed for the following outcomes:all-cause mortality and CVD and cancer incidence (fataland non-fatal combined) and mortality. All analyseswere performed as a landmark analysis with follow-upcommenced 2 years after recruitment and including par-ticipants who were event-free at this time. In addition,participants with comorbidities (depression, COPD,chronic asthma, chronic liver diseases, alcohol problems,substance abuse, eating disorders, schizophrenia, cogni-tive impartment, Parkinson, dementia, chronic pain syn-drome, heart diseases and cancer) at baseline wereexcluded from all analyses (n = 103,755).Firstly, the durations of discretionary screen time, TV
viewing and PC screen time in hours per day weretreated as continuous variables and hazard ratios (HR)were calculated per 1-h increment. Linearity was ex-plored with fractional polynomial models for each ex-posure, with no evidence for deviation from linearity.Each exposure was rounded to the nearest hour. Multi-plicative interactions between the screen-time exposuresand sex were investigated by fitting the relevant parame-ters into the model. For these analyses, we ran fourincremental models that included an increasing numberof covariates. Model 0 included age, sex, ethnicity,deprivation index, professional qualifications, incomeand employment as covariates. Model 1 was adjusted forlifestyle factors including smoking, physical activity, gripstrength, categories of sleep duration, dietary intake (al-cohol, fruit and vegetables, red meat, processed meat
and oily fish intake). Model 2 was adjusted for model 1plus BMI categories. Model 3 was adjusted for model 2plus systolic blood pressure, prevalent diabetes, hyper-tension and medication for diabetes, hypertension, andcholesterol. Finally, model 4 was equivalent to model 3but participants who reported to be ex-smokers (n =173,104) or current smokers (n = 52,990) were excludedfrom the analysis.To investigate whether grip strength, cardiorespiratory
fitness or physical activity moderated the associationsbetween screen-time exposures and health outcomes,participants were stratified into age- and sex-specific ter-tiles for grip strength, cardiorespiratory fitness and phys-ical activity (Additional file 1: Tables S2–S4), and allscreen-time exposures were classified into the followingcategories: <2 h, 2–3 h, 4–5 h and >5 h. Significant in-teractions of physical activity, fitness and strength withscreen-time exposures on health outcomes were testedby fitting an interaction term between the exposure ofinterest and the modifier factors coded as ordinal vari-ables (i.e. TV viewing category × physical activity ter-tiles). To illustrate the interaction effect, we used ordinalcoding with the referent group being the lowest categoryfor the duration of screen time (<2 h.day− 1) and thehighest tertile for grip strength, fitness or physicalactivity. These interaction analyses were adjusted formodel 3 mentioned above, but physical activity and gripstrength were removed as covariates and used asinteraction factors.The proportional hazard assumption was checked by
tests based on Schoenfeld residuals. All analyses were per-formed using statistical software STATA 14 (StataCorp LP).
ResultsOf the 502,655 participants recruited since August 2009,after excluding participants in a landmark analysis withfollow-up commencing 2 years after recruitment and par-ticipants who self-reported comorbidities at baseline, weincluded 391,089 participants with available data for dis-cretionary screen time, grip strength and physical activity(Additional file 1: Table S1). Valid cardiorespiratory fitnessand screen-time data were available for a subset of 59,068participants [9]. The median follow-up period was5.0 years (interquartile range 4.3 to 5.7), commencing 2years after baseline, for mortality outcomes and 4.2 yearsfor CVD and cancer incidence (interquartile range 3.5 to4.7). Over the follow-up period, 7420 participants diedand there were 22,210 CVD and 23,464 cancer events, ofwhich 2198 and 4606 were fatal, respectively.The main characteristics of the participants by categories
of screen time are summarised in Table 1. In summary, in-dividuals in the highest group for overall screen time(>5 h.day− 1) were more likely to be from the most deprivedtertile (with lower income, lower professional qualifications
Celis-Morales et al. BMC Medicine (2018) 16:77 Page 4 of 14

Table 1 Cohort characteristics by overall discretionary screen-time categories
Screen-time categories (h.day− 1)
<2 2–3 4–5 >5
Socio-demographics
Total n 65,374 204,470 95,877 25,368
Women, n (%) 38,977 (59.6) 110,399 (54.0) 51,460 (53.7) 12,519 (49.4)
Age (years), mean (SD) 54.0 (8.0) 55.5 (8.1) 57.8 (7.8) 56.8 (8.2)
Deprivation index quintiles, n (%)
Lower 22,447 (34.3) 74,332 (36.4) 31,308 (32.7) 6643 (26.2)
Middle 21,683 (33.2) 70,242 (34.4) 32,612 (34.0) 7515 (29.6)
Higher 21,244 (32.5) 59,896 (29.3) 31,957 (33.3) 11,210 (44.2)
Professional qualifications, n (%)
College or university degree 33,304 (55.8) 72,395 (40.7) 20,217 (28.2) 5872 (33.2)
A levels/AS levels or equivalent 7943 (13.3) 25,182 (14.2) 9120 (12.7) 2136 (12.1)
O levels/GCSEs or equivalent 10,408 (17.4) 45,118 (25.4) 23,125 (32.3) 5115 (28.9)
CSEs or equivalent 2230 (3.7) 11,517 (6.5) 6666 (9.3) 1641 (9.3)
NVQ or HND or HNC or equivalent 2840 (4.8) 13,182 (7.4) 7388 (10.3) 1881 (10.6)
Other professional qualifications 2984 (5.0) 10,603 (6.0) 5178 (7.2) 1042 (5.9)
Income categories, n (%)
Less than £18,000 7366 (12.8) 28,761 (16.1) 22,871 (28.5) 7808 (36.8)
£18,000 to £29,999 11,344 (19.7) 44,273 (24.8) 23,569 (29.4) 5047 (23.8)
£30,000 to £51,999 15,613 (27.1) 52,221 (29.3) 19,823 (24.7) 4066 (19.2)
£52,000 to £100,000 16,782 (29.2) 42,731 (24.0) 11,718 (14.6) 3277 (15.4)
Greater than £100,000 6432 (11.2) 10,364 (5.8) 2180 (2.7) 1025 (4.8)
Employment status, n (%)
In paid employment or self-employed 48,674 (75.2) 134,628 (66.4) 46,746 (49.2) 11,612 (46.3)
Retired 11,970 (18.5) 56,500 (27.9) 40,443 (42.6) 9862 (39.3)
Looking after home and/or family 2194 (3.4) 5578 (2.8) 2701 (2.8) 681 (2.7)
Unable to work because of sickness or disability 722 (1.1) 2180 (1.1) 2310 (2.4) 1605 (6.4)
Unemployed 662 (1.0) 2435 (1.2) 2117 (2.2) 1089 (4.3)
Doing unpaid or voluntary work 344 (0.5) 907 (0.5) 378 (0.4) 117 (0.5)
Full-time or part-time student 203 (0.3) 522 (0.3) 256 (0.3) 112 (0.5)
Ethnicity, n (%)
White 60,997 (93.3) 193,700 (94.7) 90,686 (94.6) 23,229 (91.6)
South Asian 1806 (2.8) 4095 (2.0) 1580 (1.7) 622 (2.5)
Black 1072 (1.6) 2994 (1.5) 1935 (2.0) 854 (3.4)
Chinese 267 (0.4) 721 (0.4) 312 (0.3) 108 (0.4)
Mixed background / others 1232 (1.9) 2960 (1.5) 1364 (1.4) 555 (2.2)
Smoking status, n (%)
Never 41,168 (63.2) 118,540 (58.2) 50,242 (52.6) 12,551 (49.7)
Previous 18,901 (29.0) 67,082 (32.9) 34,420 (36.0) 8815 (34.9)
Current 5087 (7.8) 18,207 (8.9) 10,870 (11.4) 3889 (15.4)
Obesity-related markers
BMI, mean (SD) 25.7 (4.2) 27.1 (4.5) 28.2 (4.8) 28.89 (5.4)
BMI categories, n (%)
Underweight (< 18.5) 566 (0.9) 952 (0.5) 280 (0.3) 107 (0.4)
Celis-Morales et al. BMC Medicine (2018) 16:77 Page 5 of 14

and more likely to be retired, unemployed or unable towork because of disability or sickness) compared with thelowest group (<2 h.day− 1). Moreover, individuals in thishigher screen-time category had a higher prevalence ofcurrent smoking, obesity and comorbidities, including dia-betes and hypertension as well as higher prevalence of be-ing on medication for hypertension and higher cholesterol,compared with the lowest group (<2 h.day− 1). They had a
higher BMI, waist circumference and percentage body fat,had a higher intake of processed meat and lower intake offruit and vegetables, and had lower levels of physicalactivity, fitness and grip strength in comparison to those inthe lowest screen-time group (Table 1). Similar patternswere observed when participants were stratified byTV-viewing categories (Additional file 1: Table S5), but notfor PC screen-time categories (Additional file 1: Table S6).
Table 1 Cohort characteristics by overall discretionary screen-time categories (Continued)
Screen-time categories (h.day− 1)
<2 2–3 4–5 >5
Normal weight (18.5–24.9) 31,288 (48.1) 70,487 (34.6) 24,335 (25.5) 5781 (23.0)
Overweight (25.0 to 29.9) 24,428 (37.5) 88,950 (43.7) 42,855 (44.9) 10,374 (41.3)
Obese (≥30.0) 8788 (13.5) 43,274 (21.3) 27,941 (29.3) 8875 (35.3)
Waist circumference (cm), mean (SD) 85.3 (12.3) 89.2 (12.9) 92.2 (13.3) 94.38 (14.2)
Central Obesity, n (%) 13,362 (20.5) 60,575 (29.7) 37,674 (39.4) 11,327 (44.9)
% Body fat, mean (SD) 29.2 (8.3) 30.8 (8.4) 32.7 (8.4) 32.89 (8.9)
Fitness, Physical activity and Sleep, mean (SD)
Fitness (METs) 9.7 (3.5) 9.2 (3.4) 8.3 (3.3) 8.3 (3.5)
Grip strength (kg) 31.1 (10.7) 31.5 (11.0) 30.4 (11.2) 30.5 (11.3)
Total physical activity (MET.h.week−1) 6.6 (8.9) 6.7 (9.2) 6.3 (9.1) 5.0 (7.8)
TV viewing (h.day−1) 0.7 (0.4) 2.3 (0.7) 4.1 (0.9) 5.3 (2.4)
PC screen time (h.day−1) 0.8 (0.4) 1.0 (0.8) 1.3 (1.4) 3.0 (3.1)
Screen time (h.day− 1) 1.6 (0.6) 3.4 (0.9) 5.4 (1.2) 8.2 (2.0)
Sleep duration (h.day−1) 7.1 (0.9) 7.1 (1.0) 7.2 (1.1) 7.1 (1.2)
Dietary intake, mean (SD)
Total energy (kcal.day−1) 2124.2 (636.5) 2115.3 (634.9) 2111.3 (660.9) 2126.5 (736.9)
Protein intake (% of TE) 15.3 (3.4) 15.6 (3.6) 15.7 (3.8) 15.6 (4.0)
Carbohydrates intake (% of TE) 47.7 (8.1) 47.1 (8.1) 47.0 (8.2) 46.9 (8.6)
Total Fat intake (% of TE) 31.9 (6.6) 32.0 (6.7) 32.2 (6.8) 32.4 (7.1)
Saturated intake (% of TE) 12.2 (3.3) 12.3 (3.3) 12.4 (3.4) 12.5 (3.5)
Sugar intake (% of TE) 22.8 (6.9) 22.4 (6.9) 22.3 (7.1) 22.2 (7.5)
Alcohol intake (% of TE) 5.1 (6.2) 5.3 (6.4) 5.2 (6.7) 5.0 (7.0)
Red meat intake (portions.week−1) 1.8 (1.4) 1.9 (1.4) 2.0 (1.5) 2.1 (1.7)
Processed meat intake (portions.week−1) 1.7 (1.1) 1.9 (1.1) 2.0 (1.1) 2.0 (1.1)
Vegetable and Fruit intake (grams.day−1) 350.7 (196.9) 331.3 (189.1) 316.7 (192.7) 308.8 (213.5)
Oily fish (portions.week−1) 1.1 (1.1) 1.1 (1.0) 1.1 (1.0) 1.0 (1.1)
Health status
Diabetes history, n (%) 1784 (2.7) 7493 (3.7) 5411 (5.7) 2097 (8.3)
High blood pressure history, n (%) 11,565 (17.7) 47,541 (23.3) 28,760 (30.1) 8281 (32.8)
Systolic blood pressure (mmHg), mean (SD) 135.7 (19.4) 139.6 (19.5) 142.6 (19.5) 141.6 (19.8)
Diastolic blood pressure (mmHg), mean (SD) 80.6 (10.7) 82.4 (10.6) 83.5 (10.5) 83.6 (10.8)
Medication for cholesterol or blood pressure, n (%)
None of the above 60,310 (92.3) 184,387 (90.2) 82,102 (85.6) 21,719 (85.6)
Cholesterol-lowering medication 2259 (3.5) 9644 (4.7) 7267 (7.6) 2037 (8.0)
Blood pressure medication 2805 (4.3) 10,439 (5.1) 6508 (6.8) 1612 (6.4)
BMI body mass index, MET metabolic equivalent, SD standard deviation, TE total energy intake
Celis-Morales et al. BMC Medicine (2018) 16:77 Page 6 of 14

Compared to individuals in the lower PC screen-timecategory (<2 h.day− 1), those in the higher category(>5 h.day− 1) were more likely to have college oruniversity degrees, be in a higher income group and becurrently employed. They had higher fitness and gripstrength but lower physical activity levels and lowermedication use. No major differences were observedacross PC screen categories for dietary intake, adiposity,obesity and comorbidities (Additional file 1: Table S6).The characteristics of individuals by tertiles of physical
activity, cardiorespiratory fitness and grip strength arepresented in Additional file 1: Tables S7–S9. Correla-tions between TV viewing and PC screen time were low(r = − 0.072). Similarly, the correlation of screen-time ex-posures with grip strength, cardiorespiratory fitness andphysical activity were low (ranging from r = − 0.199 to0.115) (Additional file 1: Table S10).Overall, there were significant associations of overall dis-
cretionary screen time, TV viewing and PC screen timewith health outcomes (Fig. 1 and Additional file 1: FigureS1). No significant interactions were found between any ofthe screen-time exposures and sex for any of the outcomes(data not shown); therefore, analyses were not stratified bysex. Moreover, when BMI categories, diabetes and hyper-tension prevalence were removed as covariates from theanalysis due to their potential mediating role on the out-come, the interactions were not altered (data not shown).The associations of discretionary screen-time exposuresand all-cause mortality (HR: 1.06 [95% confidence intervalCI: 1.05; 1.07], p < 0.0001), incidence of CVD (HR: 1.05[95% CI: 1.04; 1.06], p < 0.0001) and cancer (HR: 1.04 [95%CI: 1.03; 1.04], p < 0.0001) were slightly attenuated, butremained associated, after adjustment for the potentialconfounding effects of socio-demographic characteristics,lifestyle factors (including smoking), physical activity, grip
strength and dietary variables and further adjustment formediators (BMI, diabetes, systolic blood pressure andhypertension prevalence as well as medication for hyper-tension and cholesterol) (Fig. 1 and Additional file 1: Fig-ure S2). The magnitude of the associations between TVviewing and all-cause mortality (HR: 1.09 [95% CI: 1.07;1.10], p < 0.0001) was slightly higher than those observedfor PC screen time (HR: 1.03 [95% CI: 1.01; 1.05], p =0.001); however, the associations between screen-time ex-posures were similar for CVD and cancer incidence andmortality (Fig. 1 and Additional file 1: Figure S1).No significant interactions were found between any of
the screen-time exposures and physical activity, fitness andgrip strength for any of the health outcomes, although therewas a tendency (p < 0.10) for interactions between overalldiscretionary screen time and fitness for all-cause mortalityand CVD incidence and between screen time and physicalactivity for all-cause mortality (Fig. 2 and Additional file 1:Figures S2–S4 and Tables S11–S13). Nevertheless, whenparticipants were stratified into tertiles for grip strength,physical activity and fitness, the magnitude of HRs for in-creased risk of adverse health outcomes (all-cause mortality,CVD and cancer incidence) with increasing duration ofoverall discretionary screen time were numerically highest,and statistically significant, in the subgroup of participantswith the lowest levels of grip strength, physical activity orfitness. In contrast, the association of higher screen timewith health outcomes in those participants who have higherlevels of physical activity, fitness or grip strength was nu-merically less strong and, with the exception of the associ-ation with all-cause mortality in those in the highesttertile of physical activity (HR 1.07 [1.03, 1.13], p = 0.045),not statistically significant. For example, considering theassociation of discretionary screen time with all-causemortality, the HR per increasing category of screen time
Fig. 1 Cox proportional hazard model of the association of 1-h increments in overall discretionary screen time, TV viewing and leisure PC screentime with all-cause mortality and incidence CVD and cancer. Data presented as adjusted hazard ratio (HR) (95% CI) per 1-h increments in discretionary screentime, TV viewing and PC screen time per day. CVD cardiovascular disease, CI confidence interval, HR hazard ratio, PC personal computer, TV television
Celis-Morales et al. BMC Medicine (2018) 16:77 Page 7 of 14

was 1.31 (1.22, 1.43) (p < 0.0001) for those in the lowesttertile for grip strength, but only 1.04 (0.95, 1.14) (p =0.198) for those in the highest grip strength tertile. Whenanalyses were replicated for TV viewing (Fig. 3 andAdditional file 1: Figure S3 and Table S12) andleisure-time PC use (Fig. 4 and Additional file 1: Figure S4and Table S13), similar trends were observed.
DiscussionThe main novel finding of this study is that the associa-tions between overall discretionary screen time—anindex of TV viewing and leisure PC screen time—withall-cause mortality and CVD and cancer incidence and
mortality were substantially attenuated by physical activ-ity, cardiorespiratory fitness and grip strength. Our re-sults revealed that, overall, higher levels of screen timewere associated with a higher hazard for all-cause mor-tality and CVD and cancer incidence and mortality, in-dependent of physical activity, grip strength, BMI andother major confounding factors. However, when the co-hort was stratified by grip strength, the HRs for mortal-ity, CVD and cancer associated with increasing screentime were almost twice as strong in those with low com-pared with high levels of grip strength. A similar patternwas observed for physical activity. For cardiorespiratoryfitness, the association of increasing screen time with
Fig. 2 Cox proportional hazard models of the association of overall discretionary screen time with all-cause mortality, and incidence of CVD andcancer by physical activity, fitness and handgrip strength strata. Data are presented as adjusted hazard ratio (HR) (95% CI). Reference category wasdefined as those participants with < 2 h.day− 1 of screen time and who were in the highest tertile for physical activity, fitness or grip strength.Within-tertile HR trends, with p values for these trends also shown for each physical activity, fitness and physical activity strata. P-interaction indicates thep value for the interaction between screen time and tertile of physical activity, fitness or strength. CVD cardiovascular disease, CI confidence interval, HRhazard ratio, PA physical activity
Celis-Morales et al. BMC Medicine (2018) 16:77 Page 8 of 14

increasing risk for mortality, CVD and cancer was aug-mented in the least fit population tertile. If these asso-ciations are causal, this suggests that the populationsubgroups with the lowest levels of strength, fitnessand physical activity could potentially obtain thegreatest benefit from interventions aimed at reducingsedentary behaviours. Conversely, in those with highstrength, fitness and physical activity, the adverse ef-fects of prolonged discretionary screen time wereattenuated.
Although this study used overall discretionary screentime as one of the exposures of interest, our study alsoconfirms the direction and magnitude of the associationof TV viewing and leisure PC screen time with healthoutcomes [3, 4].We have recently reported that the associations of
physical activity with mortality and CVD events aremoderated by both grip strength and cardiorespiratoryfitness. The risk associated with low physical activity issubstantially greater in those with low strength and
Fig. 3 Cox proportional hazard models of the association of TV viewing with all-cause mortality, and incidence of CVD and cancer by physicalactivity, fitness and handgrip strength strata. Data presented as adjusted hazard ratio (HR) (95%CI). Reference category was defined as thoseparticipants with < 2 h.day− 1 of TV viewing and who were in the highest tertile for physical activity, fitness or grip strength. Within-tertile HRtrends, with p values for these trends also shown for each physical activity, fitness and physical activity strata. Analyses were adjusted for age, sex,ethnicity, deprivation index, professional qualifications, income, employment, smoking status, sleep duration categories, dietary intake (alcohol, redmeat, processed meat, fruit and vegetable and oily fish intake), systolic blood pressure, prevalent diabetes, hypertension and medication for diabetes,hypertension, and cholesterol. Analyses were all performed as landmark analysis with follow-up commenced 2 years after recruitment and only includingparticipants who were event-free at this time. Participants with comorbidities at baseline were excluded from all-analysis (n = 103,755). P-interactionindicates the p value for the interaction between T-viewing and tertile of physical activity, fitness or strength
Celis-Morales et al. BMC Medicine (2018) 16:77 Page 9 of 14
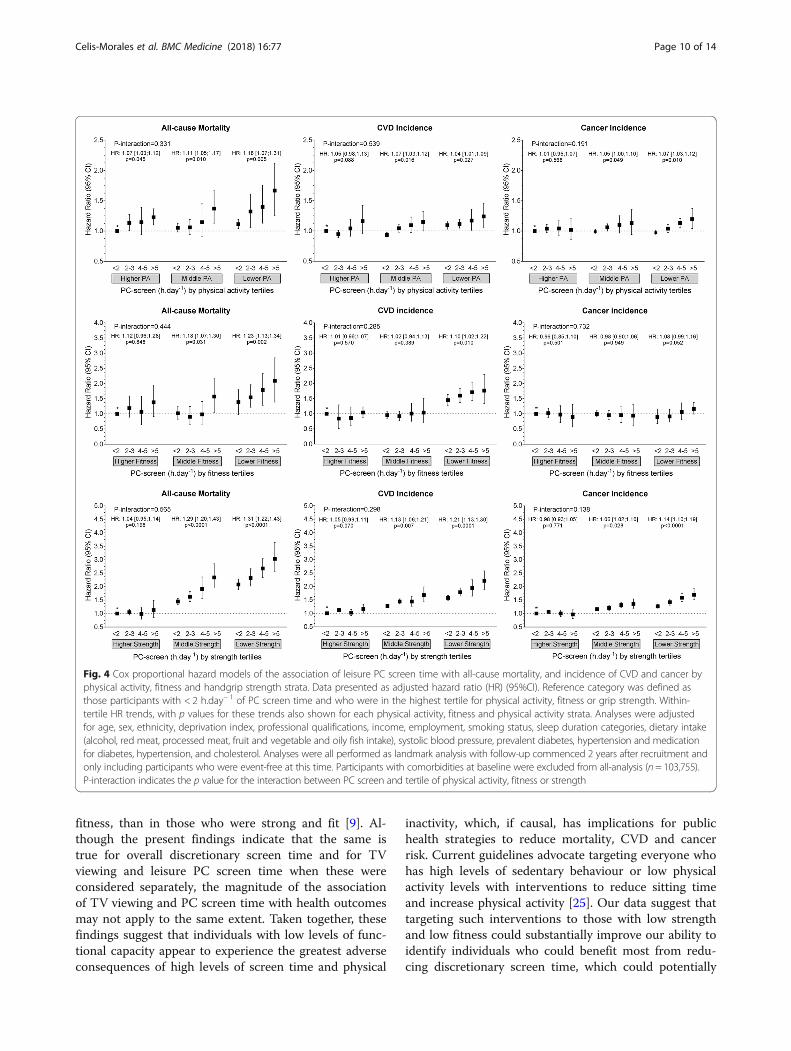
fitness, than in those who were strong and fit [9]. Al-though the present findings indicate that the same istrue for overall discretionary screen time and for TVviewing and leisure PC screen time when these wereconsidered separately, the magnitude of the associationof TV viewing and PC screen time with health outcomesmay not apply to the same extent. Taken together, thesefindings suggest that individuals with low levels of func-tional capacity appear to experience the greatest adverseconsequences of high levels of screen time and physical
inactivity, which, if causal, has implications for publichealth strategies to reduce mortality, CVD and cancerrisk. Current guidelines advocate targeting everyone whohas high levels of sedentary behaviour or low physicalactivity levels with interventions to reduce sitting timeand increase physical activity [25]. Our data suggest thattargeting such interventions to those with low strengthand low fitness could substantially improve our ability toidentify individuals who could benefit most from redu-cing discretionary screen time, which could potentially
Fig. 4 Cox proportional hazard models of the association of leisure PC screen time with all-cause mortality, and incidence of CVD and cancer byphysical activity, fitness and handgrip strength strata. Data presented as adjusted hazard ratio (HR) (95%CI). Reference category was defined asthose participants with < 2 h.day− 1 of PC screen time and who were in the highest tertile for physical activity, fitness or grip strength. Within-tertile HR trends, with p values for these trends also shown for each physical activity, fitness and physical activity strata. Analyses were adjustedfor age, sex, ethnicity, deprivation index, professional qualifications, income, employment, smoking status, sleep duration categories, dietary intake(alcohol, red meat, processed meat, fruit and vegetable and oily fish intake), systolic blood pressure, prevalent diabetes, hypertension and medicationfor diabetes, hypertension, and cholesterol. Analyses were all performed as landmark analysis with follow-up commenced 2 years after recruitment andonly including participants who were event-free at this time. Participants with comorbidities at baseline were excluded from all-analysis (n = 103,755).P-interaction indicates the p value for the interaction between PC screen and tertile of physical activity, fitness or strength
Celis-Morales et al. BMC Medicine (2018) 16:77 Page 10 of 14

increase the clinical effectiveness and cost-effectiveness.While fitness testing is relatively difficult to measure inhealth-care and community settings, grip strength isquick, simple and cheap to measure, and has high repro-ducibility [26], so could easily be implemented as ascreening tool in a variety of settings. The effectivenessof such a targeted approach requires testing in rando-mised controlled trials.Conversely, the present data suggest that those with
high levels of fitness and grip strength are relatively pro-tected from the adverse association of high levels ofscreen time with mortality, CVD and cancer risk. Highfitness and grip strength are likely to have an innatecomponent since fitness and strength both have rela-tively high heritability [27, 28]. A number of genes re-lated to fitness and strength have been identified [29],and some individuals with low levels of physical activityare fit and strong [9], but it is also likely that current fit-ness and strength are influenced by patterns of physicalactivity earlier in life. There is evidence from animalmodel studies that artificial selection for high cardiore-spiratory fitness leads to a favourable cardio-metabolicrisk profile [30] and increased life expectancy [31], sug-gesting a causal protective effect of high fitness againstadverse health outcomes. There are also data from ran-domised trials of resistance training—which improvesstrength—that such interventions improve glucose regu-lation, lipid profile, adiposity and type 2 diabetes risk[32, 33]. Thus, the inverse association between gripstrength (which provides a good index of overall musclelimb strength [34]) and mortality/CVD/cancer risk ismechanistically plausible. The present data suggest ahigh level of functional capacity—as evidenced by highfitness or strength—enables an individual to be able totolerate high levels of screen time without experiencingthe same adverse health consequences as their less fitand strong counterparts. Thus, for individuals whospend a large proportion of their leisure time onscreen-related activities (TV viewing and computer use),increasing fitness and strength could conceivably be oneway of offsetting this risk. This is a testable hypothesisthat warrants testing in a randomised trial.Our findings also confirm the recent observations in a
meta-analysis of a million participants that high levels ofphysical activity attenuate the adverse effects of pro-longed sitting [35]. We extend the findings for a further502,642 participants to also show that this moderatingeffect of physical activity on the association between dis-cretionary sedentary behaviour and mortality also appliesto CVD and cancer incidence and mortality. Moreover, arecent prospective study reported that 4.3% to 14.9% ofpremature deaths in the United Kingdom could beavoided through substitution of 30 min.day− 1 of totalscreen time or TV viewing time by discretionary active
alternatives, such as DIY and other daily life activities,with the highest potential reduction in mortality to begained from substituting TV viewing with sport andexercise [4]. This is the largest single study to considerthis research question. A key strength of the presentinvestigation is that all participants came from a singlewell-phenotyped study (UK Biobank), with harmoniseddata collection and a comprehensive and consistent setof covariates. This eliminates the issue of between-studyheterogeneity and enables a more complete adjustmentfor potential confounding factors than is possible from ameta-analysis.Higher levels of discretionary screen time, and its sub-
components of TV viewing and leisure PC use, are nu-merically more strongly associated with adverse healthoutcomes amongst those with the lowest levels of phys-ical activity, fitness and grip strength. Moreover, there isgenerally no significant association of increasing screentime with adverse health outcomes amongst the fittest,strongest and most-active tertiles. Despite this, it is im-portant to acknowledge that there were no statisticallysignificant interactions observed when the strengths ofthese associations were formally statistically compared.This suggests that the power needed to detect such anassociation is very high and a longer follow-up, to enablemore events to accrue, may be needed. On this note, itis important to recognise that the earlier meta-analysison the association between sitting and mortality accord-ing to levels of physical activity—which the presentstudy builds on—did not formally test for interactionsand drew its conclusions from numerical differences inthe mortality HRs [35].
Implications of findingsOverall, these data are potentially relevant to guidanceand interventions aiming to reduce CVD and mortalityrisk via behavioural change. Our findings suggest thatthe deleterious effects of screen time may be greatestamongst those with low levels of strength, fitness orphysical activity. Thus, specifically targeting these groupsto reduce screen time (and potentially other sedentarybehaviours) and/or increase physical activity and func-tional capacity may be a more effective strategy than theblanket approach of recommending a reduction of sed-entary behaviour in all. Notably, it is quick and easy toidentify such high-risk groups. The questionnaire usedto assess screen time and physical activity in UK Bio-bank data can be completed relatively quickly (3–5 min).Measurement of grip strength is quick, simple and cheapto administer using a hand grip dynamometer and hashigh reproducibility [26]. Thus, screening for physicalactivity level and grip strength could easily be under-taken in routine clinical practice and in community set-tings to identify individuals for whom reducing
Celis-Morales et al. BMC Medicine (2018) 16:77 Page 11 of 14

sedentary behaviour would be particularly beneficial.Randomised trials to test the effectiveness of such an ap-proach are, therefore, warranted.
Strengths and limitationsThe UK Biobank provided an opportunity to test our re-search question in a very large, prospective cohort andthe main outcome used in this study was collected usinga linkage to UK NHS mortality and hospital admissionrecords. Additionally, physical activity, cardiorespiratoryfitness and grip strength were assessed using validatedmethods [9, 17, 22, 36], trained staff and standard oper-ating procedures. In addition, a wide range of potentialconfounding variables was controlled for in our analyses.These include dietary intake variables, BMI, diabetes andhypertension, which could be on the causal pathway be-tween discretionary screen time and mortality and mor-bidity outcomes, potentially resulting in over adjustmentand, therefore, underestimation of the strength of associ-ation for discretionary screen time (and its subcompo-nents) and the measured outcomes. Fitness was onlyassessed in a subgroup of the UK Biobank cohort, whichlimits the power in our analyses stratified by fitness level.In addition, fitness tests were not conducted if it was un-safe to do so and our analyses excluded all participantswith comorbidities. It might be expected that such indi-viduals would be more likely to have a low rather thanhigh level of fitness, thus their inclusion could conceiv-ably have obscured or augmented the true associationbetween fitness and the outcome measures due to re-verse causality. UK Biobank is relatively representative ofthe general population with respect to age, sex, ethnicityand deprivation within the age range recruited but is notrepresentative in other regards, such as prevalence ofobesity and comorbidities, which may indicate a healthyvolunteer selection bias [37]. Whilst this limits the abil-ity to generalise prevalence rates, estimates of the mag-nitude of associations regarding disease or mortality anddisease risk in the current study should nevertheless begeneralisable [13, 37, 38]. As is the case for any observa-tional study, causality cannot be confirmed and reversecausality is always a possibility. However, our analyseswere conducted by excluding all those with chronicconditions. Although disease and comorbidities existingbefore the UK Biobank measurement day wereself-reported, these self-reported records were based ondiseases that have been medically diagnosed. Addition-ally, we excluded those who died within the first 2 yearsof follow-up. These approaches help us to minimise therisk of reverse causality influencing our estimates. An-other aspect that could confound our findings is the ef-fect of potential mediators, such as BMI, diabetes andhypertension, on the health outcomes. However, we con-ducted a sensitivity analysis by testing the interaction
between health outcomes and screen-time exposureswith and without these covariates and the results werenot altered. Therefore, we included only a fully adjustedanalysis in the study.Although physical activity was measured by self-report
using a validated questionnaire [9, 17, 39], self-reportedscreen time has not been examined for criterion validity.However, most self-reported instruments have similarvalidity [40], and the effect estimates reported for screentime in this study were similar to those reported previ-ously in comparable populations using similar adjust-ment strategies [3, 4, 41]. Misreporting of screen time orphysical activity may have attenuated the association be-tween the lifestyle exposures and mortality compared toan objective physical activity measurement [42]. How-ever, this is unlikely to have substantially confoundedthe differential influence of the exposures on mortalityand disease risk across the screen-time or physical activ-ity groups, unless the extent of misreporting of screentime was systematically greater in the groups with thehighest levels of physical activity, fitness and gripstrength. It is also more feasible to administer a ques-tionnaire rather than an objective measure as a screen-ing tool in routine clinical or community settings [26] toidentify individuals for whom increasing physical activityand reducing screen time would be particularly benefi-cial. The present data suggest that this self-reportapproach is sufficiently robust to identify differentiallevels of risk. Although our analyses were adjusted for anumber of major confounding factors, we cannot fullydiscard the potential contribution of unmeasured con-founding factors or other proxies of sedentary leisure be-haviour in our findings.
ConclusionsIn conclusion, the present data build on existing evi-dence that a high level of discretionary screen time isa potentially preventable contributor to morbidity andmortality, by demonstrating that this relationship issubstantially attenuated by grip strength and cardiore-spiratory fitness. We also confirm and extend recentobservations that the association between TV viewingand mortality is attenuated by a level of physical ac-tivity. This has two potentially important implicationsfor public health. First, interventions to reduce discre-tionary sedentary behaviours to improve future healthoutcomes may be more economically and clinically ef-fective if they are targeted at those with low levels ofstrength, fitness and physical activity. Second, increas-ing strength and fitness may provide a means of off-setting the potential adverse consequences of highscreen time. Both of these warrant testing in futurerandomised controlled trials.
Celis-Morales et al. BMC Medicine (2018) 16:77 Page 12 of 14
Additional file
Additional file 1: Table S1. Number of participants with missing datafor covariates. Table S2. Cut-off points for age- and sex-specific physicalactivity tertiles. Table S3. Cut-off points for age- and sex-specific gripstrength tertiles. Table S4. Cut-off points for age- and sex-specific fitnesstertiles. Table S5. Cohort characteristics by categories of TV viewing. Table S6.Cohort characteristics by categories of PC screen time. Table S7. Cohortcharacteristics by age- and sex-specific tertiles of total physical activity.Table S8. Cohort characteristics by age- and sex-specific tertiles ofcardiorespiratory fitness. Table S9. Cohort characteristics by age- andsex-specific tertiles of handgrip strength. Table S10. Correlationbetween TV viewing, total physical activity and grip strength. Figure S1.Cox proportional hazard model of the association of 1-h increments inscreen time, TV viewing and PC screen time with CVD and cancer mortality.Figure S2. Cox proportional hazard models of the association of overalldiscretionary screen time with CVD and cancer mortality by physical activity,fitness and handgrip strength strata. Figure S3. Cox proportional hazardmodels of the association of overall discretionary TV viewing with CVD andcancer mortality by physical activity, fitness and handgrip strength strata.Figure S4. Cox proportional hazard models of the association of overalldiscretionary PC screen time with CVD and cancer mortality by physicalactivity, fitness and handgrip strength strata. Table S11. Cox proportionalhazard estimates of the association of overall discretionary screen time withall-cause mortality, CVD and cancer incidence and mortality by physicalactivity, fitness and handgrip strength strata. Table S12. Cox proportionalhazard estimates of the association of discretionary TV viewing with all-cause mortality, CVD and cancer incidence and mortality by physical activity,fitness and handgrip strength strata. Table S13. Cox proportional hazardestimates of the association of discretionary PC screen time with all-causemortality, CVD and cancer incidence and mortality by physical activity,fitness and handgrip strength strata. (DOCX 1552 kb)
Abbreviations95% CI: 95% confidence interval; BMI: Body mass index; COPD: Chronicobstructive pulmonary disease; CVD: Cardiovascular disease; HR: Hazard ratio;IPAQ: International Physical Activity Questionnaire; MET: Metabolic equivalent;NHS: National Health Service; PC: Personal computer; TV: Television
AcknowledgementsWe are grateful to UK Biobank participants. This study was conducted usingdata from the UK Biobank (application 7155).
FundingThe UK Biobank was supported by the Wellcome Trust, Medical ResearchCouncil, Department of Health, Scottish Government and the NorthwestRegional Development Agency. It has also had funding from the WelshAssembly Government and the British Heart Foundation. The research wasdesigned, conducted, analysed and interpreted by the authors entirelyindependently of the funding sources.
Availability of data and materialsThe data that support the findings of this study are available from UKBiobank but restrictions apply to their availability. These data were usedunder licence for the current study, and so are not publicly available. Thedata are, however, available from the authors upon reasonable request andwith permission of UK Biobank.
Authors’ contributionsCCM, JPP, NS and JMRG contributed to the conception and design of thestudy. CCM, JPP, NS, JMRG, DML, JA, SI, SG, DFM, PW and TY advised on allstatistical aspects and interpreted the data. CCM, DML, LS and SG performedthe statistical analysis. CCM, DML, LS, SG, JPP, NS and JMRG drafted themanuscript. CCM, DML, JA, LS, SI, SG, DFM, PW, TY, NS, JPP and JMRGreviewed the manuscript and approved the final version to be published.CCM, DML, LS, SG, JPP, NS and JMRG had full access to all the data in thestudy and take responsibility for the integrity of the data and the accuracy ofthe data analysis.
Ethics approval and consent to participateThe UK Biobank study was approved by the North West Multi-Centre ResearchEthics Committee (reference for UK Biobank is 16/NW/0274) and all participantsprovided written informed consent to participate in the UK Biobank study. Thestudy protocol is available online (http://www.ukbiobank.ac.uk/wp-content/up-loads/2018/05/Favourable-Ethical-Opinion-and-RTB-Approval-16.NW_.0274-200778-May-2016.pdf).
Competing interestsThe authors declare that they have no competing interests.
Publisher’s NoteSpringer Nature remains neutral with regard to jurisdictional claims inpublished maps and institutional affiliations.
Author details1BHF Glasgow Cardiovascular Research Centre, Institute of Cardiovascular andMedical Sciences, College of Medical, Veterinary and Life Sciences, Universityof Glasgow, Glasgow G12 8TA, UK. 2Institute of Health and Wellbeing,University of Glasgow, Glasgow G12 8RZ, UK. 3National Institute for HealthResearch (NIHR) Leicester-Loughborough Diet, Lifestyle and Physical ActivityBiomedical Research Unit (BRU), Leicester Diabetes Centre, Leicester GeneralHospital, Gwendolen Road, Leicester LE5 4PW, UK. 4Diabetes ResearchCentre, University of Leicester, University Road, Leicester LE1 7RH, UK.
Received: 10 April 2017 Accepted: 25 April 2018
References1. Warburton DER, Nicol CW, Bredin SSD. Health benefits of physical activity:
the evidence. Can Med Assoc J. 2006;174(6):801–9.2. Wilmot EG, Edwardson CL, Achana FA, Davies MJ, Gorely T, Gray LJ, Khunti
K, Yates T, Biddle SJH. Sedentary time in adults and the association withdiabetes, cardiovascular disease and death: systematic review and meta-analysis. Diabetologia. 2012;55(11):2895–905.
3. Javier Basterra-Gortari F, Bes-Rastrollo M, Gea A, Maria Nunez-Cordoba J,Toledo E, Angel Martinez-Gonzalez M. Television Viewing, Computer Use,Time Driving and All-Cause Mortality: The SUN Cohort. J Am Heart Assoc.2014;3(3):e000864.
4. Wijndaele K, Sharp SJ, Wareham NJ, Brage S. Mortality Risk Reductions fromSubstituting Screen Time by Discretionary Activities. Med Sci Sports Exerc.2017;49(6):1111–9.
5. Kodama S, Saito K, Tanaka S, Maki M, Yachi Y, Asumi M, Sugawara A,Totsuka K, Shimano H, Ohashi Y, et al. Cardiorespiratory Fitness as aQuantitative Predictor of All-Cause Mortality and Cardiovascular Events inHealthy Men and Women A Meta-analysis. JAMA. 2009;301(19):2024–35.
6. Leong DP, Teo KK, Rangarajan S. Prognostic value of grip strength: findingsfrom the Prospective Urban Rural Epidemiology (PURE) study. Lancet. 2015;386(9990):266–73.
7. Yates T, Zaccardi F, Dhalwani NN, Davies MJ, Bakrania K, Celis-Morales CA,Gill JMR, Franks PW, Khunti K. Association of walking pace and handgripstrength with all-cause, cardiovascular, and cancer mortality: a UK Biobankobservational study. Eur Heart J. 2017;1(1):ehx449.
8. Celis-Morales CA, Petermann F, Hui L, Lyall DM, Iliodromiti S, McLaren J,Anderson J, Welsh P, Mackay DF, Pell JP, et al. Associations BetweenDiabetes and Both Cardiovascular Disease and All-Cause Mortality AreModified by Grip Strength: Evidence From UK Biobank, a ProspectivePopulation-Based Cohort Study. Diabetes Care. 2017;40(12):1710–8.
9. Celis-Morales C, Lyall DM, Anderson J, Pell JP, Sattar N, Gill J. The associationbetween physical activity and risk of mortality is modulated by gripstrength and cardiorespiratory fitness: evidence from 498,135 UK-Biobankparticipants. Eur Heart J. 2016;38(2):116–22.
10. Ekelund U, Steene-Johannessen J, Brown WJ, Fagerland MW, Owen N,Powell KE, Bauman A, Lee IM. Does physical activity attenuate, or eveneliminate, the detrimental association of sitting time with mortality? Aharmonised meta-analysis of data from more than 1 million men andwomen. Lancet.
11. Owen N, Healy GN, Matthews CE, Dunstan DW. Too Much Sitting: ThePopulation Health Science of Sedentary Behavior. Exerc Sport Sci Rev. 2010;38(3):105–13.
Celis-Morales et al. BMC Medicine (2018) 16:77 Page 13 of 14
12. Dunstan DW, Howard B, Healy GN, Owen N. Too much sitting - A healthhazard. Diabetes Res Clin Pract. 2012;97(3):368–76.
13. Collins R. What makes UK Biobank special? Lancet. 2012;379(9822):1173–4.14. Palmer LJ. UK Biobank: bank on it. Lancet. 2007;369(9578):1980–2.15. Sudlow C, Gallacher J, Allen N, Beral V, Burton P, Danesh J, Downey P, Elliott
P, Green J, Landray M, et al. UK Biobank: An Open Access Resource forIdentifying the Causes of a Wide Range of Complex Diseases of Middle andOld Age. PLoS Med. 2015;12(3):e1001779.
16. Guo W, Bradbury KE, Reeves GK, Key TJ. Physical activity in relation to body sizeand composition in women in UK Biobank. Ann Epidemiol. 2015;25(6):406–13.
17. Guidelines for Data Processing and Analysis of the International PhysicalActivity Questionnaire (IPAQ) - Short Form, Version 2.0 [www.ipaq.ki.se].Accessed 27 Mar 2017.
18. Tanaka H, Monahan KD, Seals DR. Age-predicted maximal heart raterevisited. J Am Coll Cardiol. 2001;37(1):153–6.
19. Medicine ACoS. Guidelines for Exercise Testing and Prescription, 9th Editionedn. Baltimore: Wolters Kluwer Health/Lippinoctt, Williams & Wilkins; 2014.
20. Swain DP. Energy cost calculations for exercise prescription - An update.Sports Med. 2000;30(1):17–22.
21. Galante J, Adamska L, Young A, Young H, Littlejohns TJ, Gallacher J, Allen N.The acceptability of repeat Internet-based hybrid diet assessment ofprevious 24-h dietary intake: administration of the Oxford WebQ in UKBiobank. Br J Nutr. 2015;115(4):681–6.
22. Anderson JJ, Celis-Morales CA, Mackay DF, Iliodromiti S, Lyall DM, Sattar N,Gill JMR, Pell JP. Adiposity among 132 479 UK Biobank participants;contribution of sugar intake vs other macronutrients. Int J Epidemiol. 2016;
23. Townsend P, Phillimore M, Beattie A. Health and Deprivation: Inequality andthe North. London: Croom Helm Ltd; 1988.
24. WHO. Obesity: preventing and managing the global epidemic. Report of aWHO consultation. In: World Health Organization technical report series, vol.894; 2000. p. i–xii. 1–253.
25. Department of Health. Start Active, Stay Active: a report on physical activityfor health from the four home countries’ Chief Medical Officers. Norwich:Department of Health; 2011.
26. Roberts HC, Denison HJ, Martin HJ, Patel HP, Syddall H, Cooper C, Sayer AA. Areview of the measurement of grip strength in clinical and epidemiologicalstudies: towards a standardised approach. Age Ageing. 2011;40(4):423–9.
27. Frederiksen H, Gaist D, Petersen HC, Hjelmborg J, McGue M, Vaupel JW,Christensen K. Hand grip strength: A phenotype suitable for identifyinggenetic variants affecting mid- and late-life physical functional. GenetEpidemiol. 2002;23(2):110–22.
28. Bouchard C. Genomic predictors of trainability. Exp Physiol. 2012;97(3):347–52.29. Willems SM, Wright DJ, Day FR, Trajanoska K, Joshi PK, Morris JA, Matteini
AM, Garton FC, Grarup N, Oskolkov N, et al. Large-scale GWAS identifiesmultiple loci for hand grip strength providing biological insights intomuscular fitness. Nat Commun. 2017;8:16015.
30. Wisloff U, Najjar SM, Ellingsen O, Haram PM, Swoap S, Al-Share Q, FernstromM, Rezaei K, Lee SJ, Koch LG, et al. Cardiovascular risk factors emerge afterartificial selection for low aerobic capacity. Science. 2005;307(5708):418–20.
31. Koch LG, Kemi OJ, Qi N, Leng SX, Bijma P, Gilligan LJ, Wilkinson JE, Wisloff H,Hoydal MA, Rolim N, et al. Intrinsic Aerobic Capacity Sets a Divide for Agingand Longevity. Circ Res. 2011;109(10):1162–U1151.
32. Holten MK, Zacho M, Gaster M, Juel C, Wojtaszewski JFP, Dela F. Strengthtraining increases insulin-mediated glucose uptake, GLUT4 content, andinsulin signaling in skeletal muscle in patients with type 2 diabetes.Diabetes. 2004;53(2):294–305.
33. Cornelissen VA, Fagard RH, Coeckelberghs E, Vanhees L. Impact of ResistanceTraining on Blood Pressure and Other Cardiovascular Risk Factors A Meta-Analysis of Randomized, Controlled Trials. Hypertension. 2011;58(5):950–U564.
34. Bohannon RW, Magasi SR, Bubela DJ, Wang Y-C, Gershon RC. Grip and kneeextension muscle strength reflect a common construct among adults.Muscle Nerve. 2012;46(4):555–8.
35. Ekelund U, Steene-Johannessen J, Brown WJ, Fagerland MW, Owen N,Powell KE, Bauman A, Lee IM. Does physical activity attenuate, or eveneliminate, the detrimental association of sitting time with mortality? Aharmonised meta-analysis of data from more than 1 million men andwomen. Lancet. 2016;388:1302–10.
36. Bauman A, Ainsworth BE, Sallis JF, Hagstromer M, Craig CL, Bull FC, Pratt M,Venugopal K, Chau J, Sjostrom M, et al. The Descriptive Epidemiology ofSitting A 20-Country Comparison Using the International Physical ActivityQuestionnaire (IPAQ). Am J Prev Med. 2011;41(2):228–35.
37. Fry A, Littlejohns TJ, Sudlow C, Doherty N, Adamska L, Sprosen T, Collins R,Allen NE. Comparison of Sociodemographic and Health-RelatedCharacteristics of UK Biobank Participants with the General Population. Am JEpidemiol. 2017;1(1):1–26.
38. Swanson JM. The UK Biobank and selection bias. Lancet. 2012;380(9837):110.39. Lee PH, Macfarlane DJ, Lam TH, Stewart SM. Validity of the international
physical activity questionnaire short form (IPAQ-SF): A systematic review. IntJ Behav Nutr Phys Act. 2011;8:115.
40. Helmerhorst HJF, Brage S, Warren J, Besson H, Ekelund U. A systematicreview of reliability and objective criterion-related validity of physical activityquestionnaires. Int J Behav Nutr Phys Act. 2012;9:103.
41. Wijndaele K, Brage S, Besson H, Khaw K-T, Sharp SJ, Luben R, Wareham NJ,Ekelund U. Television viewing time independently predicts all-cause andcardiovascular mortality: the EPIC Norfolk Study. Int J Epidemiol. 2011;40(1):150–9.
42. Celis-Morales CA, Perez-Bravo F, Ibañez L, Salas C, Bailey ME, Gill JM.Objective vs. self-reported physical activity and sedentary time: effects ofmeasurement method on relationships with risk biomarkers. PLoS One.2012;7(5):e36345.
Celis-Morales et al. BMC Medicine (2018) 16:77 Page 14 of 14