Embed Size (px)
Citation preview

Umeå University Medical Dissertations Series No 1269, ISSN 0346-6612, ISBN 978-91-7264-793-0
Department of Public Health and Clinical Medicine, Occupational and Environmental Medicine Umeå University, SE-901 87 Umeå, Sweden
Asthma, rhinitis, and asthma-related symptoms in relation
to vehicle exhaust using different exposure metrics.
Lars Modig
Umeå 2009

Copyright © 2009 by Lars Modig ISSN 0346-6612 ISBN 978-91-7264-793-0 Printed by Print och Media 2009

CONTENTS
ABSTRACT ............................................................................................. 5
LIST OF PUBLICATIONS .......................................................................... 7
SELECTED ABBREVIATIONS .................................................................... 8
BACKGROUND ...................................................................................... 9
AIR POLLUTION AND HEALTH ‐ AN INTRODUCTION ............................................. 9 TRAFFIC‐RELATED AIR POLLUTION ................................................................. 10 Substances and levels ........................................................................ 10 Spatial distribution and monitoring sites .......................................... 11
MODELS ................................................................................................... 12 EXPOSURE ASSESSMENT IN LONG‐TERM STUDIES OF AIR POLLUTION AND HEALTH . 13 ASTHMA .................................................................................................. 14 Clinical definitions .............................................................................. 15 Operational definitions ...................................................................... 15
RHINITIS ................................................................................................... 16 PREVALENCE OF ASTHMA AND RHINITIS ......................................................... 17 INCIDENCE OF ASTHMA AND RHINITIS ............................................................ 18 RISK FACTORS FOR ASTHMA AND RHINITIS ...................................................... 18 Asthma and air pollution ................................................................... 19
ANNOYANCE AND AIR POLLUTION ................................................................. 20
AIMS AND METHODS .......................................................................... 22
AIM OF THE THESIS ..................................................................................... 22 SPECIFIC AIMS, SUBJECTS, AND METHODS ...................................................... 22 PAPER I .................................................................................................... 22 Aim ..................................................................................................... 22 Methods ............................................................................................. 22
PAPER II ................................................................................................... 25 Aim ..................................................................................................... 25 Methods ............................................................................................. 25
PAPERS III AND IV ...................................................................................... 26 Aims ................................................................................................... 26 Methods ............................................................................................. 26
MAIN RESULTS .................................................................................... 30
PAPER I .................................................................................................... 30 PAPER II ................................................................................................... 30 PAPERS III AND IV ...................................................................................... 31

DISCUSSION ........................................................................................ 32
THE RESULTS IN PERSPECTIVE ....................................................................... 32 EXPOSURES ASSESSMENT ............................................................................ 33 Dispersion modelling ......................................................................... 34 Geographical exposure metrics ......................................................... 35 Modelled pollution levels vs. distance to major road ........................ 36 Diffusive NO2 measurements ............................................................. 37 Levels outside home as an indicator of exposure .............................. 37 Relevant time period of exposure ...................................................... 38 Relevance of used exposure metrics .................................................. 39
OUTCOMES............................................................................................... 40 Asthma ............................................................................................... 40 Rhinitis ............................................................................................... 41 Annoyance ......................................................................................... 42
ANALYSIS .................................................................................................. 42 Systematic errors ............................................................................... 42 Confounding ...................................................................................... 44
FUTURE RESEARCH ..................................................................................... 45
CONCLUSIONS ..................................................................................... 47
ACKNOWLEDGEMENTS ....................................................................... 48
REFERENCES ........................................................................................ 50
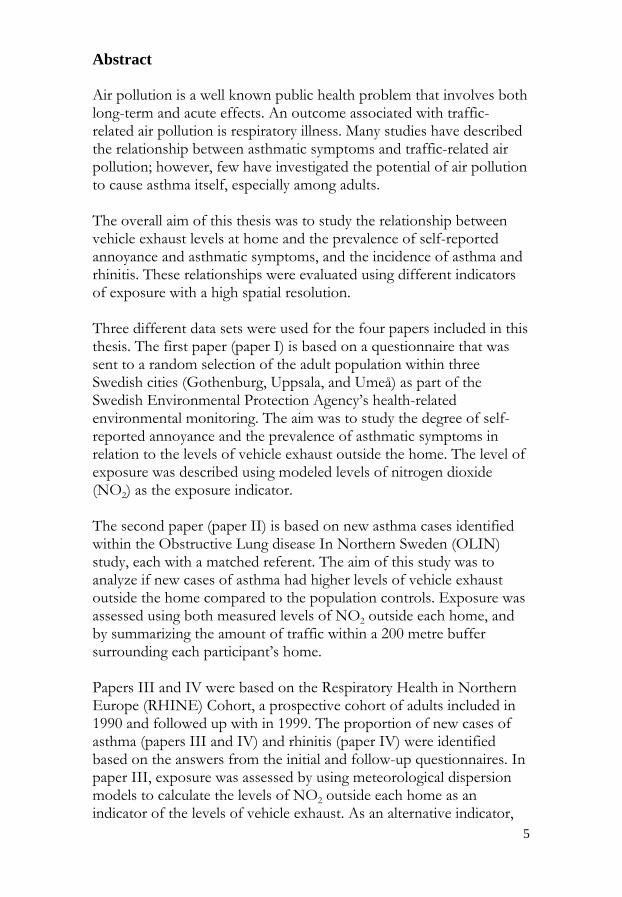
Abstract Air pollution is a well known public health problem that involves both long-term and acute effects. An outcome associated with traffic-related air pollution is respiratory illness. Many studies have described the relationship between asthmatic symptoms and traffic-related air pollution; however, few have investigated the potential of air pollution to cause asthma itself, especially among adults. The overall aim of this thesis was to study the relationship between vehicle exhaust levels at home and the prevalence of self-reported annoyance and asthmatic symptoms, and the incidence of asthma and rhinitis. These relationships were evaluated using different indicators of exposure with a high spatial resolution. Three different data sets were used for the four papers included in this thesis. The first paper (paper I) is based on a questionnaire that was sent to a random selection of the adult population within three Swedish cities (Gothenburg, Uppsala, and Umeå) as part of the Swedish Environmental Protection Agency’s health-related environmental monitoring. The aim was to study the degree of self-reported annoyance and the prevalence of asthmatic symptoms in relation to the levels of vehicle exhaust outside the home. The level of exposure was described using modeled levels of nitrogen dioxide (NO2) as the exposure indicator. The second paper (paper II) is based on new asthma cases identified within the Obstructive Lung disease In Northern Sweden (OLIN) study, each with a matched referent. The aim of this study was to analyze if new cases of asthma had higher levels of vehicle exhaust outside the home compared to the population controls. Exposure was assessed using both measured levels of NO2 outside each home, and by summarizing the amount of traffic within a 200 metre buffer surrounding each participant’s home. Papers III and IV were based on the Respiratory Health in Northern Europe (RHINE) Cohort, a prospective cohort of adults included in 1990 and followed up with in 1999. The proportion of new cases of asthma (papers III and IV) and rhinitis (paper IV) were identified based on the answers from the initial and follow-up questionnaires. In paper III, exposure was assessed by using meteorological dispersion models to calculate the levels of NO2 outside each home as an indicator of the levels of vehicle exhaust. As an alternative indicator,
5
the distance from each participant’s home to the nearest major road was calculated using geographical information system (GIS) tools. The exposure assessment in paper IV was also based on meteorological dispersion models, but expressed the levels of vehicle exhaust as particle mass concentration. The results show that the levels of vehicle exhaust outside the home are significantly correlated with the degree of self-reported annoyance and the prevalence of asthmatic symptoms, and also with the risk of developing asthma, but not rhinitis, among adults. The odds ratio (OR) for high annoyance to vehicle exhaust and reporting asthmatic symptoms was 1.14 (95% Confidence Interval, CI 1.11-1.18) and 1.04 (95% CI 1.01-1.07) per 1 µg/m3 increase in the NO2 level outside the home, respectively. Paper II showed there was a non-significant tendency for increased risk of developing asthma among those living with high levels of vehicle exhaust outside their home. This finding was then supported by papers III and IV, showing a significant relationship between the onset of asthma and the mean (winter) levels of NO2 outside the home (OR=1.46, 95% CI 1.07-1.99 per 10 µg/m3) and the levels of vehicle exhaust particles outside the home. In paper III, living close to a major road was significantly related to the risk of developing asthma. No significant results were shown between vehicle exhaust and rhinitis. In conclusion, vehicle exhaust outside the home is associated with the prevalence of annoyance and asthmatic symptoms, and with the risk of developing asthma, but not rhinitis, among adults.
6

List of publications This thesis is based on the following papers, which will be referred to by their Roman numerals.
I. Modig L, Forsberg B. Perceived annoyance and asthmatic symptoms in relation to vehicle exhaust levels outside home: a cross-sectional study. Environ Health 2007;6:29.
II. Modig L, Järvholm B, Rönnmark E, Nyström L, Lundbäck B, Andersson C, Forsberg B. Vehicle exhaust exposure in an incident case-control study of adult asthma. Eur Respir J 2006;28:75-81.
III. Modig L, Torén K, Janson C, Järvholm B, Forsberg B. Vehicle exhaust outside the home and onset of asthma among adults. Eur Respir J 2009;33:(6). Scheduled publication date: June 2009.
IV. Modig L, Johansson C, Torén K, Janson C, Järvholm B, Forsberg B. Levels of vehicle exhaust particles outside the home and the development of rhinitis and asthma among adults. Manuscript.
The published papers have been reprinted with kind permission of the publishers.
7
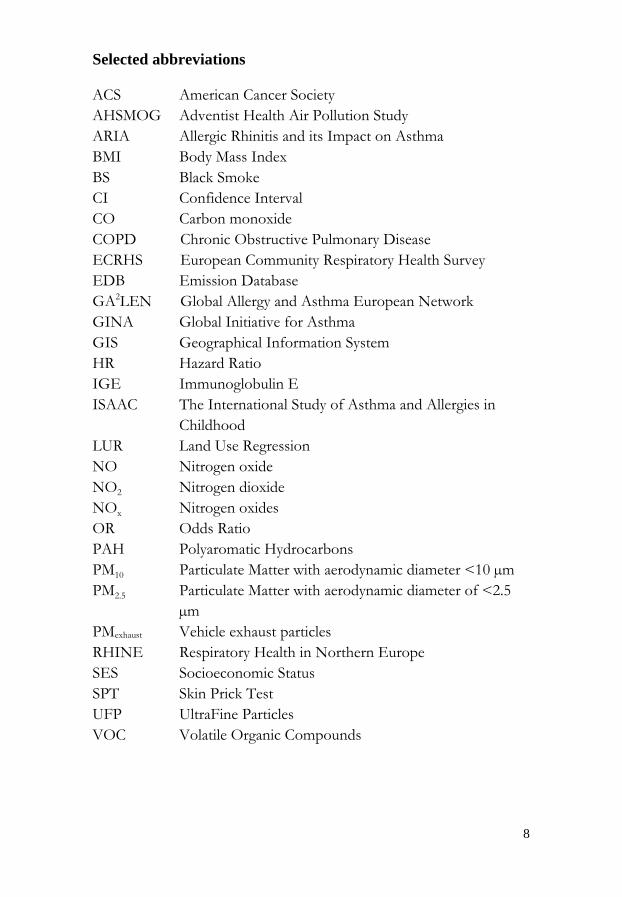
Selected abbreviations ACS American Cancer Society AHSMOG Adventist Health Air Pollution Study ARIA Allergic Rhinitis and its Impact on Asthma BMI Body Mass Index BS Black Smoke CI Confidence Interval CO Carbon monoxide COPD Chronic Obstructive Pulmonary Disease ECRHS European Community Respiratory Health Survey EDB Emission Database GA2LEN Global Allergy and Asthma European Network GINA Global Initiative for Asthma GIS Geographical Information System HR Hazard Ratio IGE Immunoglobulin E ISAAC The International Study of Asthma and Allergies in
Childhood LUR Land Use Regression NO Nitrogen oxide NO2 Nitrogen dioxide
NOx Nitrogen oxides OR Odds Ratio PAH Polyaromatic Hydrocarbons PM10 Particulate Matter with aerodynamic diameter <10 µm PM2.5 Particulate Matter with aerodynamic diameter of <2.5
µm
PMexhaust Vehicle exhaust particles
RHINE Respiratory Health in Northern Europe SES Socioeconomic Status SPT Skin Prick Test UFP UltraFine Particles VOC Volatile Organic Compounds
8
Background Air pollution and health - an introduction Air pollution has been considered annoying and unhealthy for hundreds of years. During the 20th century, several major disasters resulting in high levels of air pollutants were responsible for an increased number of deaths and hospital admissions. During the London SMOG episode of 1952, there were an estimated 3000 to 4000 premature deaths over a three-week period, however more recent studies have increased these figures by a factor of 3 [1]. Early spatial studies of air pollution observed a correlation between sales of coal and deaths from bronchitis and other respiratory diseases [2]. Despite large improvements in air quality, both in Sweden and in many other countries worldwide during the last decades, air pollution has been estimated to cause more than 2 million premature deaths globally each year [3]. In Sweden, studies estimate that the impact of locally-generated particles and long-distance transported particles cause an estimated 1800 and 3500 premature deaths every year, respectively [4]. There are probably also effects on disease induction as a result of poor air quality, however few studies are available. Traffic is the major source of air pollution in Swedish and European cities and creates a complex mix of different substances in urban air. It is well documented that traffic pollution may worsen asthma and cause other acute effects, while studies have been inconsistent regarding the prevalence of asthma and allergies associated with increasing levels of air pollution. The lack of prospective cohorts for studying the incidence of respiratory disease, together with exposure misclassification, are shortcomings in this research field [5]. A focus on new cases, incidence, as a proportion (cumulative incidence) or a rate per unit of person time, is preferred in studies of risk factors. In studies of people who have the disease at a specific time (prevalence), it may be difficult to conclude that exposure preceded the development of the disease. This thesis examines vehicle exhaust as a risk factor for the development of asthma and rhinitis, and the relationship between annoyance and asthmatic symptoms and the levels of vehicle exhaust outside the home.
9
Traffic-related air pollution Substances and levels The emissions from heavy and light vehicles are complex and varying depending on the type of vehicle, fuel and driving conditions. In general, diesel vehicle have higher emissions (per unit of fuel burned or kilometre driven) of nitric oxides (NOx), polyaromatic hydrocarbons (PAH), and particle mass concentration in comparison to gasoline cars with catalytic converters, which emit more carbon monoxide (CO) and volatile organic compounds (VOC) [6, 7]. Pollutants related to vehicles and vehicle exhaust can be separated into primary and secondary types. Primary pollutants are those emitted directly from in the exhaust or from non-exhaust processes, while secondary pollutants are those formed by chemical reactions in the atmosphere based on primary emissions [3]. NOx and CO, VOC, exhaust particles (PMexhaust), road dust, and break wear particles are examples of primary emissions. Secondary pollutants include secondary particles such as nitrates and sulphates, but also ground level ozone. Secondary particles are formed mainly by the oxidation of hydrocarbons, nitrogen oxides to nitrate, and sulphur dioxide to sulphates [3]. The pollutants, nitrogen dioxide (NO2), particles mass (PM10 and PM2.5), and ozone are most frequently correlated to health effects directly or indirectly related to traffic pollution. In recent years, research has started to focus on the finest fractions of particles, which are more strongly related to primary exhaust emissions. Ultrafine particles are defined as particles less than 0.1µm and include the largest number concentration of particles emitted from vehicles [7]. In the beginning of 1980, many countries started measuring NO2 due to the increasing number of cars. The introduction of catalytic converters in the 1980s has decreased the levels of several traffic-related pollutants, including NOx; however, levels continue to be a problem at street level in several major cities with relation to air quality limits. The concentration of NO2 in ambient air is dependent on the amount of emitted NO2 and NO, ozone levels, and light intensity [8]. The relationship between NO2 and NOx is thereby non-linear, with a decreasing ratio with increasing levels of NOx. Previously, only five percent of the total amount of NOx in the tail-pipe was in the form of
10

NO2, a proportion that rapidly increases after emission due to the oxidation of NO to NO2 by ozone. Increasing levels of background ozone have been reported, possibly leading to faster oxidation of NO to NO2 resulting in a larger ratio between NO2 and NOx. Studies have also shown an increase in the percentage of primary emitted NO2, which is partly explained by an increasing percentage of modern diesel cars [9]. Consequently, the ratio between NO2 and NOx could differ between different cities and countries. Results from the Swedish measuring network, URBAN, shows that the range of NO2 measured as winter half-year mean in urban background during 2007/2008 in 12 cities ranged between 8 and 19 µg/m3, and between 19 to 35 µg/m3 at street level (5 cities) [10]. At curbside, wear particles are responsible for approximately 90% of the local contribution of PM10, while the mass contribution from exhaust particles is marginal. However, the number of particles per unit of volume is often dominated by exhaust particles, typically in the size range of 20 to 130 nm [7]. Secondary particles contribute between 60 and 70% of the measured urban background levels of PM10 and even more to PM2.5. At Swedish regional background stations, the ratio between PM2.5 and PM10 (measured as µg/m3) range between 0.7 and 0.8. This ratio declines with latitude indicating that secondary particles are most important in the southern parts of Sweden.
Spatial distribution and monitoring sites Distance to the source is one important factor for the actual levels of pollutants, especially for the gases and ultrafine particles (exhaust particles). The highest levels are recorded close to roads, especially in street canyons, while the levels decline with increasing distance from the source. Studies have shown that the levels of ultrafine particles decayed to half the maximum value at 50 to 150 metres from the road depending on the wind direction [11]. Similar patterns have also been shown for NO2 and NOx, while PM10 and PM2.5 levels decrease much less significantly, suggesting that primary vehicle exhaust contributes marginally to the measured levels [12]. In Sweden, the decrease of PM10 with distance from a road varies depending on the amount of road dust, which is closely related to season. Urban background and street side (hot spots) are the two main types of locations for measurements in urban areas. Urban background represents the larger population within a city or urban area, and street
11
level measurements are often conducted at the most trafficked spot within a city.
Models Dispersion modelling is a powerful tool for describing outdoor levels of air pollutants with both high temporal and geographical resolution. The basis for a dispersion calculation of an air pollutant is the actual dispersion model, information regarding meteorology, and an emission data base. In meteorological dispersion models, the emissions are typically described as point, linear, or area sources. Vehicle and ferry traffic are typical line sources, but are sometimes described as several point sources to more accurately describe the plume behaviour and the high release point. One common way of presenting results from these models is in a grid with separate squares covering the area of interest. In this case, all line and area sources within the specified grid are summarized and described as one source. The source represents the area of the specific grid square, while point sources remain as separate sources (usually with elevated plumes). Meteorology is crucial for all dispersion models, and includes the mean wind speed, turbulence, height of atmospheric layers, chemical reactions in the atmosphere, and deposition [13]. The meteorology and turbulence are calculated within a separate pre-processor based on actual measurements to establish a classification of the atmospheric stability, height of the ground layer, and the wind speed. There are also models using large-scale weather information [14]. The emission database (EDB) is a registry of all emission sources within a specified area. EDB contains information about emissions from roads, petrol stations, ferry traffic, industrial areas, and households [13]. For road traffic, the emission data typically contains the amount of traffic on a specified length of road or on specific surfaces, information on the number of light vehicles, heavy vehicles in different categories, speed limits, road width, street lights, and temporal variations in traffic flow. Emission factors for each source under different conditions have to be added to quantify the emissions expressed as quantity per unit of time.
12

Validation against actual measurements is crucial before applying modelled results for any substance. Recently, the dispersion models used in the municipalities of Stockholm (and also in Uppsala) and Gothenburg were evaluated against actual measurements that were spatially distributed over each city [15]. The results showed high agreement between modelled and measured annual levels of NO2 in both cities (r2= 0.71 and 0.79). It is worth mentioning that the output from the calculations from these models is nitrogen oxides (NOx), which are later converted to NO2 based on empirical relationship in the models used in Gothenburg and Uppsala [8], while in Umeå the NO2 level was calculated directly by the model [14]. Although not used in this thesis, land use regression (LUR) is an alternative method of modelling air pollution data and is becoming more common in epidemiological studies of air pollution and health. This method attempts to explain the levels of a substance at a specific place, based on surrounding geographical variables such as land use and traffic [16-18].
Exposure assessment in long-term studies of air pollution and health Over the last two decades, the method for assessing exposure to vehicle exhaust in epidemiological long-term studies has shifted from ecological variables to more individual measures. Two of the most cited cohort studies on air pollution and health, the US Six Cities Study and the American Cancer Society (ACS) Study, based the exposure assessment on one or a few fixed measuring sites within each city/community, representing all participants within that area [19, 20]. Following these studies, others tried to increase the resolution in exposure data to reduce the misclassification of exposure. In a separate analysis, Jerrett et al used one of the cities included in the ACS Study, together with data from several measuring stations within the same area, showing that by reducing the exposure misclassification the effect estimate increased [21]. Since most measurements available for use in epidemiological research are done by environmental authorities, the monitoring sites are chosen with the perspective of evaluating the levels in relation to air quality limits. Consequently, actual measurements of specific pollutants are seldom available with high spatial resolution for large populations.
13

Since it is unknown which specific traffic pollutants are most related to adverse health effects, most epidemiological studies use indicators representing the whole exhaust mix for which exposure can be assessed specifically for different individuals. These indicators could be divided into geographical indicators and indicator substances assessed by different models. Geographical indicators describe exposure as a change in a geographical unit, or as the amount of traffic within a geographical area. Distance from the home to the nearest major road, an estimate of exposure to traffic pollution, is a commonly used geographical indicator in epidemiological studies [22, 23]. Corresponding measures are the amount of traffic flow or length of roads within different buffer zones surrounding the studied participant’s homes [24]. Although there are several potential substances that have been used to indicate traffic pollution, NO2 is used most frequently. Traffic is the dominant source of NO2 in urban areas, and previous studies have shown a high correlation between NO2 and other traffic-related substances [25]. Since levels of NO2 are largely dependent on the available amount of ozone, the correlation with traffic flow varies between different seasons and different places, where NOx is generally a more stable indicator [8]. The availability of measuring data for evaluation is larger for NO2 than for NOx, therefore, NO2 is more commonly used in epidemiological studies. As previously mentioned, NO2 and NOx can be reliably calculated with dispersion models. In a retrospective Swedish study of lung cancer and vehicle exhaust, dispersion modelling was used and described the exposure as the levels of NO2 [26]. Also, more recent studies have used dispersion modelling to look at respiratory effects among children and the relationship to traffic pollution using NOx and PM10 [27]. LUR is a combination of geographical information and air pollution measurements, and has proven to be very useful, since the results are presented as concentrations.
Asthma Asthma is considered a multi-factorial disease with different phenotypes, affecting an estimated 300 million people worldwide [28].
14
Since the pathogenesis of asthma is not fully understood most definitions of asthma are based on practical consequences. The Global Initiative for Asthma (GINA) has defined asthma as [29]
“a chronic inflammation disorder of the airways in which many cells and cellular elements play a role. The chronic inflammation is associated with airway hyperresponsiveness that leads to recurrent episodes of wheezing, breathlessness, chest tightness, and coughing, particularly at night or in the early morning. These episodes are usually associated with widespread, but variable, airflow obstruction within the lung that is often reversible either spontaneously or with treatment ”.
Clinical definitions In clinical work, asthma is often defined by the presence of asthmatic symptoms, i.e. wheeze, or shortness of breath together with objective measures of lung function [30]. The more general definition of asthma can be divided into different phenotypes, related to both the severity of the symptoms, trigger factors, and patterns of inflammation [30]. The two most widely discussed phenotypes of asthma are allergic and non-allergic asthma, which are differentiated by the presence or absence of proven allergy sensibilisation [31].
Operational definitions In epidemiological studies, asthma is most often defined based on questionnaires and less commonly by clinical investigations. The definitions may vary by aim and design, and are dependent on available data. During the 1990s, two large multicentre surveys, the European Respiratory Health Survey (ECRHS) [32] and the International Study of Asthma and Allergies in Childhood (ISAAC) [33], were conducted using standardized questionnaires.
The ECRHS study examined the variation in prevalence of asthma among adults in Europe [32]. The first stage of the ECRHS study (started in 1990) included a screening questionnaire from which symptomatic cases were defined as having a positive answer to any of the following three questions; 1) “Have you been woken by an attacks of shortness of breath at any time during the last 12 months?”; 2) “Have you had an attack of asthma in the last 12 months; and 3) “Are you currently taking any medicine (including inhalers, aerosols or tablets) for asthma?”. The ECRHS questionnaire was used to define current asthma as a positive answer to either “Have you had an attack of asthma in the last 12 months” or “Are you currently taking any medicine (including inhalers, aerosols or tablets) for
15
asthma?” [34]. The ISAAC study focused on the prevalence of asthma among children, and included amongst other questions “Have you ever had asthma” , which has been used in many studies all over the world.
The use of questionnaires has many practical and economical advantages, as well as weaknesses in relation to the clinical validity. Several studies of prevalence have attempted to validate respiratory questionnaires versus clinical investigations, or by evaluating response agreement through repetition of the same questionnaire [35, 36]. An Italian study showed that defining current asthma as a positive answer to either “Have you had an attack of asthma in the last 12 months” or “Are you currently taking any medicine (including inhalers, aerosols, or tablets) for asthma?” had a sensitivity and specificity of 37.1 and 99.7%, respectively, in relation to a clinical judgement based on interview data and results from physiological tests [34]. A Swedish validation study showed similar results for the question “Have you been diagnosed by a physician as having asthma?” [36]. Studies show a great variability in how different physicians classify the same asthma patients [37].
Although the above mentioned definitions of asthma are mostly used for describing prevalence, they are also used for defining the population at risk, and new cases of incident asthma in studies.
Rhinitis
Rhinitis and asthma often coexist, and the concept of “one airway, one disease” has been used to highlight the possibility that both diseases could be due to the same underlying inflammation [38].
There are several different definitions of rhinitis. The general definition presented by the ARIA-workshop (Allergic Rhinitis and its Impact on Asthma) is “an inflammation of the lining of the nose characterized by nasal symptoms including anterior or posterior rhinorrhoea, sneezing, nasal blockage and/or itching of the nose. These symptoms occur during two or more consecutive days for more than 1 hour on most days”[39].
Different definitions of rhinitis have been used in epidemiological studies, mostly by relating to specific symptoms such as “runny or stuffed
16

nose” and “attacks of sneezing without having a cold” [36], “nasal allergies including hay fever” [40, 41], or the diagnosis of rhinitis [42]. Allergic rhinitis is the most prevalent phenotype, and differentiates from non-allergic rhinitis by a positive test for atopy or allergy [43], but has also been defined by questions regarding allergy and hay fever. Typically, one-fourth of people with rhinitis have the non-allergic phenotype [44].
Prevalence of asthma and rhinitis
The prevalence of asthma and allergic rhinitis among Swedish adults was recently calculated based on a large population-based survey (GA2LEN) sent to a random sample of people in four Swedish cities. Among the approximately 25000 survey respondents, 7.1% reported asthma and 27% reported allergic rhinitis. These results are somewhat higher than the median values presented in the ECRHS study [45].
There is evidence showing an increased prevalence of asthma throughout the world during the last half of the 20th century [46-48]. Although the reasons for the increase are not fully understood, several potential hypotheses have been discussed. The hygiene hypothesis has been suggested as one possible explanation [49], as well as an increased awareness of the disease among the general population and healthcare professionals [50]. Increasing levels of environmental risk factors, including air pollution, have also been suggested as a cause for the increase. Since the 1990s, the tendency for the prevalence of asthma has stabilized in western countries, however, the trend is not all clear [51]. A large Italian study, based on the ECRHS questionnaire, showed that the prevalence of asthma attacks did not vary significantly between the beginning and end of the 1990s [52]. A combination of better guidelines for treatment and management of the severity of asthma have been suggested as explanation for the plateau, as well as improvements in some important environmental trigger factors [50].
Rhinitis is one of the most common chronic diseases among adults. The prevalence of rhinitis has, in accordance with asthma, increased during the last decades, which is expected, since both allergic and non-allergic rhinitis have proven to be strong risk factors for asthma [40]. Studies have shown that up to 80% of individuals with asthma also have rhinitis [53, 54].
17

Incidence of asthma and rhinitis Although there is great variability in results between different studies, the incidence rate of asthma among adults tended to increase between the 1950s and the 1990s [55]. However, results suggest that the incidence rate of asthma in Sweden has been stable over the last 10 years. The incidence rate for adults within the OLIN-study was 2.3 per 1000 person years [56]. These results are similar to the incidence levels shown in the RHINE study, 2.1 per 1000 person years, which includes several Nordic countries [57]. An increased awareness of asthma and asthmatic symptoms over time, resulting in more mild asthmatics being diagnosed, may partly explain the increased incidence seen up until the 1990s. The large diversity in incidence rates demonstrated between different studies could, to a large extent, be explained by differences in methodology, such as how to define the population at risk [55, 56]. The importance of environmental factors for the change in incidence of asthma is difficult to assess due to the large number of different factors and the difference in the occurrence within different study populations. There are few studies on the incidence of rhinitis among adults. A recent study from the ECRHS showed that the cumulative incidence of allergic rhinitis among adults, over approximately nine years, was 12% [41]. Risk factors for asthma and rhinitis In order to describe a casual relationship between a risk factor and a disease, the exposure has to precede the studied outcome. Therefore, incidence studies are necessary to study the casual relationship between an exposure and the development of asthma. Because the severity of asthma symptoms can vary extensively over time, diagnosed asthmatics can experience long periods without symptoms, which could impact how they answer a question regarding symptoms or diagnosis of asthma. Its been said that “The increase in asthma prevalence over the last 25 years is likely due to changes in our environment or lifestyle because changes in our genetic makeup would take more than several generations to occur” [58]. However, recent studies have suggested that genetics act as significant effect modifier in the relationship between allergic disease and
18
environmental exposures [59, 60]. The incidence of asthma changes with age, indicating an increase from childhood to adolescence, and then decreasing with increasing age [61]. There is a difference among sexes; men tend to have an increased risk for asthma during childhood, while women have an increased risk of developing asthma as adults [61]. The risk of developing rhinitis has also been reported to be higher among women than men [62]. Family history of asthma and rhinitis, as well as atopy and allergic disease, is strong predictors for developing these diseases [61, 63]. The effect of smoking is complicated, since some studies show that smoking is a risk factor for adult asthma [56], while others do not [64]. Another lifestyle-related risk factors related to asthma is obesity [58, 65]. Among lifestyle factors, the “hygiene hypothesis” should be mentioned. This hypothesis suggests that allergic disease is prevented by early infections and exposure to microbial substances. A number of findings support this hypothesis. One finding discusses the protecting effect of living amongst many siblings [49], which could result in more infections during childhood. Another finding suggests that growing up in a farming family may be protective against asthma and allergies, due to a higher exposure to endotoxins [66]. Indoor dampness and mould have also been associated with the prevalence of asthma and rhinitis among adults [67, 68]. Asthma and air pollution For many years, it has been accepted that air pollution worsens existing asthma in both children and adults. However, evidence that air pollution is a risk factor for developing asthma is scarcer. In the mid-1980s, a Utah steel mill was shut down for one year. The result was half the number of hospital admissions for respiratory symptoms, including asthma among children, as compared to when the steel mill was operational [69]. During the 1996 Olympics in Atlanta, Georgia, decreased air pollution levels, as a result of vehicle traffic regulation, were connected to a decrease in acute asthma care events among children [70]. A time-series study examining four European cities showed that the daily mean levels of NO2 were significantly related to emergency hospital admissions for asthma among both adults and children [71]. An increased prevalence of respiratory symptoms and lowered lung
19

function has been associated with different measures of traffic pollution, especially among children but also among adults [72-76]. The results for the prevalence of asthma among adults are more variable; some studies showed an increased prevalence of asthma related to air pollution [77], while others did not [75]. Air pollution as the cause for developing asthma and rhinitis has been much less investigated compared to the prevalence of asthmatic symptoms and hospital admissions. Studies show that the risk for developing asthma among children increases with increasing levels of traffic related air pollution [24]. Early results presented in the Adventist Health Air Pollution Study (ASHMOG) Cohort suggested that incident asthma among non-smoking adults is related to the levels of outdoor ozone and the levels of PM10 [78, 79]. Although some conflicting results exist, many studies show that traffic-related air pollution is a significant risk factor for asthmatic symptoms, and some studies suggest that vehicle exhaust is a risk factor for the development of asthma. The mechanisms behind air pollution as a risk factor for developing asthma and worsening asthmatic symptoms is not fully understood [80]. Possible pathways include: increased epithelial permeability, which allows allergens to penetrate further into the lungs, particles as carriers of other substances and increased oxidative stress [81]. Since inflammation is the basis in asthma and rhinitis, the potential of pollutants to cause inflammation and tissue damage resulting in further inflammation could be an important step in going from a temporal to a chronic inflammation [82]. Diesel exhaust has shown to initiate inflammatory reactions in the air ways among healthy adults, and to enhance production of IgE-antibodies which promotes an allergic response to allergens [83]. Furthermore, diesel exhaust particles can act synergistically with allergens, increasing the allergic response among people already sensitized [84, 85]. Exposure to high concentrations of NO2 have been related to an inflammatory response in the airways [86], and enhanced the inflammatory response to allergen exposure among mild asthmatics [87]. Annoyance and air pollution Annoyance due to noise and traffic is a common and important public
20

health issue. Annoyance related to traffic pollution has been studied both as a potential surrogate measure of exposure to air pollution, and also for assessing the actual relationship between pollution levels and degree of annoyance [88, 89]. A Swiss study showed that the individual measurements of NO2 outside the home explained approximately 13% of the variation in the annoyance score, while the explained variation was much higher if analysed at the group level [89]. In the same study, people reporting high annoyance as a result of outdoor air pollution ranged between 3 and 37%, with the highest percentage in the urban areas. This range is similar to reports of daily or almost daily annoyance as a result of vehicle exhaust in a Swedish study involving 55 cities [88].
21
Aims and methods Asthma and rhinitis are common respiratory diseases. Traffic pollution is known to exacerbate already existing symptoms of respiratory disease; however the impact of traffic pollution on the development of these diseases is still unknown. It is likely that the most common health effect resulting from traffic pollution is on subjective annoyance reactions, therefore, it is important to study and quantify these effects. Aim of the thesis The overall aim of this thesis was to study the relationship between vehicle exhaust levels at home and the prevalence of self-reported annoyance and asthmatic symptoms, and the incidence of asthma and rhinitis. These relationships were evaluated using different indicators of exposure with a high spatial resolution. Specific aims, subjects, and methods
Paper I Aim The aim of paper I was to study the relationship between the prevalence of self-reported annoyance and asthmatic symptoms, and the levels of vehicle exhaust outside the home, in three Swedish cities.
Methods Fifteen-hundred people, between 16 and 70 years of age, were randomly selected from each population register in Umeå, Uppsala, and Gothenburg. In an effort to increase the contrast of exposure, 600 of the 1500 people in each city were selected from postal code areas within the central parts of each city. A questionnaire was sent to all participants in November 2004. The questions concerned annoyance from both indoor and outdoor environmental factors, amount of traffic outside the home, current health status, activity patterns, and housing characteristics. Of the 4500 total people invited to participate in the study, 2766 answered, a response rate of 62%.
22

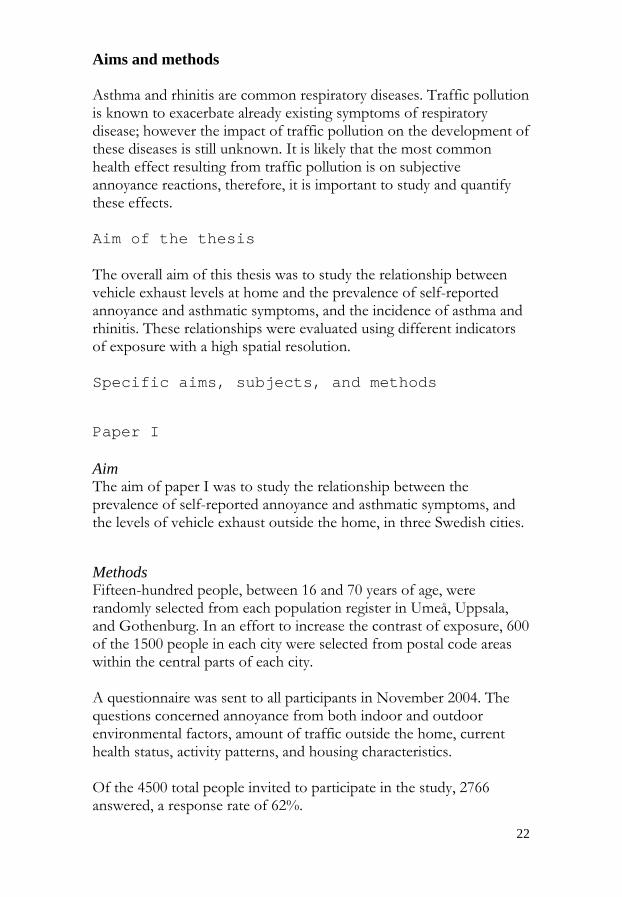
Annoyance was assessed using two questions; “How annoying have you found pollution from road traffic close to your home during the last month?” and “How often during winter do you find the air irritating?”. On the first question, each participant estimated their degree of annoyance on a scale from 1 (not annoyed at all) to 11 (extremely annoyed), which was later dichotomized into less annoyed (1-8) and very annoyed (9-11). On the second question, participants were asked to choose between the three alternative answers “daily or almost daily”, “sometimes”, or “seldom”. In the analysis, the variable was dichotomized by combining those answering “sometimes” and “seldom or never” into one category. The prevalence of asthmatic symptoms was estimated from the question “Have you had asthmatic symptoms during the last 12 months?” Each responsive participant was geo-referenced based on their home address, as the coordinates of the center point of the estate. Each participant’s exposure was described as the yearly and winter half-year mean level of nitrogen dioxide (NO2), based on meteorological dispersion modeling (described further in the background). The modelled levels were calculated in 50 metre grids covering the central parts of each city, which in combination with the geo-referenced addresses constituted the exposure assessment (Figure 1).
23
Figure 1. The results from combining the geo‐referenced population with the results from the dispersion model for Umeå in 50 metre squares. Red colours indicate higher levels of nitrogen dioxide (NO2), and blue indicates lower levels of NO2. The models in Gothenburg and Uppsala have been previously validated [15] , while the model in Umeå was validated against local measurements. As alternative indicators of exposure, the questions “how often do cars pass outside your kitchen window?” and “how often do heavy vehicles pass outside your kitchen window?” were used. The frequency was reported as “seldom/never”, “often”, or “constantly”. A modelled concentration could be ascribed to 2765 of the 2766 participants who answered the questionnaire. The relationship between the dichotomous outcome variables (annoyance and asthmatic symptoms) and vehicle exhaust were analyzed using multiple logistic regression. All analyses were adjusted for sex, age, smoking habits, diagnosed asthma, and city of residence. Separate effect estimates were also calculated for each city. The self-reported frequency of heavy and personal vehicles outside a home’s kitchen window was also analyzed in relation to annoyance and asthmatic symptoms. For the two annoyance questions, the results from the logistic regression model were also presented as curves showing the
24

probability of the outcome based on the used model. A 95%-confidence level was used to evaluate statistical significance.
Paper II Aim The aim of paper II was to study traffic-related air pollution as a risk factor for developing asthma among adults.
Methods Potential new cases of asthma were identified in Luleå, Sweden during the period of September 1995 to December 1999. Cases amongst individuals 20 to 60 years of age were identified in reports from primary health care facilities, private clinics, local and county hospitals and occupational physicians. These cases were reported in the OLIN study. Clinical examinations were made to verify if the reported cases fulfilled the pre-determined criteria for inclusion as a case in the study. To be included as a case, first onset of asthma had to be verified within the last 12 months without any previous symptoms, and bronchial variability had to be proven with an objective test. Furthermore, cases had to fulfill four of the five criteria: 1) attacks of shortness of breath; 2) wheezing or whistling in the chest; 3) no symptoms between the attacks or periods; 4) at least two provoking factors with the exception of a common cold or physical exertion; 5) at least two attacks or periods since onset symptoms. A referent from the population was selected and matched to each case by age and sex. The referents were excluded if they had a previous diagnosis of asthma, a history of asthma, or any previous use of asthma medication. In this case, another referent was selected. Measured levels of NO2 outside the home and the sum of traffic flow within 200 metres around the home were used as measures of exposure to vehicle exhaust. NO2 was measured with a diffusive sampler for one week outside each case’s home and their corresponding referent’s home. The measurements were made during the same week for each case-referent pair and conducted continuously as cases and referents were included in the study. All values were standardized to represent the level at the yearly average temperature based on measurements from the municipality’s urban background station.
25

Each case and referent was geo-referenced based on their home address, with the coordinates referring to the centre point of the estate. We established a 200 metre buffer zone around each centre point of the estate and the traffic flow (vehicles per 24 hours, weekdays) on all roads passing through the buffer zone were summarized. Road network and traffic flow information was available from the municipality and the Swedish Road Administration. For properties without a summarized traffic flow within the 200 meter radius, the traffic flow was set to 100 vehicles per 24 hours. The resolution of the road network for some streets in the city centre was high, resulting in some double counting of traffic flows. Therefore, no participant was assigned a traffic flow value above 30 000 vehicle per 24 hours. All participant’s homes were classified by a visiting inspector as either rural, small house area, apartment house area, or city centre. Conditional logistic regression was used to analyze the relationship between asthma and traffic-related air pollution. Traffic flow was dichotomized into high and low, with the limit for highly exposed classification set to the 25% highest values. NO2 was used as a continuous variable. Analysis was conducted for all participants, and for those living more than 2 years in their present home. Models were adjusted for family history of asthma, smoking, body mass index (BMI), rural residence, and positive skin-prick test.
Papers III and IV Aims The aim of paper III was to study the proportion of onset and incident cases of asthma among adults in relation to the levels of NO2 outside the home and the distance to the nearest major road. The aim of paper IV was to study the incidence of rhinitis and asthma in relation to the levels of PMexhaust outside the home, since rhinitis is a strong predictor for asthma. Methods Papers III and IV were based on the RHINE Cohort. The RHINE Cohort was established in 1990 within the European Community Respiratory Health Survey (ECRHS), and includes the five northern countries of Estonia, Denmark, Iceland, Norway, and Sweden. Each of the five countries is represented by one city with the exception of
26

Sweden where two cities and parts of one county were included (Gothenburg, Uppsala, and Västerbotten County). In papers III and IV, only participants from the Swedish population were considered. In Västerbotten County, the study population was restricted to those living in the municipality of Umeå. As part of the ECRHS study, a screening questionnaire was sent out in 1990 to a random sample of adults (at least 1500 males and 1500 females), born between 1945 and 1973. The questionnaire collected information regarding respiratory symptoms such as wheezing, use of asthma medication, and attacks of asthma. A sub-sample of respondents to the questionnaire were sent a follow-up questionnaire approximately nine years later [45]. In contrast to the ECRHS study, all participants who answered the first screening questionnaire in 1990 received the RHINE follow-up questionnaire. The population at risk was defined as having a negative answer to the questions: “Have you had an attack of asthma in the last 12 months?” and “Are you currently taking any medicine for asthma?” in the screening questionnaire, followed by at least one answer to those questions at follow-up together with an answer on either the question “Have you been diagnosed by a physician as having asthma?” or “Do you have or have you ever had asthma?”. In paper III, two definitions were used to include cases of onset and cases of incident asthma. Cases of onset asthma were defined as those within the population at risk answering positively to one of the following questions: “Have you had an attack of asthma during the last 12 months?” or “Are you currently taking any medicine for asthma?” together with a positive answer on either “Have you been diagnosed by a physician as having asthma?” or “Do you have or have you ever had asthma?”, at follow-up. Incident asthma was defined in the same way as onset asthma but with the restriction that cases reported an age of onset of asthmatic symptoms within the follow-up period. In paper IV, only the latter definition was used, when incidence was studied. The population at risk for rhinitis was defined as those answering “no” to the question: “Do you have any nasal allergies including hay fever?” in the 1990 screening questionnaire and answered the question on rhinitis (Have you ever had problems with runny or stuffed nose and attacks of sneezing without having a cold?) in the follow-up questionnaire. Included cases were those with a confirmative answer to the rhinitis question, and a reported year of onset symptoms within the follow-up period. The latter were defined as incident cases of rhinitis.
27

Each participant was geo-referenced based on their home address at the survey in 1990, as the coordinates of the center point of the estate. Table 1 shows the number of participants in different steps of the formation of the study population in papers III and IV. Table 1. The number of participants remaining after different steps (left to right) in the formation of the study cohorts in papers III and IV.
Initial population (n)
First quest*
Secondquest*
Population at risk†
Geo-references
1990
Modelled exposure
levels 1990║
Asthma
Total 10800 9316 7424 6832 4736 3824 Gothenburg 3600 2878 2191 2012 1902 1902
Uppsala 3600 3293 2661 2388 1804 979 Umeå 3600 3145 2572 2432 1030 943
Rhinitis
Total 10800 9316 7424 5476 3773 3051 Gothenburg 3600 2878 2191 1596 1505 1505
Uppsala 3600 3293 2661 1902 1426 777 Umeå 3600 3145 2572 1978 842 769
* Questionnaire. † Those fulfilling the criteria for population at risk for asthma and rhinitis, respectively. ║Levels of NO2 and PMexhaust..
Exposure was based on the dispersion calculations used in paper I. The dispersion models included the central parts of each city why people living on the outskirts of the city could not be assigned a calculated level of NO2. In paper IV, exposure was described as the levels of vehicle exhaust particles (PMexhaust). PMexhaust was calculated from the modelled levels of NOx using the ratio between the emission factors for NOx and PMexhaust. Since the relationship between NOx and PMexhaust is linear and traffic is the absolute major source of NOx in cities this estimation is possible. The ratio used was 0.0215 g PMexhaust per 1 g NOx. Since the relationship between NO2 and NOx is non-linear, with a lower ratio at high levels of NOx, PMexhaust is expected to better account for the levels close to the emission source than NO2.
28
As an alternative indicator of exposure, the distance from the home to the nearest major road was calculated and used in paper III. A major road was defined as having 8000 vehicles per 24 hours or more. In paper III, analysis was conducted using logistic regression; relative risks was presented as odds ratios (OR). Paper IV used Cox regression to account for time to event; relative risk were presented as hazard ratios (HR). All models were run with and without adjustments for potential confounders. The adjusted models included the variables: city, sex, body mass index (BMI), age, smoking history, and water damage or mould at any time during the last eight years. NO2 and PMexhaust were analyzed as both a continuous variables and categorized into tertiles. In paper III, participants living closer than 50 meters from a major road were compared with those living further away.
29

Main results The results from these four studies show that in the Swedish cities, there is a relationship between the levels of vehicle exhaust and the prevalence of asthmatic symptoms and the risk of developing asthma among adults. This was demonstrated using different indicators of vehicle exhaust exposure or traffic-related air pollution.
Paper I There was a significant relationship between levels of NO2 and people reporting “highly annoyed” by vehicle exhaust with an odds ratio (OR) per µg/m3 of 1.14 (95% CI=1.11-1.18), and reporting the air as “irritating”, OR= 1.09 (95% CI=1.05-1.13). There was also a significant relationship for asthmatic symptoms during the last 12 months, OR= 1.04 (95% CI=1.01-1.07). A stratified analysis showed no significant difference between the effects among asthmatics and non-asthmatics. Using self-reported frequency of heavy and light vehicle traffic outside the kitchen window as an exposure metric gave significant and high odds ratios for the annoyance questions. There was a significant effect for asthmatic symptoms when comparing constant flow of heavy vehicles with those reporting heavy vehicles “never” or “seldom”.
Paper II One-hundred ninety-nine cases and 196 referents could be ascribed a traffic flow around home, and of these 184 pairs had information on all co-variates used in the analysis. Of those cases and referents classified as rural living, approximately 90% received the default flow value of 100 vehicles per 24 hours. Five percent of those classified as city centre received the value of 100 vehicles per 24 hours. NO2 levels were measured outside the homes of 138 cases and 136 referents. The risk for developing asthma was increased, but not statistically significant, when comparing those classified as highly exposed to traffic in relation to those less exposed, OR= 1.5 (95% CI=0.9-1.1). When restricting the analysis to those participants residing more than 2 years in their present home the OR increased but remained non-significant OR= 2.4 (95% CI=0.9-6.2). This was also the result when using measured levels of NO2. When estimating the effect separately for those with and without a positive skin-prick test, the risk of
30

developing asthma with increasing NO2 levels was borderline significant for those with a positive skin-prick test.
Papers III and IV There was a significant risk increase for onset and incident asthma among adults with increased exposure to vehicle exhaust using NO2, PMexhaust, and proximity to the nearest major road as exposure metrics. The OR for onset and incident asthma was 1.46 (95% CI 1.07-1.99) and 1.54 (95% CI 1.00-2.36) per 10 µg/m3 increase in the NO2 level. For asthma incidence, the HR was 2.65 (95% CI 1.07-6.55) per 1 µg/m3 increase in the level of PMexhaust. Living less than 50 metres from a major road with at least 8000 vehicles per 24 hours also increased the odds of developing asthma, with a smaller effect on onset asthma OR=2.92 (95% CI 1.70-4.98) than on true incident asthma OR=3.88 (95% CI 1.93-7.82). As an additional analysis within this thesis, NO2 was grouped as a dichotomous variable in accordance to the people living less than 50 meters from a major road, with the approximately 6% highest values representing the highest exposure group. The results from a adjusted logistic regression model (same as used in paper III) of the relationship to onset asthma shows a larger effect estimate for proximity to road OR= 3.37 (95% CI 1.93-5.88) than for NO2, OR= 1.94 (95% CI 1.00-3.75). The incidence of rhinitis was not significantly related to PMexhaust. The HR for PMexhaust, comparing the third tertile with the first tertile was 1.03 (95% CI 0.81-1.32), and 1 µg/m3 increase in the levels of PMexhaust was associated with an HR of 1.00 (95% CI 0.69-1.45).
31

Discussion The results in perspective Several studies have shown similar findings to those presented in paper I, an increasing proportion of people “highly annoyed” with increasing levels of vehicle exhaust [90]. However, the prevalence of highly annoyed persons has been shown to vary by a factor 10 between different European cities. In paper I, a 10 µg/m3 increase in NO2 levels increased the odds of being highly annoyed 3.8 times (OR=3.8, 95% CI 2.83-5.01) nearly twice the effect presented in a Swiss study [89]. One probably explanation is differences between the study populations. Paper I included participants living within the central parts of cities, while other studies included people living in both rural and urban settings. The prevalence of people highly annoyed ranged from 6 to 14% amongst the three cities, indicating a quantitatively large proportion of people experiencing annoyance from vehicle exhaust. The prevalence of asthmatic symptoms was similar to results presented in a recent study conducted in southern Sweden, which showed a significant relationship between asthmatic symptoms and the levels of traffic-related exhaust [91]. The literature regarding traffic pollution as a risk factor for the prevalence of asthma and rhinitis among adults shows somewhat diverse results, with some studies reporting significant associations [23, 77, 91] while others do not [73, 75]. During the last 10 years, several cohort studies involving children have shown consistent results suggesting an increased risk of asthma associated with vehicle exhaust [22, 92, 93]. Similar results have been shown in a few studies on adults [78, 94]. Jaquemine et al studied incident cases of asthma within the selected sample of participants in the ECRHS-study in relation to NO2 [94]. The study included participants from 17 European cities, and incident asthma was defined using the question “Have you ever had asthma”. A regression model was used to calculate the levels of NO2 in 1 kilometre squares. The OR for developing asthma was 1.43 (95% CI 1.02-2.01) per 10 µg/m3 increase in NO2, and when restricting the analysis to those with an age of onset of asthmatic symptoms within the follow-up period, the OR was 1.72 (95% CI 0.99-3.00). These results are strikingly similar to those presented in paper III, where the OR was 1.46 (95% CI 1.07-1.99) for onset asthma and 1.54 (95% CI 1.00-2.36) for incident asthma per 10 µg/m3 increase in the NO2 level. Though not significant, the results in paper II support those presented
32

in paper III by showing an increased risk of asthma among those living close to high traffic flows. To our knowledge, there are no previous studies on the association between vehicle exhaust and the incidence of rhinitis among adults. In paper IV, strong associations were shown for asthma incidence and the levels of PMexhaust, while no significant associations were observed for rhinitis. Since rhinitis is a risk factor for asthma, and there are some prevalence studies suggesting traffic-related air pollution is a risk factor for rhinitis, the null-findings for rhinitis do not support such associations. However, since rhinitis is a common disease with several possible definitions, more studies are needed before traffic pollution can be dismissed as a risk factor for the development of rhinitis. The papers in this thesis report on associations between traffic-related air pollution at home and adverse effects in adults, where induction of asthma is the most serious effect. When this work started there was no clear support for a relationship between traffic-related air pollution and asthma incidence in adults. The findings on traffic pollution at home and asthma incidence are the most important results presented here. The results in papers III and IV are also supported by the associations in the incident case-referent study (paper II) and the association with prevalence of asthma symptoms (paper I). Given these results, it is important to discuss the validity of the outcomes and exposure assessment.
Exposures assessment Earlier large cohort studies of air pollution and health have shown that accounting for intra-urban variability in exposure gradients for ecological and individual exposure metrics increases the effect estimates [21]. It is known that the levels of road dust (coarse particulates) and ultrafine particulates, and many gases decrease relatively quickly with distance from the source depending on atmospheric processes and dispersion, resulting in large within-city gradients. The approach in this thesis has been to use home outdoor levels of traffic pollution as the exposure. One type of random error (independent of disease status) connected to exposure assessment in epidemiologic studies is the error from between measurement variability, which exists in paper II, where the
33
long-term exposure of NO2 is estimated from a weekly average. This type of error typically induces bias on the risk estimate and tends to attenuate any association [95]. Another type of error arises when all individuals belonging to the same group receive the same estimated average of exposure. This type of error tends to reduce the precision in the effect estimates given the misclassification is random [95]. Exposure assessments often involve both types of error.
Dispersion modelling In papers I, III and IV, the levels of NO2 (paper I and III) and PMexhaust (paper IV) were calculated using meteorological dispersion models. Dispersion models may give more or less valid concentration gradients for a city, especially related to the input data, traffic flows, and emission factors. Such errors would unlikely be related to the disease outcome, which accounts for why the result would be an attenuation of the effect estimates. The models used showed good spatial agreement with actual measurements ranging from r2 =0.68 in Umeå to 0.79 in Gothenburg. The levels of NO2 and PMexhaust were calculated as background levels not taking into account the effects of street canyons. This likely leads to an underestimation of the outdoor levels at home for those participants living in such environments. This error is not related to the outcome, but could be due to an underestimated range in exposure levels leading to an overestimation of the effect estimate per unit change in concentration. The impact of this underestimation of levels in street canyons has not been evaluated, but is expected to be small, since relatively few people have their homes in such environments. The dispersion models had a 50-metre resolution, where each square was matched with the geo-reference coordinates for every participant. High spatial resolution increases the validity of the exposure estimate for the levels outside each home, but at the same time it becomes less valid for the larger area surrounding the home. For indicators or substances less correlated to the primary emissions the gain in high spatial resolution is lower than for more specific pollutants, due to its formation and properties leading to more large-scale variations. Since we do not know the causal agent and how it relates to the spatial variation of NO2, it is difficult to decide which resolution would have been most valid, and consequently it was difficult to evaluate the resolution used within papers I, III and IV in this thesis.
34

In paper IV, PMexhaust was used to better describe the primary emissions but also for presenting effect estimates based on that specific fraction of particles. Since modelled level of PMexhaust represent primary emissions, it better describes the concentrations of all primary exhaust close to the street in comparison to NO2, which is partly a secondary pollutant. In comparison to the relationship between PMexhaust and NOx, the relationship between NO2 and NOx is increasingly non-linear with higher levels of NOx, explaining why using NO2 could result in an underestimation of the levels close to the street where the levels of NOx are high [8]. The advantage of using modelled levels of PMexhaust as a measure of primary pollutants in comparison to NO2, is dependent on the levels of exposure within the study population. Although indicators representing the primary emissions should be recommended, the possibilities of validating the models must be considered. Depending on the vehicle fleet and the traffic situation, the mix of different size fractions within the PMexhaust mass differs between different locations, and also changes with distance from the road [96, 97]. It is difficult to account for this in the models, and is a limitation when modelling PMexhaust. The validity of any exposure assessment using geo-referenced information is also dependent on the precision of the geo-referencing. In all papers the geo-referencing was based on the centre point of the estate, which depending on size, could be misleading with regards to the actual address. Since most of the participants lived within urban areas, this misclassification is assumed to be small and random. A recent restructuring of the Swedish national registries will make it possible to get even more precise information.
Geographical exposure metrics Distance to the nearest major road was used as an alternative measure of exposure in paper III, and the summarized traffic flow within a radius around the home was used in paper II. A recent German study showed a clear dose-response pattern between distance from the home to the nearest major road and the prevalence of respiratory symptoms among children [93]. In paper III, participants living less than 50 metres from a major road were categorized as highly exposed; refering to the rapid decline of primary exhaust with increasing distance from the road. This
35

definition has been previously used and showed that children living within 50 or 75 metres from a high traffic road have a significantly increased risk for developing asthma [93, 98]. In paper III, a major road was defined as a minimum of 8000 vehicles per 24 hours or more. The selection of the cut off value was made somewhat arbitrarily. Previous studies have demonstrated that the amount of heavy traffic is more strongly correlated to the outdoor levels of PM2.5 and soot than the amount of personal cars [99]. Additionally, there are studies suggesting that living close to roads with high numbers of truck traffic has greater effects on lung function than living close to roads with high numbers of cars [76]. Since traffic volumes are highly variable, both in volume and composition throughout the world, it is difficult to develop comparable categories based on the definition of a major road. In future studies using this type of distance metric, differentiating between the total number of cars and the number of heavy vehicles would increase the comparability and add to the discussion regarding differences in health effects related to different vehicles. In paper II, all roads within 200 metres around each participant’s home were summarized independent of traffic flow. If the high traffic roads are important, this approach could reduce the differences between those living close to one major road in comparison to those living close to several minor roads, consequently reducing the possibility of finding any association. Since relatively few roads had measured values of traffic flow prior to writing paper II, roads measured were likely medium- or high-traffic, therefore the effect is assumed to be small. This effect is, of course, also dependent on the size of the selected radius. The summarized traffic flow on high traffic roads within a radius, and distance to a major road has been used simultaneously in recent studies, with varying differences in results in relation to the health outcome [23, 100].
Modelled pollution levels vs. distance to major road Data from paper III allowed for comparison between two exposure metrics, distance to the road (less than 50 metres versus 50 metres or more) and modelled levels of NO2. The results from this additional analysis, were presented in the results section of papers III and IV, and showed a larger effect estimate for proximity to road OR= 3.37
36
(95% CI 1.93-5.88) than for NO2, OR= 1.94 (95% CI 1.00-3.75), if the NO2 levels were grouped corresponding to the percentage of people living less than 50 metres from a major road. Since NO2 is partly a secondary pollutant, NO2 is less spatially correlated with traffic flows than actual primary exhaust emissions. Other primary pollutants as different fractions of exhaust particles are more spatially correlated with traffic flows, and show stronger gradients within an urban area. If such components are causal, proximity indicators and primary components, if reliably measured, would result in stronger associations with asthma than NO2. From a Nordic perspective the potential effect of the coarse particle fraction is also worth mentioning, since it totally dominates the levels of PM10 especially during late spring. The spatial correlation between road dust and vehicle exhaust components is high. Distance metrics have an advantage over dispersion modelling due to their simplicity. Distance metrics assume that proximity indicates a higher exposure to traffic pollution without choosing a specific substance or indicator. However, the distance metrics do not take into account meteorological aspects and do not study specific substances.
Diffusive NO2 measurements Diffusive samplers were used to measure NO2 levels outside the home of cases and referents in paper II. Diffusive samplers have been used previously used in epidemiological studies to assess stationary exposure levels [89, 90]. The advantages of diffusive sampler are the relatively low costs and easy handling, making it a useful tool in population studies. However, a lot of measurements must be taken to obtain representative values for longer time periods. In paper II, each case and corresponding referent were represented by a weekly measurement, which is a weak estimate of the yearly average level of NO2 outside the home. This uncertainty may also account for the weak association of NO2 seen to asthma in paper II, in relation to that seen in paper III.
Levels outside home as an indicator of exposure The exposure metrics used in this thesis are the levels of vehicle exhaust outside the home. However, since a person’s total exposure to vehicle exhaust includes time spent in many different environments, the levels outside the home represent a certain degree of
37

misclassification of the total exposure to vehicle exhaust. Other sources and modifiers of traffic pollution exposure may, if random, dilute the observed associations or act as confounders when associated with levels outside the home. Studies have shown that the residential levels of traffic pollutants are important for the personal measured levels. A Dutch study showed that children residing close to high-flow traffic areas had significantly higher personal mean levels of NO2 compared to those living further away [101]. Similar tendencies have also been shown for adults where residential outdoor concentrations of PM2.5, BS and NO2 significantly contributed to personal measured levels [102]. Significant correlation (rSperaman= 0.6) between the residential outdoor and personal levels of PM2.5 and BS2.5 were shown in a study from Gothenburg [103]. For NO2 the indoor- and outdoor levels measured in two Swedish cities ranged between 0.4 and 0.8 with the highest coefficient in the suburban area [104]. Since most Swedish homes lack major indoor sources of combustion pollutants, the outdoor levels contribute to most of the indoor levels, and the variations shown in the ratios between indoor- and outdoor levels could be explained by housing characteristics. Personal measurements of relevant source-specific compounds would improve the exposure assessment. However, such measurements over long periods (or repeated occasions) would be too expensive to obtain in large cohort studies. More detailed information on time activities and estimated levels at different environments, such as the work place, would be more realistic improvements.
Relevant time period of exposure The relevant time period of exposure for developing adult asthma and rhinitis due to vehicle exhaust is unclear, which further adds to the exposure misclassification. Short-term exposure has been associated with elevated asthmatic symptoms; however the cumulative exposure over several years is likely to be more important for the development of asthma. In paper II, separate analysis was conducted for those participants living more than 2 years at their current address, showing a stronger effect estimate in comparison to using all participants. However, this pattern was not demonstrated in a recent German study [75]. In papers I, III, and IV, this restriction was not made, since questions regarding years at the present address were not addressed. The complexity of asthma with genetics, likely working as an effect
38

modifier for the risk-related to vehicle exhaust, suggests a large individual sensitivity to the disease most likely resulting in different individuals being affected at different critical time periods. Further evaluation is needed and may have added substantially to the results in papers I, III, and IV. Since pollution levels usually change slowly, studies of interventions or the possibility to study two comparable cohorts with different levels of exposure would be helpful.
Relevance of used exposure metrics If the main purpose of a study is to analyze traffic pollution as a risk factor for respiratory outcomes, distance to the nearest major road is recommended. The results within this thesis, show higher relative risks using distance to the nearest major road in comparison to modelled levels of NO2, and also relate to previous studies, which show that living close to a high-traffic road is a significant risk factor for respiratory disease. The drawback associated with not accounting for meteorological variables, seems to be compensated for by the more general description of traffic pollution. If the purpose is also to identify the most important components behind the health effects, distance to the nearest major road is less useful. The risks associated with living close to a high-traffic flow indicate that some short-lived pollutants are important, or perhaps the course fraction of particles. More studies are needed to identify what pollutants are causing the adverse health effects. This is important, not only for the work of regulating specific substances, but also for the development of vehicles. Air quality limits also make more sense if such important components are the ones regulated. For example in Swedish cities, the levels of NO2 and NO, or both, are not likely to play a major role in the association with asthma or other health effects. However, until we know more fully understand the causal components, it may be useful to have limit values for NO2, or better, NOx as indicators of traffic-related pollutants. From a practical point of view, substances regulated by air quality limits are used in different health impact assessments, preferably presented by dispersion models. Consequently, established dose-response relationships are needed relating health outcomes to regulated air pollutants, if the consequences are to be presented as changes also in health outcomes and not only as changes in pollution levels.
39

Outcomes
Asthma The aim of these studies was not to draw conclusions about the absolute prevalence or incidence rates of asthma in these populations, but rather to study the relationship to levels of vehicle exhaust at home. The definitions of asthma used in papers III and IV were partly based on a combination of questions previously evaluated in a prevalence study, showing a relatively low-sensitivity and high-specificity [34]. In studies of exposure-response relationships, a high-specificity is preferable in relation to sensitivity to avoid false-positive subjects, resulting in misclassification and attenuation of the associations [105]. This approach also demands a relatively large study population since a low sensitivity results in a smaller fraction of identified cases. In paper III, two definitions of new asthma cases (onset and incident) were used. The difference between the two types of new cases was that incident cases had to have a reported age of first onset of asthmatic symptoms within the follow-up period. By defining participants with a possible first onset of asthma before the first survey, but without symptoms at baseline as cases, both true incidence in relation to vehicle exhaust and the onset of asthmatic symptoms are studied. From a public health viewpoint, this may be as important as studying true incidence by itself, depending on the severity of the symptoms. Also; at inclusion, onset cases reported no attacks or use of asthma medication during the last 12 months, which indicates a very mild ongoing asthma, if any. The effect estimate increased when studying incident cases in comparison to onset cases, a tendency also demonstrated in the ECRHS study [94]. This increase may be related to less exposure misclassification among the incident cases since some onset cases developed asthma before participating in the first survey. In paper II, new cases of asthma were identified and clinically investigated, which is the reason a high specificity was expected. In relation to the definition of asthma used in papers III and IV, this definition is seen as more valid since both questionnaire data and physiological tests were combined.
40
Rhinitis In paper IV, incident rhinitis was defined as a negative answer to the question “Do you have any nasal allergies including hay fever” at baseline, followed by a affirmative answer to the question ”Have you ever had blocked nose, nasal congestion and/or attacks of sneezing apart from periods of cold” together with a reported year of first onset within the follow-up period. Since the screening questionnaire did not include the latter question, the question regarding hay fever was used to exclude those with potential rhinitis at baseline. This question has been used in part to assess allergic rhinitis [106]. Almost half of the population at risk for rhinitis answered affirmatively to the rhinitis question at follow-up, which could be explained by the general formulation of the question. However, since excluding those reporting nasal allergies and hay fever at baseline, together with a year of first onset within the follow-up period, the number of false positive cases is assumed to be small. However, misclassification with regards to the outcome cannot be dismissed as a reason for the null-findings. Previous studies show that 75% of those defined as having rhinitis have allergic rhinitis [106]. However, only 30% of those defined as incident cases of rhinitis in paper IV, reported hay fever at follow-up. Information regarding atopy, diagnosed by skin prick test, was available for a sub-sample of the population in papers III and IV, therefore, no reliable distinction between allergic and non-allergic rhinitis could be done. Literature is unclear about whether allergic rhinitis is more or less related to traffic pollution than non-allergic rhinitis. Future studies differentiating between allergic and non-allergic rhinitis and asthma in relation to vehicle exhaust would be interesting, since previous studies have suggested a modifying effect of atopy on the association between vehicle exhaust and asthma [94, 107]. Although papers III and IV were based on a prospective cohort, the definitions of incident asthma and rhinitis were partly retrospective, due to the use of reported age of onset at follow-up. There is always a risk of reporting error and bias when using retrospective data. However, it has been shown that people quite accurately can recall the year of onset asthma, why the impact of this error is assumed to be small [108].
41

Annoyance Paper I discusses the less specific questions of asthmatic symptoms and degree of annoyance due to vehicle exhaust. The results show that the prevalence of being highly annoyed due to vehicle exhaust can vary substantially, both between and within countries. This variability in results suggests that cultural and personal differences are important to consider when studying annoyance. In paper I, annoyance to vehicle exhaust was estimated and later dichotomized into two categories: less- and highly annoyed. Although grouping the question results in a loss of information, the effect estimate becomes easier to interpret. The prevalence of asthmatic symptoms was high in comparison with more specific asthma questions, which relates to the wider formulation of the question.
Analysis Although the purpose of taking random samples from the population is to draw conclusions from the sample applicable to the whole population, different types of systematical errors may distort the possibilities of extrapolation.
Systematic errors Bias occurs when the relationship between outcome and exposure is different among those included compared to those excluded in a study [109]. In papers I, III, and IV, the study subjects were randomly selected from the population registry according to specific age-groups and areas and therefore no initial selection bias was expected. The response rate was 62% in paper I, which corresponds to similar studies conducted previously. However a certain selection cannot be discarded. People that feel annoyed by vehicle exhausts may be over-represented in the study due to a greater willingness to participate in comparison to those who are less annoyed. As a result, the estimated prevalence may be too high, however, if the difference between annoyed and not annoyed is the same, regardless of air quality, this will not bias the association with NO2. In papers III and IV, 86% answered the first questionnaire and of these respondents, 80% answered the follow-up questionnaire. If there is a systematic pattern whereby those developing asthma within the follow-up and lived close to traffic answered more frequently than
42
those asthmatics living in lower exposure areas, there would be a risk of overestimating the effects. However, since all subjects at risk were motivated to answer the first questionnaire without having asthma or rhinitis, non-response among incident cases at the follow-up should not be a serious problem. In papers III and IV, a large proportion of the initial population at risk was lost in the process of geo-referencing and matching to the dispersion model (Table 1). In the initial study, parts of Västerbotten County were included to represent the northern parts of Sweden, while in papers III and IV, only residents of Umeå were included. This explains the majority of people lost, together with the fraction of people lost due to address information and those living beyond the dispersion model coverage. Despite the large number of people excluded in this way, no systematic selection was assumed with regard to the outcome. In paper II, potential cases were found based on reports from primary health care facilities, private clinics, hospitals, and occupational health physicians. Information regarding the number of cases was dependent upon the willingness of health care professionals to report patients (potential cases) to the project. This may account for some bias among the cases in relation to the randomly selected referents. This selection bias has not been further evaluated within the thesis. Each case received a referent according to age and sex. There was a high risk for bias in paper I when studying the relationship between self-assessed exposure and self-assessed outcomes, since high annoyance to vehicle exhaust or having asthmatic symptoms could lead to an over-estimation of the frequency of traffic outside the home. This risk is decreased when using an objective measure of exposure. Response bias related to pollution levels is not a serious problem within the cohort studies (papers III and IV). In the case-referent study (paper II), the cases were not aware of the study when they contacted their doctor for respiratory problems, therefore the risk of response bias is considered small. Although still out-numbered, the concordant results in the cohort studies regarding traffic pollution and asthma, in comparison to the prevalence studies, may be a matter of design, but also a matter of people adjusting their lives due to their disease by moving from high traffic areas. In cohort studies, this bias is reduced by including people without asthma in the population at risk. However, studies have
43

shown that mild asthmatics tend to underreport their symptoms leading to bias if they are classified as cases at follow-up. This discussion could also be held against the definition of onset asthma used in paper III. In paper II, cases were included when previously identified as potential asthmatics, but excluded if their symptoms started more than 12 months ago, helping to reduce such a bias.
Confounding Confounding was accounted for by including a predetermined set of variables in the regression models. This approach was chosen due to the amount of available variables, but also to make the analysis within each paper more similar. The selection of variables was based on previous knowledge of important risk factors for asthma and rhinitis, where some also could be suspected to be correlated with vehicle exhaust. The variables available differed between the different studies. Sex, age and smoking were adjusted for in all papers, while information on body mass index (BMI) was not available for paper I. Information regarding smoking was not collected in the baseline screening questionnaire (papers III and IV), but was included in the follow-up questionnaire, leading to a risk of recall bias especially among the cases. Socio-economic status (SES) has been previously suggested as an important factor. This information was available for a fraction of the population in papers III and IV, which accounts for the exclusion of SES in the final models. In the study cities, we mostly find high levels of traffic pollution in the city centres where flats are usually attractive and expensive. This is an important factor to consider in future studies. In paper II, asthma heredity was included, while this information was missing in papers III and IV. Heredity is a strong predictor for asthma, and a variable for which a potential confounding effect cannot be ruled out. In this case the most likely bias is that families with asthma avoid living in areas with highly polluted streets. In paper II, the final model was adjusted for atopy based on skin prick test (SPT), while the analysis in papers III and IV did not adjust for atopy. In papers III and IV, SPT was available for a selected fraction of participants, therefore, self-reported hay fever was used as a proxy when studying effect modification. A sub-group analysis showed that only 60% of those reporting hay fever had a positive SPT, therefore calling into question the reliability of hay fever as a measure of atopy. Furthermore, recent studies have suggested vehicle exhaust as a risk
44
factor for allergic disease, which explains why adjusting the analysis of asthma and vehicle exhaust for atopy, could result in over adjustment of the models. This more conservative approach was not used in paper II, however, removing SPT from the main model resulted in only a marginal impact on the effect estimate. Adjusting for confounding resulted in no large changes in the effect estimates when compared to the un-adjusted and adjusted results in papers I, III, and IV. In papers III and IV, results for both the crude and fully adjusted models are presented, while in papers I and II the results from the adjusted models are given. In paper II, adjusting for confounding strengthened the estimates when restricting the population to those participants living more than 2 years at the same address, while in the whole population this effect was marginal.
Future research There is enough past and present research on the adverse health impacts of traffic pollution to warrant society’s active reduction in exposure. Causal agents may not be fully understood, however, there is no doubt that traffic is a major contributor to emissions affecting people living in urban areas. Studies of the various health effects related to distance to nearest major road show effects on both less severe and severe health-related outcomes. Air quality limits are useful tools in improving air quality, however, they can also result in actions without a larger perspective on population and exposure. The public health perspective needs to be further accounted for in the work related to the air quality limits. Searching for the substance in traffic pollution most related to adverse health effects, is important for more detailed prevention strategies. Research in this area has begun and will continue to focus on describing primary exhaust close to roads in order to find the missing link between general traffic indicators as NO2 and living close to major roads. Traffic-emitted particles are often suggested as critical substances, but larger wear particles from roadways and vehicles should not be dismissed, since results from toxicological studies have shown the coarse fraction of ambient particles may be more toxic than fine and ultra-fine particles [82]. The question of long-term effects of road dust particles is also very interesting and remains a challenging
45

issue for future epidemiological research, especially in the northern parts of Europe. The exposure assessment in epidemiological studies of traffic pollution and health could be improved by accounting for outdoor levels of traffic pollution in environments others than outside the home. Using geographical information systems (GIS), in combination with dispersion models or geographical metrics, makes this possible for large populations, given the necessary data is available. The use of registries and the estimation of exposure for several addresses would also improve the exposure estimate, especially in prevalence studies. These methods would also be interesting for cohort-studies of incident respiratory diseases among adults. More studies are needed to confirm and understand the impact of air pollution on adult asthma and rhinitis. Although there are obvious reasons for focusing on children, later-onset asthma impacts the quality of life and is costly for society since those developing the disease may be affected for many years. Recent studies have focused on Chronic Obstructive Pulmonary Disease (COPD), and Swedish findings have shown a significant correlations between traffic pollution and the prevalence of COPD [91]. Additional well-designed cohort studies for examining causality are needed together with follow-ups of already existing cohorts.
46
Conclusions The following conclusions were made based on the studies within this thesis:
- Increasing levels of vehicle exhaust outside the home increases the proportion of people reporting to be highly annoyed by vehicle exhaust. This was demonstrated with both objective and subjective exposure metrics.
- The prevalence of asthmatic symptoms is related to the levels of vehicle exhaust outside the home.
- The risk of developing asthma among adults increases with higher levels of vehicle exhaust outside the home.
- The increased risk of developing asthma was shown using different exposure metrics, with a tendency for stronger associations for the geographical metric, indicating that there may be specific short-lived traffic-related components involved.
- The development of rhinitis was not associated with high levels of vehicle exhaust outside the home.
47

Acknowledgements I would like to thank all of my friends and colleges that have supported and encouraged me throughout my work on this thesis. However, I would like to express my particularly sincere gratitude to: Bertil Forsberg, my main supervisor and colleague, for introducing and guiding me through this field of epidemiological research with never-ending enthusiasm, and a constant flow of new ideas. As an introduction you convinced me to spend one year cleaning more than 200 different bedrooms all over Västerbotten County. Although I had my doubts, this was a great experience, not only for meeting interesting people and practicing social skills, but also to get an understanding for the work behind collecting research information. Christer Johansson, my co-supervisor, for always giving fast and thoughtful answers to, more or less, clever questions regarding air pollution and dispersion modelling. Ingvar Bergdahl and Bengt Järvholm, for reading and constructively commenting on the information and structure of this thesis. All co-authors: Christer Janson, Kjell Torén, Eva Rönmark, Bo Lundbäck, Lennarth Nyström and Christer Andersson, for your support and assistance with the results. All those involved in the OLIN and RHINE studies, for collecting and supplying the data needed for papers II, III and IV. Bosse Segerstedt, for introducing me to SPSS, and giving valuable advice in statistical, hifi-, and wifi-, related issues. Kadri Meister, for being a good friend and always game for a friendly debate. Friskluftgruppen, a constantly changing group of interesting people with a lot of humor, both at the coffee table and on scientific journeys to foreign countries. My colleagues and friends at the Division of Occupational and Environmental Medicine at Umeå University, Occupational and Environmental Medicine Clinic at the University Hospital of Umeå and the Stress Clinic, for interesting discussions and many laughs. You
48

are the base for a great place to work. Anita and Henry, for all the free rides (I will pay you back!) and encouraging chats, from Täfteå to reality. My mother and sister, for always being there, supporting and encouraging me, no matter what. My wonderful wife Karin, and our two daughters, Astrid and Elsa, for reminding me what is really important in life.
49

References 1. Bell ML, Davis DL. Reassessment of the lethal London fog of
1952: novel indicators of acute and chronic consequences of acute exposure to air pollution. Environ Health Perspect 2001; 109 Suppl 3: 389-394.
2. Daly C. Air pollution and causes of death. Br J Prev Soc Med 1959; 13(1): 14-27.
3. World Health Organization (WHO). Air Quality Guidelines, Global Update 2005. WHO Regional Office for Europe, Copenhagen, Denmark, 2005.
4. Forsberg B, Hansson HC, Johansson C, Areskoug H, Persson K, Jarvholm B. Comparative health impact assessment of local and regional particulate air pollutants in Scandinavia. Ambio 2005; 34(1): 11-19.
5. Jerrett M. Does traffic-related air pollution contribute to respiratory disease formation in children? Eur Respir J 2007; 29(5): 825-826.
6. Holman C. Sources of air pollution. In: Holgate S, Samet J, Koren H, Maynard R, eds. Air pollution and health. Academic Press, London, 1999; pp. 115-148.
7. Morawska L, Ristovski Z, Jayaratne E, Keogh D, Ling X. Ambient nano and ultrafine particles from motor vehicle emissions: Characteristics, ambient processing and implications on human exposure. Atmos Environ 2008; 42: 8113-8138.
8. Johansson C, Forsberg B. Kvävedioxid och ozon i tätortsluften. Halternas samspel samt konsekvenser för hälsan. Naturvårdsverkets Rapport 5519. Naturvårdsverket, Stockholm; 2005.
9. Carslaw D. Evidence of an increasing NO2/NOx emission ratio from road traffic emissions. . Atmos Environ 2005; 39: 4793-4802.
10. Persson K, Sjöberg K. Luftkvaliteten i Sverige 2007 och vintern 2007/2008. Svenska Miljöinstitutet IVL, Göteborg; 2008.
11. Hitchins J, Morawska L, Wolff R, Gilbert D. Concentrations of submicrometre particles from vehicle emissions near a major road. Atmos Environ 2000; 34: 51-59.
12. Janssen N, Dimphe F, van Mansom M, van Der Jagt K, Harssema H, Hoek G. Mass concentration and elemental composition of airborn particulate matter at street and background locations. Atmos Environ 1997; 31(8): 1185-1193.
50
13. Sveriges meteorologiska och hydrologiska institut SMHI, Svenska miljöinstitutet IVL. Handbok för vägtrafikens luftföroreningar. Vägverkets Rapport 2001:128. Vägverket och Naturvårdsverket; Borlänge; 2001.
14. Hurley PJ, Physick W, Luhar A. TAPM: a practical approach to prognostic meteorological and air pollution modelling. Environ Model Software 2005; 20: 737-752.
15. Johansson C, Sällsten G, Bouma H, Johannesson S, Gustafsson S, Eneroth K, Norman M, Kruså M, Tinnerberg H, Bellander T. Exposure comparison between measurements and calculations based on dispersion modelling: Swedish National Air Pollution and Health Effects Program (SNAP); 2006.www8.umu.se/phmed/envmed/rapporter/Expose_final_report_march_2006_2.pdf Date created: April 07, 2009. Date last accessed: April, 7: 2009.
16. Jerrett M, Arain A, Kanaroglou P, Beckerman B, Potoglou D, Sahsuvaroglu T, Morrison J, Giovis C. A review and evaluation of intraurban air pollution exposure models. J Expo Anal Environ Epidemiol 2005; 15(2): 185-204.
17. Briggs D, Collins S, Elliott P, Fischer P, Kingham S, Lebret E, Pryl K, van Reeuwijk H, Smallbone K, van Der Veen A. Mapping urban air pollution using GIS: a regression based approach. Int J Geogr Inf Sci 1997; 11(4): 699-718.
18. Ryan PH, LeMasters GK. A review of land-use regression models for characterizing intraurban air pollution exposure. Inhal Toxicol 2007; 19 Suppl 1: 127-133.
19. Dockery DW, Pope CA III, Xu X, Spengler JD, Ware JH, Fay ME, Ferris BG Jr, FE. S. An association between air pollution and mortality in six U.S. cities. N Engl J Med 1993; 329: 1753-1759.
20. Pope CA, 3rd, Thun MJ, Namboodiri MM, Dockery DW, Evans JS, Speizer FE, Heath CW, Jr. Particulate air pollution as a predictor of mortality in a prospective study of U.S. adults. Am J Respir Crit Care Med 1995; 151(3 Pt 1): 669-674.
21. Jerrett M, Burnett RT, Ma R, Pope CA, 3rd, Krewski D, Newbold KB, Thurston G, Shi Y, Finkelstein N, Calle EE, Thun MJ. Spatial analysis of air pollution and mortality in Los Angeles. Epidemiology 2005; 16(6): 727-736.
22. Gauderman WJ, Avol E, Lurmann F, Kuenzli N, Gilliland F, Peters J, McConnell R. Childhood asthma and exposure to traffic and nitrogen dioxide. Epidemiology 2005; 16(6): 737-743.
23. Cesaroni G, Badaloni C, Porta D, Forastiere F, Perucci CA. Comparison between various indices of exposure to traffic-
51

related air pollution and their impact on respiratory health in adults. Occup Environ Med 2008; 65(10): 683-690.
24. Zmirou D, Gauvin S, Pin I, Momas I, Sahraoui F, Just J, Le Moullec Y, Bremont F, Cassadou S, Reungoat P, Albertini M, Lauvergne N, Chiron M, Labbe A. Traffic related air pollution and incidence of childhood asthma: results of the Vesta case-control study. J Epidemiol Community Health 2004; 58(1): 18-23.
25. Modig L, Sunesson AL, Levin JO, Sundgren M, Hagenbjork-Gustafsson A, Forsberg B. Can NO(2) be used to indicate ambient and personal levels of benzene and 1,3-butadiene in air? J Environ Monit 2004; 6(12): 957-962.
26. Bellander T, Berglind N, Gustavsson P, Jonson T, Nyberg F, Pershagen G, Jarup L. Using geographic information systems to assess individual historical exposure to air pollution from traffic and house heating in Stockholm. Environ Health Perspect 2001; 109(6): 633-639.
27. Nordling E, Berglind N, Melen E, Emenius G, Hallberg J, Nyberg F, Pershagen G, Svartengren M, Wickman M, Bellander T. Traffic-related air pollution and childhood respiratory symptoms, function and allergies. Epidemiology 2008; 19(3): 401-408.
28. World Health Organization (WHO), Global Alliance Against Respiratory Disease (GARD). 2009 [cited 2009 2009-02-21]; Available from: http://www.who.int/respiratory/asthma/en/
29. Global initiative for asthma. Global strategy for asthma management and prevention (2008 update). 2008 [cited 2009 April 11]; Available from: http://www.ginasthma.com/Guidelineitem.asp??l1=2&l2=1&intId=60
30. Wenzel SE. Asthma: defining of the persistent adult phenotypes. Lancet 2006; 368(9537): 804-813.
31. Humbert M, Menz G, Ying S, Corrigan CJ, Robinson DS, Durham SR, Kay AB. The immunopathology of extrinsic (atopic) and intrinsic (non-atopic) asthma: more similarities than differences. Immunol Today 1999; 20(11): 528-533.
32. Burney PG, Luczynska C, Chinn S, Jarvis D. The European Community Respiratory Health Survey. Eur Respir J 1994; 7(5): 954-960.
33. Asher MI, Keil U, Anderson HR, Beasley R, Crane J, Martinez F, Mitchell EA, Pearce N, Sibbald B, Stewart AW, et al. International Study of Asthma and Allergies in Childhood (ISAAC): rationale and methods. Eur Respir J 1995; 8(3): 483-491.
52

34. de Marco R, Cerveri I, Bugiani M, Ferrari M, Verlato G. An undetected burden of asthma in Italy: the relationship between clinical and epidemiological diagnosis of asthma. Eur Respir J 1998; 11(3): 599-605.
35. Burney PG, Laitinen LA, Perdrizet S, Huckauf H, Tattersfield AE, Chinn S, Poisson N, Heeren A, Britton JR, Jones T. Validity and repeatability of the IUATLD (1984) Bronchial Symptoms Questionnaire: an international comparison. Eur Respir J 1989; 2(10): 940-945.
36. Toren K, Olin AC, Hellgren J, Hermansson BA. Rhinitis increase the risk for adult-onset asthma--a Swedish population-based case-control study (MAP-study). Respir Med 2002; 96(8): 635-641.
37. Baker KM, Brand DA, Hen J, Jr. Classifying asthma: disagreement among specialists. Chest 2003; 124(6): 2156-2163.
38. Grossman J. One airway, one disease. Chest 1997; 111(2 Suppl): 11S-16S.
39. Bousquet J, Khaltaev N, Cruz AA, Denburg J, Fokkens WJ, Togias A, Zuberbier T, Baena-Cagnani CE, Canonica GW, van Weel C, Agache I, Ait-Khaled N, Bachert C, Blaiss MS, Bonini S, Boulet LP, Bousquet PJ, Camargos P, Carlsen KH, Chen Y, Custovic A, Dahl R, Demoly P, Douagui H, Durham SR, van Wijk RG, Kalayci O, Kaliner MA, Kim YY, Kowalski ML, Kuna P, Le LT, Lemiere C, Li J, Lockey RF, Mavale-Manuel S, Meltzer EO, Mohammad Y, Mullol J, Naclerio R, O'Hehir RE, Ohta K, Ouedraogo S, Palkonen S, Papadopoulos N, Passalacqua G, Pawankar R, Popov TA, Rabe KF, Rosado-Pinto J, Scadding GK, Simons FE, Toskala E, Valovirta E, van Cauwenberge P, Wang DY, Wickman M, Yawn BP, Yorgancioglu A, Yusuf OM, Zar H, Annesi-Maesano I, Bateman ED, Ben Kheder A, Boakye DA, Bouchard J, Burney P, Busse WW, Chan-Yeung M, Chavannes NH, Chuchalin A, Dolen WK, Emuzyte R, Grouse L, Humbert M, Jackson C, Johnston SL, Keith PK, Kemp JP, Klossek JM, Larenas-Linnemann D, Lipworth B, Malo JL, Marshall GD, Naspitz C, Nekam K, Niggemann B, Nizankowska-Mogilnicka E, Okamoto Y, Orru MP, Potter P, Price D, Stoloff SW, Vandenplas O, Viegi G, Williams D. Allergic Rhinitis and its Impact on Asthma (ARIA) 2008 update (in collaboration with the World Health Organization, GA(2)LEN and AllerGen). Allergy 2008; 63 Suppl 86: 8-160.
40. Shaaban R, Zureik M, Soussan D, Neukirch C, Heinrich J, Sunyer J, Wjst M, Cerveri I, Pin I, Bousquet J, Jarvis D,
53

Burney PG, Neukirch F, Leynaert B. Rhinitis and onset of asthma: a longitudinal population-based study. Lancet 2008; 372(9643): 1049-1057.
41. Radon K, Gerhardinger U, Schulze A, Zock JP, Norback D, Toren K, Jarvis D, Held L, Heinrich J, Leynaert B, Nowak D, Kogevinas M. Occupation and adult onset of rhinitis in the general population. Occup Environ Med 2008; 65(1): 38-43.
42. Lee YL, Shaw CK, Su HJ, Lai JS, Ko YC, Huang SL, Sung FC, Guo YL. Climate, traffic-related air pollutants and allergic rhinitis prevalence in middle-school children in Taiwan. Eur Respir J 2003; 21(6): 964-970.
43. Quillen DM, Feller DB. Diagnosing rhinitis: allergic vs. nonallergic. Am Fam Physician 2006; 73(9): 1583-1590.
44. Molgaard E, Thomsen SF, Lund T, Pedersen L, Nolte H, Backer V. Differences between allergic and nonallergic rhinitis in a large sample of adolescents and adults. Allergy 2007; 62(9): 1033-1037.
45. Janson C, Anto J, Burney P, Chinn S, de Marco R, Heinrich J, Jarvis D, Kuenzli N, Leynaert B, Luczynska C, Neukirch F, Svanes C, Sunyer J, Wjst M. The European Community Respiratory Health Survey: what are the main results so far? European Community Respiratory Health Survey II. Eur Respir J 2001; 18(3): 598-611.
46. Woods RK, Walters EH, Wharton C, Watson N, Abramson M. The rising prevalence of asthma in young Melbourne adults is associated with improvement in treatment. Ann Allergy Asthma Immunol 2001; 87(2): 117-123.
47. Braback L, Hjern A, Rasmussen F. Trends in asthma, allergic rhinitis and eczema among Swedish conscripts from farming and non-farming environments. A nationwide study over three decades. Clin Exp Allergy 2004; 34(1): 38-43.
48. Urrutia I, Aguirre U, Sunyer J, Plana E, Muniozguren N, Martinez-Moratalla J, Payo F, Maldonado JA, Anto JM. [Changes in the prevalence of asthma in the Spanish cohort of the European Community Respiratory Health Survey (ECRHS-II)]. Arch Bronconeumol 2007; 43(8): 425-430.
49. Strachan DP. Hay fever, hygiene, and household size. BMJ 1989; 299(6710): 1259-1260.
50. von Hertzen L, Haahtela T. Signs of reversing trends in prevalence of asthma. Allergy 2005; 60(3): 283-292.
51. Eder W, Ege MJ, von Mutius E. The asthma epidemic. N Engl J Med 2006; 355(21): 2226-2235.
52. Verlato G, Corsico A, Villani S, Cerveri I, Migliore E, 54

Accordini S, Carolei A, Piccioni P, Bugiani M, Lo Cascio V, Marinoni A, Poli A, de Marco R. Is the prevalence of adult asthma and allergic rhinitis still increasing? Results of an Italian study. J Allergy Clin Immunol 2003; 111(6): 1232-1238.
53. Leynaert B, Neukirch C, Kony S, Guenegou A, Bousquet J, Aubier M, Neukirch F. Association between asthma and rhinitis according to atopic sensitization in a population-based study. J Allergy Clin Immunol 2004; 113(1): 86-93.
54. Greisner WA, 3rd, Settipane RJ, Settipane GA. The course of asthma parallels that of allergic rhinitis: a 23-year follow-up study of college students. Allergy Asthma Proc 2000; 21(6): 371-375.
55. Eagan TM, Brogger JC, Eide GE, Bakke PS. The incidence of adult asthma: a review. Int J Tuberc Lung Dis 2005; 9(6): 603-612.
56. Lundback B, Ronmark E, Jonsson E, Larsson K, Sandstrom T. Incidence of physician-diagnosed asthma in adults--a real incidence or a result of increased awareness? Report from The Obstructive Lung Disease in Northern Sweden Studies. Respir Med 2001; 95(8): 685-692.
57. Toren K, Gislason T, Omenaas E, Jogi R, Forsberg B, Nystrom L, Olin AC, Svanes C, Janson C. A prospective study of asthma incidence and its predictors: the RHINE study. Eur Respir J 2004; 24(6): 942-946.
58. Yeatts K, Sly P, Shore S, Weiss S, Martinez F, Geller A, Bromberg P, Enright P, Koren H, Weissman D, Selgrade M. A brief targeted review of susceptibility factors, environmental exposures, asthma incidence, and recommendations for future asthma incidence research. Environ Health Perspect 2006; 114(4): 634-640.
59. Melen E, Nyberg F, Lindgren CM, Berglind N, Zucchelli M, Nordling E, Hallberg J, Svartengren M, Morgenstern R, Kere J, Bellander T, Wickman M, Pershagen G. Interactions between glutathione S-transferase P1, tumor necrosis factor, and traffic-related air pollution for development of childhood allergic disease. Environ Health Perspect 2008; 116(8): 1077-1084.
60. Wang Z, Chen C, Niu T, Wu D, Yang J, Wang B, Fang Z, Yandava CN, Drazen JM, Weiss ST, Xu X. Association of asthma with beta(2)-adrenergic receptor gene polymorphism and cigarette smoking. Am J Respir Crit Care Med 2001; 163(6): 1404-1409.
61. King ME, Mannino DM, Holguin F. Risk factors for asthma incidence. A review of recent prospective evidence. Panminerva
55

Med 2004; 46(2): 97-110. 62. Plaschke PP, Janson C, Norrman E, Bjornsson E, Ellbjar S,
Jarvholm B. Onset and remission of allergic rhinitis and asthma and the relationship with atopic sensitization and smoking. Am J Respir Crit Care Med 2000; 162(3 Pt 1): 920-924.
63. Strachan DP, Butland BK, Anderson HR. Incidence and prognosis of asthma and wheezing illness from early childhood to age 33 in a national British cohort. BMJ 1996; 312(7040): 1195-1199.
64. Basagana X, Sunyer J, Zock JP, Kogevinas M, Urrutia I, Maldonado JA, Almar E, Payo F, Anto JM. Incidence of asthma and its determinants among adults in Spain. Am J Respir Crit Care Med 2001; 164(7): 1133-1137.
65. Gunnbjornsdottir MI, Omenaas E, Gislason T, Norrman E, Olin AC, Jogi R, Jensen EJ, Lindberg E, Bjornsson E, Franklin K, Janson C, Gulsvik A, Laerum B, Svanes C, Toren K, Tunsater A, Lillienberg L, Gislason D, Blondal T, Bjornsdottir US, Jorundsdottir KB, Talvik R, Forsberg B, Lundback B, Soderberg M, Ledin MC, Boman G, Norback D, Wieslander G, Spetz-Nystrom U, Cashelunge KS, Ryden E. Obesity and nocturnal gastro-oesophageal reflux are related to onset of asthma and respiratory symptoms. Eur Respir J 2004; 24(1): 116-121.
66. Braun-Fahrlander C, Riedler J, Herz U, Eder W, Waser M, Grize L, Maisch S, Carr D, Gerlach F, Bufe A, Lauener RP, Schierl R, Renz H, Nowak D, von Mutius E. Environmental exposure to endotoxin and its relation to asthma in school-age children. N Engl J Med 2002; 347(12): 869-877.
67. Gunnbjornsdottir MI, Franklin KA, Norback D, Bjornsson E, Gislason D, Lindberg E, Svanes C, Omenaas E, Norrman E, Jogi R, Jensen EJ, Dahlman-Hoglund A, Janson C. Prevalence and incidence of respiratory symptoms in relation to indoor dampness: the RHINE study. Thorax 2006; 61(3): 221-225.
68. Pirhonen I, Nevalainen A, Husman T, Pekkanen J. Home dampness, moulds and their influence on respiratory infections and symptoms in adults in Finland. Eur Respir J 1996; 9(12): 2618-2622.
69. Pope CA, 3rd. Respiratory disease associated with community air pollution and a steel mill, Utah Valley. Am J Public Health 1989; 79(5): 623-628.
70. Friedman MS, Powell KE, Hutwagner L, Graham LM, Teague WG. Impact of changes in transportation and commuting behaviors during the 1996 Summer Olympic Games in Atlanta
56

on air quality and childhood asthma. JAMA 2001; 285(7): 897-905.
71. Sunyer J, Spix C, Quenel P, Ponce-de-Leon A, Ponka A, Barumandzadeh T, Touloumi G, Bacharova L, Wojtyniak B, Vonk J, Bisanti L, Schwartz J, Katsouyanni K. Urban air pollution and emergency admissions for asthma in four European cities: the APHEA Project. Thorax 1997; 52(9): 760-765.
72. Nitta H, Sato T, Nakai S, Maeda K, Aoki S, Ono M. Respiratory health associated with exposure to automobile exhaust. I. Results of cross-sectional studies in 1979, 1982, and 1983. Arch Environ Health 1993; 48(1): 53-58.
73. Zemp E, Elsasser S, Schindler C, Kunzli N, Perruchoud AP, Domenighetti G, Medici T, Ackermann-Liebrich U, Leuenberger P, Monn C, Bolognini G, Bongard JP, Brandli O, Karrer W, Keller R, Schoni MH, Tschopp JM, Villiger B, Zellweger JP. Long-term ambient air pollution and respiratory symptoms in adults (SAPALDIA study). The SAPALDIA Team. Am J Respir Crit Care Med 1999; 159(4 Pt 1): 1257-1266.
74. Hirsch T, Weiland SK, von Mutius E, Safeca AF, Grafe H, Csaplovics E, Duhme H, Keil U, Leupold W. Inner city air pollution and respiratory health and atopy in children. Eur Respir J 1999; 14(3): 669-677.
75. Heinrich J, Topp R, Gehring U, Thefeld W. Traffic at residential address, respiratory health, and atopy in adults: the National German Health Survey 1998. Environ Res 2005; 98(2): 240-249.
76. Brunekreef B, Janssen NA, de Hartog J, Harssema H, Knape M, van Vliet P. Air pollution from truck traffic and lung function in children living near motorways. Epidemiology 1997; 8(3): 298-303.
77. de Marco R, Poli A, Ferrari M, Accordini S, Giammanco G, Bugiani M, Villani S, Ponzio M, Bono R, Carrozzi L, Cavallini R, Cazzoletti L, Dallari R, Ginesu F, Lauriola P, Mandrioli P, Perfetti L, Pignato S, Pirina P, Struzzo P. The impact of climate and traffic-related NO2 on the prevalence of asthma and allergic rhinitis in Italy. Clin Exp Allergy 2002; 32(10): 1405-1412.
78. Abbey DE, Hwang BL, Burchette RJ, Vancuren T, Mills PK. Estimated long-term ambient concentrations of PM10 and development of respiratory symptoms in a nonsmoking population. Arch Environ Health 1995; 50(2): 139-152.
79. McDonnell WF, Abbey DE, Nishino N, Lebowitz MD. Long-57

term ambient ozone concentration and the incidence of asthma in nonsmoking adults: the AHSMOG Study. Environ Res 1999; 80(2 Pt 1): 110-121.
80. von Mutius E. Gene-environment interactions in asthma. J Allergy Clin Immunol 2009; 123(1): 3-11; quiz 12-13.
81. D'Amato G, Liccardi G, D'Amato M, Holgate S. Environmental risk factors and allergic bronchial asthma. Clin Exp Allergy 2005; 35(9): 1113-1124.
82. Schwarze PE, Ovrevik J, Lag M, Refsnes M, Nafstad P, Hetland RB, Dybing E. Particulate matter properties and health effects: consistency of epidemiological and toxicological studies. Hum Exp Toxicol 2006; 25(10): 559-579.
83. Sydbom A, Blomberg A, Parnia S, Stenfors N, Sandstrom T, Dahlen SE. Health effects of diesel exhaust emissions. Eur Respir J 2001; 17(4): 733-746.
84. Diaz-Sanchez D, Dotson AR, Takenaka H, Saxon A. Diesel exhaust particles induce local IgE production in vivo and alter the pattern of IgE messenger RNA isoforms. J Clin Invest 1994; 94(4): 1417-1425.
85. Diaz-Sanchez D, Tsien A, Fleming J, Saxon A. Combined diesel exhaust particulate and ragweed allergen challenge markedly enhances human in vivo nasal ragweed-specific IgE and skews cytokine production to a T helper cell 2-type pattern. J Immunol 1997; 158(5): 2406-2413.
86. Blomberg A, Krishna MT, Helleday R, Soderberg M, Ledin MC, Kelly FJ, Frew AJ, Holgate ST, Sandstrom T. Persistent airway inflammation but accommodated antioxidant and lung function responses after repeated daily exposure to nitrogen dioxide. Am J Respir Crit Care Med 1999; 159(2): 536-543.
87. Parnia S, Brown JL, Frew AJ. The role of pollutants in allergic sensitization and the development of asthma. Allergy 2002; 57(12): 1111-1117.
88. Forsberg B, Stjernberg N, Wall S. People can detect poor air quality well below guideline concentrations: a prevalence study of annoyance reactions and air pollution from traffic. Occup Environ Med 1997; 54(1): 44-48.
89. Oglesby L, Kunzli N, Monn C, Schindler C, Ackermann-Liebrich U, Leuenberger P. Validity of Annoyance Scores for Estimation of Long Term Air Pollution Exposure in Epidemiologic Studies. Am J Epidemiol 2000; 152(1): 75-83.
90. Jacquemin B, Sunyer J, Forsberg B, Aguilera I, Briggs D, Gotschi T, Heinrich J, Toren K, Vienneau D, Kunzli N. Association between annoyance and individuals' values of
58

nitrogen dioxide in a European setting. J Epidemiol Community Health 2008; 62(5): e12.
91. Lindgren A, Stroh E, Montnemery P, Nihlen U, Jakobsson K, Axmon A. Traffic-related air pollution associated with prevalence of asthma and COPD/chronic bronchitis. A cross-sectional study in Southern Sweden. Int J Health Geogr 2009; 8: 2.
92. Brauer M, Hoek G, Smit HA, de Jongste JC, Gerritsen J, Postma DS, Kerkhof M, Brunekreef B. Air pollution and development of asthma, allergy and infections in a birth cohort. Eur Respir J 2007; 29(5): 879-888.
93. Morgenstern V, Zutavern A, Cyrys J, Brockow I, Koletzko S, Kramer U, Behrendt H, Herbarth O, von Berg A, Bauer CP, Wichmann HE, Heinrich J. Atopic diseases, allergic sensitization, and exposure to traffic-related air pollution in children. Am J Respir Crit Care Med 2008; 177(12): 1331-1337.
94. Jacquemin B, Sunyer J, Forsberg B, Aguilera I, Briggs D, Garcia-Esteban R, Gotschi T, Heinrich J, Jarvholm B, Jarvis D, Vienneau D, Kunzli N. Home outdoor NO2 and new onset of self-reported asthma in adults. Epidemiology 2009; 20(1): 119-126.
95. Nieuwenhuijsen M, ed. Exposure assessment in occupational and environmental epidemiology. Oxford University Press, New york, 2004.
96. Gidhagen L, Johansson C, Omstedt G, Langner J, Olivares G. Model simulations of NOx and ultrafine particles close to a Swedish highway. Environ Sci Technol 2004; 38(24): 6730-6740.
97. Zhu Y, Hinds W. Concentration and size distribution of ultra fine particles near a major highway. J Air & Waste Manage Assoc 2002; 52: 1032-1042.
98. McConnell R, Berhane K, Yao L, Jerrett M, Lurmann F, Gilliland F, Kunzli N, Gauderman J, Avol E, Thomas D, Peters J. Traffic, susceptibility, and childhood asthma. Environ Health Perspect 2006; 114(5): 766-772.
99. Janssen N, van Vliet P, Aarts F, Harssema H, Brunekreef B. Assessement of exposure to traffic related air pollution of children attending schools near motorways. Atmospheric environment 2001; 35: 3875-3884.
100. Bayer-Oglesby L, Schindler C, Hazenkamp-von Arx ME, Braun-Fahrlander C, Keidel D, Rapp R, Kunzli N, Braendli O, Burdet L, Sally Liu LJ, Leuenberger P, Ackermann-Liebrich U. Living near main streets and respiratory symptoms in adults: the Swiss Cohort Study on Air Pollution and Lung Diseases in
59

60
Adults. Am J Epidemiol 2006; 164(12): 1190-1198. 101. Rijnders E, Janssen NA, van Vliet PH, Brunekreef B. Personal
and outdoor nitrogen dioxide concentrations in relation to degree of urbanization and traffic density. Environ Health Perspect 2001; 109 Suppl 3: 411-417.
102. Sorensen M, Loft S, Andersen HV, Raaschou-Nielsen O, Skovgaard LT, Knudsen LE, Nielsen IV, Hertel O. Personal exposure to PM2.5, black smoke and NO2 in Copenhagen: relationship to bedroom and outdoor concentrations covering seasonal variation. J Expo Anal Environ Epidemiol 2005; 15(5): 413-422.
103. Johannesson S, Gustafson P, Molnar P, Barregard L, Sallsten G. Exposure to fine particles (PM2.5 and PM1) and black smoke in the general population: personal, indoor, and outdoor levels. J Expo Sci Environ Epidemiol 2007; 17(7): 613-624.
104. Hagenbjork-Gustafsson A, Forsberg B, Hestvik G, Karlsson D, Wahlberg S, Sandstrom T. Measurements of indoor and outdoor nitrogen dioxide concentrations using a diffusive sampler. Analyst 1996; 121: 1261-1264.
105. Pershagen G. Challenges in epidemiologic allergy research. Allergy 1997; 52(11): 1045-1049.
106. Leynaert B, Bousquet J, Neukirch C, Liard R, Neukirch F. Perennial rhinitis: An independent risk factor for asthma in nonatopic subjects: results from the European Community Respiratory Health Survey. J Allergy Clin Immunol 1999; 104(2 Pt 1): 301-304.
107. Modig L, Jarvholm B, Ronnmark E, Nystrom L, Lundback B, Andersson C, Forsberg B. Vehicle exhaust exposure in an incident case-control study of adult asthma. Eur Respir J 2006; 28(1): 75-81.
108. Toren K, Palmqvist M, Lowhagen O, Balder B, Tunsater A. Self-reported asthma was biased in relation to disease severity while reported year of asthma onset was accurate. J Clin Epidemiol 2006; 59(1): 90-93.
109. Rothman K, Greenland S. Modern Epidemiology. Second ed. Lippincott-Raven Publishers, Philadelphia, 1998.