Embed Size (px)
Citation preview
ASTRONOMY 340FALL 200725 September 2007
Class #6-#7
Review
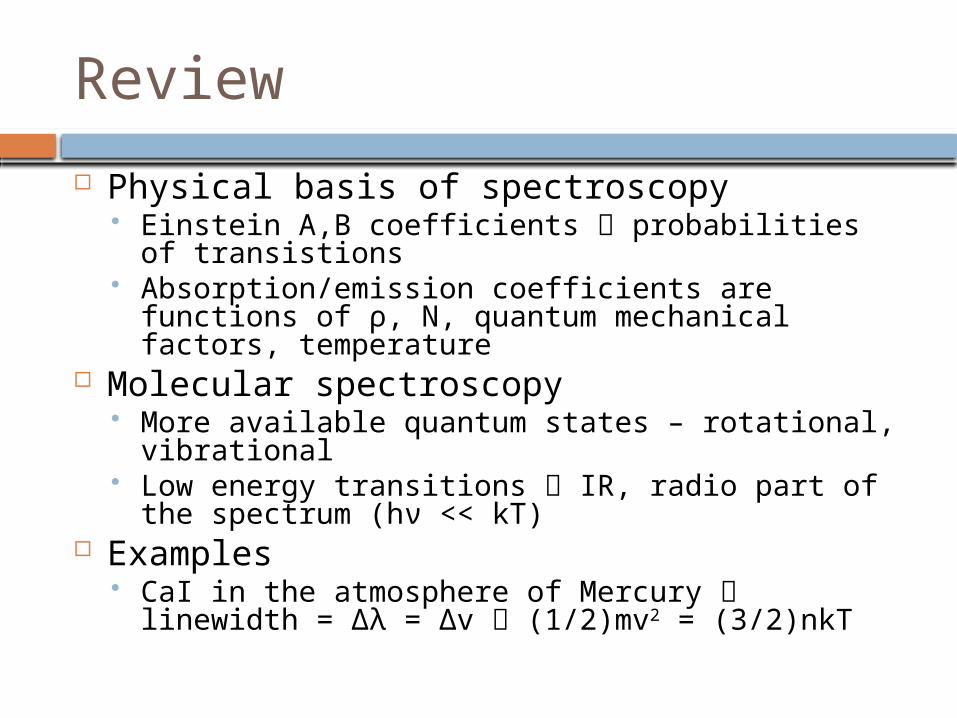
Physical basis of spectroscopy Einstein A,B coefficients probabilities of
transistions Absorption/emission coefficients are functions of ρ,
N, quantum mechanical factors, temperature Molecular spectroscopy
More available quantum states – rotational, vibrational
Low energy transitions IR, radio part of the spectrum (hν << kT)
Examples CaI in the atmosphere of Mercury linewidth = Δλ
= Δv (1/2)mv2 = (3/2)nkT
Quantum mechanics
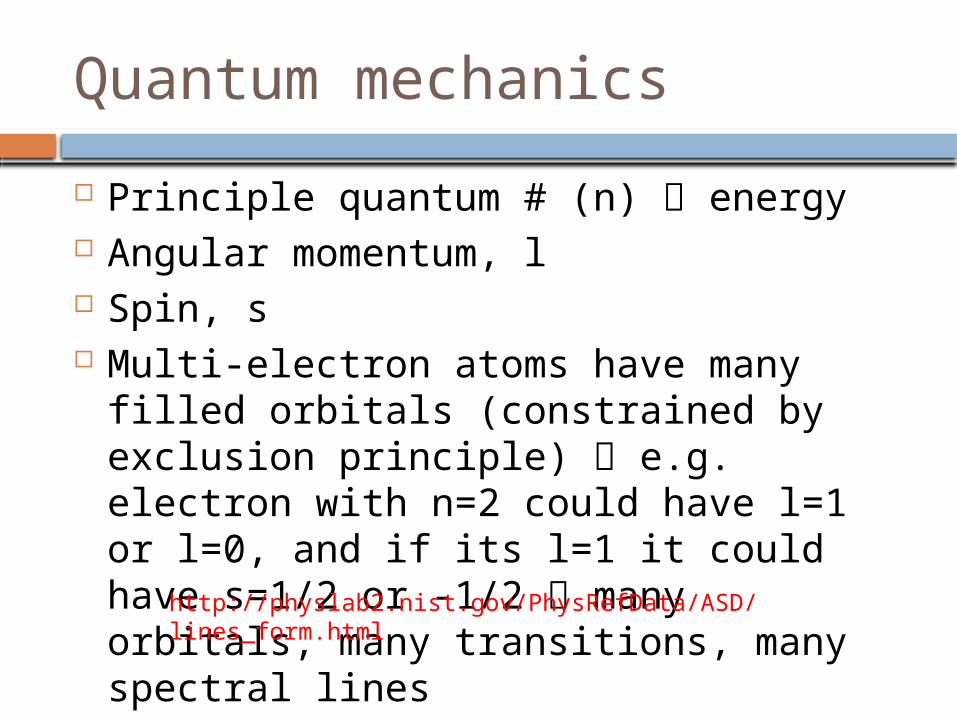
Principle quantum # (n) energy Angular momentum, l Spin, s Multi-electron atoms have many filled
orbitals (constrained by exclusion principle) e.g. electron with n=2 could have l=1 or l=0, and if its l=1 it could have s=1/2 or -1/2 many orbitals, many transitions, many spectral lines http://physlab2.nist.gov/PhysRefData/ASD/
lines_form.html
Molecules
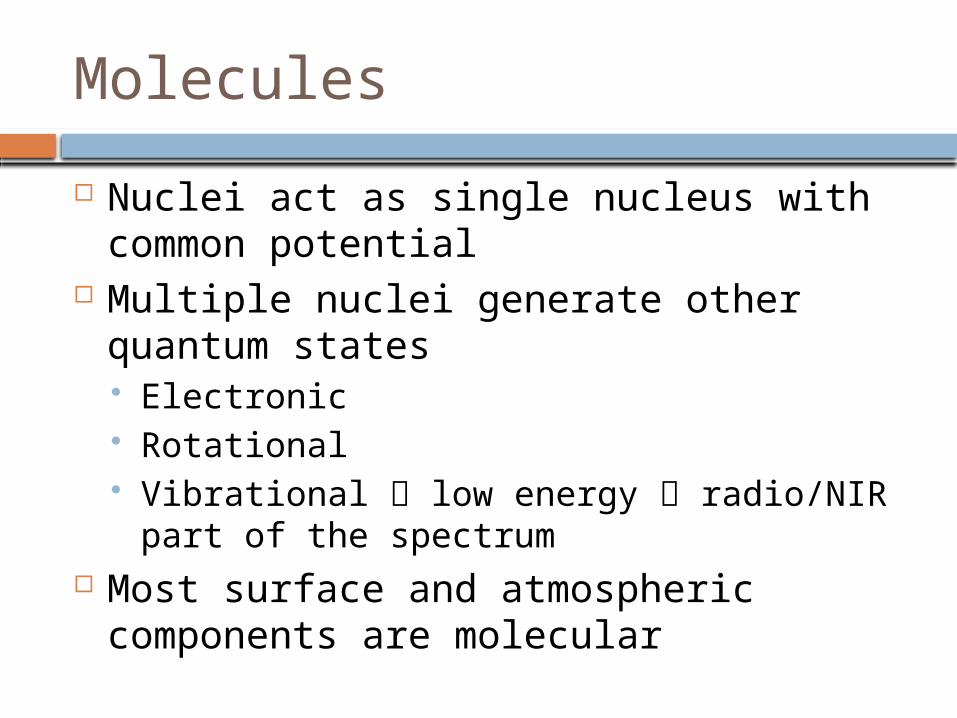
Nuclei act as single nucleus with common potential
Multiple nuclei generate other quantum states Electronic Rotational Vibrational low energy radio/NIR part of
the spectrum Most surface and atmospheric
components are molecular
CO
Main product of stellar evolution Transitions easily excited rotational
modes J = 1 0 (2.7mm, 115.3 GHz) J = 2 1 (1.3mm)
Observations radiotelescopes Measure “brightness temperature”, Tb
Optically thick vs optically thin
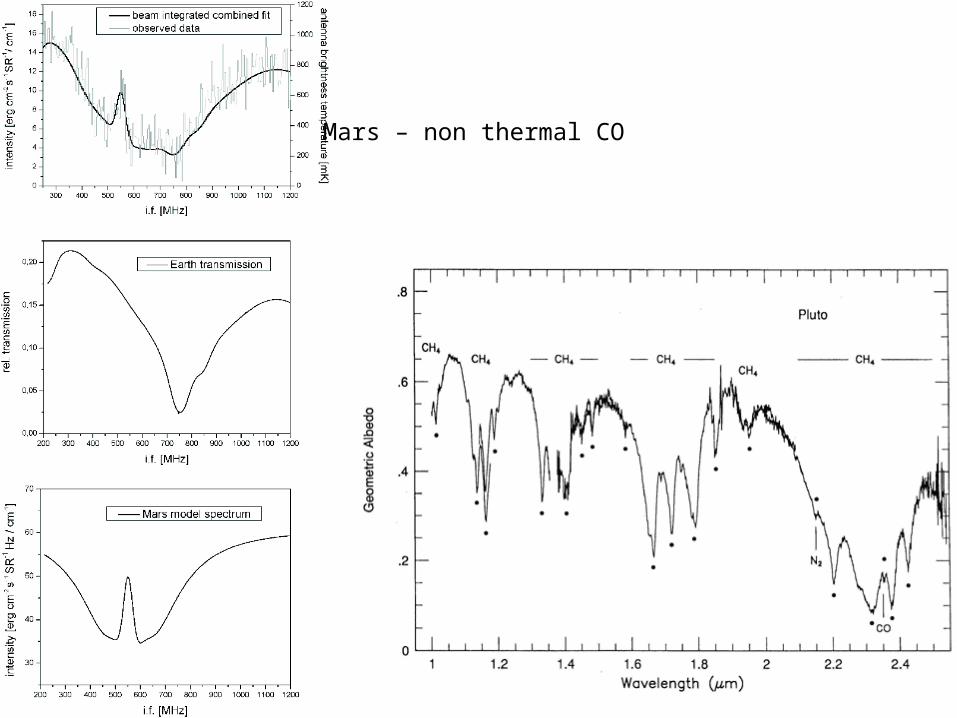
Mars – non thermal CO
Example: Mercury
What does the spectrum of Mercury look like? Planetary reflectance spectrum Terrestrial emission and absorption Narrow source emission lines wavelength
shifted via Doppler Process
What do you actually measure? Linewidths? Wavelength?
Spencer et al. 2000Science 288, 1208
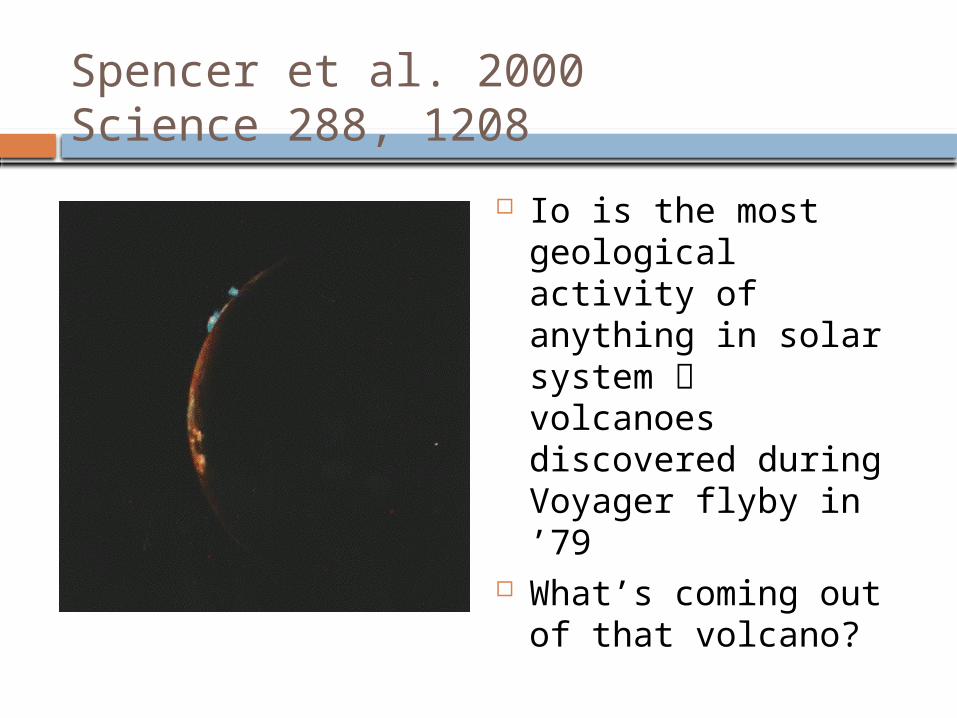
Io is the most geological activity of anything in solar system volcanoes discovered during Voyager flyby in ’79
What’s coming out of that volcano?
Spencer et al. 2000Science 288 1208
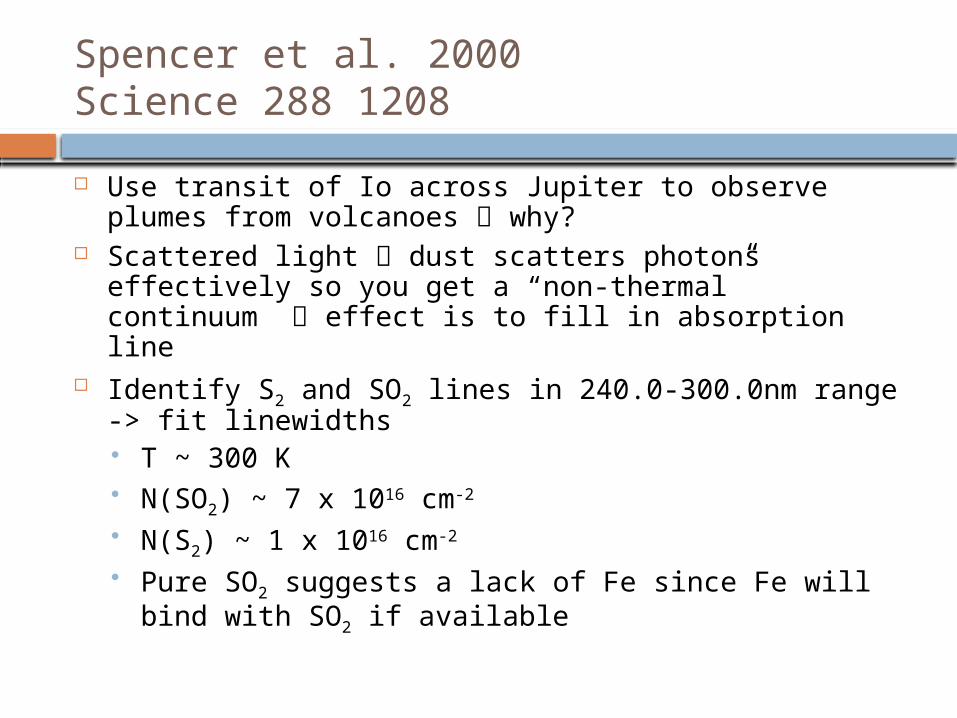
Use transit of Io across Jupiter to observe plumes from volcanoes why?
Scattered light dust scatters photons effectively so you get a “non-thermal” continuum effect is to fill in absorption line
Identify S2 and SO2 lines in 240.0-300.0nm range -> fit linewidths T ~ 300 K N(SO2) ~ 7 x 1016 cm-2
N(S2) ~ 1 x 1016 cm-2
Pure SO2 suggests a lack of Fe since Fe will bind with SO2 if available
CO molecule
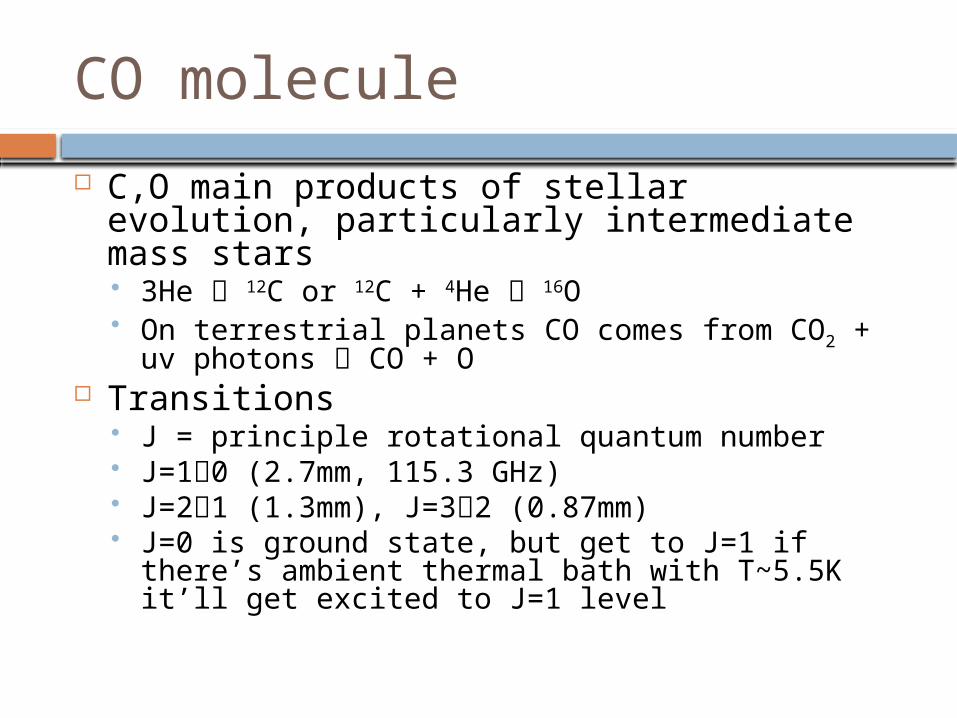
C,O main products of stellar evolution, particularly intermediate mass stars 3He 12C or 12C + 4He 16O On terrestrial planets CO comes from CO2 + uv
photons CO + O Transitions
J = principle rotational quantum number J=10 (2.7mm, 115.3 GHz) J=21 (1.3mm), J=32 (0.87mm) J=0 is ground state, but get to J=1 if there’s
ambient thermal bath with T~5.5K it’ll get excited to J=1 level
CO molecule
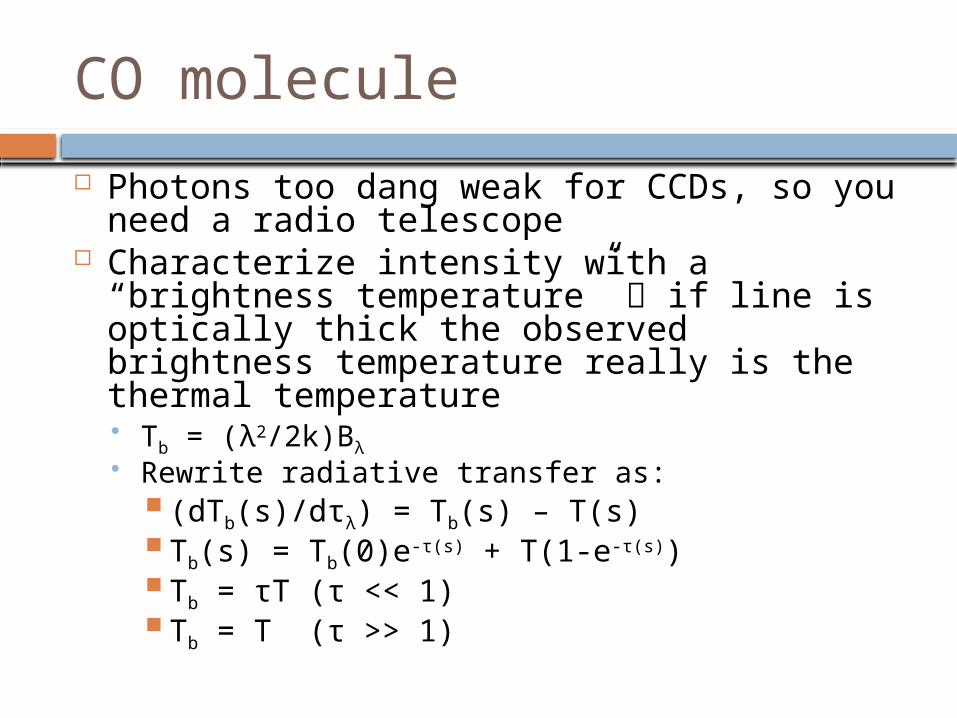
Photons too dang weak for CCDs, so you need a radio telescope
Characterize intensity with a “brightness temperature” if line is optically thick the observed brightness temperature really is the thermal temperature Tb = (λ2/2k)Bλ Rewrite radiative transfer as:
(dTb(s)/dτλ) = Tb(s) – T(s) Tb(s) = Tb(0)e-τ(s) + T(1-e-τ(s)) Tb = τT (τ << 1) Tb = T (τ >> 1)
Venus Images in J=1-0 Line
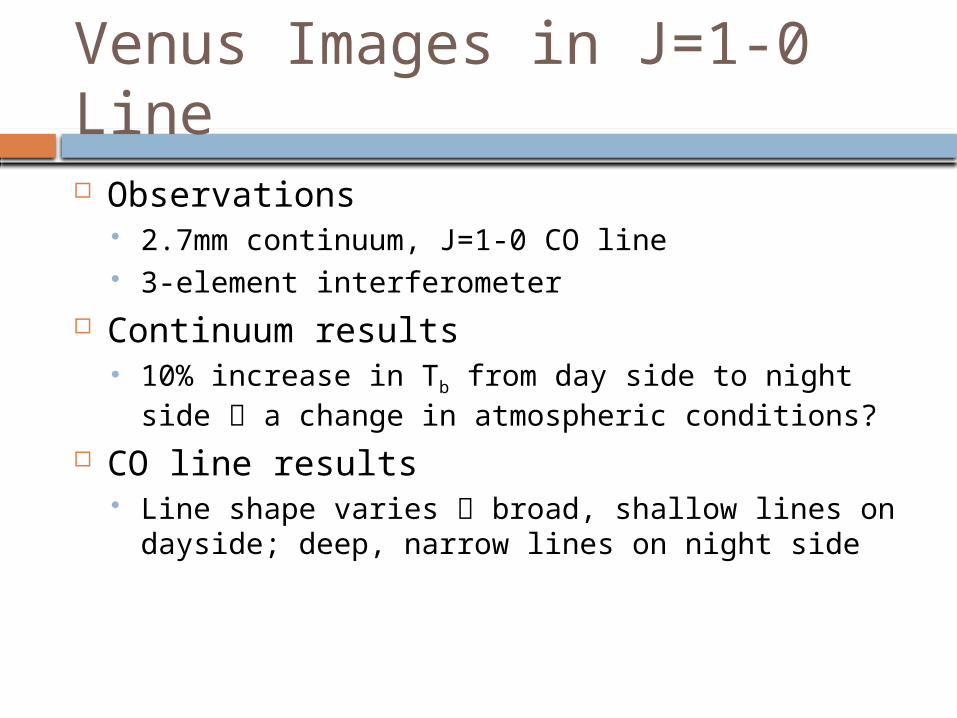
Observations 2.7mm continuum, J=1-0 CO line 3-element interferometer
Continuum results 10% increase in Tb from day side to night side a
change in atmospheric conditions? CO line results
Line shape varies broad, shallow lines on dayside; deep, narrow lines on night side
Note on Conductivity
Specific heat units are J mole-1 K-1 function of temperature for most minerals
Example: feldspar (KAlSi3O8)
Transition Slide….
Radiative transfer tells us how radiation is affected travelling through some substance (gas)
In Rayleigh-Jeans approximation we can substitute a temperature (Tb) for the radiation intensity
Now onto some fun stuff – planetary surfaces….
Relevant reading: Chapter 5
Processes at Work
Impact cratering Weathering/erosion Conditions of the atmosphere Geological activity
Volcanic activity Tectonics
Geological activity - Earth
Volcanism Shield volcanoes
Formed via a single plume Hawaii – crustal plate moving over a hot spot
“cone” volcanoes Formed over subduction zones Cascade mountains, Mount Etna
Earthquakes At plate boundaries
Plate tectonics Mid-ocean ridges, mountain chains, moving
continents, earthquakes, “ring of fire”, global resurfacing
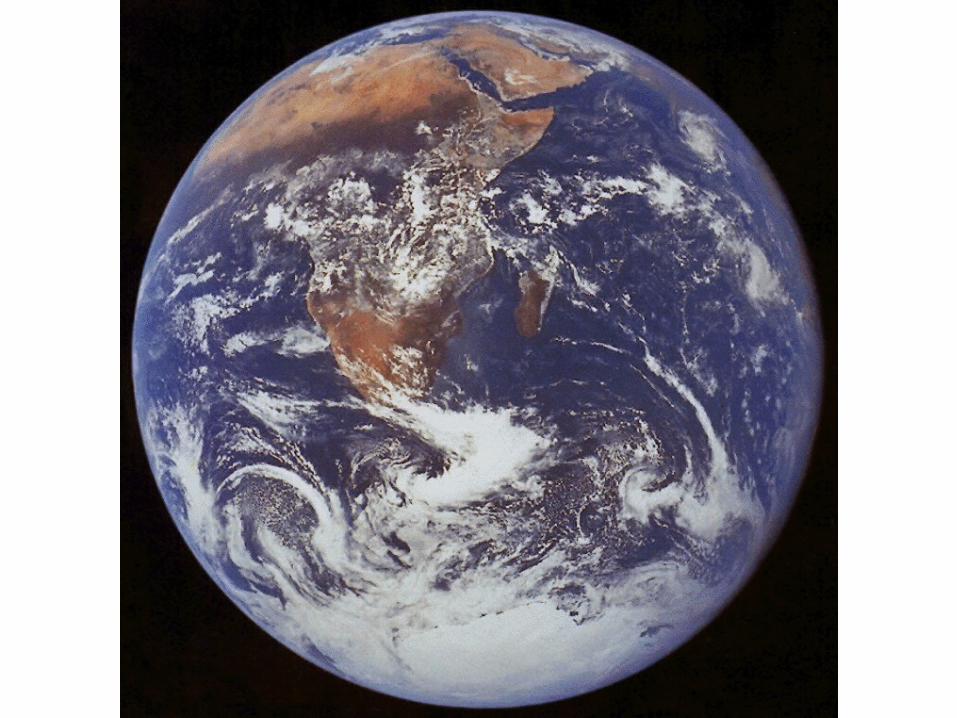
Apollo 17 View of Earth
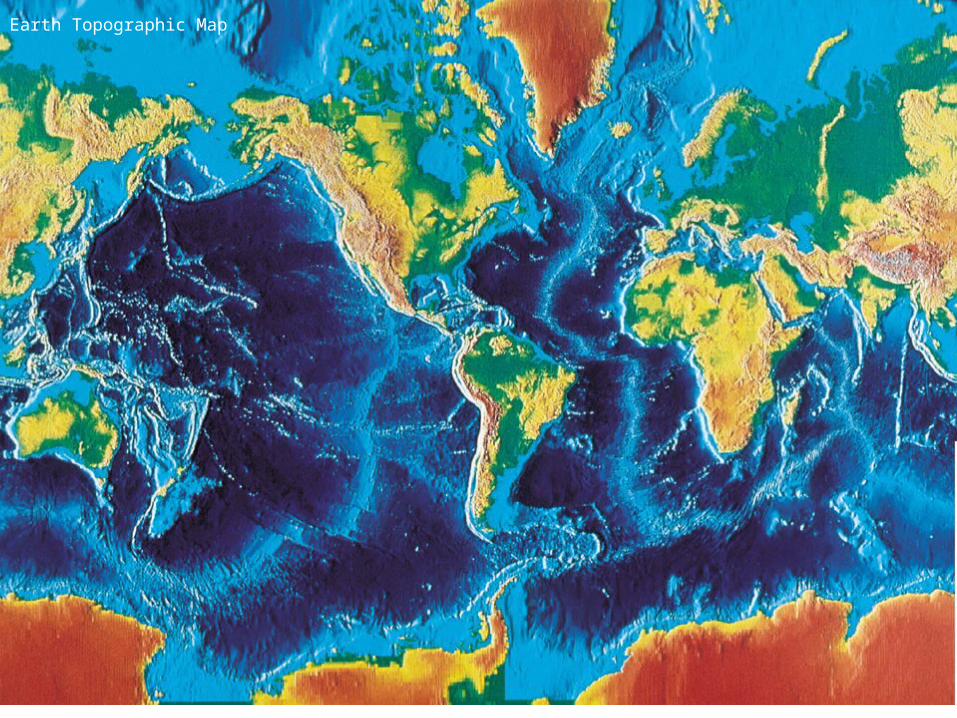
Earth Topographic Map
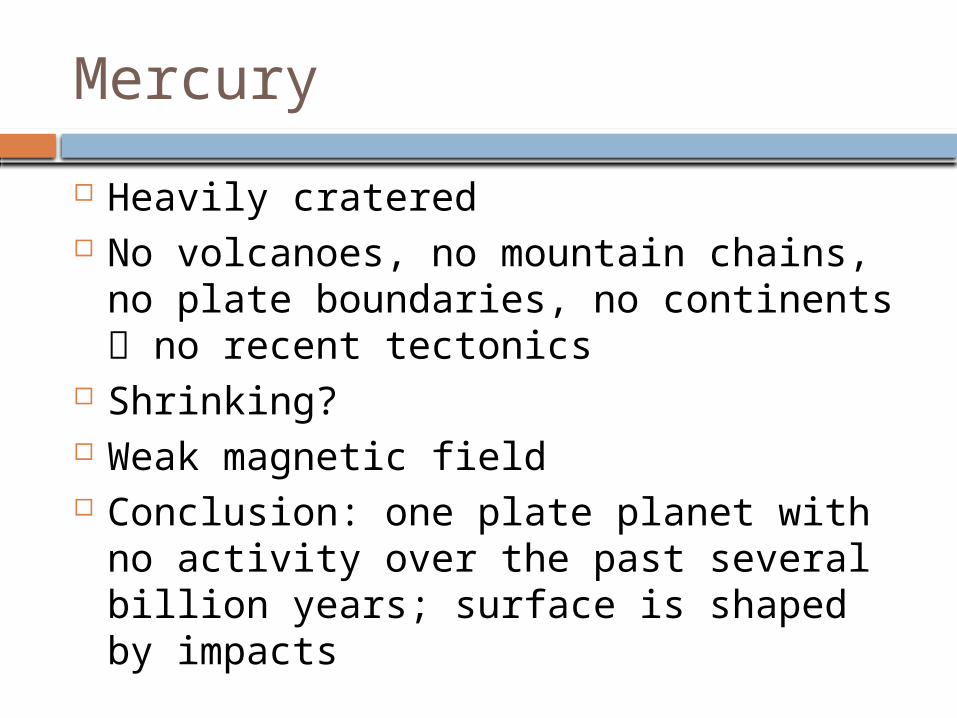
Mercury
Heavily cratered No volcanoes, no mountain chains, no
plate boundaries, no continents no recent tectonics
Shrinking? Weak magnetic field Conclusion: one plate planet with no
activity over the past several billion years; surface is shaped by impacts
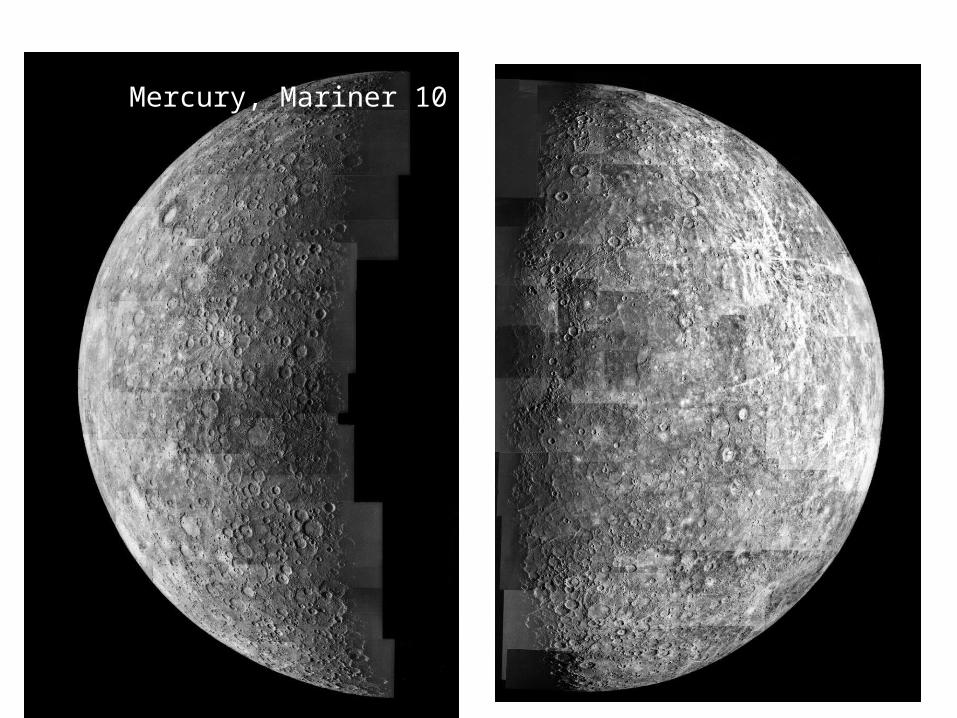
Mercury, Mariner 10 3/74, 9/74, 3/75
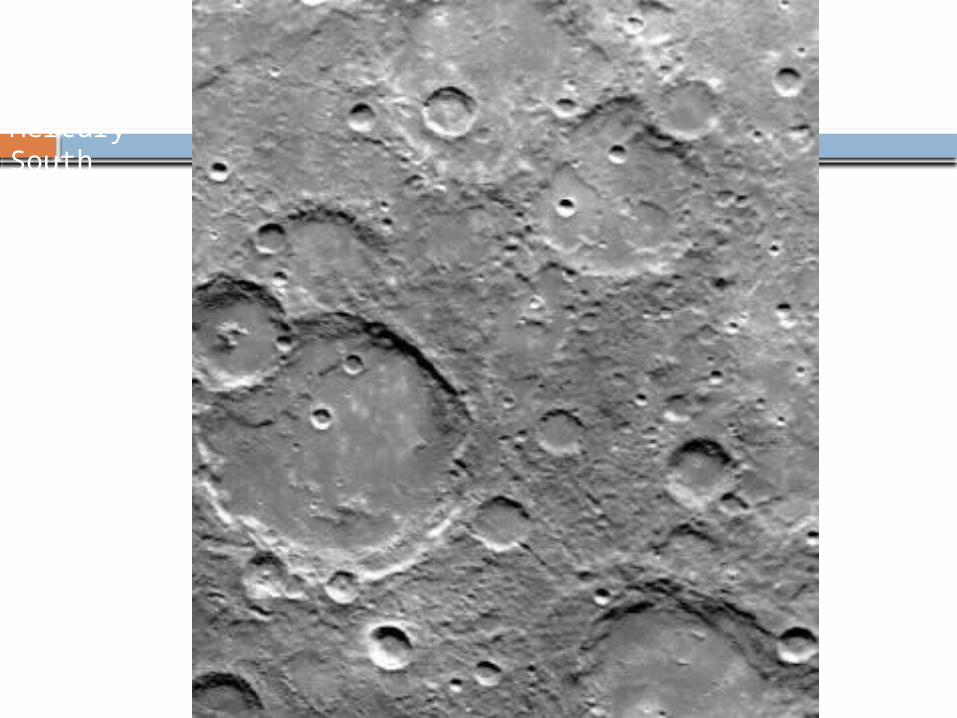
Mercury South Pole
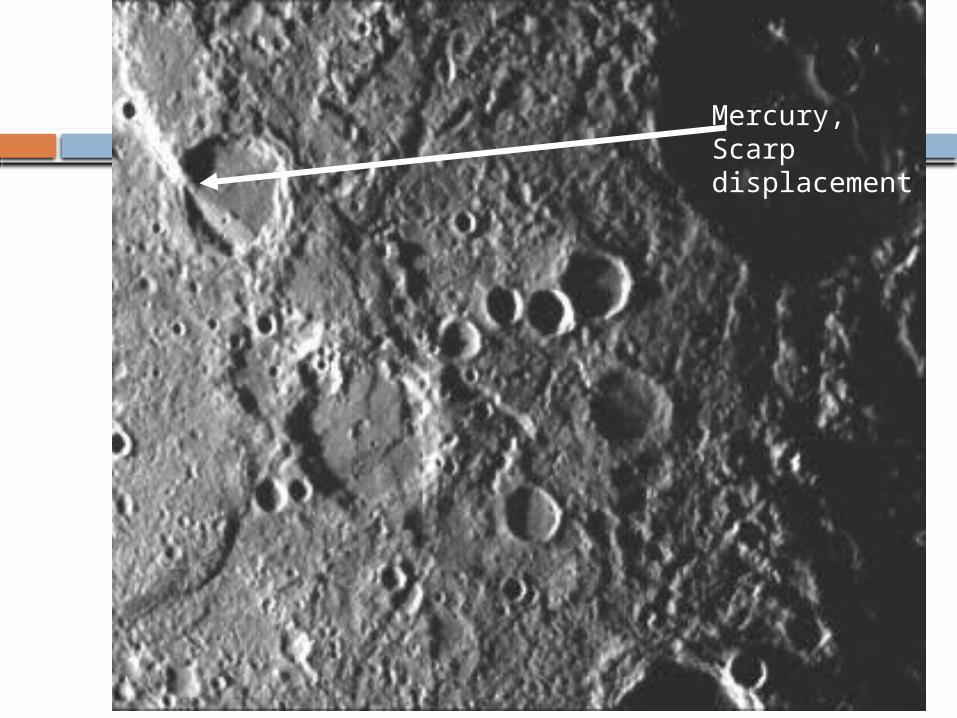
Mercury, Scarp displacement
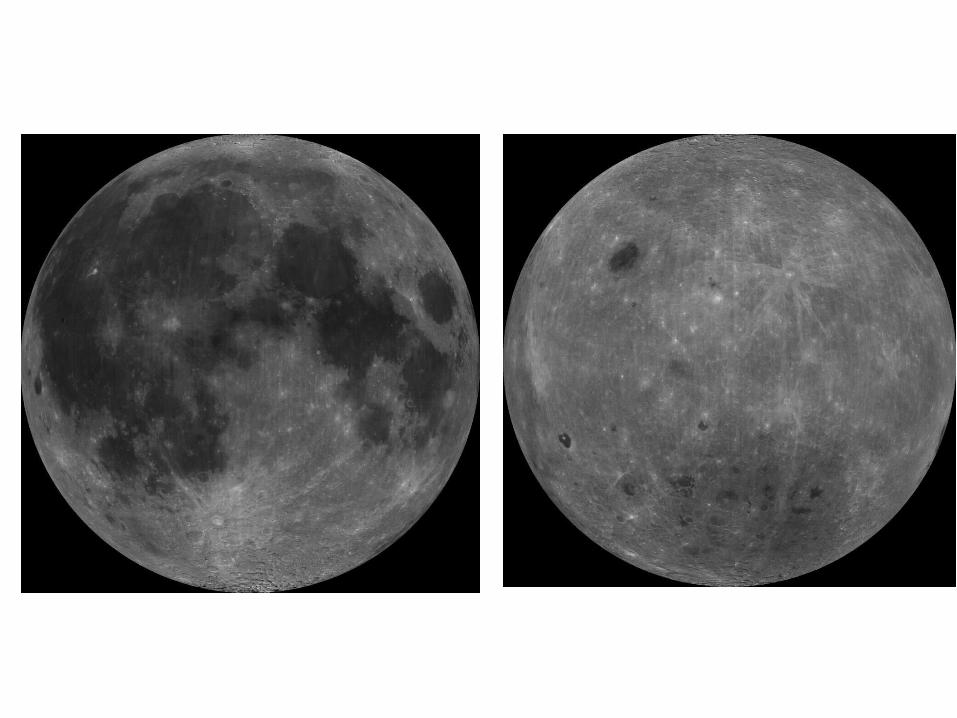
Luna, near sideLUNA
Earth Facing Side The far side
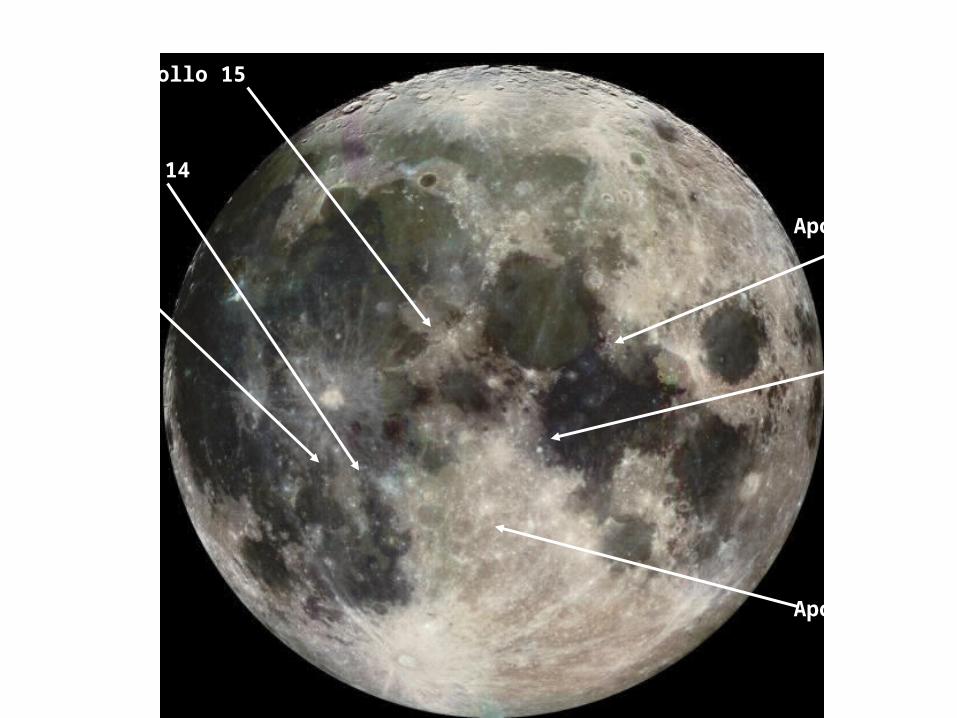
Moon from Galileo Spacecraft
Apollo 14
Apollo 12
Apollo 15
Apollo 17
Apollo 11
Apollo 16
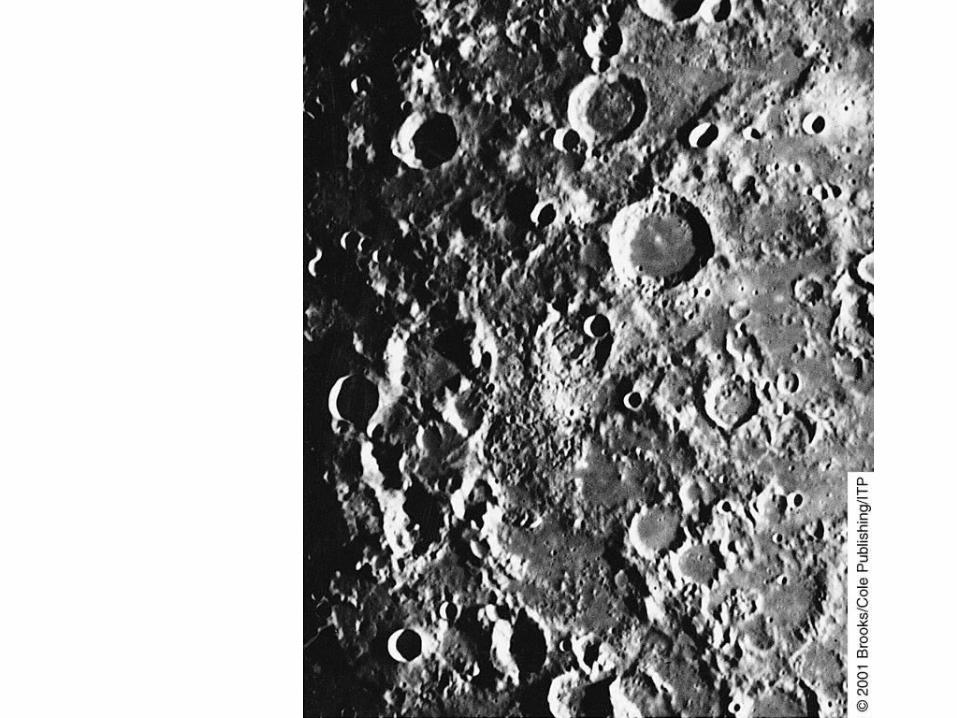
Lunar Highlands
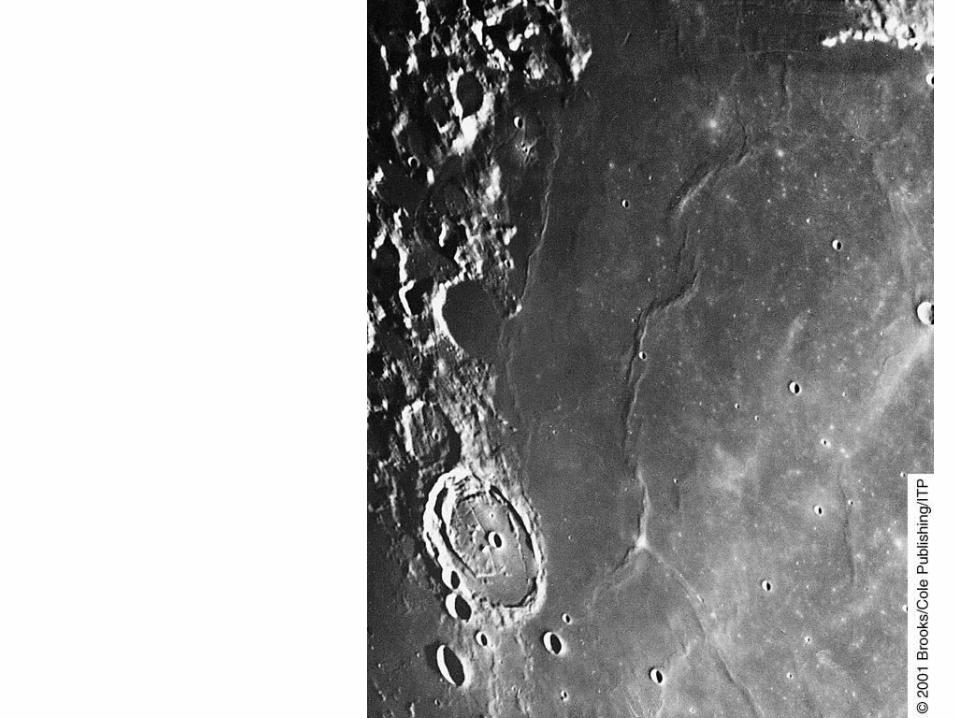
Lunar Mare
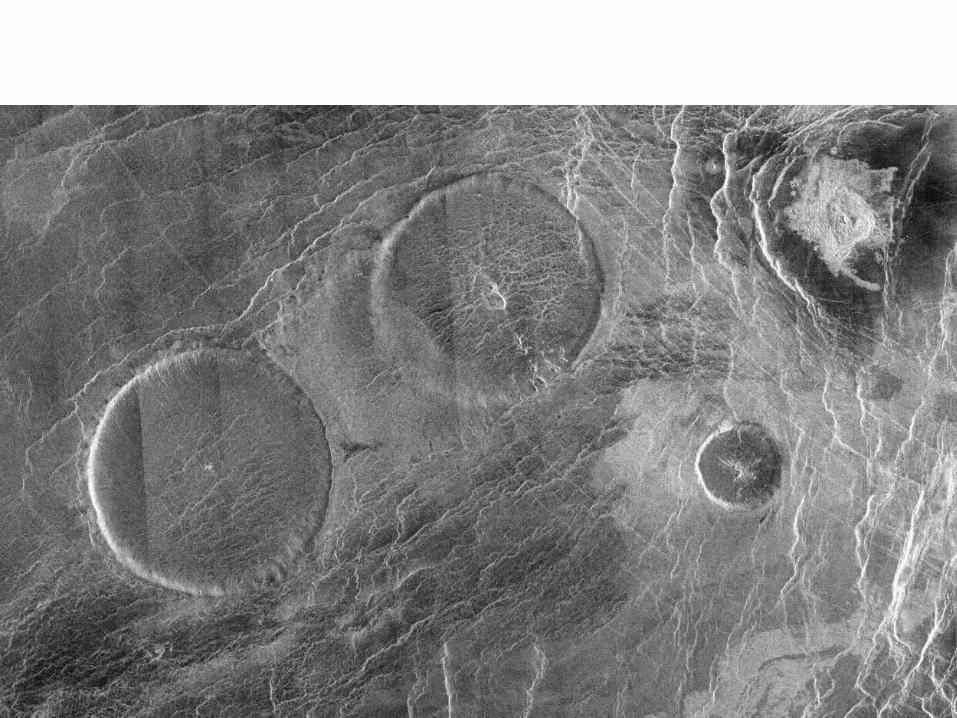
Venus Lots of volcanic activity in the recent past
Characteristic feature is a “coronae” which is a circular structure like the caldera of a volcano but without the mountain to go with it
Global resurfacing about 300 Myr ago Crater density (number per km2) We call this a “young” surface
A couple of continent-like features No obvious plate boundaries
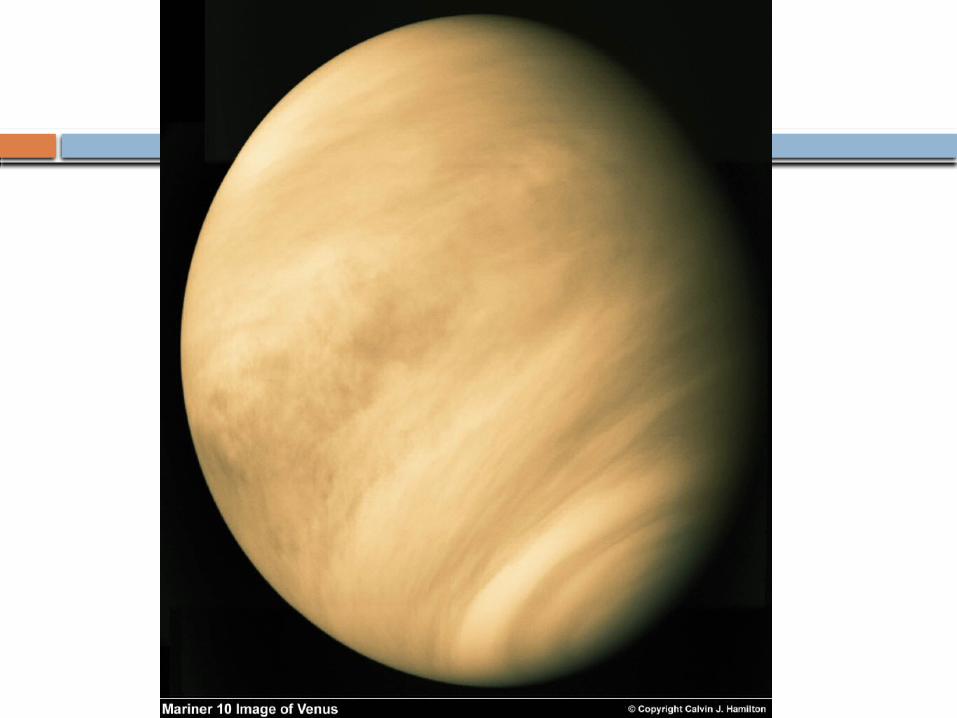
Venus Clouds Mariner 10
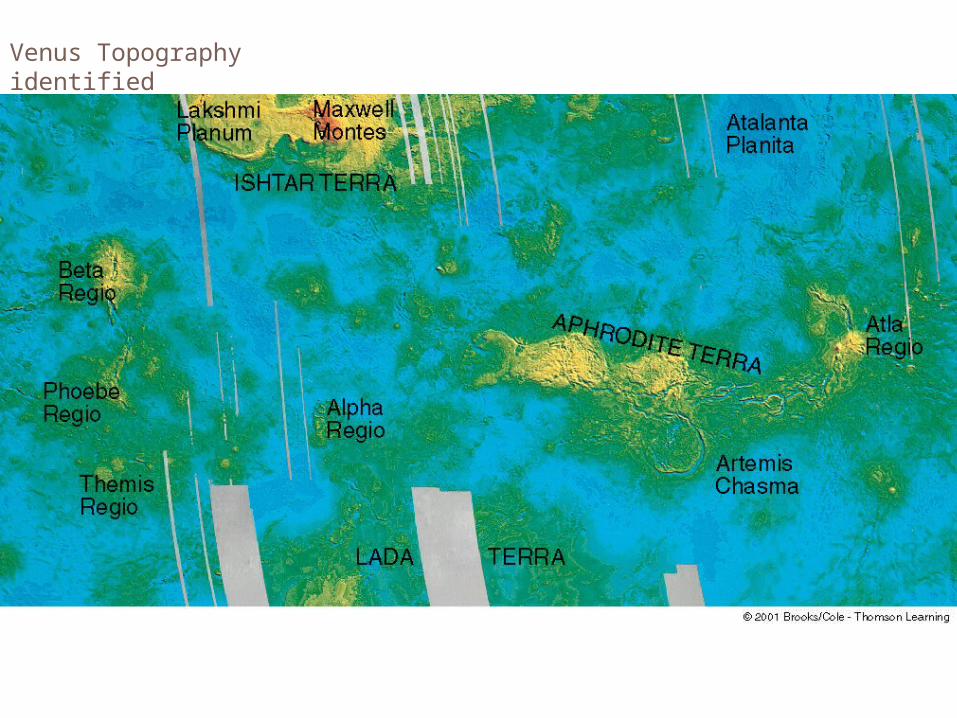
Venus Topography identified
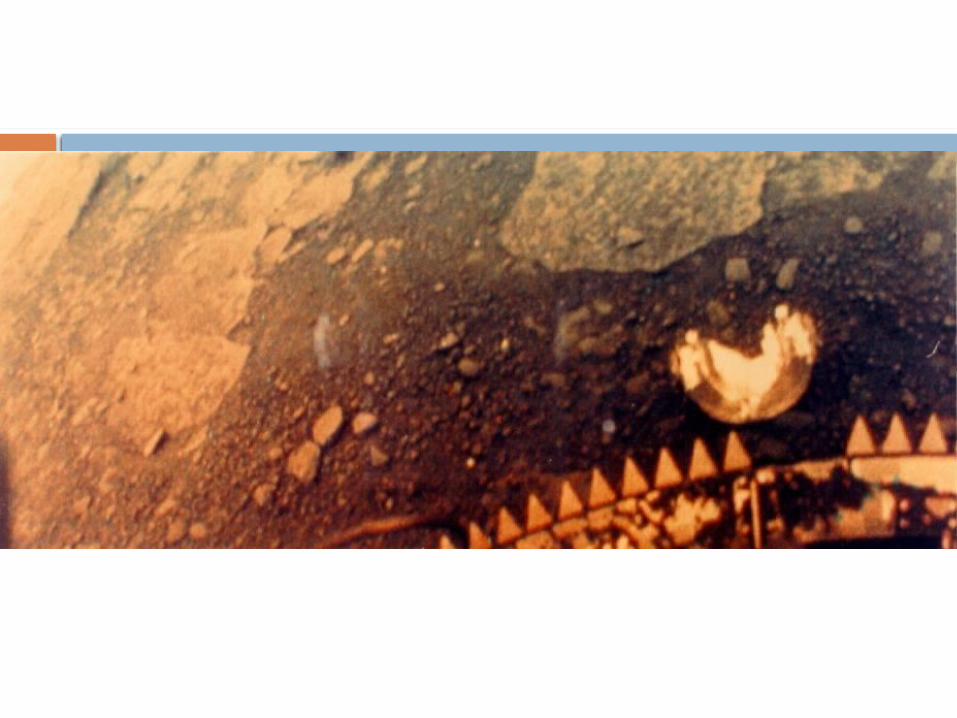
Venus Surface, Venera 13
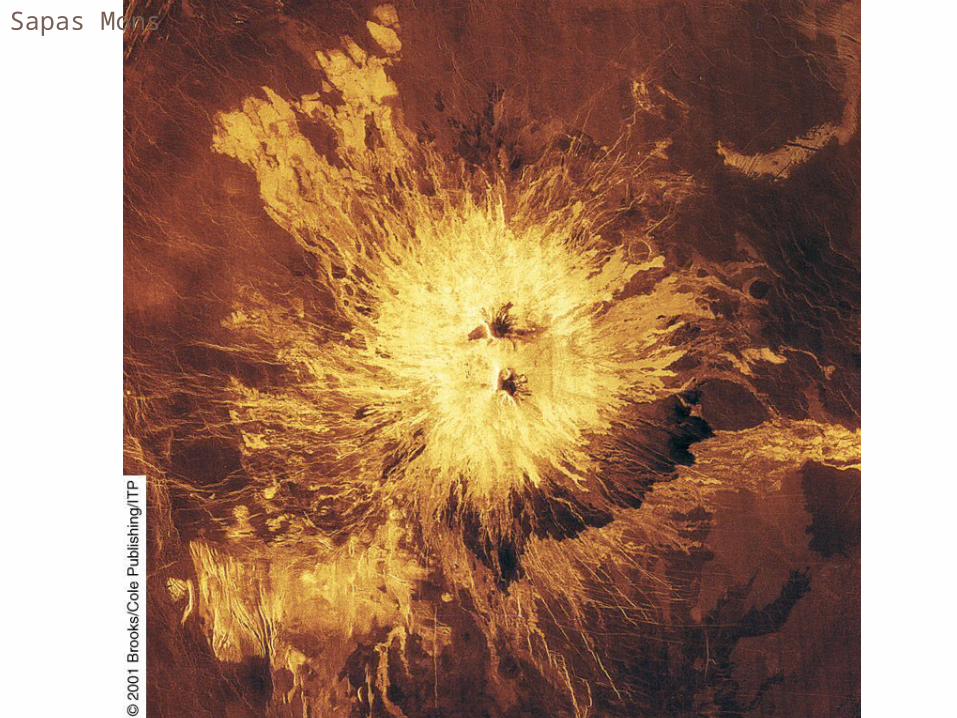
Sapas Mons
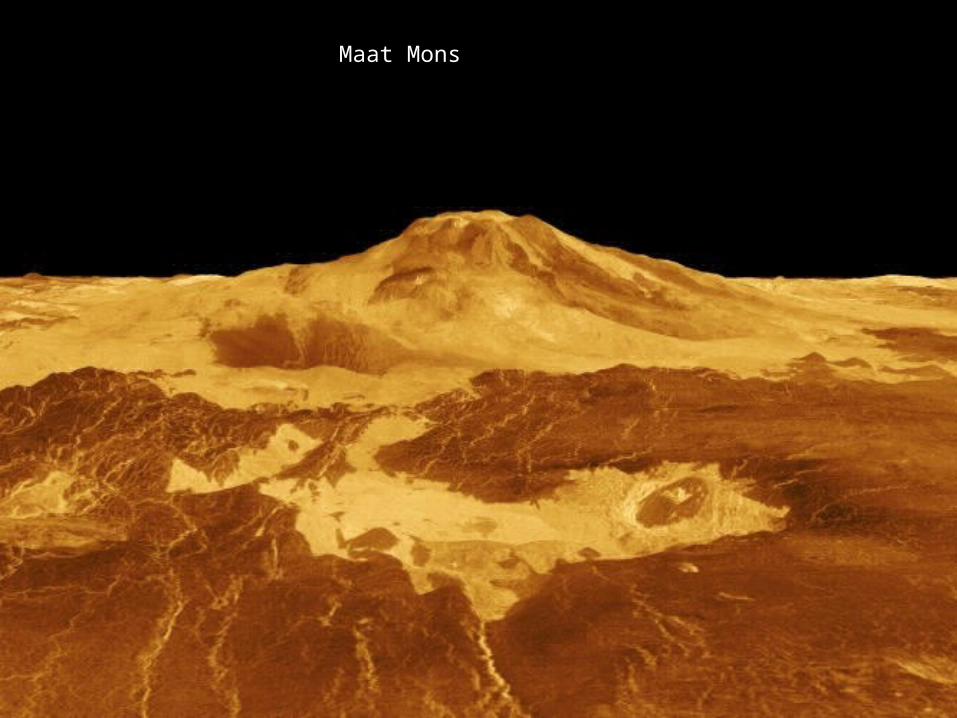
Maat Mons
Terrestrial Planet Surface Morphology (4)
• Mars
• Massive Shield Volcanoes
• Huge Erosion Channels
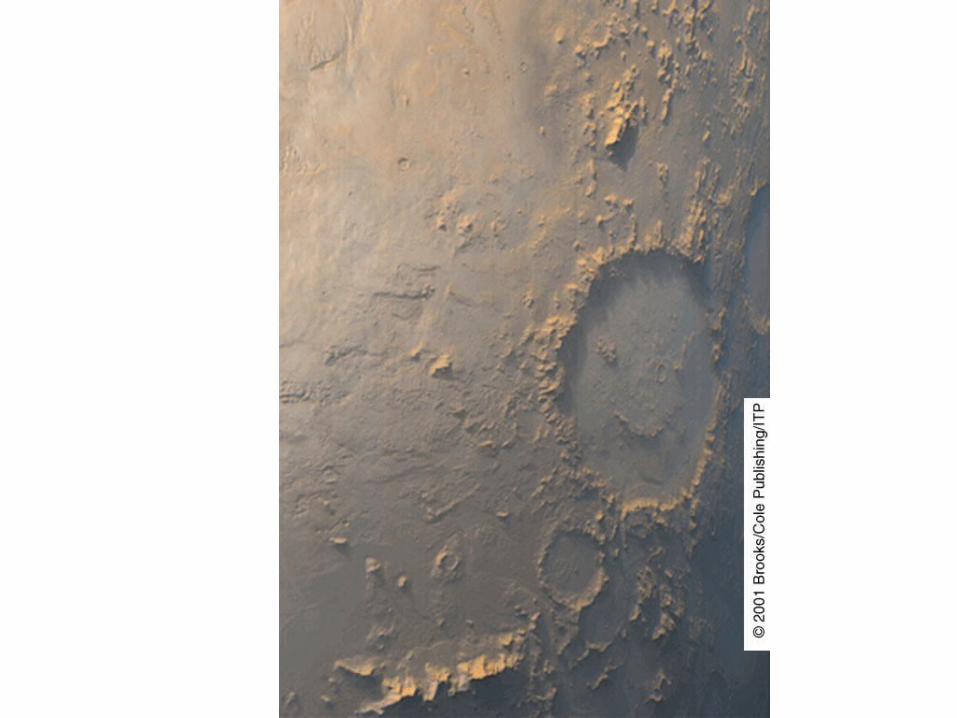
• Much Cratering, much eroded
• Polar Caps
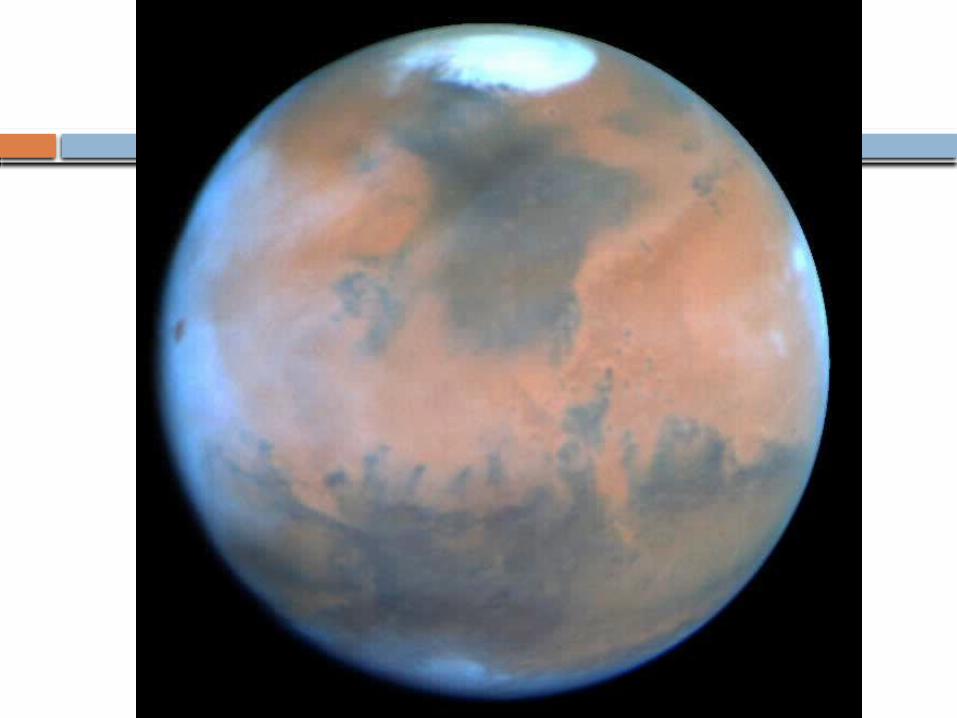
Mars Hubble
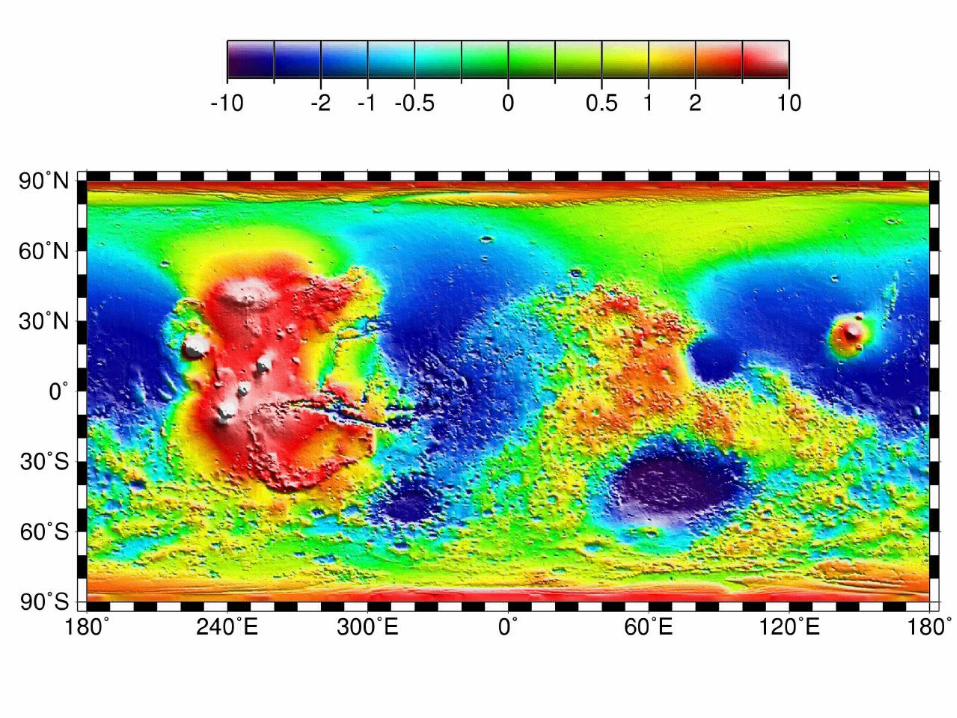
Mars Orbiter Laser Altimeter Topographic Map
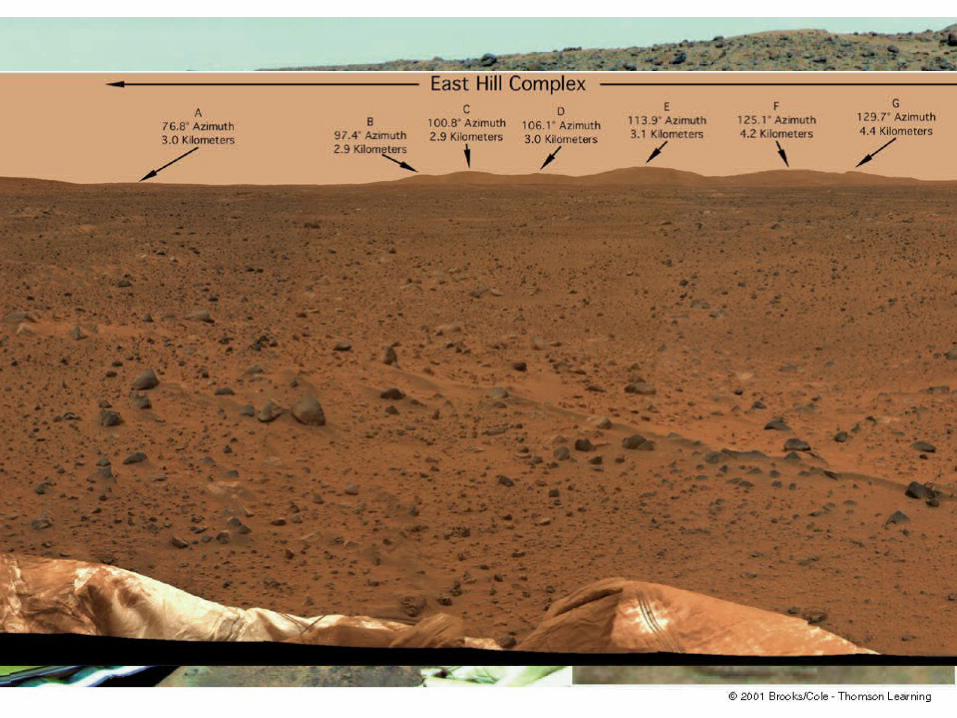
Sojourner at Yogi Seeds Fig 23-15)
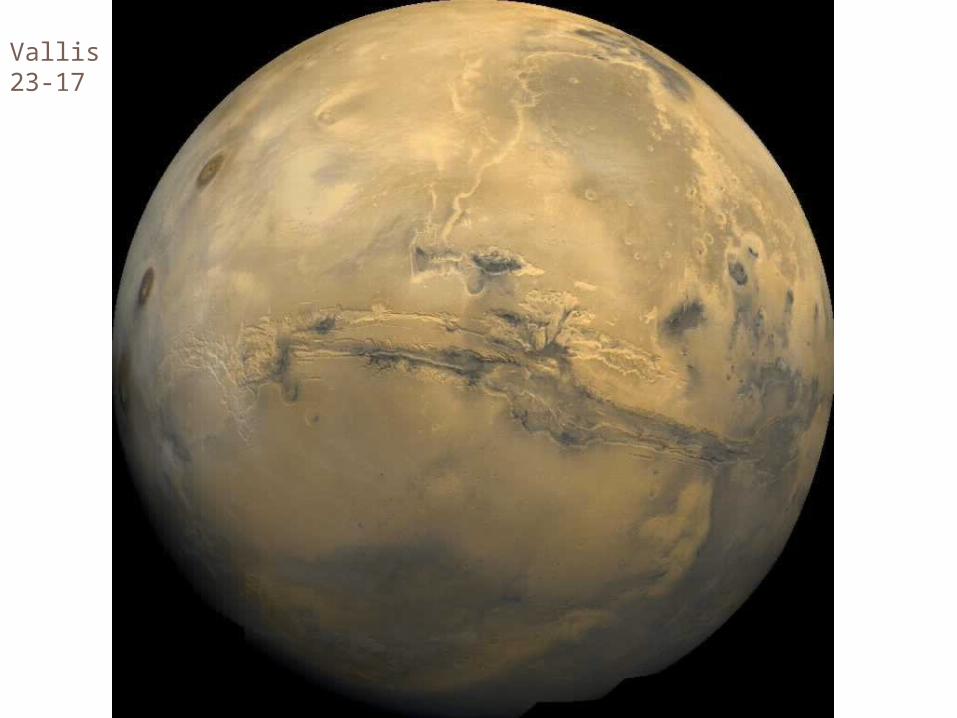
Vallis Marineris (Seeds Fig 23-17
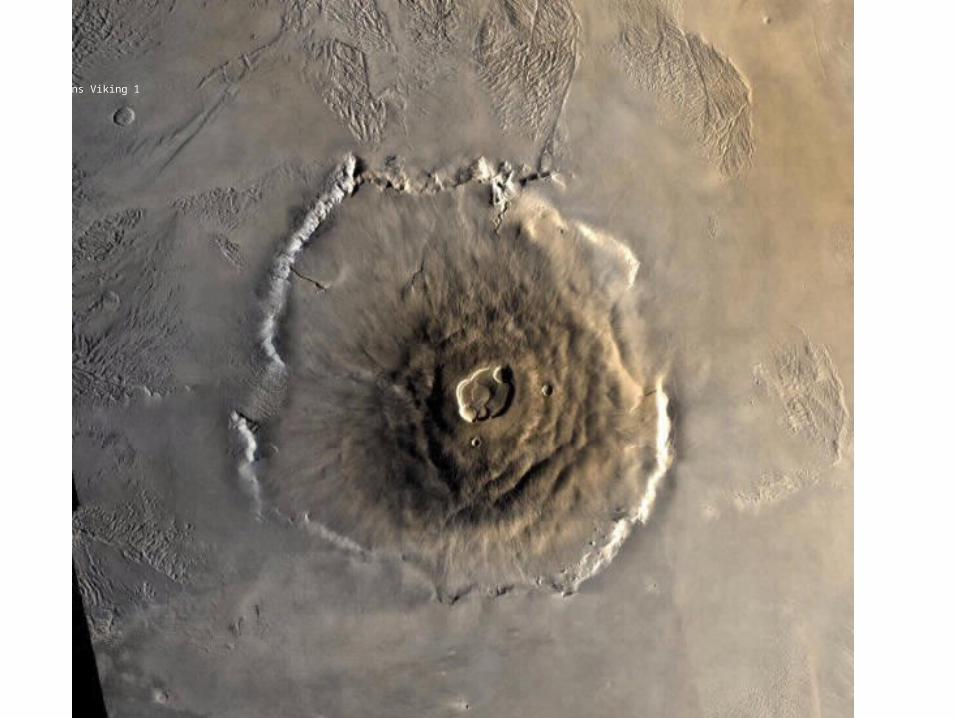
Olympus Mons Viking 1
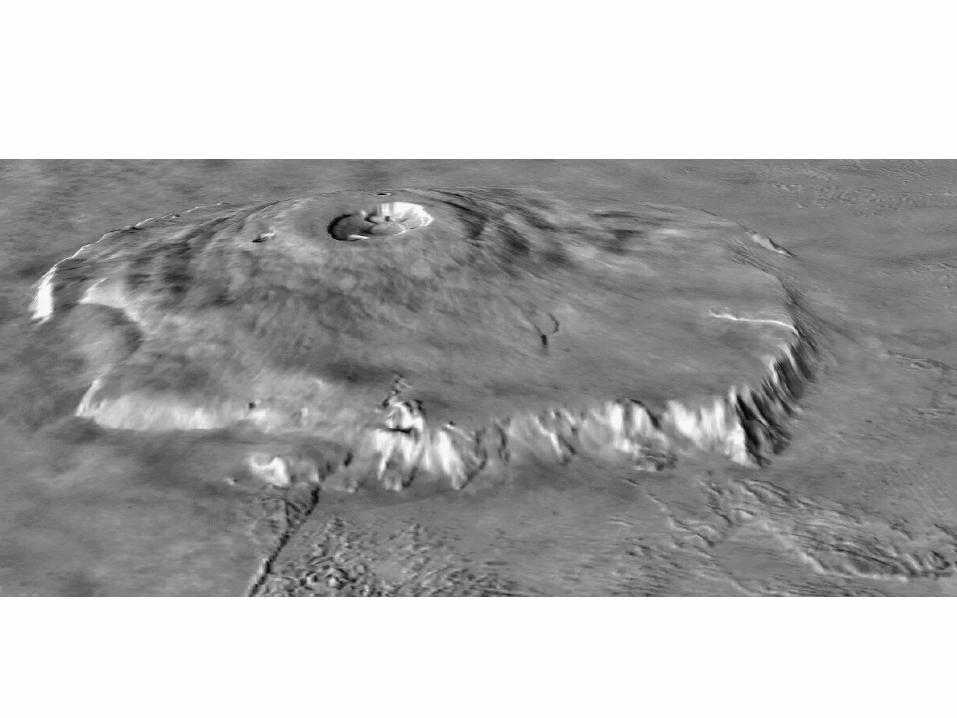
MOLA Generated Perspective of O.Mons
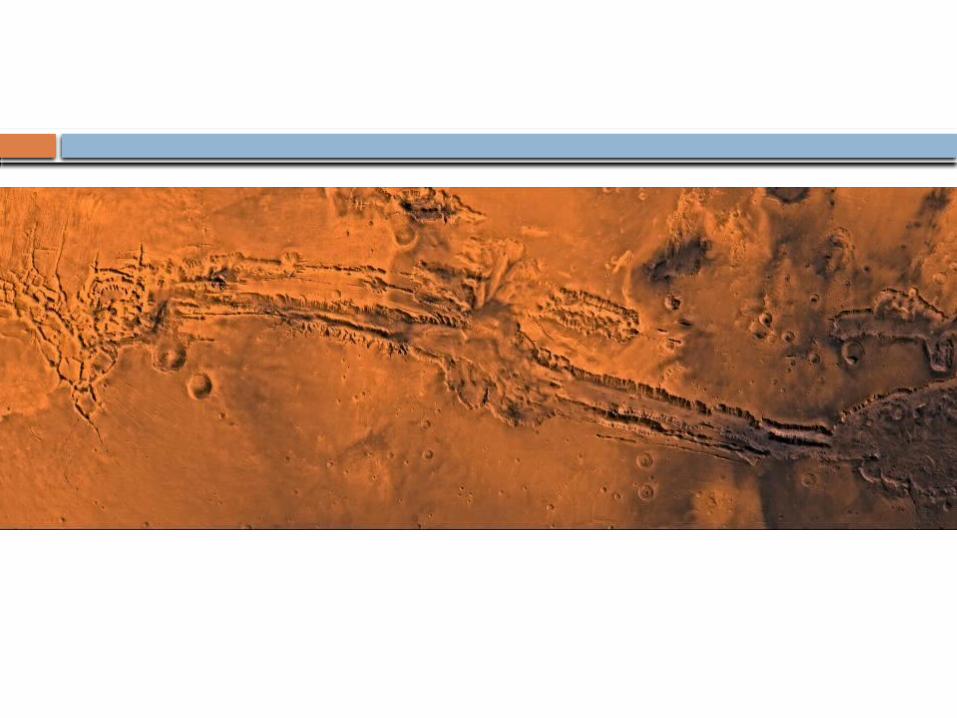
Vallis Marinaris
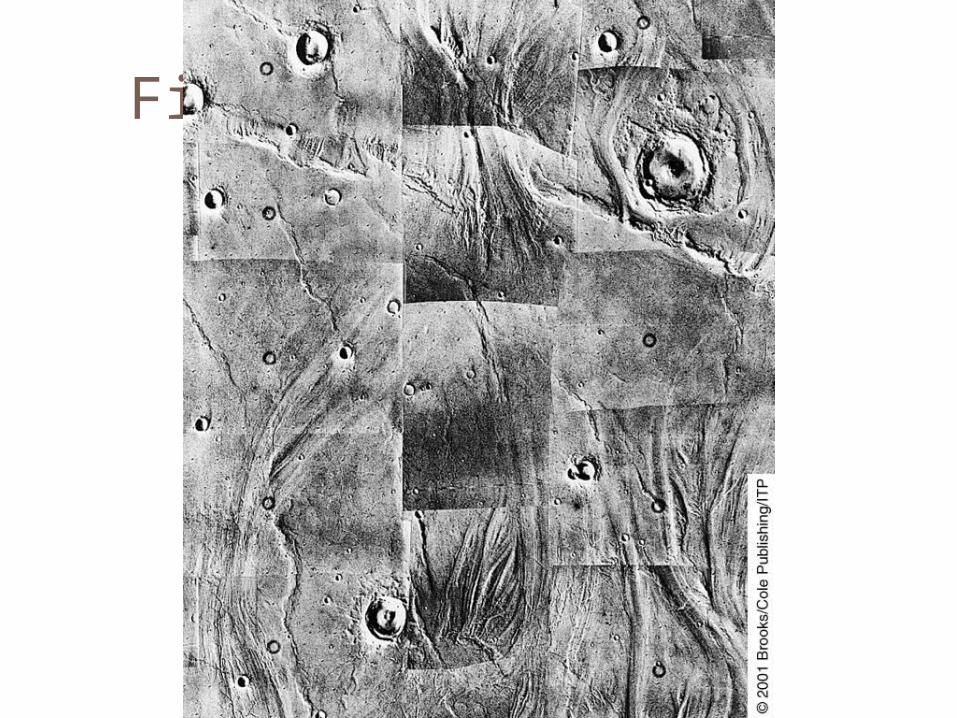
Fig 23-22a
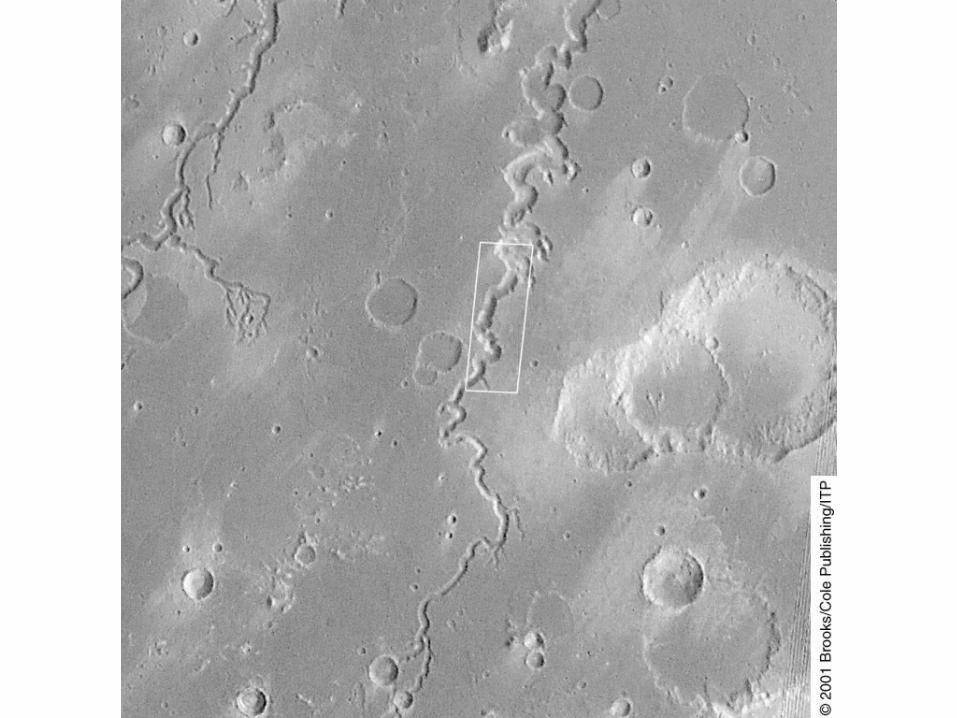
Fig 23-23a
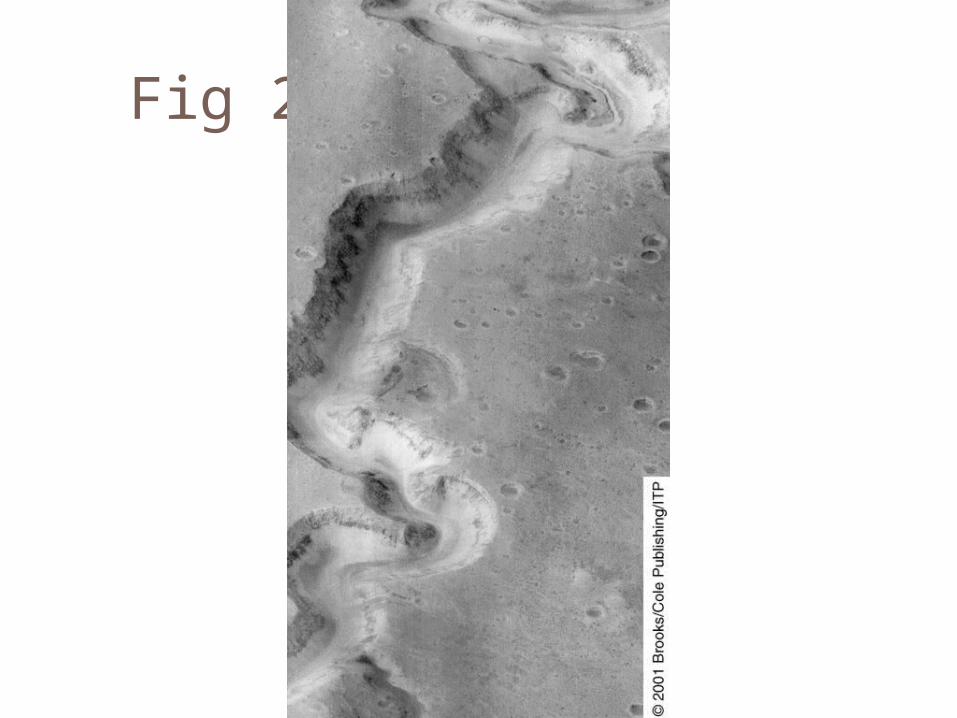
Fig 23-23b
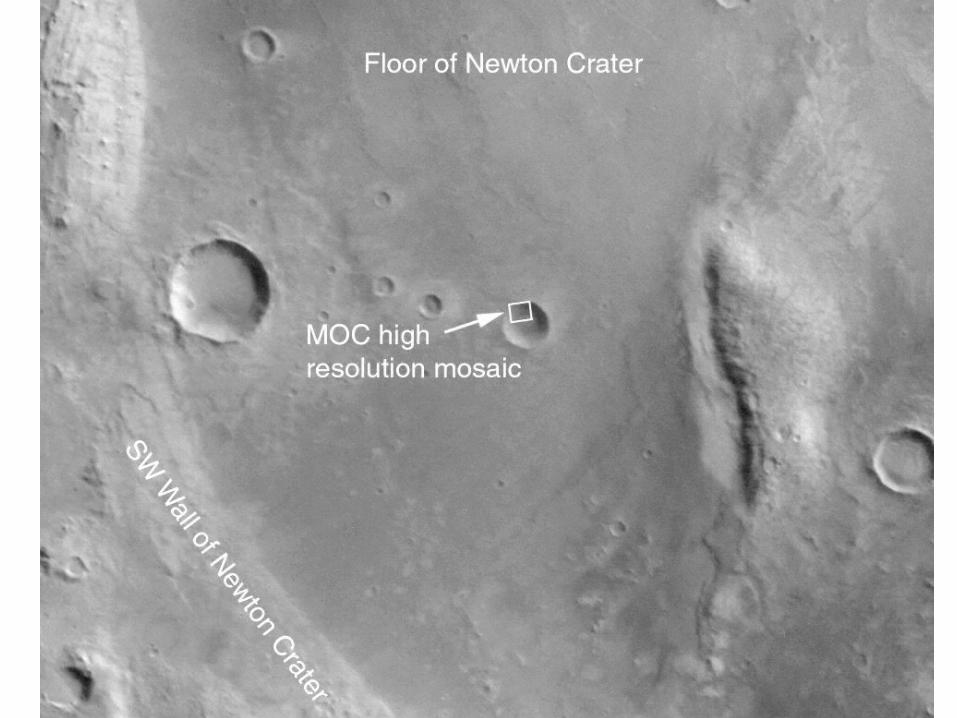
Water in Newton Crater, Context
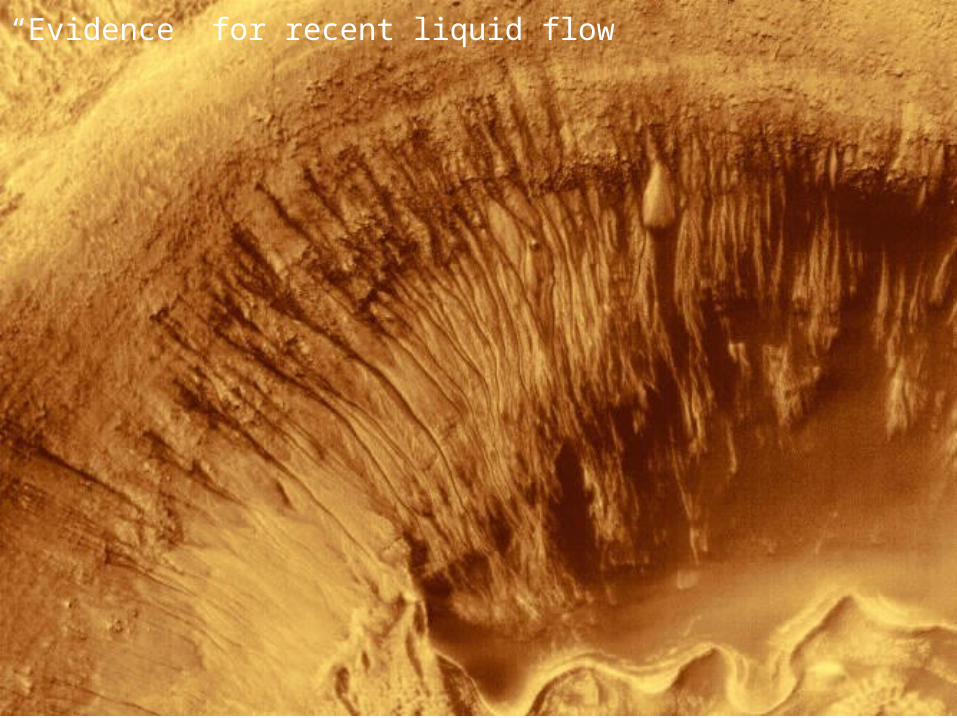
“Evidence” for recent liquid flow
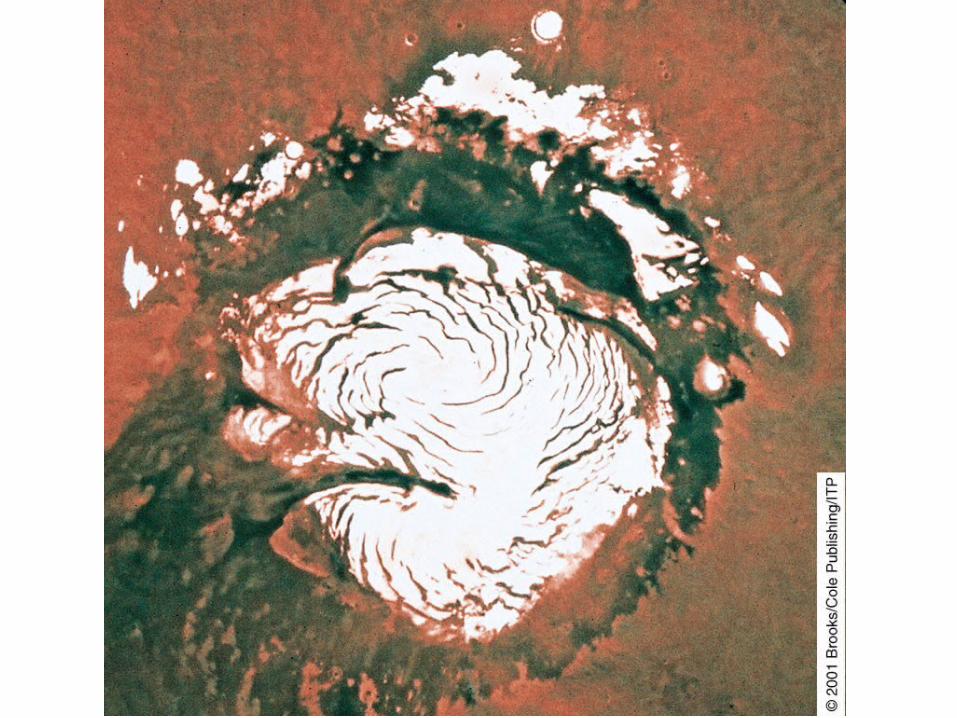
Fig 23-24a
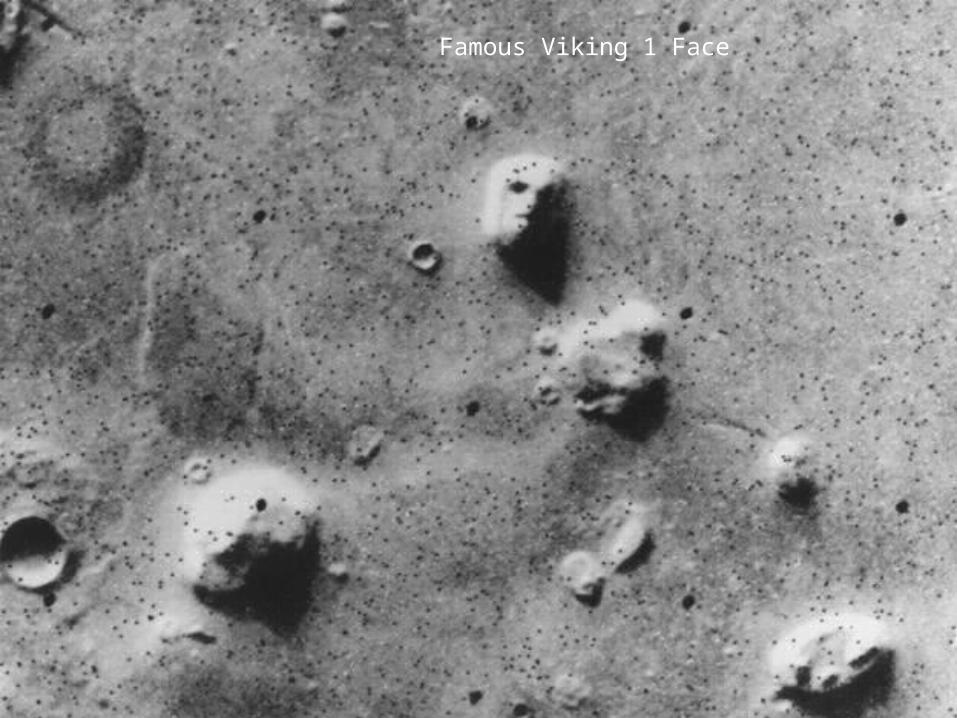
Famous Viking 1 Face
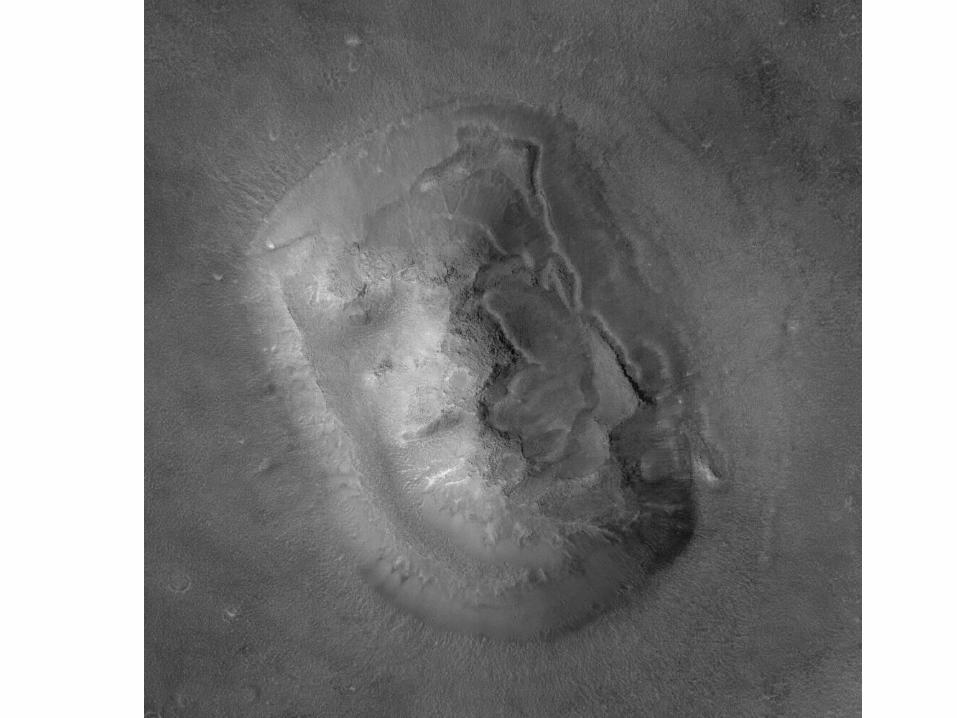
MGS view of the “Face”
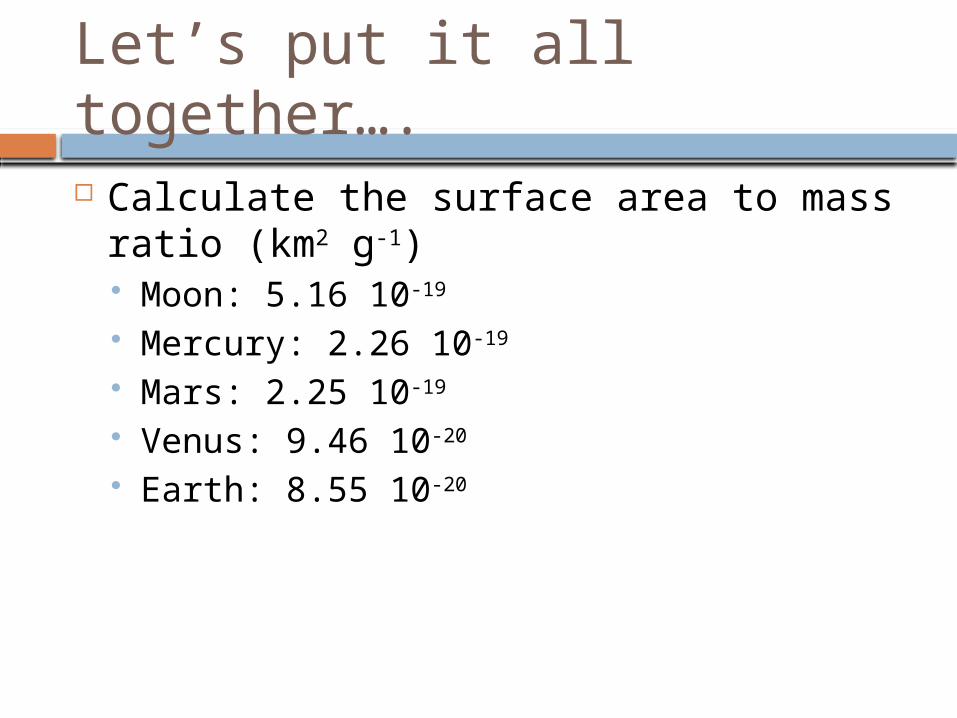
Let’s put it all together….
Calculate the surface area to mass ratio (km2 g-1) Moon: 5.16 10-19
Mercury: 2.26 10-19
Mars: 2.25 10-19
Venus: 9.46 10-20
Earth: 8.55 10-20