Embed Size (px)
Citation preview
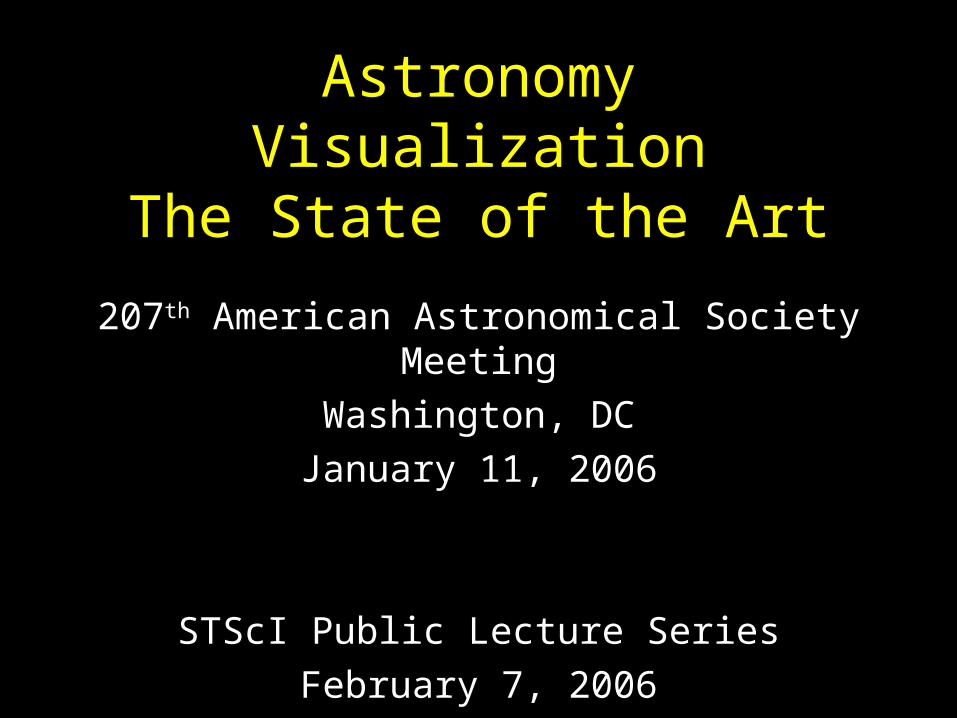
Astronomy VisualizationThe State of the Art
207th American Astronomical Society Meeting
Washington, DC
January 11, 2006
STScI Public Lecture Series
February 7, 2006
Astro-Viz Special Session
• Frank Summers, John Stoke
• Bryan Preston, Lucy Albert, Faith Abney
• Call for Viz – 46 submissions
• Jury Duty
• DVD – 40 visualizations, 2 hours
• Session – 9 visualizations
Scientific Visualization in the
Age of Buzz Lightyear,
Yoda, and Gandalf
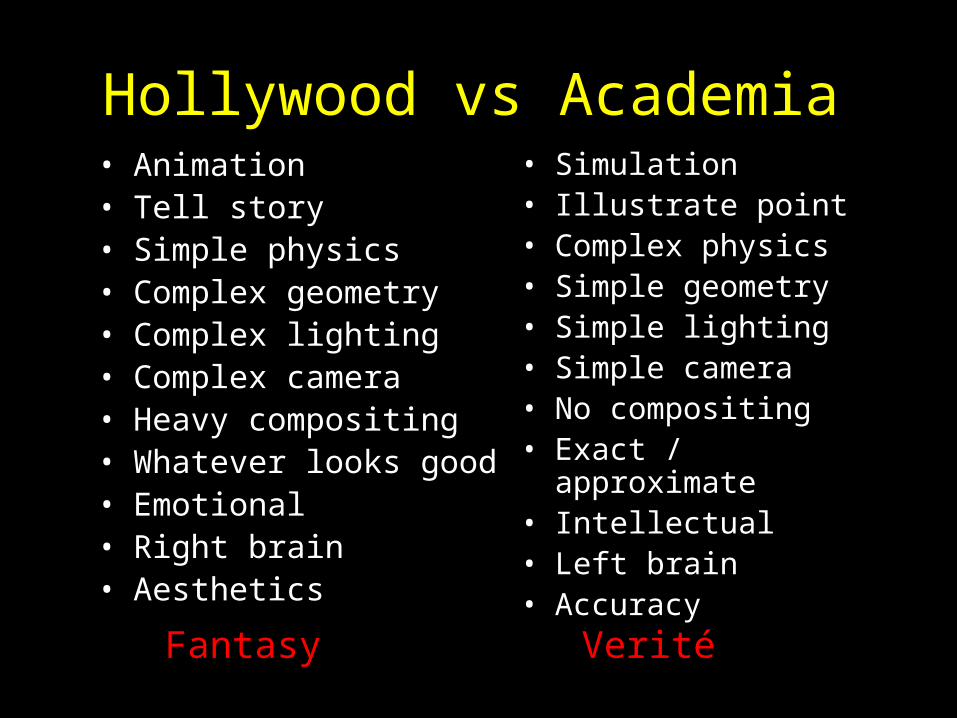
Hollywood vs Academia• Simulation• Illustrate point• Complex physics• Simple geometry• Simple lighting• Simple camera• No compositing• Exact / approximate• Intellectual• Left brain• Accuracy
• Animation• Tell story• Simple physics• Complex geometry• Complex lighting• Complex camera• Heavy compositing• Whatever looks good• Emotional• Right brain• Aesthetics
Fantasy Verité
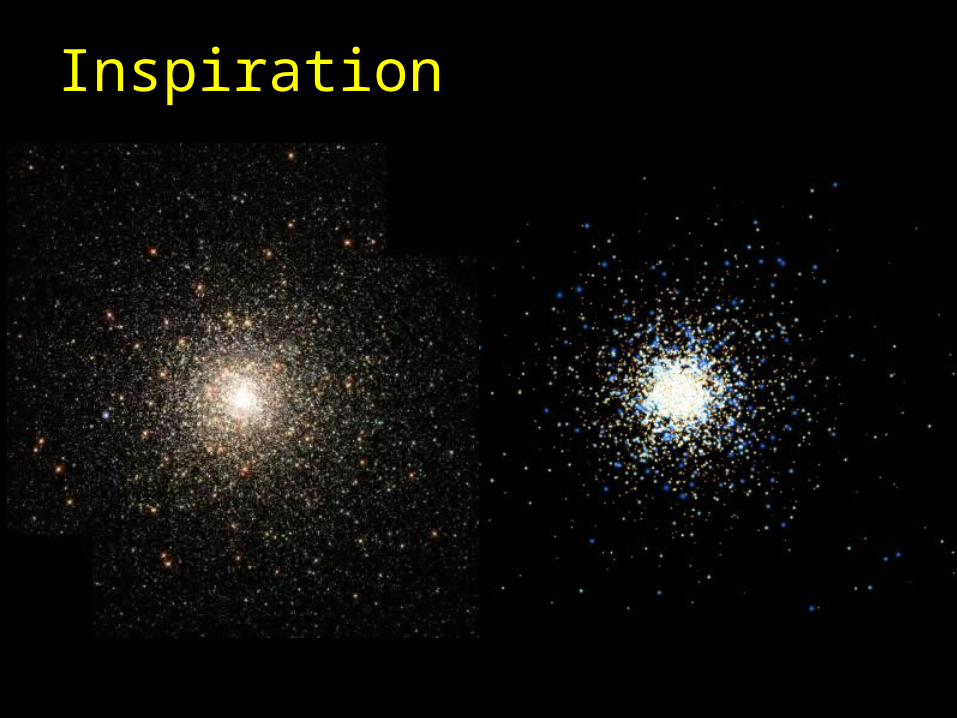
Inspiration
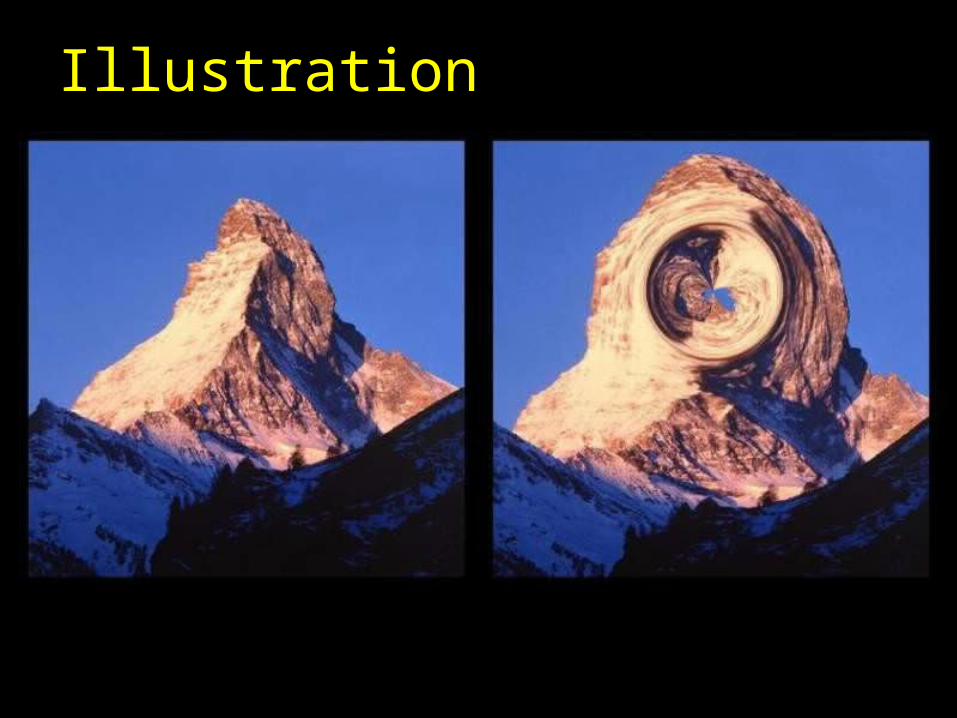
Illustration
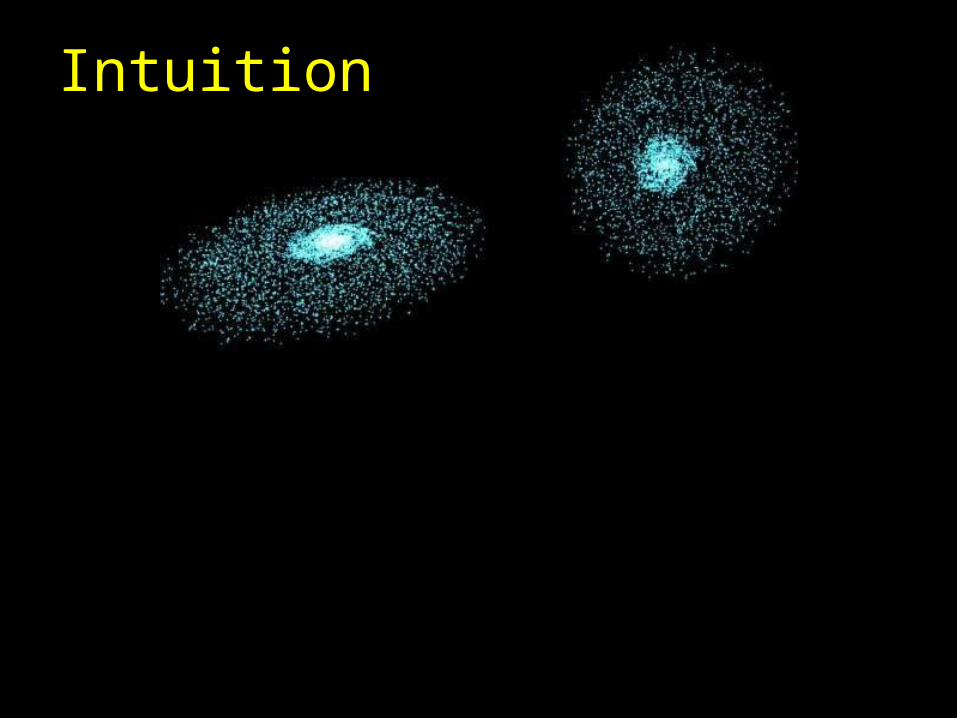
Intuition
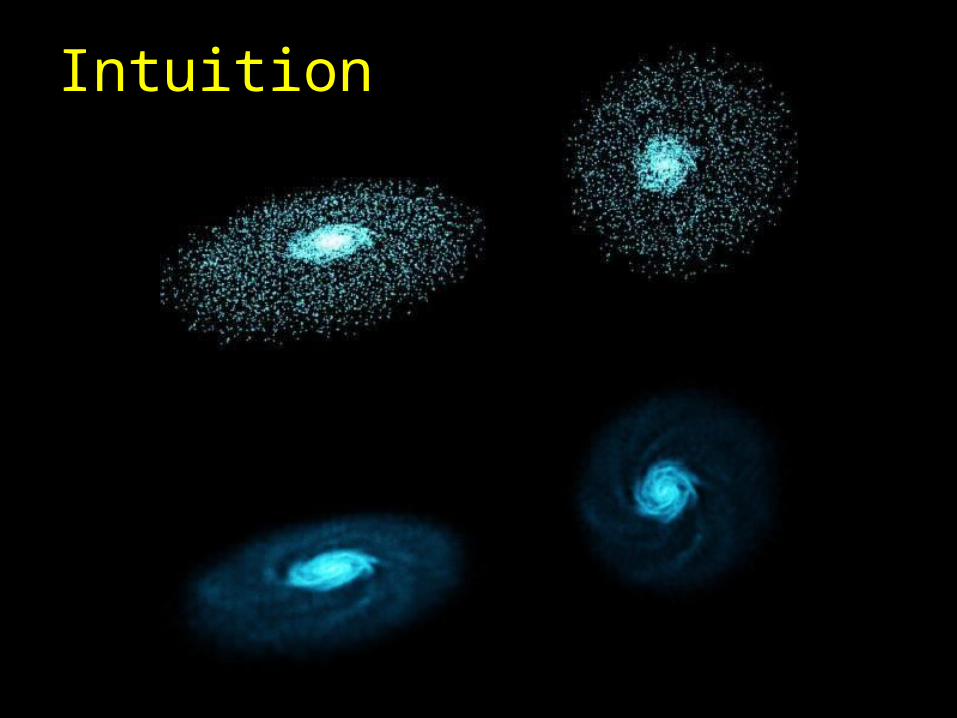
Intuition

Flying Through Valles Marineris
Dana Berry
Skyworks Digital Animation
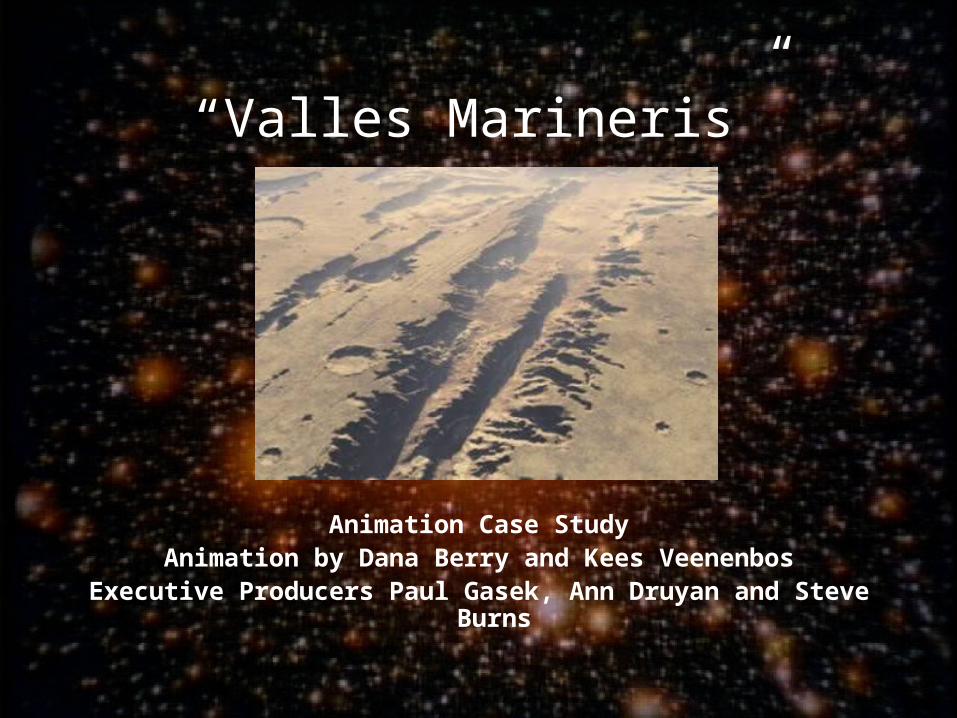
“Valles Marineris”
Animation Case StudyAnimation by Dana Berry and Kees Veenenbos
Executive Producers Paul Gasek, Ann Druyan and Steve Burns
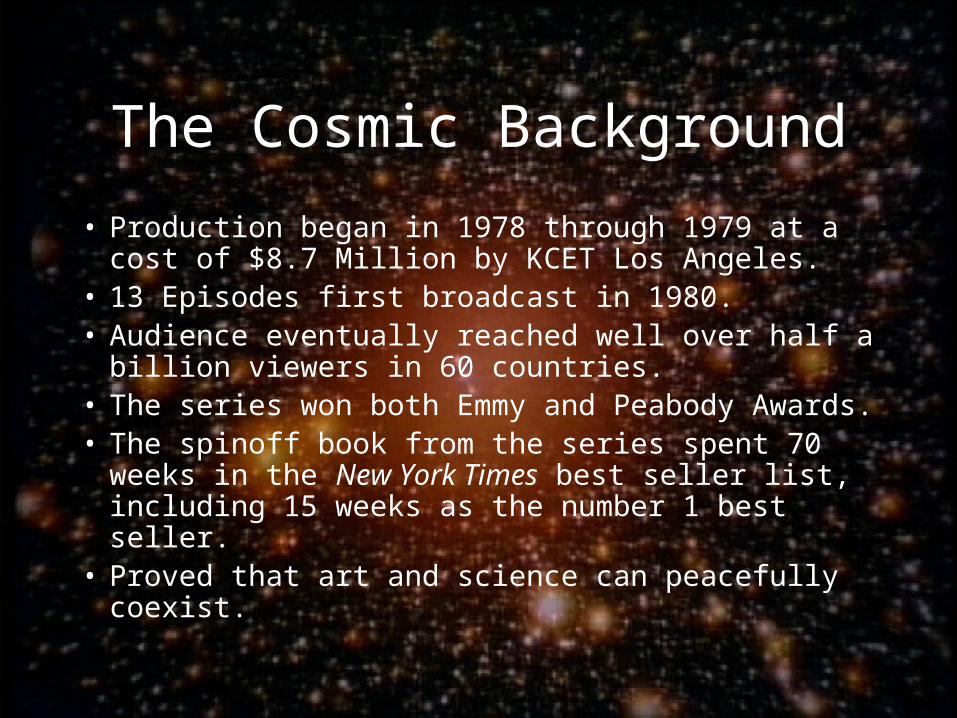
The Cosmic Background
• Production began in 1978 through 1979 at a cost of $8.7 Million by KCET Los Angeles.
• 13 Episodes first broadcast in 1980.• Audience eventually reached well over half a billion
viewers in 60 countries. • The series won both Emmy and Peabody Awards.• The spinoff book from the series spent 70 weeks in
the New York Times best seller list, including 15 weeks as the number 1 best seller.
• Proved that art and science can peacefully coexist.
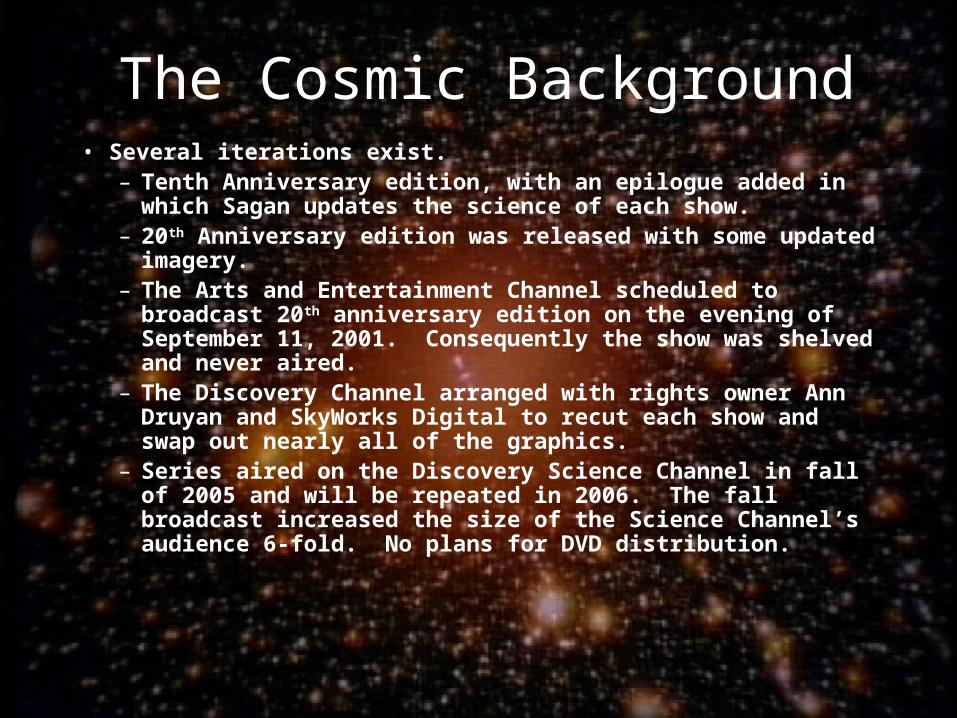
The Cosmic Background• Several iterations exist.
– Tenth Anniversary edition, with an epilogue added in which Sagan updates the science of each show.
– 20th Anniversary edition was released with some updated imagery.– The Arts and Entertainment Channel scheduled to broadcast 20th
anniversary edition on the evening of September 11, 2001. Consequently the show was shelved and never aired.
– The Discovery Channel arranged with rights owner Ann Druyan and SkyWorks Digital to recut each show and swap out nearly all of the graphics.
– Series aired on the Discovery Science Channel in fall of 2005 and will be repeated in 2006. The fall broadcast increased the size of the Science Channel’s audience 6-fold. No plans for DVD distribution.
The Task:
• PBS non-commercial format 58 minutes to be edited for commercial 44 minute format: 14 minutes to be trimmed from each show.
• Prune scientifically outdated portions of the show. • Swap original graphics and animation with newer,
more scientifically correct visualizations.• Produce 164 new animations 5 months within small,
finite budget.• Minimize impact on other concurrent in-house
productions.
Valles MarinerisGraphics Update Case Study
• 3 kinds of science visualization:
– Data visualization, simulation: reveals information hidden within a data set.
– Pedagogical animation: teaches us something.
– Experiential animation. Emphasizes emotion, drama and art. Cosmos animation is experiential.
Valles MarinerisGraphics Update Case Study
• Make decision to replace existing studio model footage.• Plan production strategy and choose production tools.
– Storyboards– Source images– Division of labor
• Build accurate 3D model of Valles Marineris Topography.• Add correct color for ground, lighting and atmospherics. • Choreograph Camera Move.• Develop Render Strategy.
Valles MarinerisGraphics Update Case Study
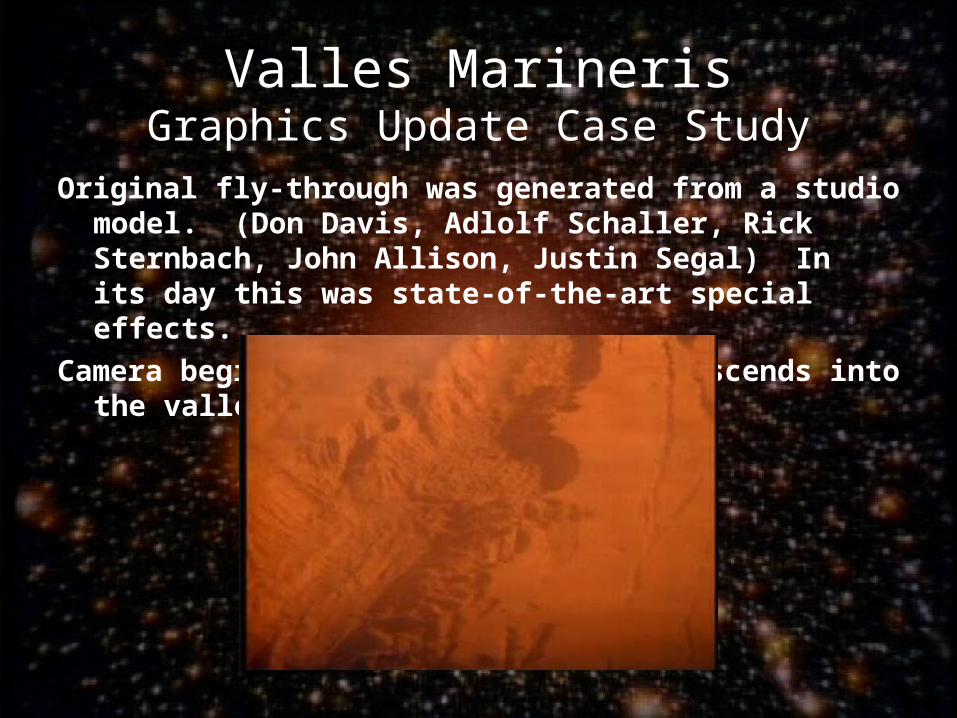
Original fly-through was generated from a studio model. (Don Davis, Adlolf Schaller, Rick Sternbach, John Allison, Justin Segal) In its day this was state-of-the-art special effects.
Camera begins at high altitude and descends into the valley.
Valles MarinerisGraphics Update Case Study
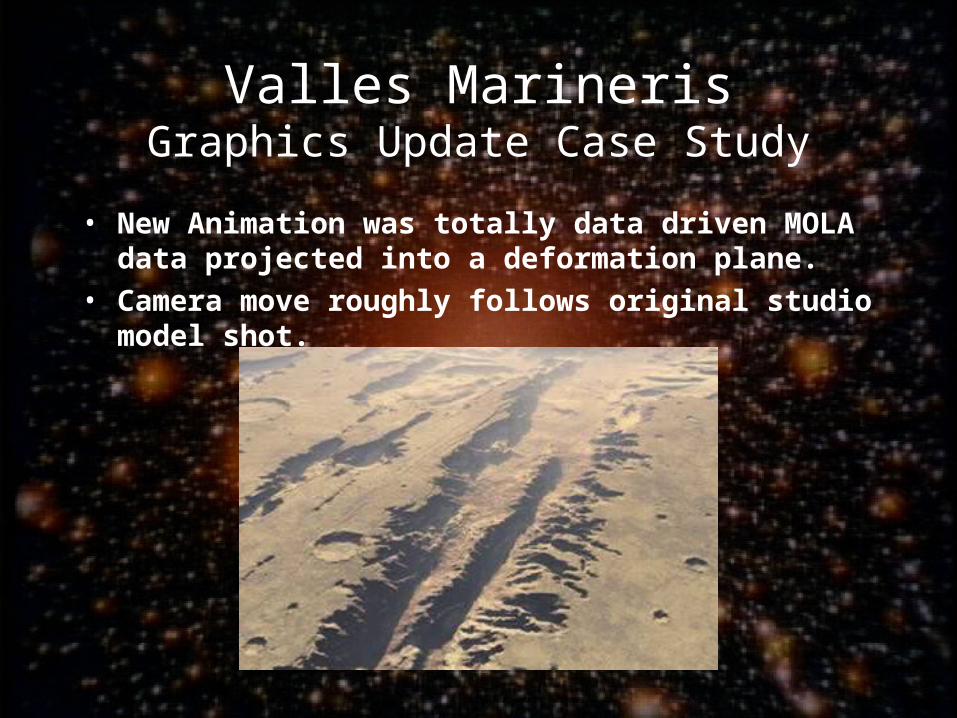
• New Animation was totally data driven MOLA data projected into a deformation plane.
• Camera move roughly follows original studio model shot.
Valles MarinerisGraphics Update Case Study
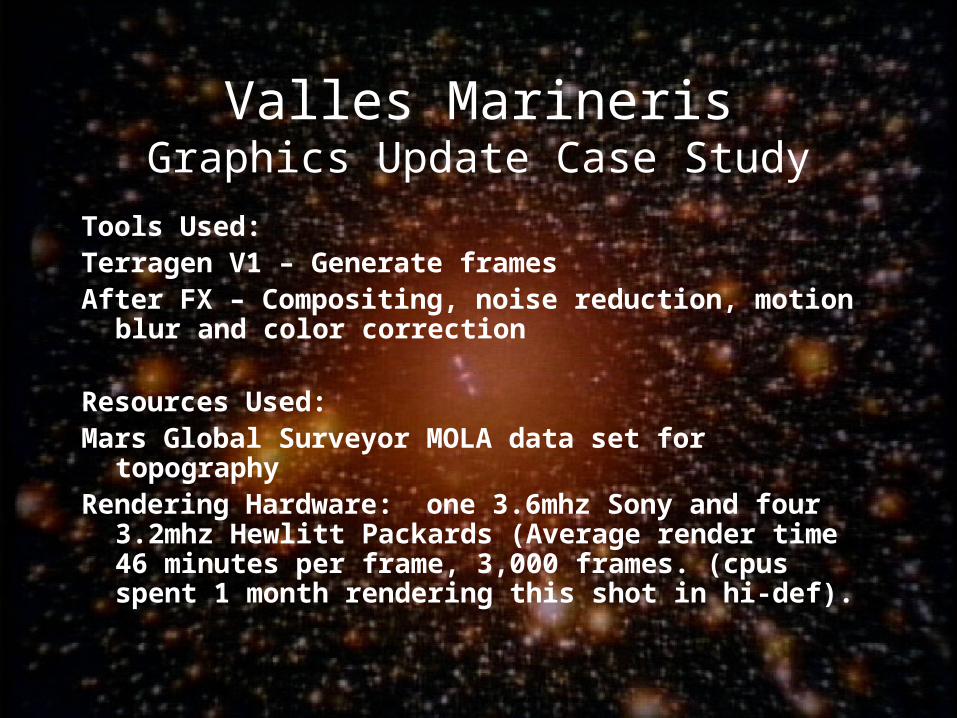
Tools Used:Terragen V1 – Generate framesAfter FX – Compositing, noise reduction, motion blur and
color correction
Resources Used: Mars Global Surveyor MOLA data set for topographyRendering Hardware: one 3.6mhz Sony and four 3.2mhz
Hewlitt Packards (Average render time 46 minutes per frame, 3,000 frames. (cpus spent 1 month rendering this shot in hi-def).
Valles MarinerisGraphics Update Case Study
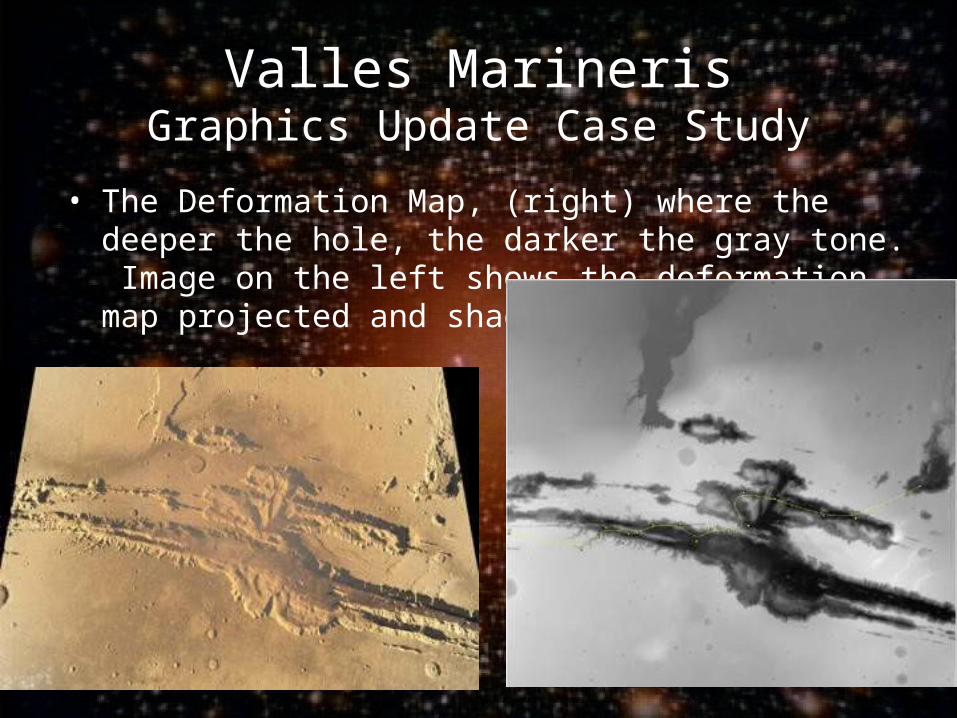
• The Deformation Map, (right) where the deeper the hole, the darker the gray tone. Image on the left shows the deformation map projected and shaded.
Valles MarinerisGraphics Update Case Study
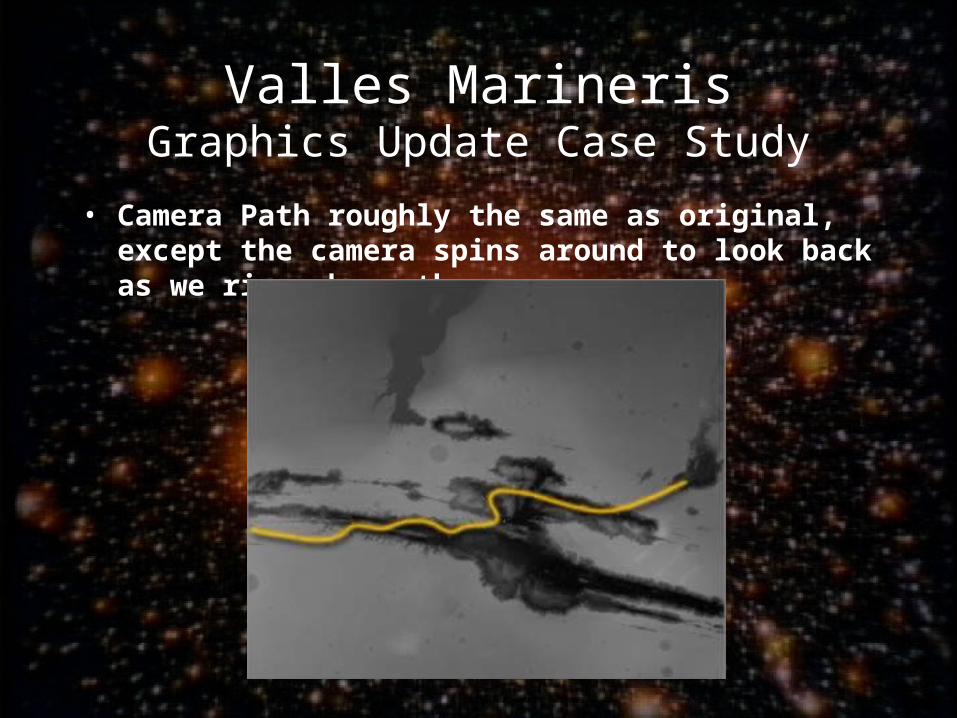
• Camera Path roughly the same as original, except the camera spins around to look back as we rise above the canyon.
Valles MarinerisGraphics Update Case Study
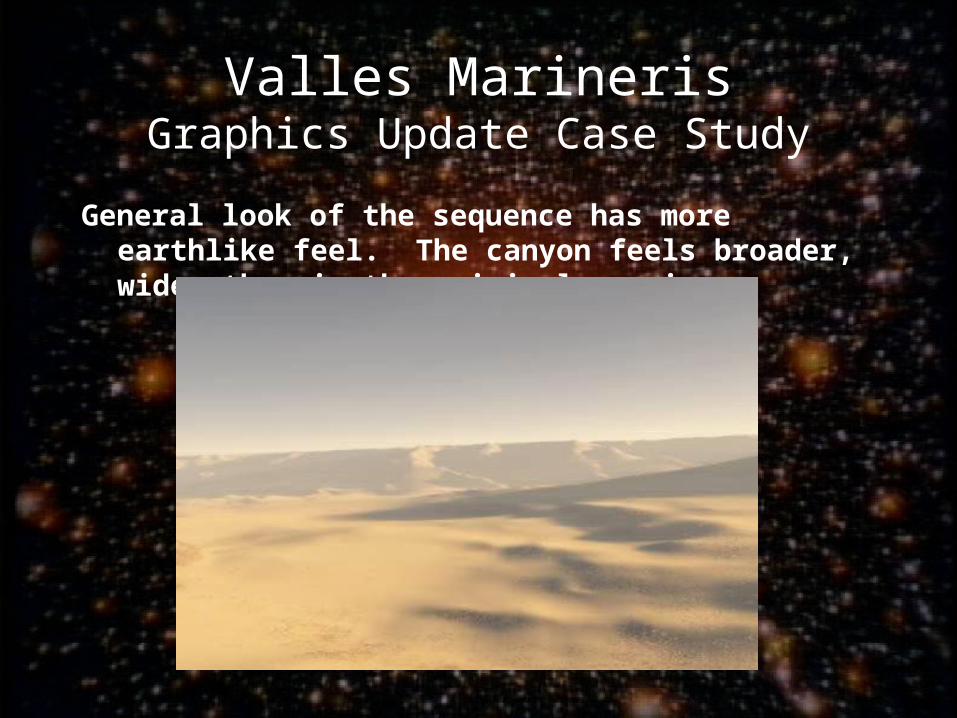
General look of the sequence has more earthlike feel. The canyon feels broader, wider than in the original version.
Valles MarinerisGraphics Update Case Study
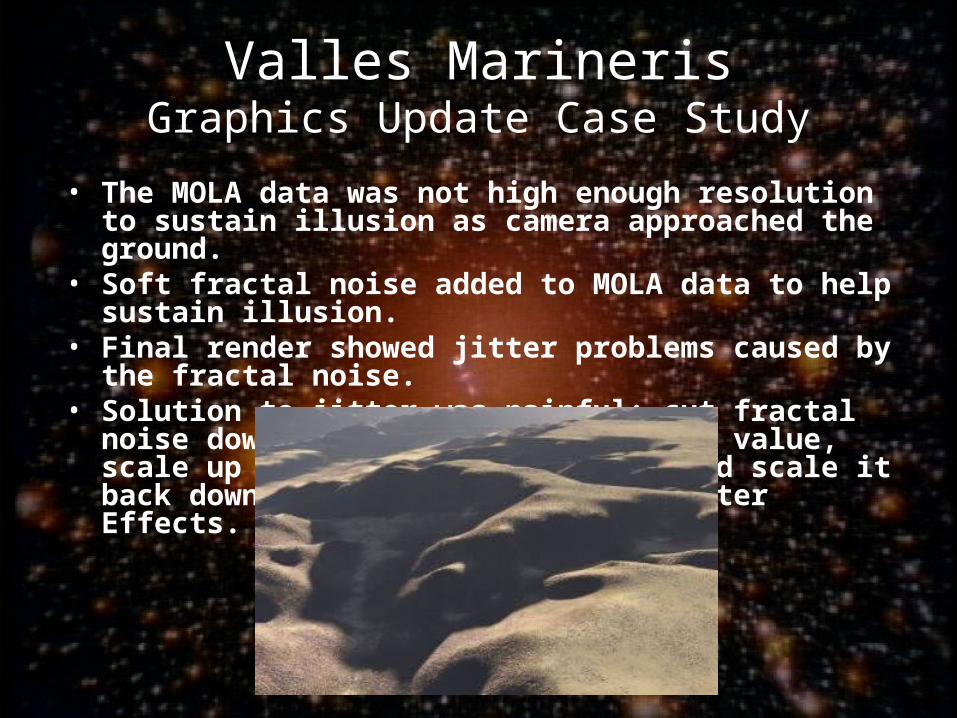
• The MOLA data was not high enough resolution to sustain illusion as camera approached the ground.
• Soft fractal noise added to MOLA data to help sustain illusion.• Final render showed jitter problems caused by the fractal noise.• Solution to jitter was painful: cut fractal noise down to .001% of
its original value, scale up original render by 200% and scale it back down and add motion blur in After Effects.
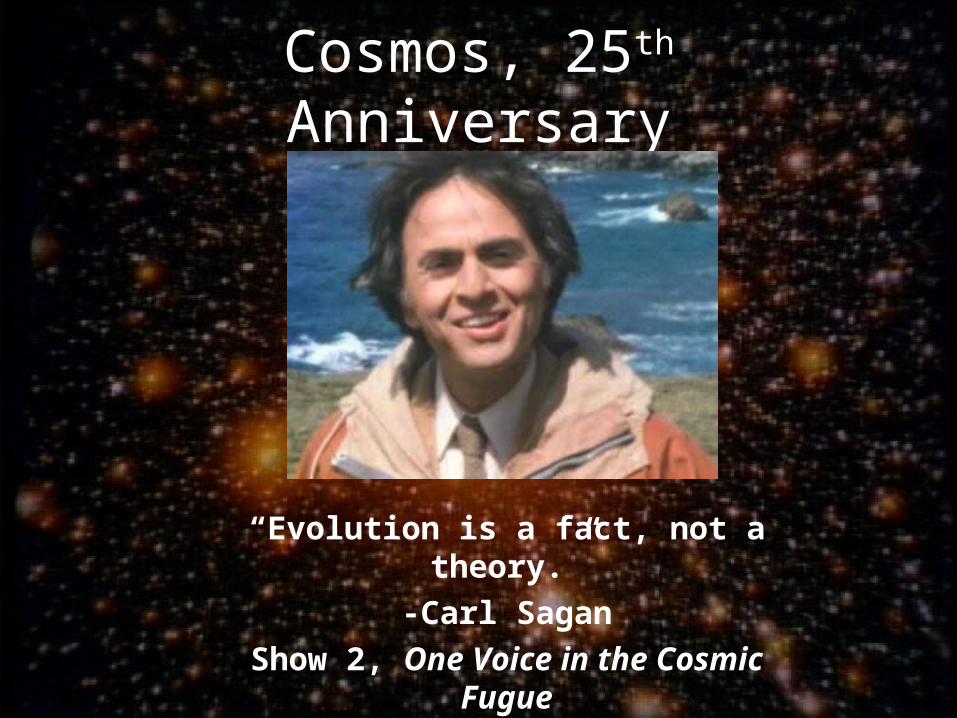
Cosmos, 25th Anniversary
“Evolution is a fact, not a theory.”
-Carl Sagan
Show 2, One Voice in the Cosmic Fugue

Strange New Worlds
Robert Hurt
Spitzer Science Center
The Art of Science• Artist’s Concepts Are Powerful
Communications Tool– A picture can help explain complex result at a glance
– A movie can tell more in short clip
– Aesthetic appeal can stimulate interest to read more
• Developing the Concept– Identify key science themes of result
– Artist, PA rep, & PI discuss visualization
• Converge on single image to tell story
• Develop “bullet list” of science results for image
• Ongoing artist/scientist interaction can speed convergence on final product
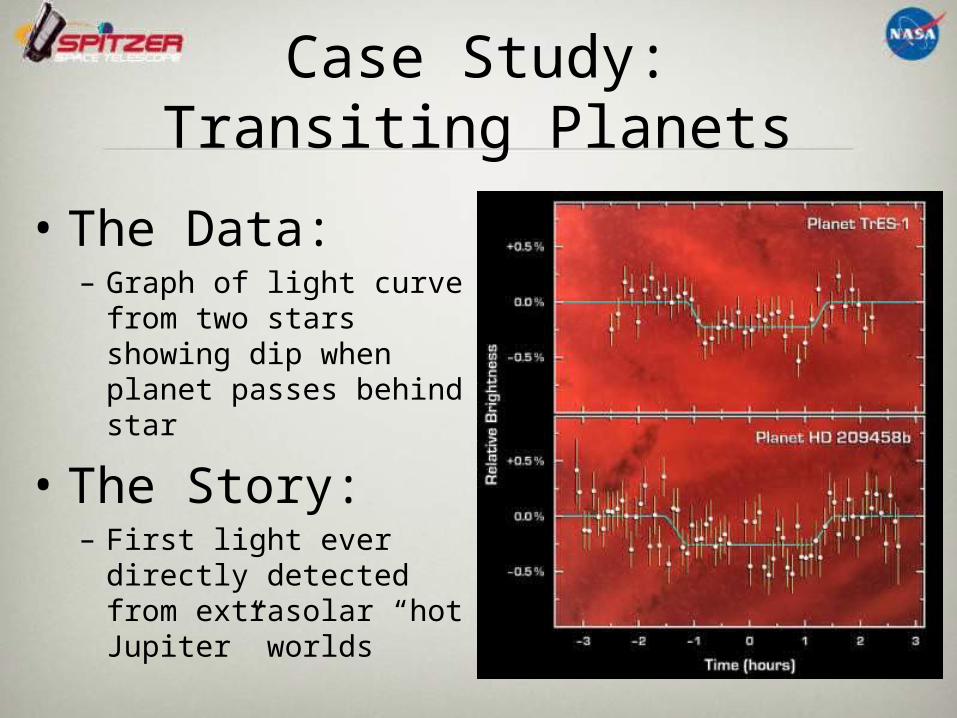
Case Study:Transiting Planets
• The Data:– Graph of light curve
from two stars showing dip when planet passes behind star
• The Story:– First light ever
directly detected from extrasolar “hot Jupiter” worlds
Case Study:Transiting Planets
• Goal for the animation:– Visually explain the significance of the data graphs
• Science Bullet Points:– Planet is close to star, Jupiter-sized but very different from
Jupiter– Visible light: only reflected light from sun– Infrared light: planet is self-luminous– Improved viewing contrast in the infrared– Geometry of the transiting system: we see planet pass
behind star– Dip in light curve implies we see light from planet (blended
with light from the star)
Case Study:Transiting Planets
• First Sequence:– “Dramatic” shot showing system.– Start in familiar visible light, then transition to infrared view– Show best-guess infrared “color”– Planetary atmosphere derived from atmospheric simulation of “hot
Jupiters”
• Second Sequence:– Maintain infrared view through movie– Start with familiar overhead view with orbit for reference– Pivot down to our line-of-sight, drop orbit once the geometry is
clear– Overlay time-synchronized graph as planet passes behind star

Galactic Center Fly-in
Andrew Hanson
Indiana University, Bloomington
Priscilla Frisch
University of Chicago
2006 AAS Washington DC
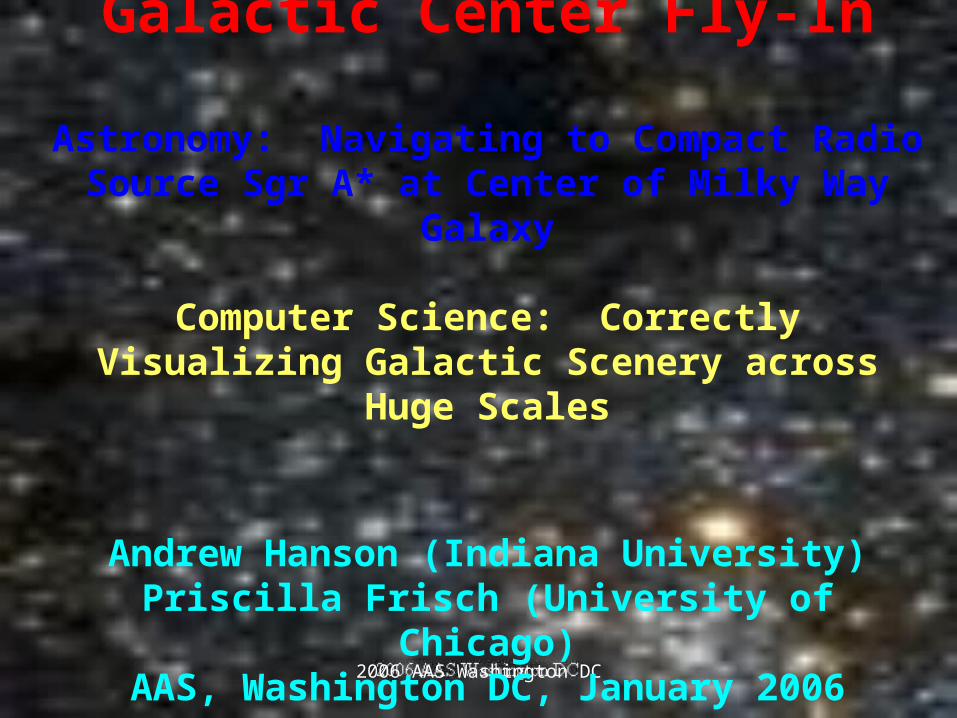
Galactic Center Fly-In
Astronomy: Navigating to Compact Radio Source Sgr A* at Center of Milky Way
Galaxy
Computer Science: Correctly Visualizing Galactic Scenery across Huge Scales
Andrew Hanson (Indiana University)Priscilla Frisch (University of Chicago)
AAS, Washington DC, January 2006
2006 AAS Washington DC
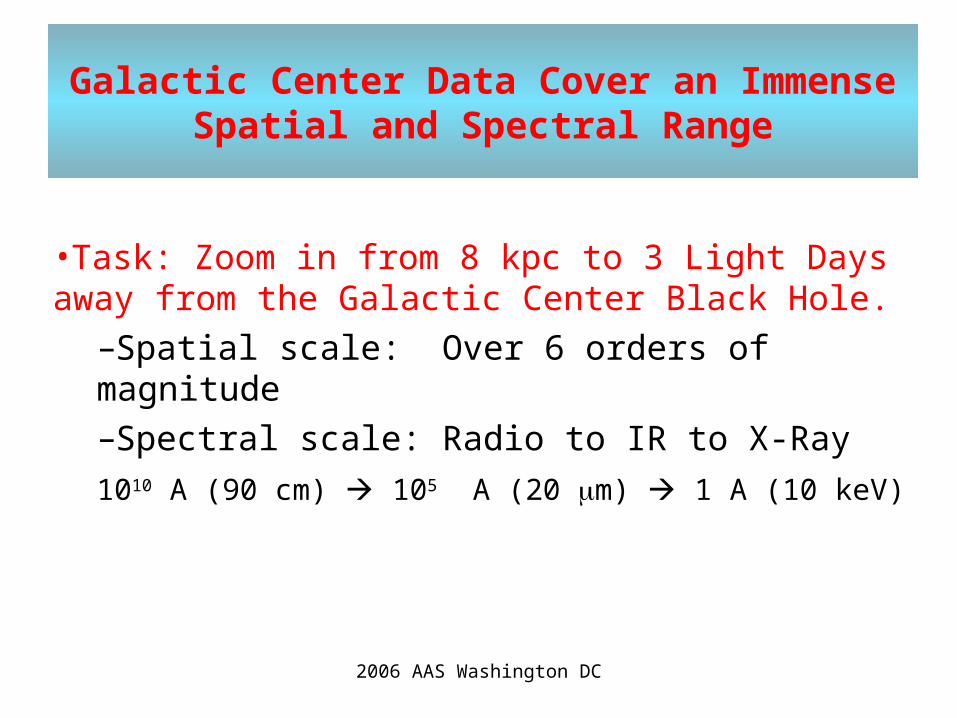
Galactic Center Data Cover an Immense Spatial and Spectral Range
•Task: Zoom in from 8 kpc to 3 Light Days away from the Galactic Center Black Hole.
–Spatial scale: Over 6 orders of magnitude–Spectral scale: Radio to IR to X-Ray
1010 A (90 cm) 105 A (20 m) 1 A (10 keV)
2006 AAS Washington DC
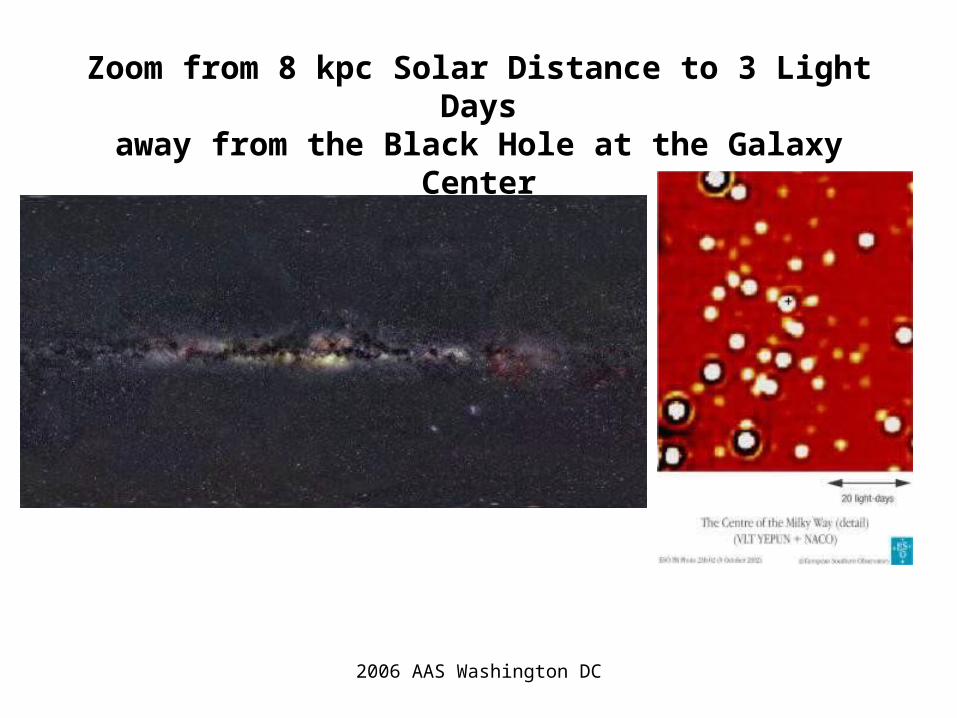
Zoom from 8 kpc Solar Distance to 3 Light Days
away from the Black Hole at the Galaxy Center
Axel Mellinger Milky WayGalaxy Montage (many kpc)
2006 AAS Washington DC
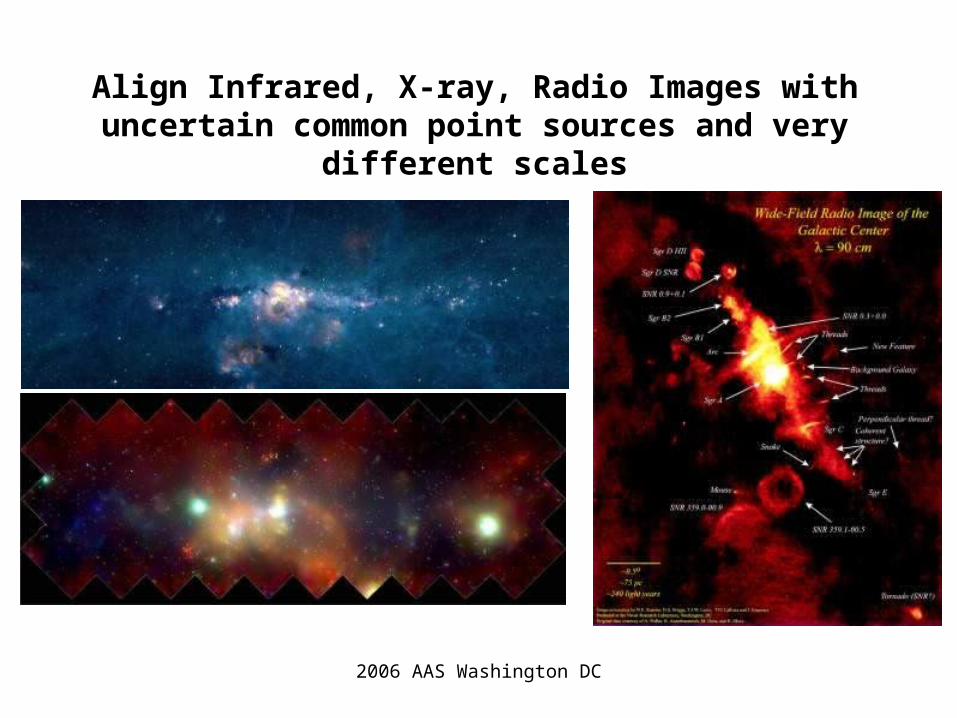
Align Infrared, X-ray, Radio Images with uncertain common point sources and very
different scales
2006 AAS Washington DC
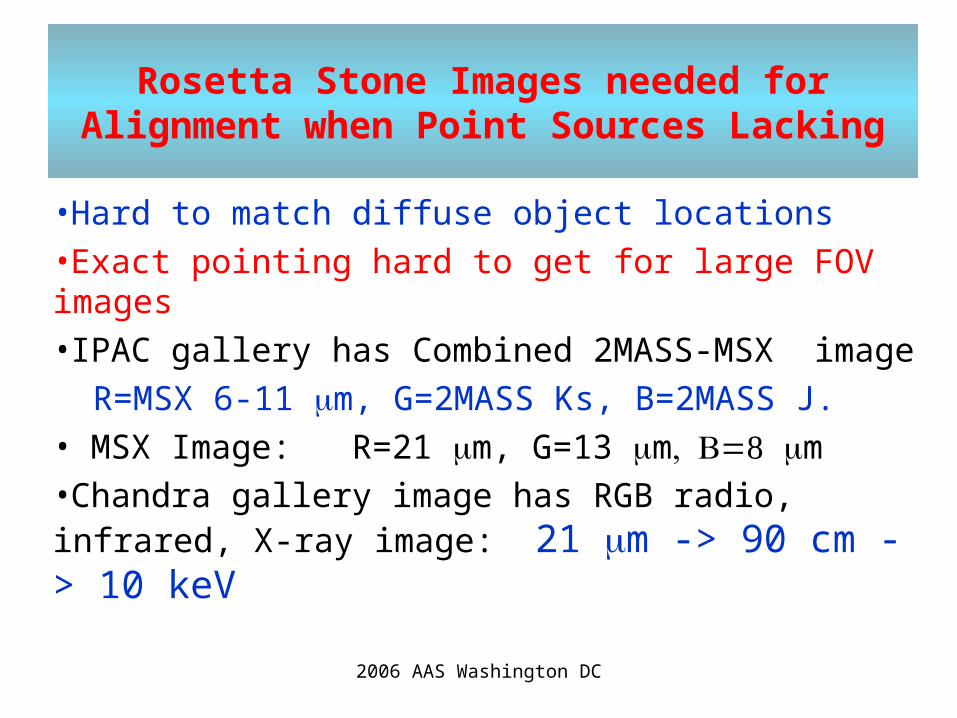
Rosetta Stone Images needed for Alignment when Point Sources Lacking
•Hard to match diffuse object locations•Exact pointing hard to get for large FOV images•IPAC gallery has Combined 2MASS-MSX image R=MSX 6-11 m, G=2MASS Ks, B=2MASS J.• MSX Image: R=21 m, G=13 m m•Chandra gallery image has RGB radio, infrared, X-ray image: 21 m -> 90 cm -> 10 keV
2006 AAS Washington DC
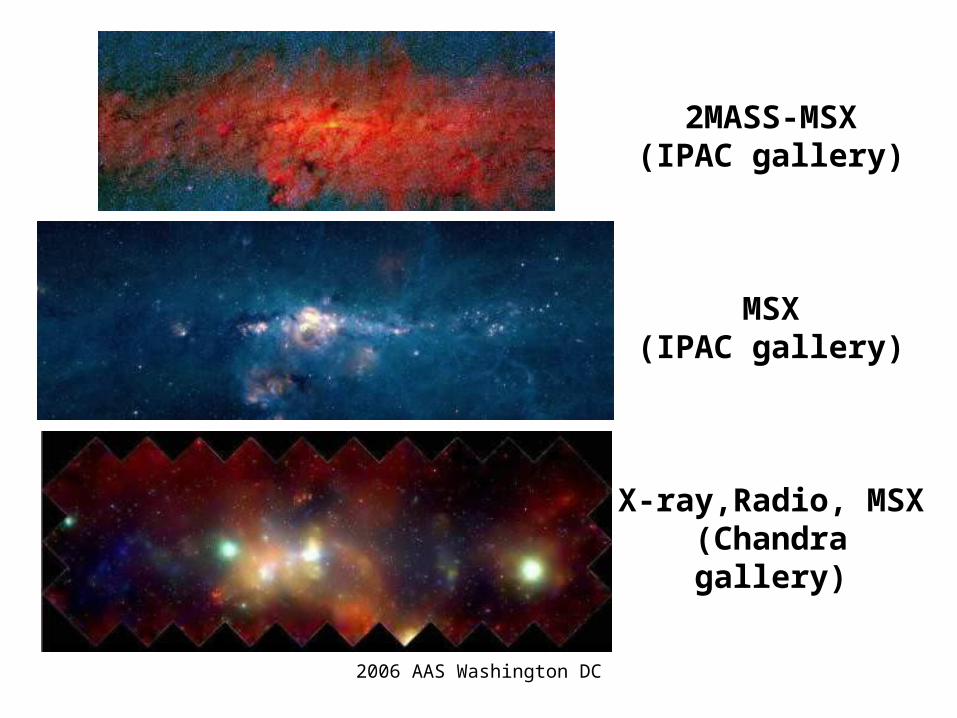
2MASS-MSX(IPAC gallery)
MSX(IPAC gallery)
X-ray,Radio, MSX
(Chandra gallery)
2006 AAS Washington DC
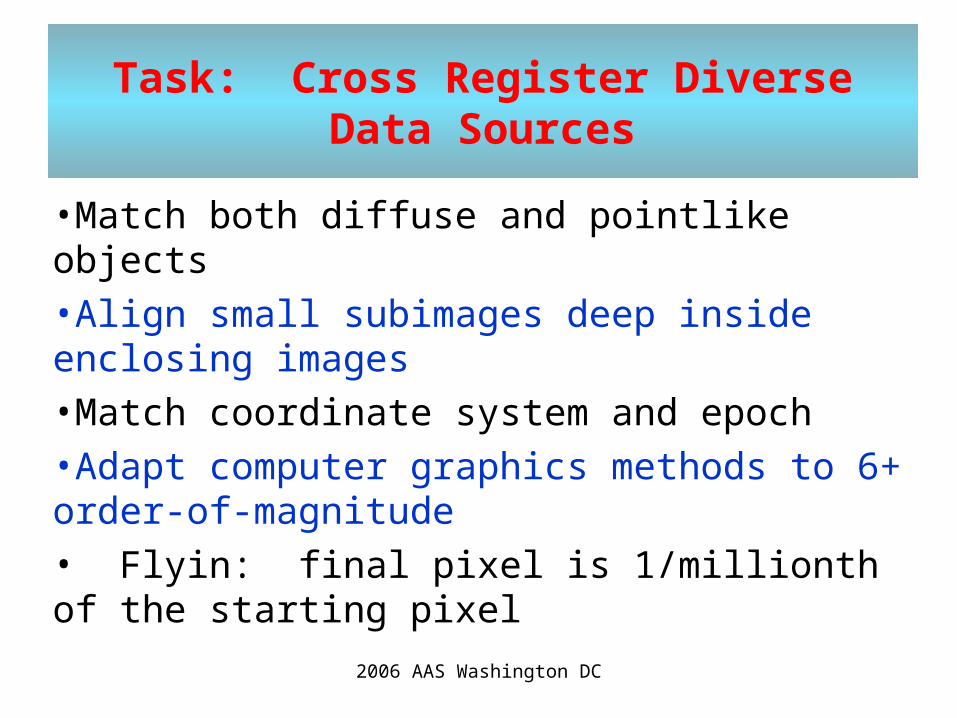
Task: Cross Register Diverse Data Sources
•Match both diffuse and pointlike objects•Align small subimages deep inside enclosing images•Match coordinate system and epoch•Adapt computer graphics methods to 6+ order-of-magnitude• Flyin: final pixel is 1/millionth of the starting pixel
2006 AAS Washington DC
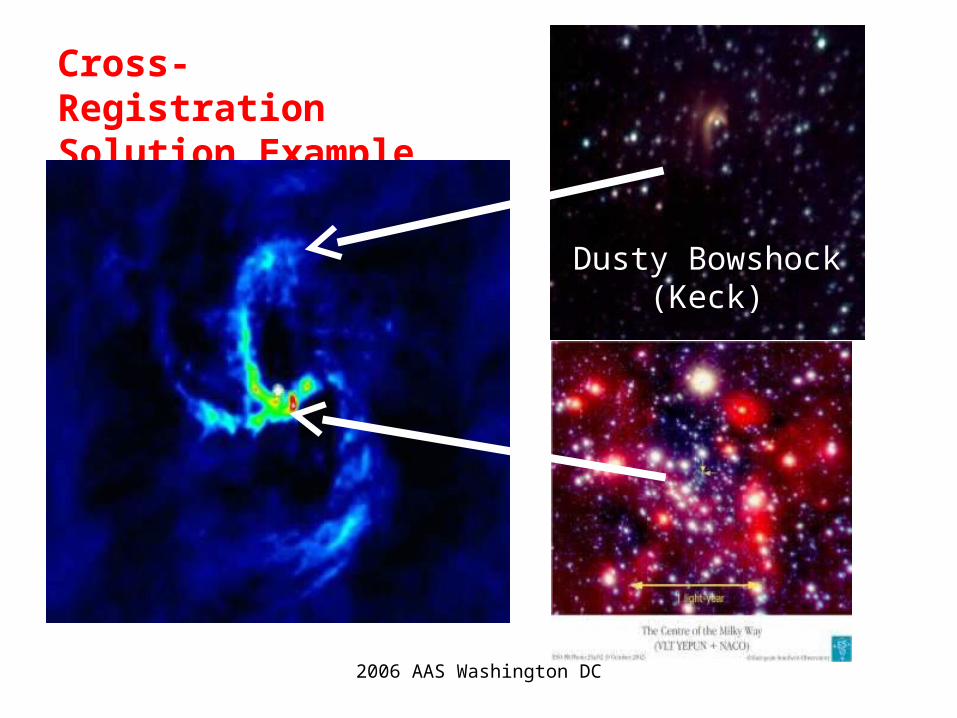
Cross-RegistrationSolution Example
DustyBowshock (Keck)
Ionized GasMinispiral (VLA) Galactic Center
(Paranal)
Dusty Bowshock(Keck)
2006 AAS Washington DC
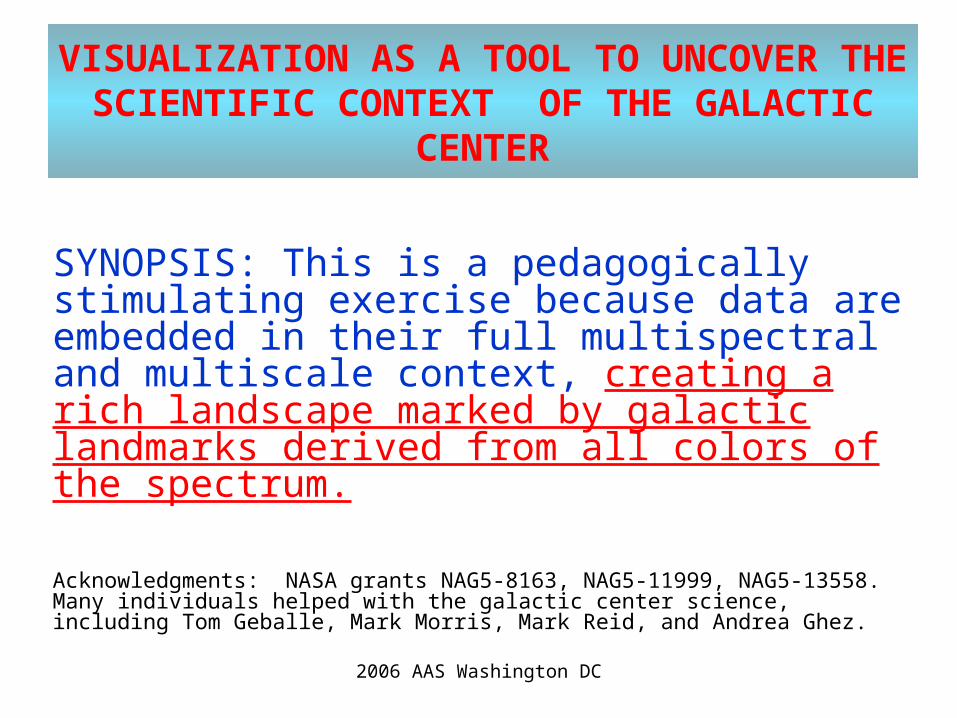
VISUALIZATION AS A TOOL TO UNCOVER THE SCIENTIFIC CONTEXT OF THE
GALACTIC CENTER
SYNOPSIS: This is a pedagogically stimulating exercise because data are embedded in their full multispectral and multiscale context, creating a rich landscape marked by galactic landmarks derived from all colors of the spectrum.
Acknowledgments: NASA grants NAG5-8163, NAG5-11999, NAG5-13558. Many individuals helped with the galactic center science, including Tom Geballe, Mark Morris, Mark Reid, and Andrea Ghez.

Hubble: Galaxies Across Space and Time
Frank Summers
Space Telescope Science Institute
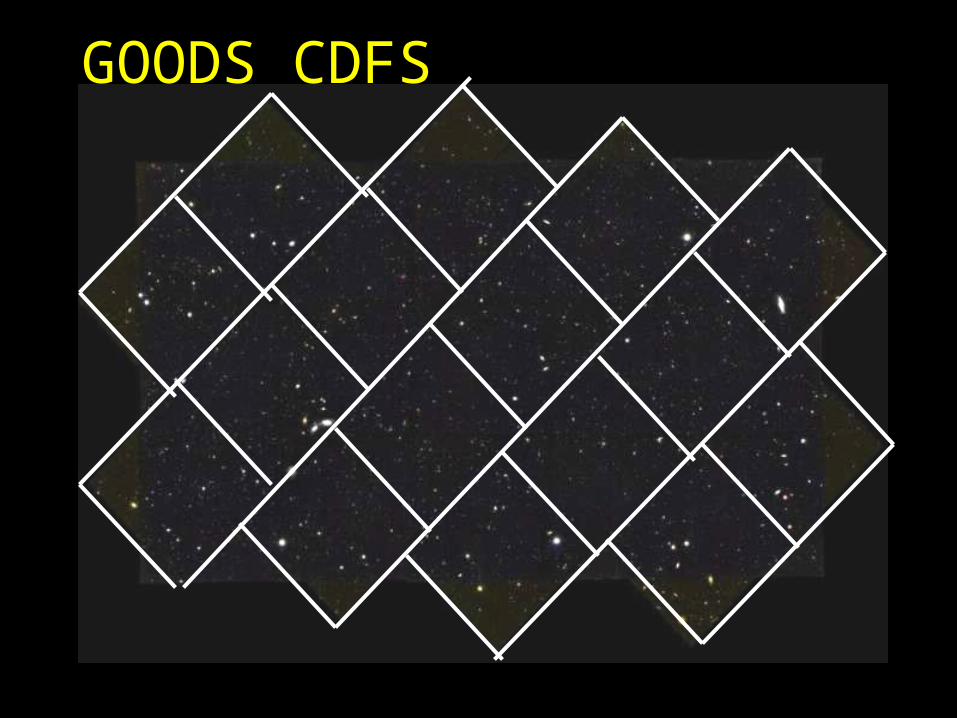
GOODS CDFS
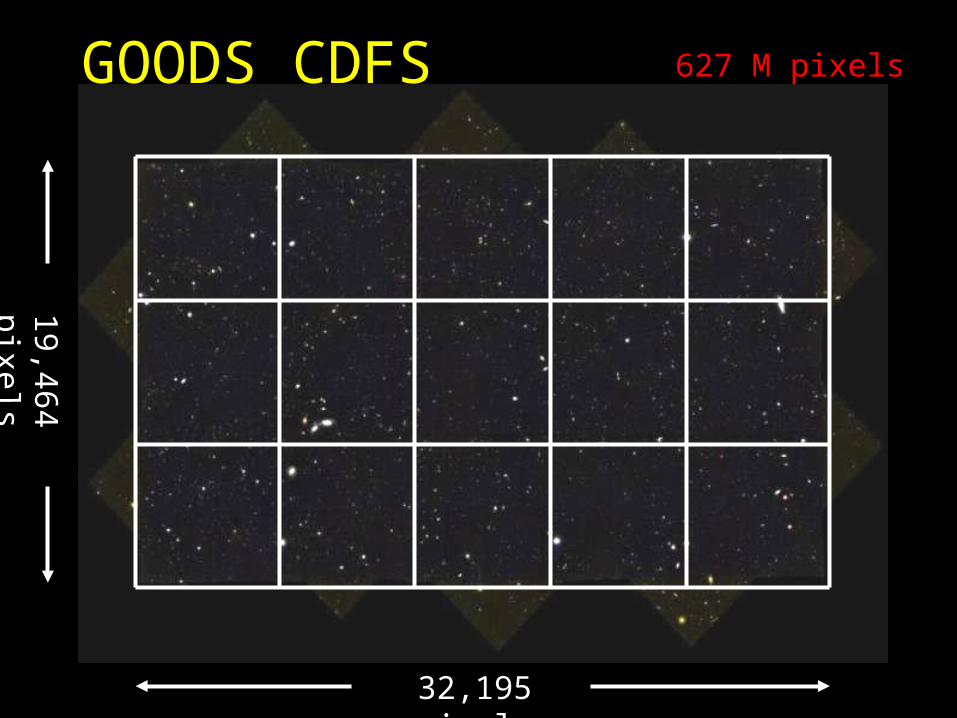
GOODS CDFS
32,195 pixels
19,464 pixels
627 M pixels
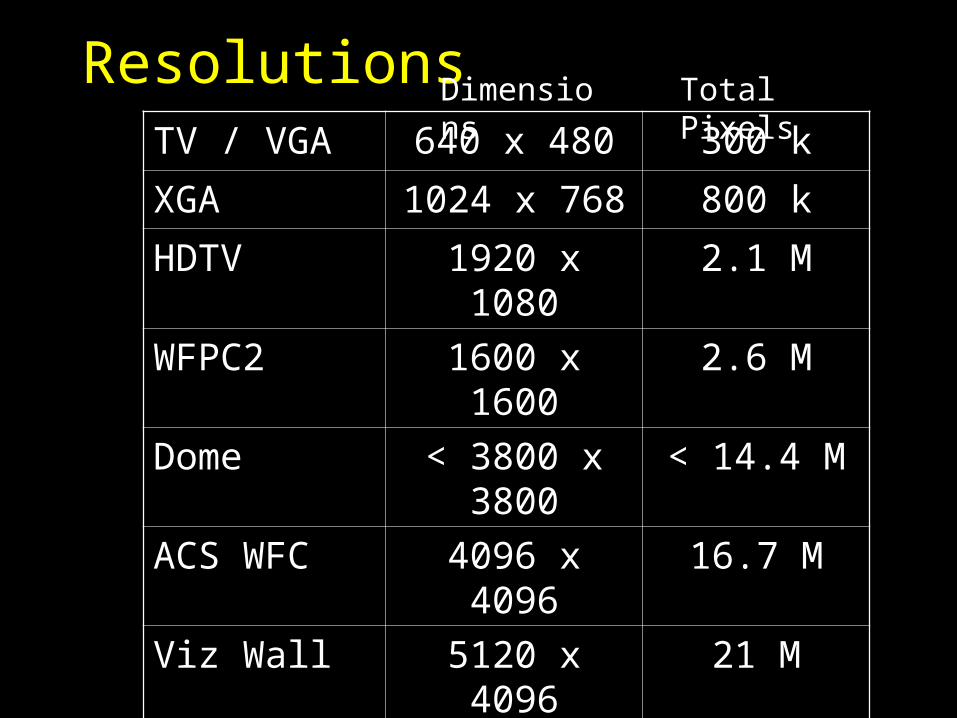
ResolutionsTV / VGA 640 x 480 300 k
XGA 1024 x 768 800 k
HDTV 1920 x 1080 2.1 M
WFPC2 1600 x 1600 2.6 M
Dome < 3800 x 3800 < 14.4 M
ACS WFC 4096 x 4096 16.7 M
Viz Wall 5120 x 4096 21 M
IMAX 5616 x 4096 23 M
Sombrero 11,472 x 6429 74 M
GOODS 32,195 x 19,464 627 M
Dimensions Total Pixels
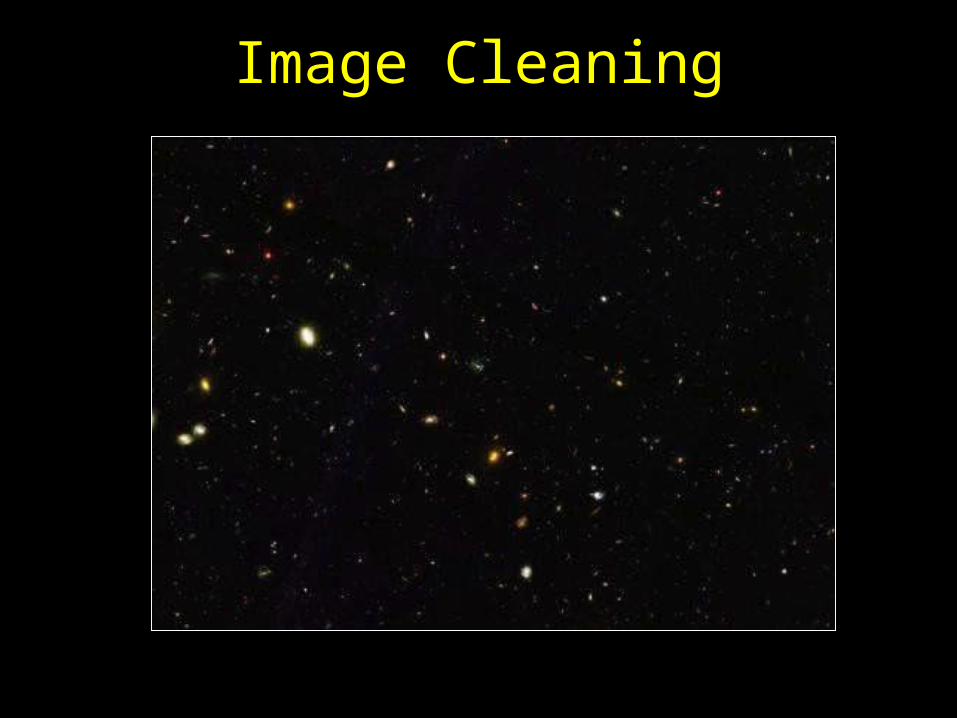
Image Cleaning
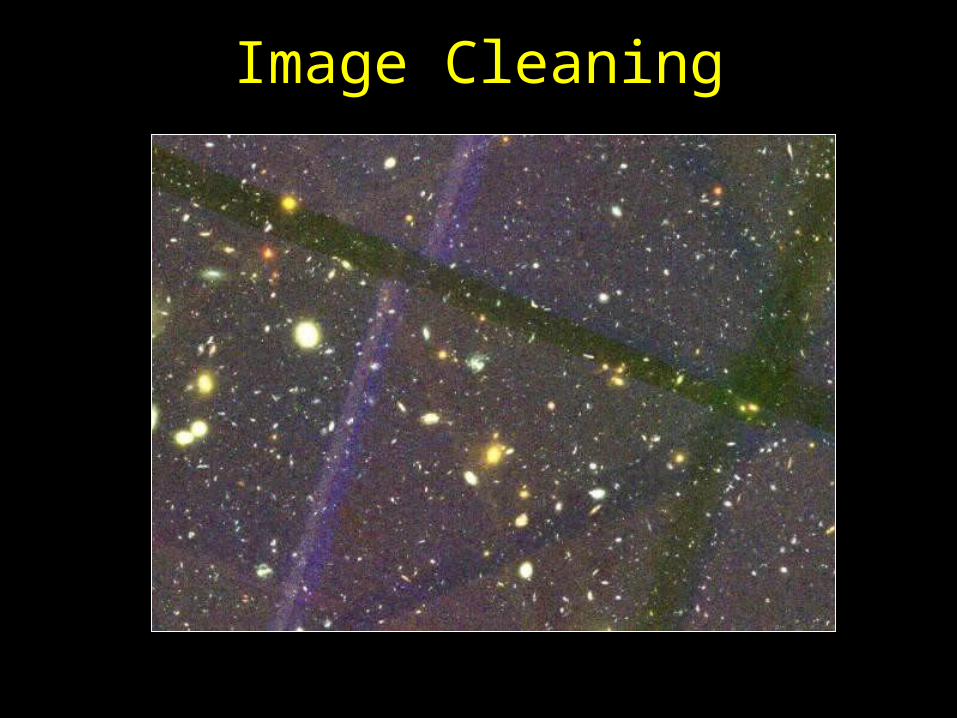
Image Cleaning
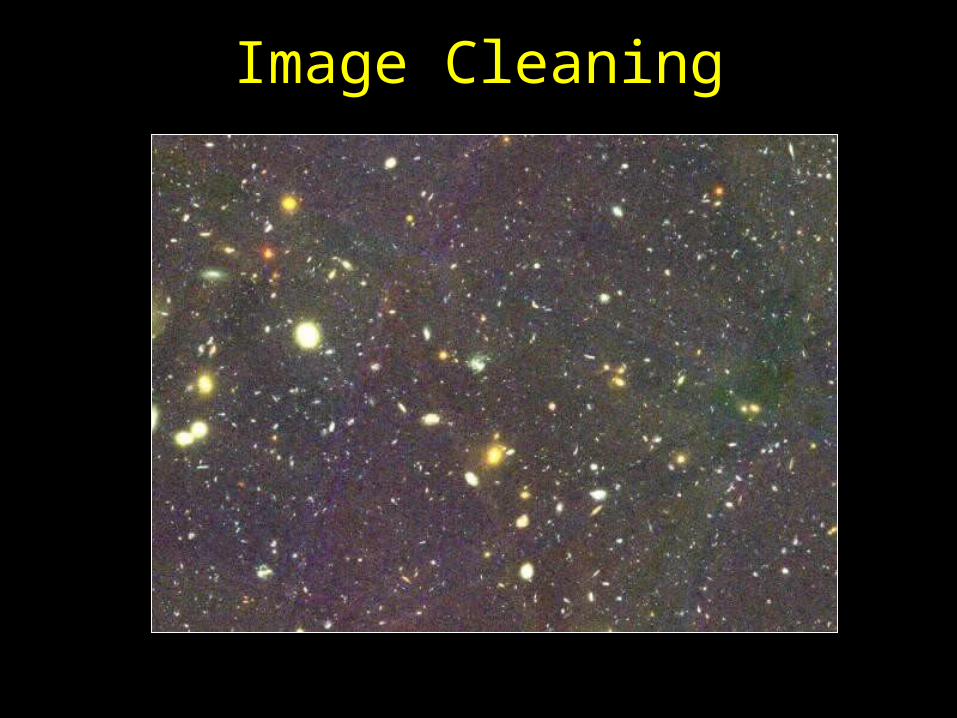
Image Cleaning
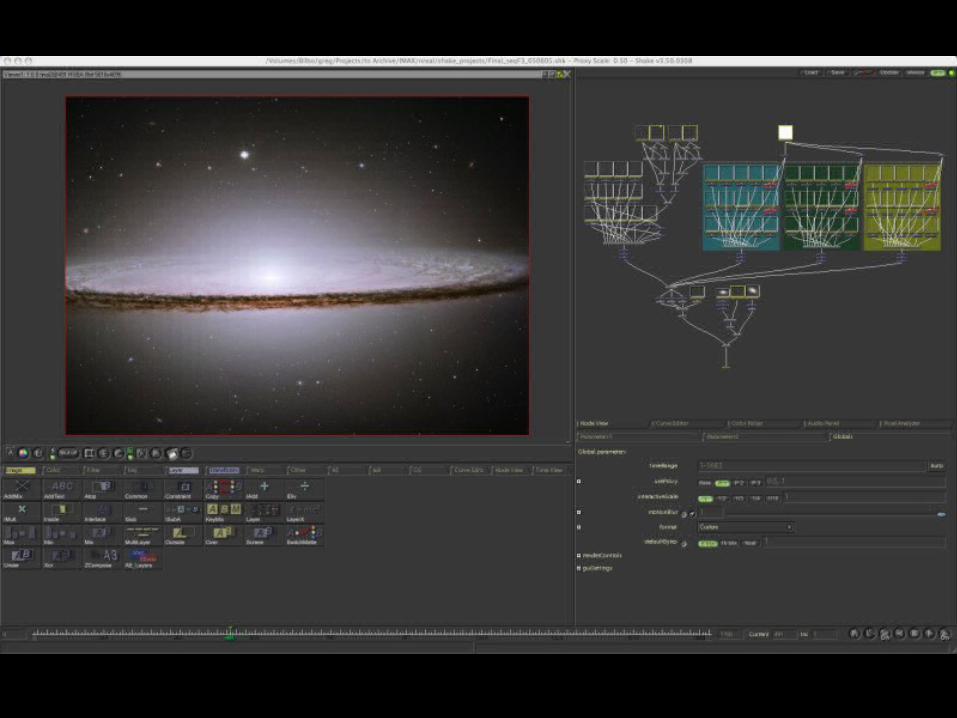
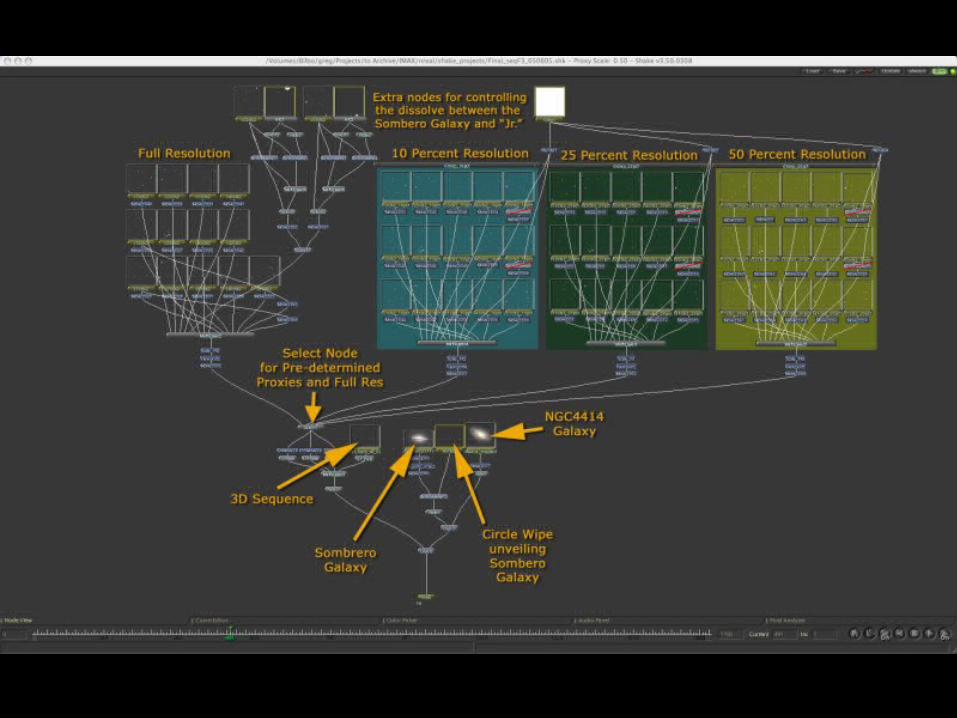
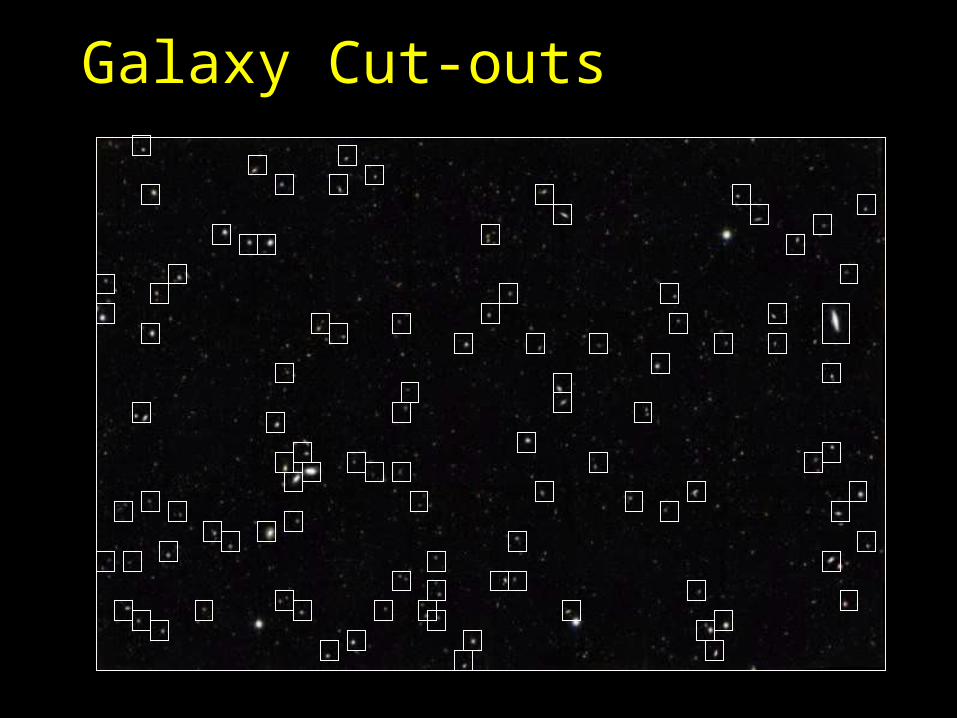
Galaxy Cut-outs
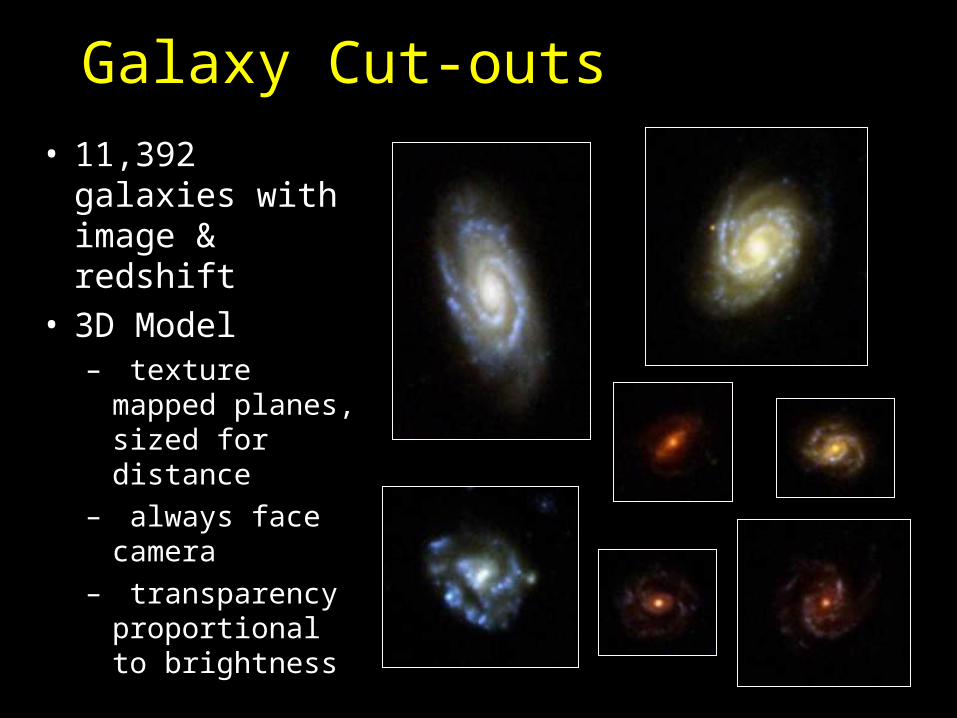
Galaxy Cut-outs
• 11,392 galaxies with image & redshift
• 3D Model– texture mapped
planes, sized for distance
– always face camera
– transparency proportional to brightness
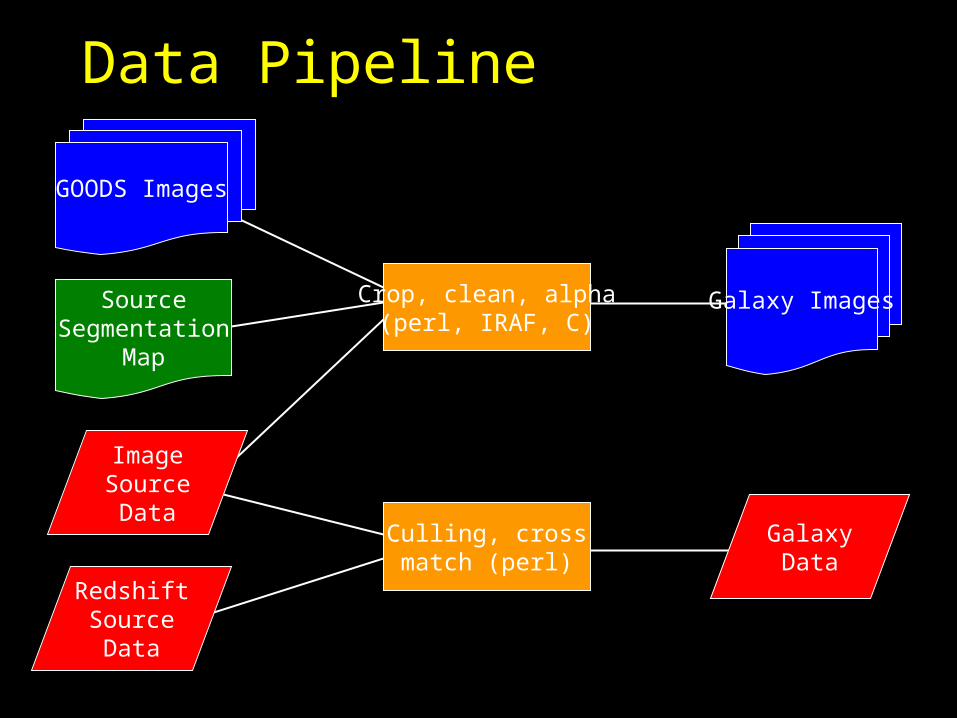
Data Pipeline
Culling, crossmatch (perl)
Crop, clean, alpha(perl, IRAF, C)
Galaxy Images
RedshiftSourceData
ImageSourceData
SourceSegmentation
Map
GOODS Images
GalaxyData
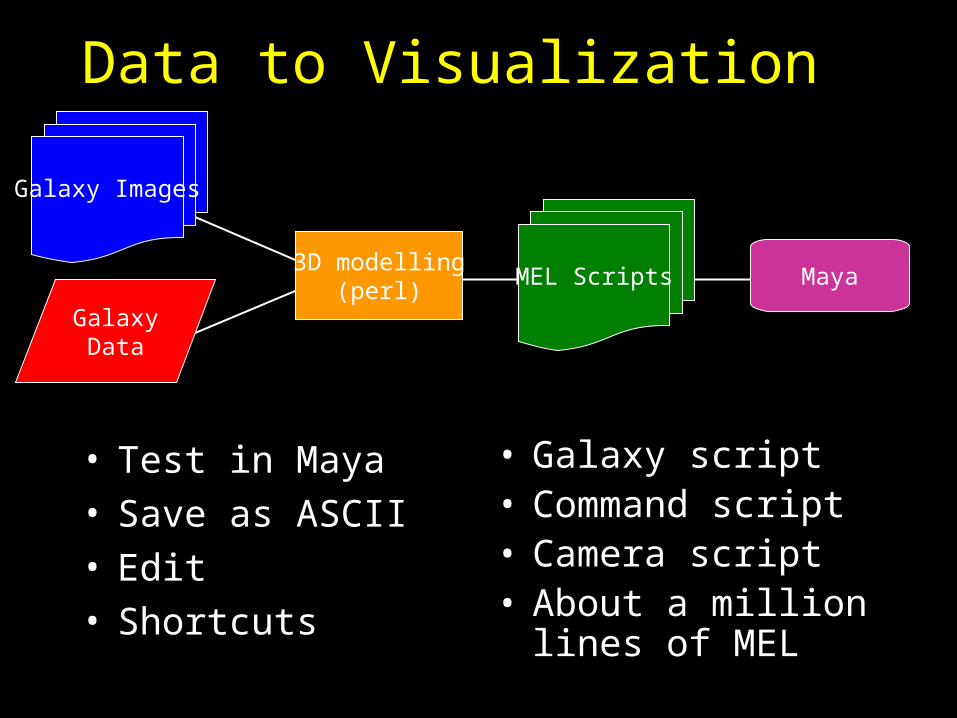
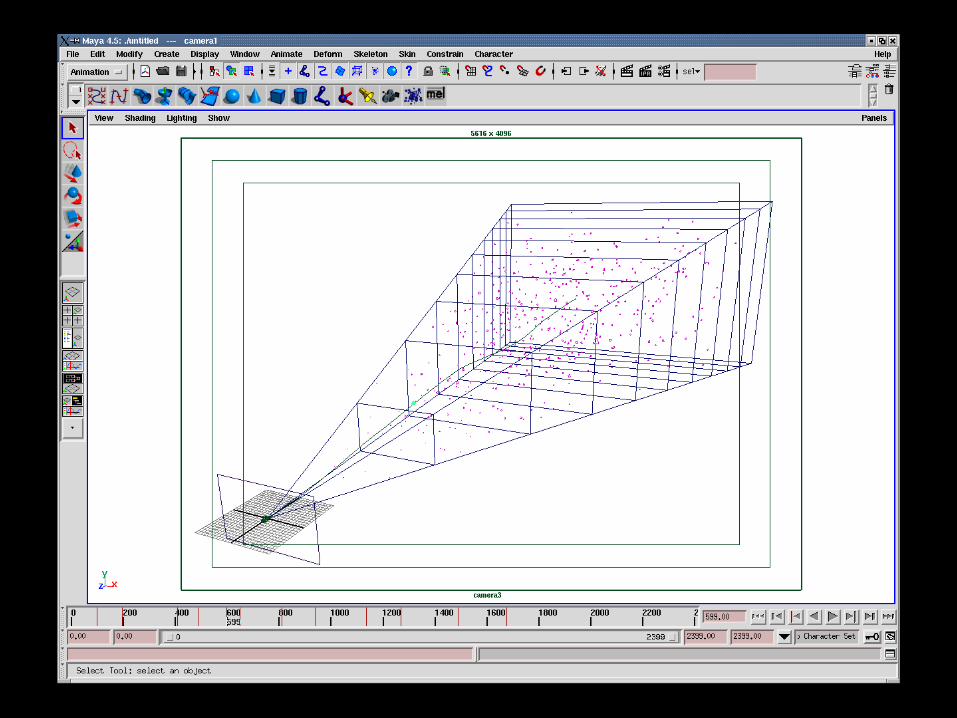
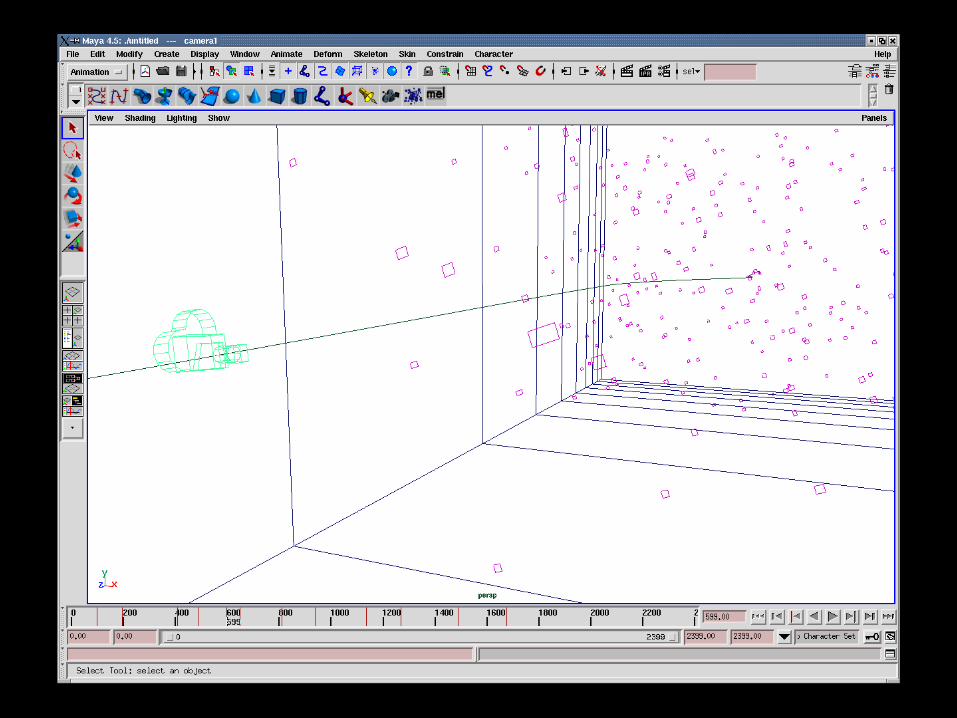
Data to Visualization
• Test in Maya• Save as ASCII• Edit• Shortcuts
• Galaxy script• Command script• Camera script• About a million lines
of MEL
GalaxyData
3D modelling(perl)
MEL Scripts
Galaxy Images
Maya
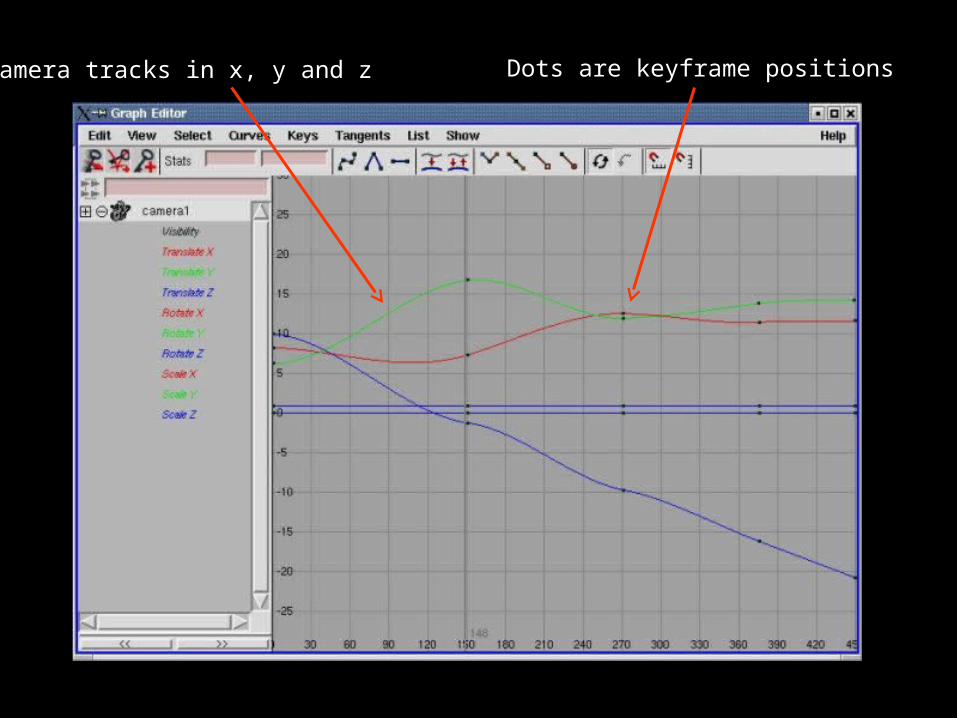
Camera tracks in x, y and z Dots are keyframe positions
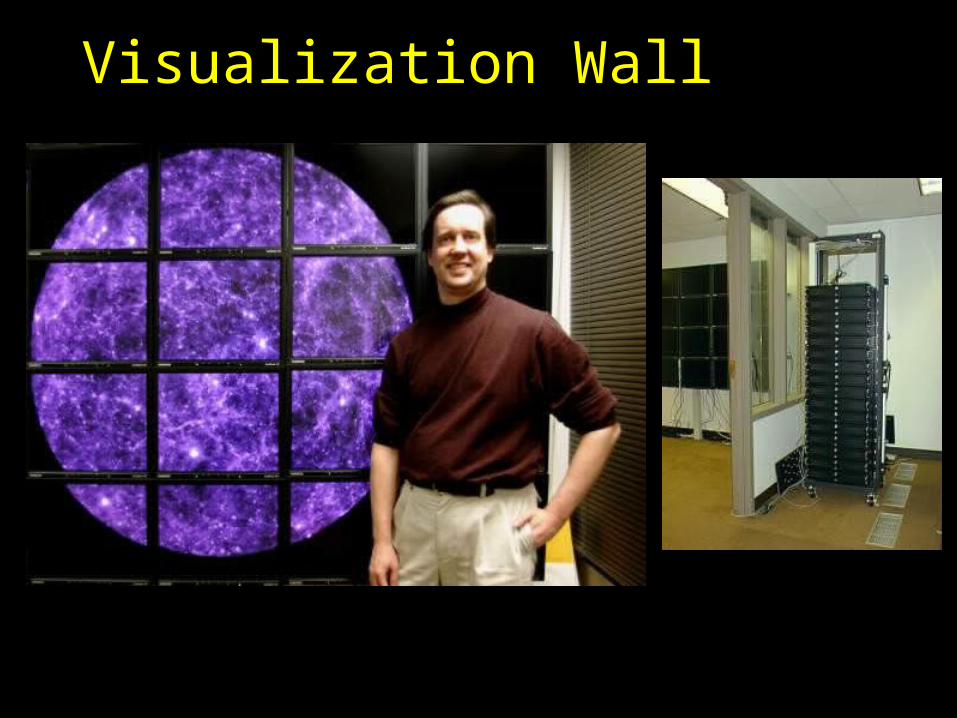
Visualization Wall
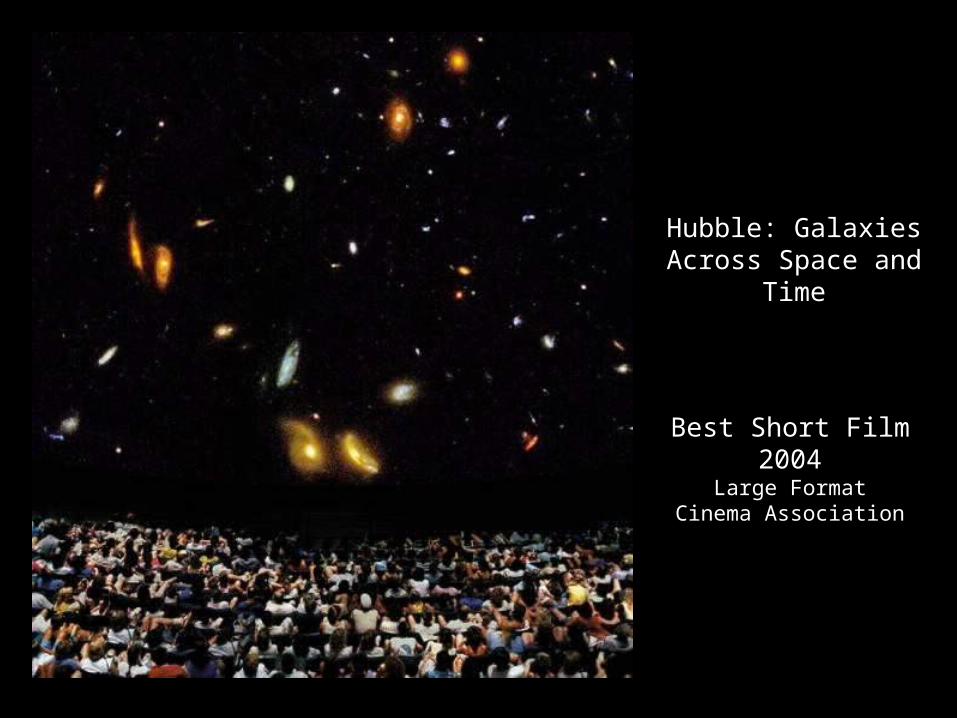
Hubble: Galaxies Across Space and Time
Best Short Film 2004Large Format
Cinema Association

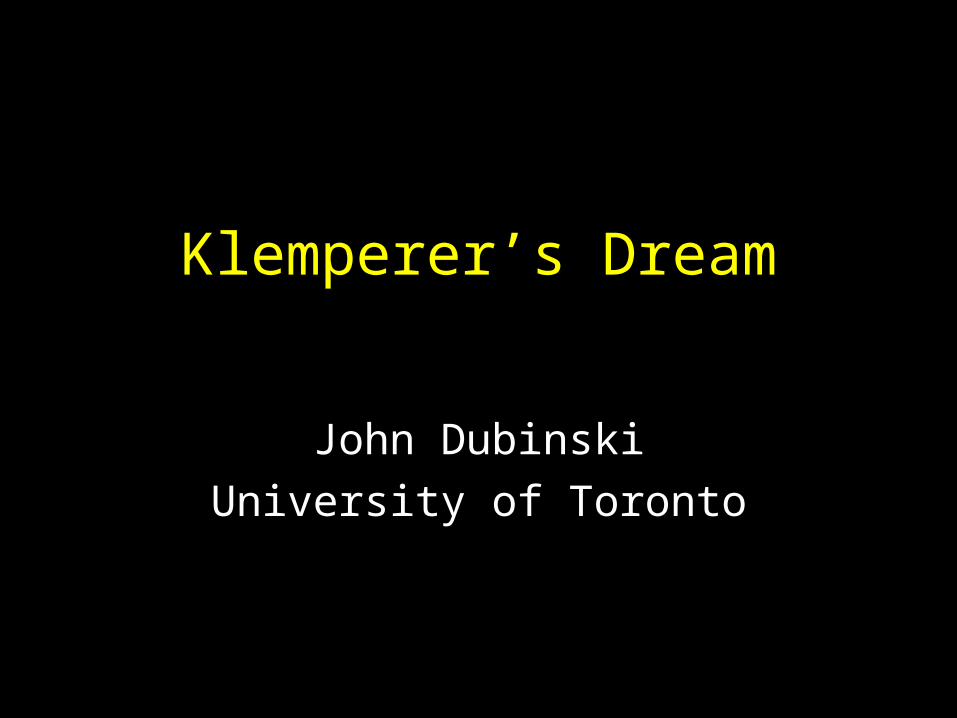
Klemperer’s Dream
John Dubinski
University of Toronto
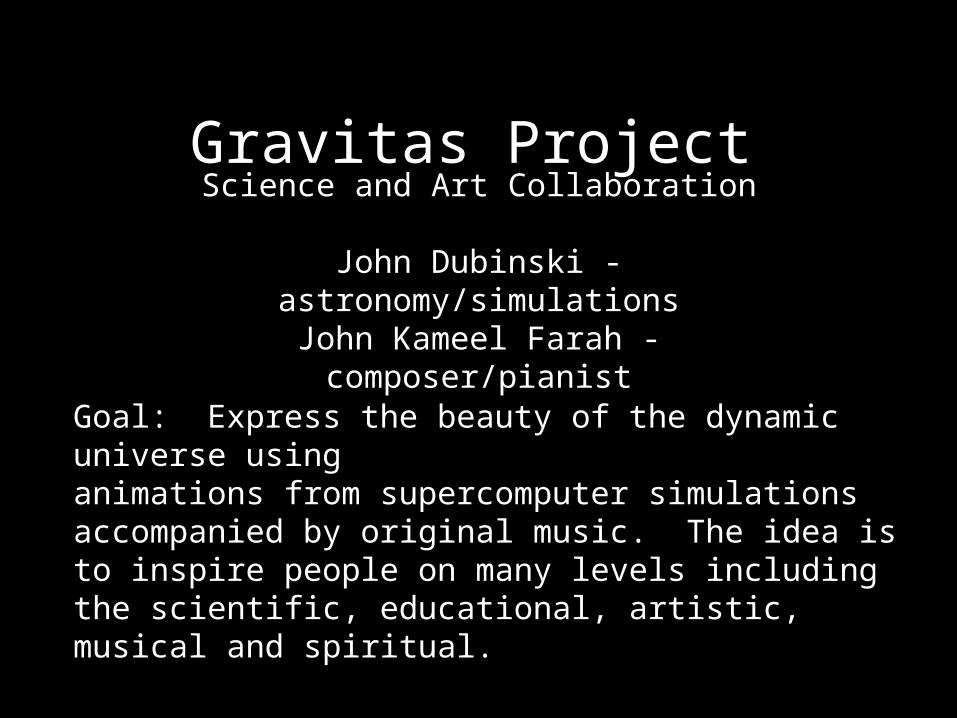
Gravitas ProjectScience and Art Collaboration
John Dubinski - astronomy/simulationsJohn Kameel Farah - composer/pianist
Goal: Express the beauty of the dynamic universe usinganimations from supercomputer simulations accompanied by original music. The idea is to inspire people on many levels including the scientific, educational, artistic, musical and spiritual.
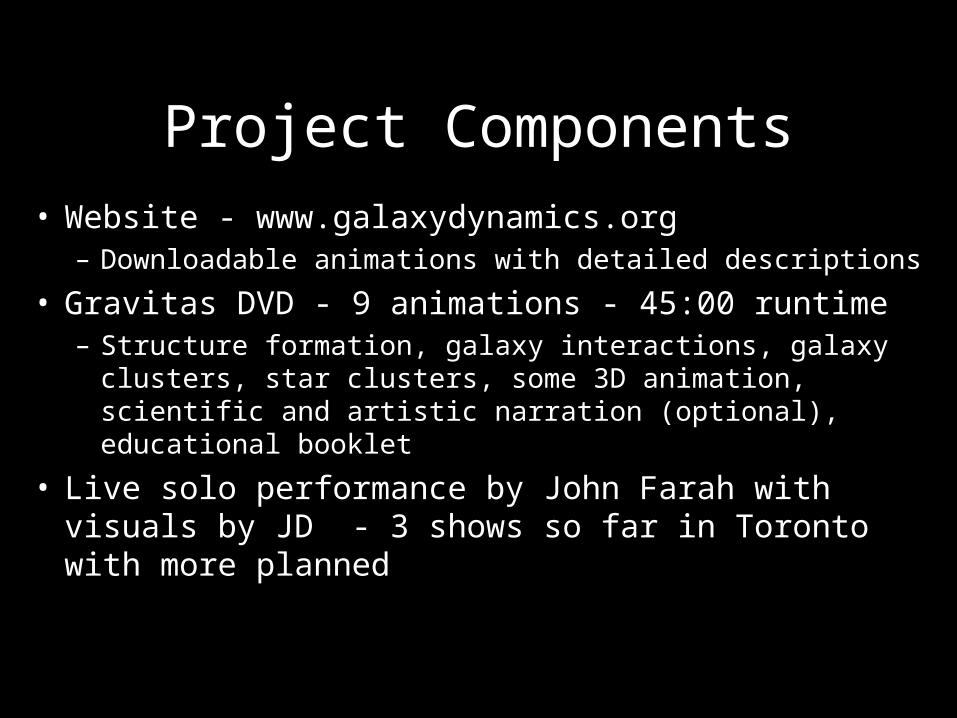
Project Components
• Website - www.galaxydynamics.org– Downloadable animations with detailed descriptions
• Gravitas DVD - 9 animations - 45:00 runtime– Structure formation, galaxy interactions, galaxy clusters,
star clusters, some 3D animation, scientific and artistic narration (optional), educational booklet
• Live solo performance by John Farah with visuals by JD - 3 shows so far in Toronto with more planned
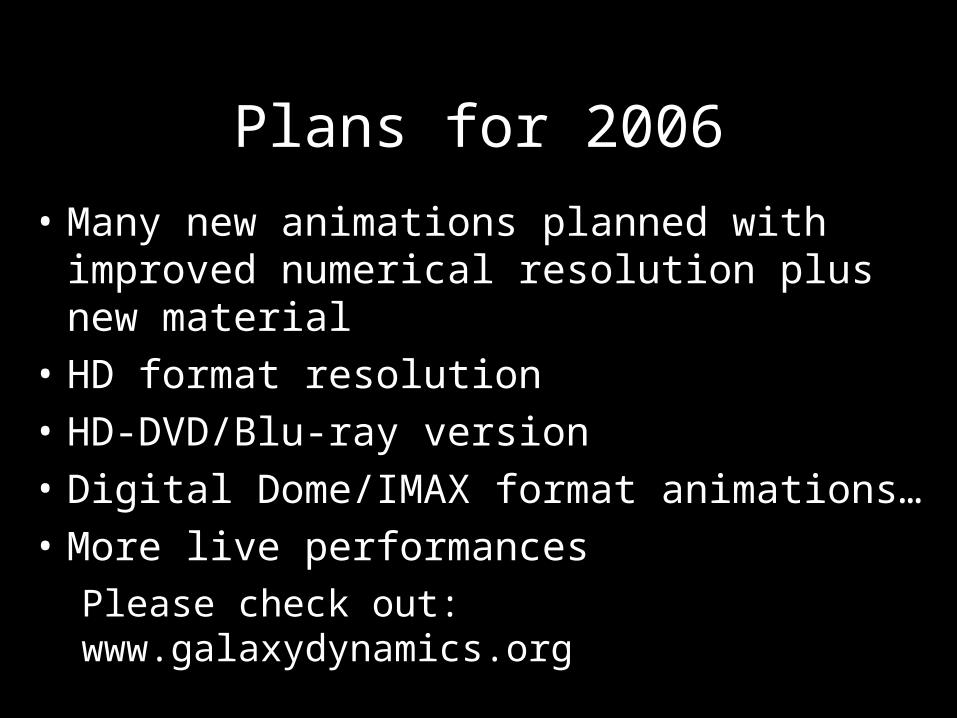
Plans for 2006
• Many new animations planned with improved numerical resolution plus new material
• HD format resolution
• HD-DVD/Blu-ray version
• Digital Dome/IMAX format animations…
• More live performances
Please check out: www.galaxydynamics.org

Mapping the Universe with the Sloan Digital Sky Survey
Mark SubbaRao
Adler Planetarium and Astronomy Museum and University of Chicago
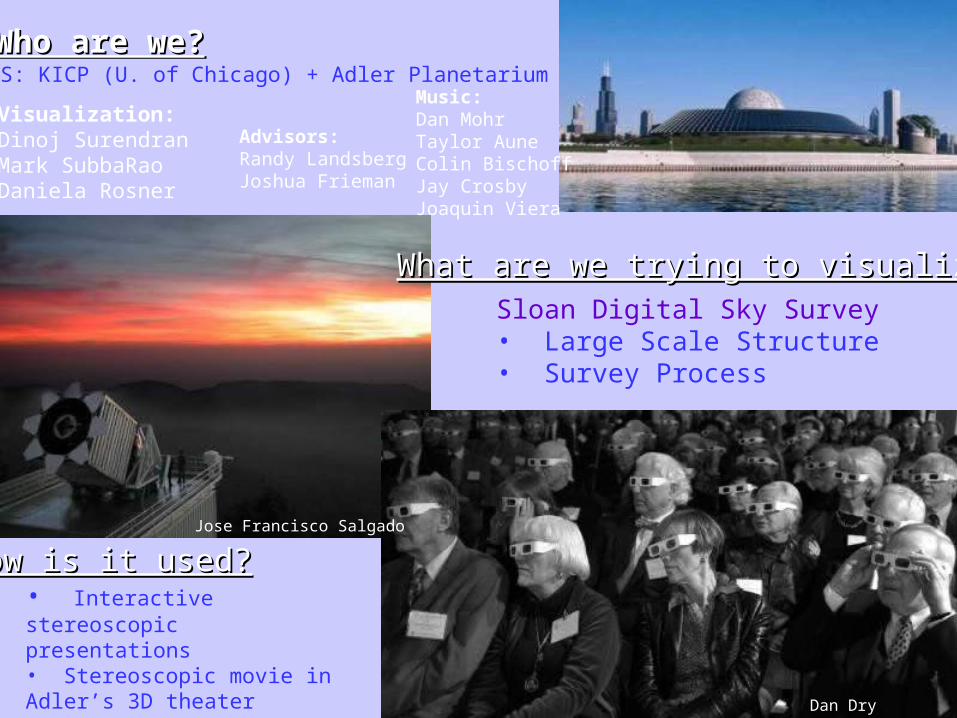
Who are we?Who are we?
What are we trying to visualize?What are we trying to visualize?
Visualization:Dinoj Surendran Mark SubbaRaoDaniela Rosner
Advisors:Randy LandsbergJoshua Frieman
Music:Dan MohrTaylor AuneColin BischoffJay CrosbyJoaquin Viera
How is it used?How is it used?
Sloan Digital Sky Survey• Large Scale Structure• Survey Process
• Interactive stereoscopic presentations• Stereoscopic movie in Adler’s 3D theater• Full-dome Planetarium shows
Jose Francisco Salgado
Dan Dry
COSMUS: KICP (U. of Chicago) + Adler Planetarium
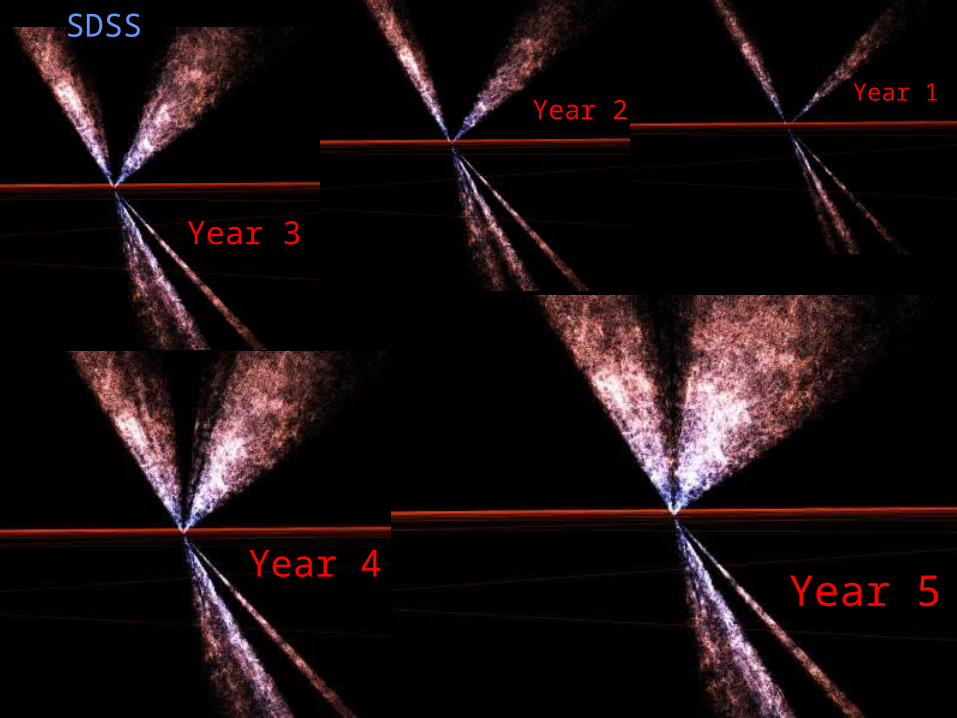
Year 1
Year 5Year 4
Year 3
Year 2
SDSS
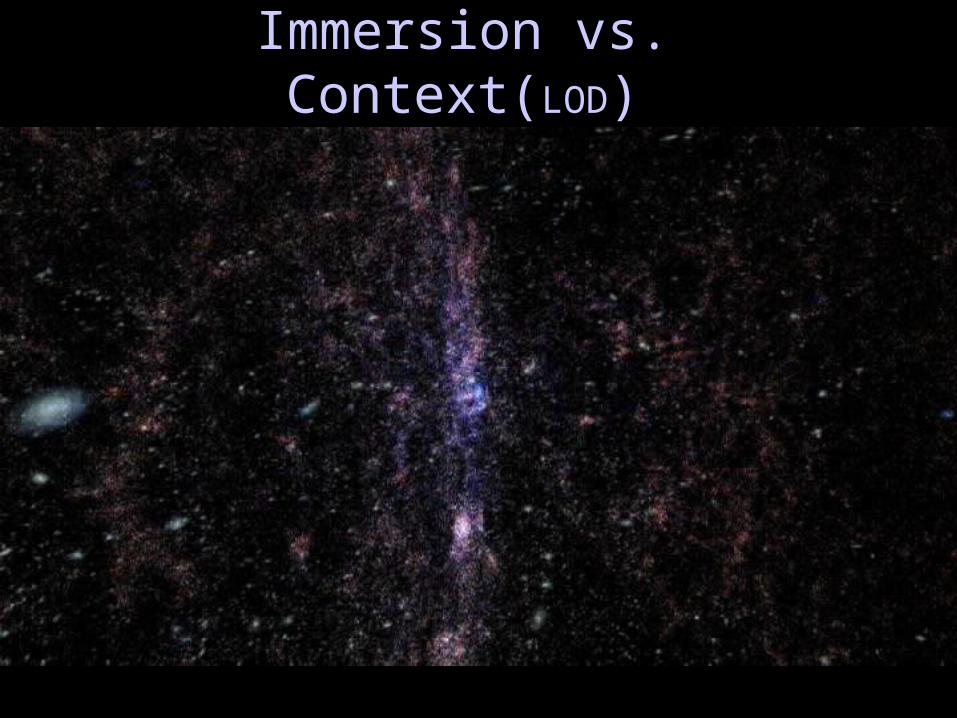
Immersion vs. Context(Immersion vs. Context(LODLOD))
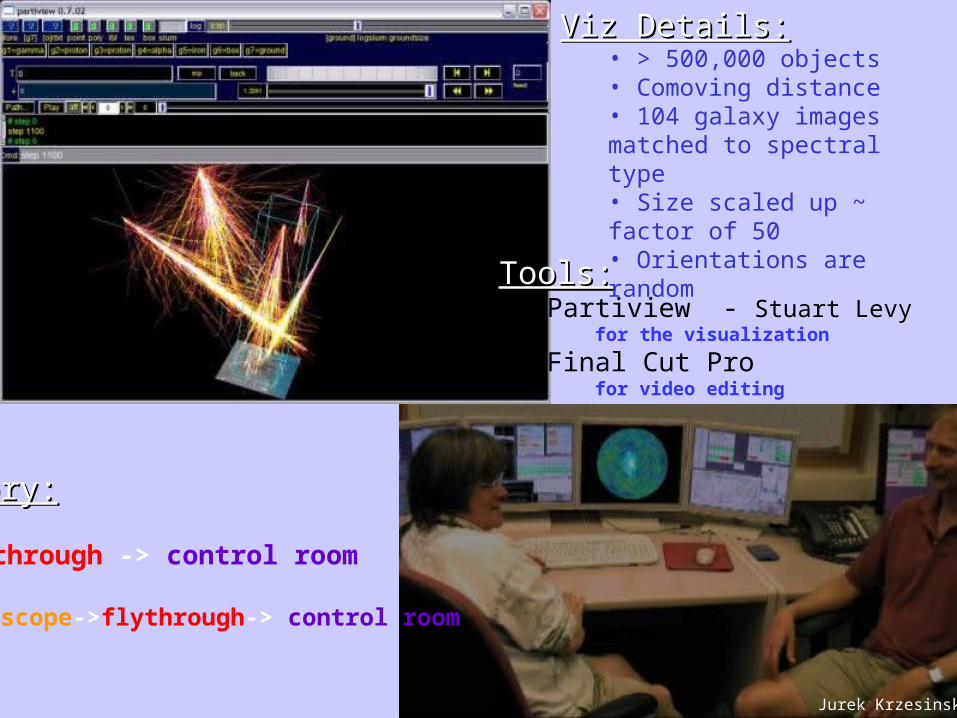
Tools:Tools:Partiview - Stuart Levy
for the visualization
Final Cut Profor video editing
Story:Story:
flythrough -> control room
telescope->flythrough-> control room
Viz Details:Viz Details:• > 500,000 objects• Comoving distance• 104 galaxy images matched to spectral type• Size scaled up ~ factor of 50• Orientations are random
Jurek Krzesinski

Flight Through the Millenium Simulation
Simon White
Max Planck Institute for Astrophysics
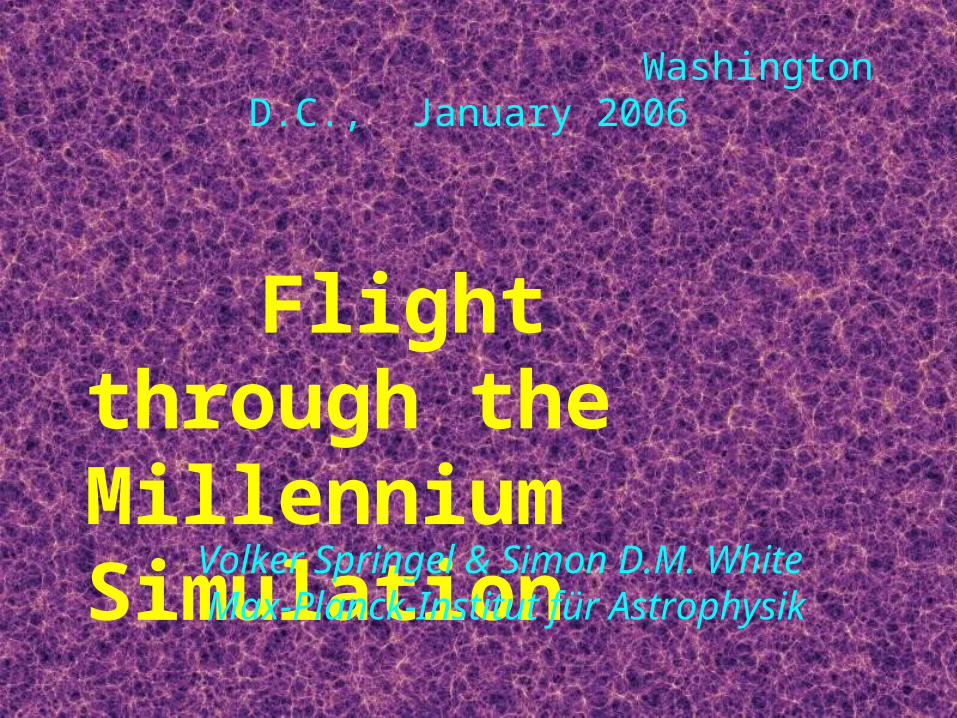
Flight through the Millennium Simulation
Volker Springel & Simon D.M. White Max-Planck-Institut für Astrophysik
Washington D.C., January 2006
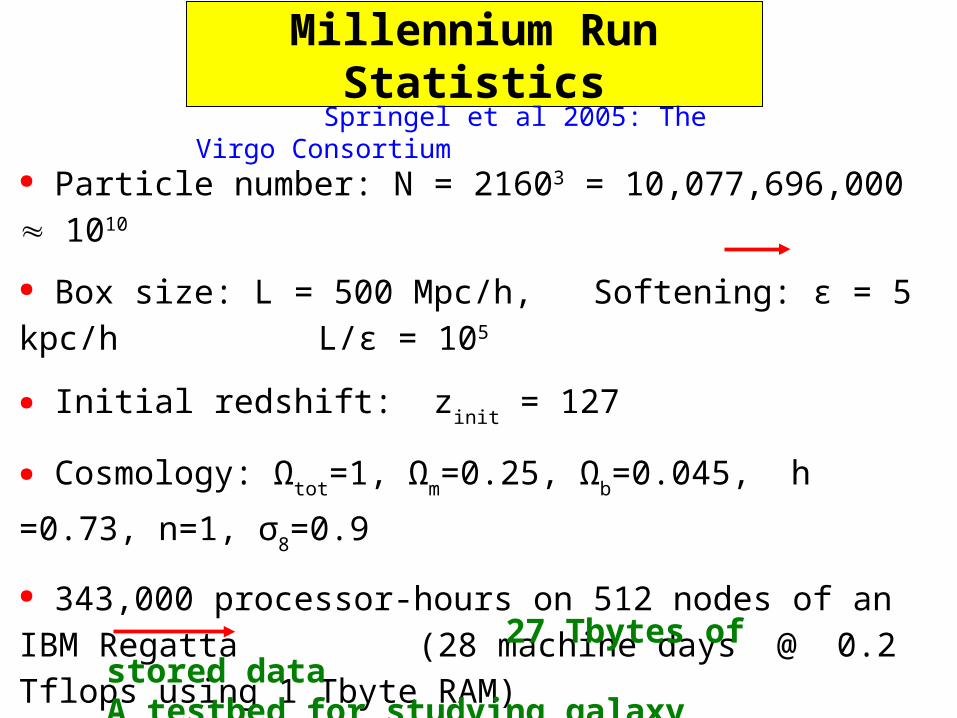
Millennium Run Statistics
● Particle number: N = 21603 = 10,077,696,000 1010
● Box size: L = 500 Mpc/h, Softening: ε = 5 kpc/h L/ε = 105
● Initial redshift: zinit
= 127
● Cosmology: Ωtot
=1, Ωm=0.25, Ω
b=0.045, h =0.73, n=1, σ
8=0.9
● 343,000 processor-hours on 512 nodes of an IBM Regatta (28
machine days @ 0.2 Tflops using 1 Tbyte RAM)
● Full raw and reduced data stored at 64 redshifts
27 Tbytes of stored data A testbed for studying galaxy formation models
Springel et al 2005: The Virgo Consortium
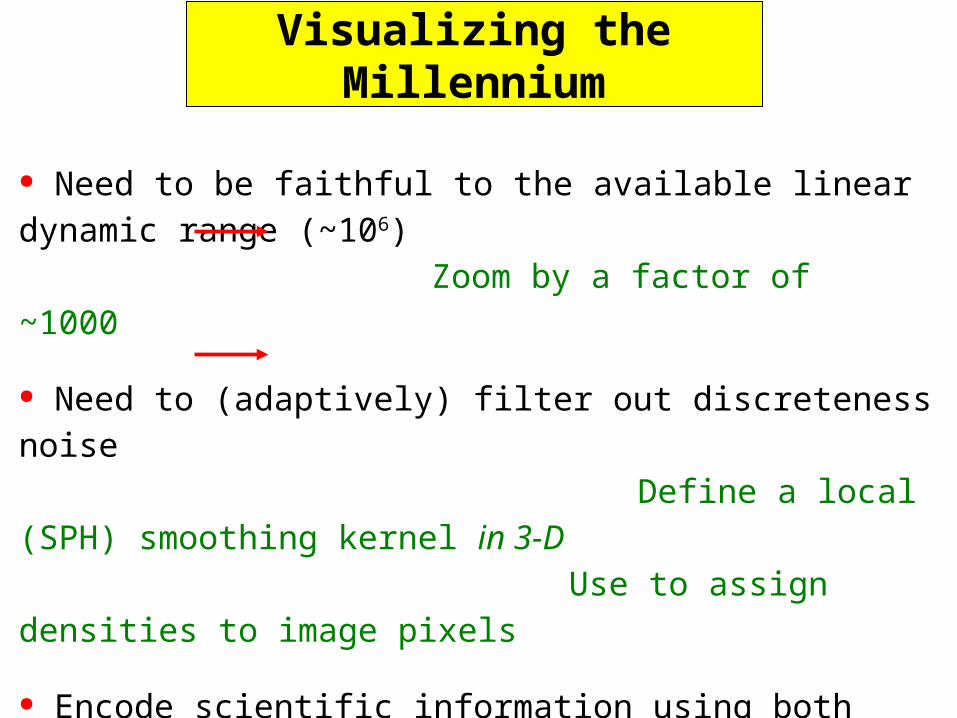
Visualizing the Millennium
● Need to be faithful to the available linear dynamic range (~106)
Zoom by a factor of ~1000
● Need to (adaptively) filter out discreteness noise
Define a local (SPH) smoothing
kernel in 3-D Use to assign
densities to image pixels
● Encode scientific information using both colour and intensity
e.g. intensity for mass/luminosity
density colour for
velocity dispersion/B – V colour
● Use motion to convey 3-D structure
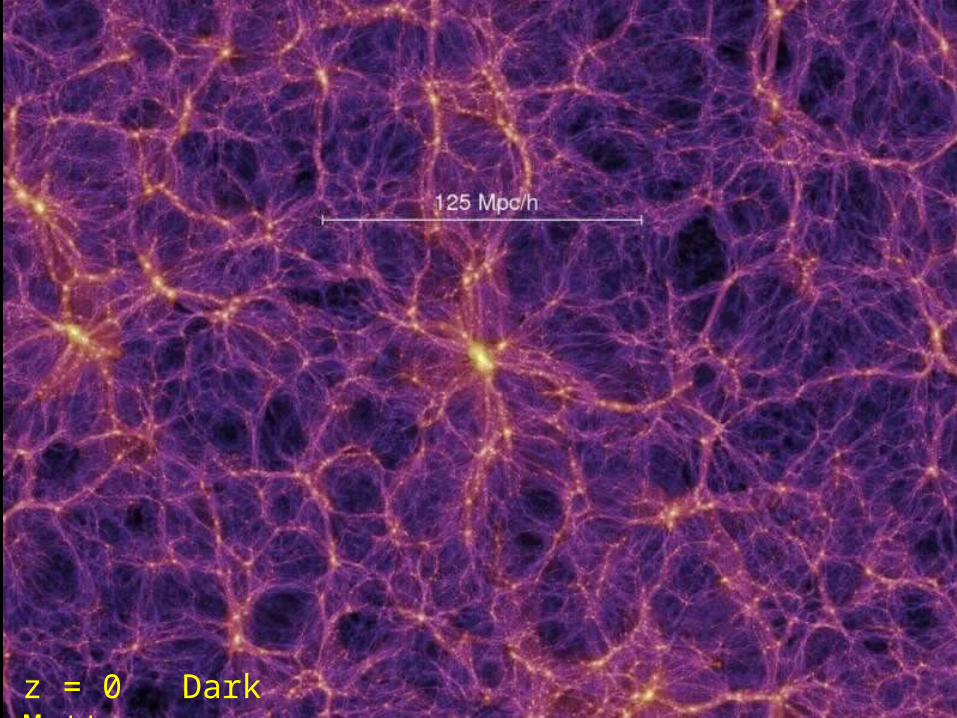
z = 0 Dark Matter
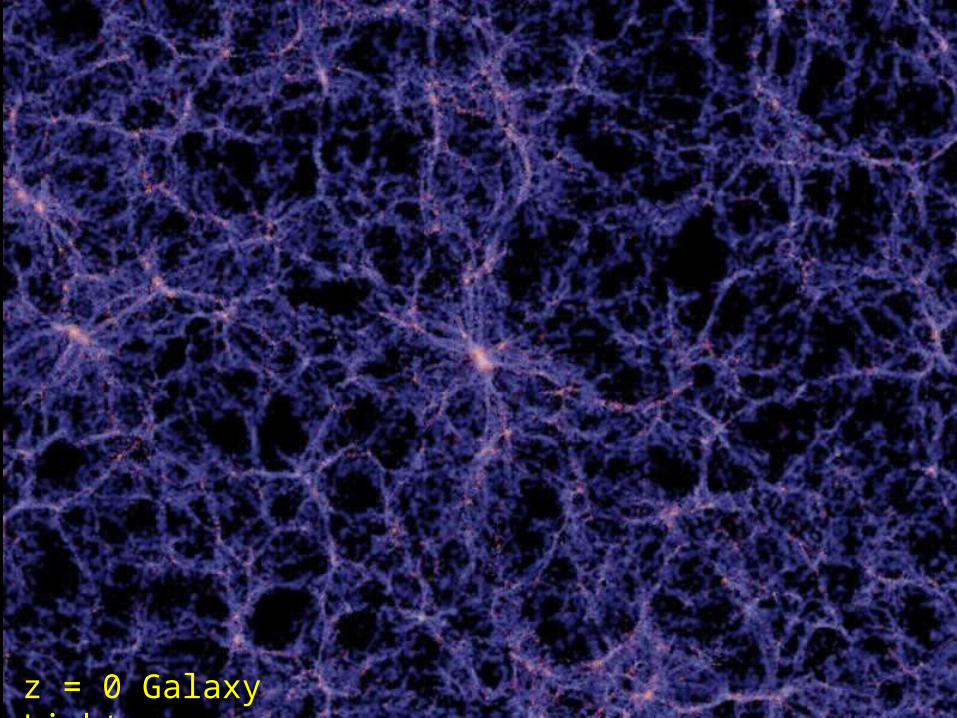
z = 0 Galaxy Light