Embed Size (px)
Citation preview
Astrophysical Data Analysis andVisualization Toolkit
Daniela FerroDipartimento di Fisica e Astronomia, via S.Sofia, 78,
95100, Catania, ITALYwoac.ct.astro.it
Ugo Becciani, Vincenzo Antonuccio-Delogu and Angela German aINAF, via S.Sofia, 78,95100, Catania, ITALY
[email protected],[email protected],[email protected]
Claudio GhellerCINECA, via Magnanelli, 6-3,
40100, Casalecchio di Reno (BO), ITALYwww.cineca.it
Abstract
AstroMD is a visualization software offering several capabilities specifically orientedto the cosmological analysis of three-dimensional structures. It was developed withinthe framework of the Cosmo.Lab project, financially supported by the EuropeanCommunity, which involves several European Astrophysical Institutions and theCINECA. This tool gives a 3D graphic representation of data, exploiting the mostadvanced visualization technology based on virtual reality, and has several built-in-tools which allow the user an efficient manipulation and analysis of data, in order tobuild a leading edge instrument for scientific research. It was developed using theVisualization Toolkit (VTK) by Kitware, a freely available visualization library portableon many platforms. AstroMD is an open source freely available code at the addresshttp://cosmolab.cineca.it/.
Keywords: Scientific Visualization, Astrophysical Data Analysis
1. INTRODUCTION
Since the beginning of modern astronomy, the scientific community has expressed a great interestin scientific visualization tools. The improvement of technology and the availability of super-computing multiprocessor systems has led to a dramatic increase in the volume of data comingfrom observations of astronomical sources and from cosmological simulations. Today, numericalsimulations produce many gigabytes of data which have to be efficiently visualized and analyzed.Visualization is the most intuitive approach to data and basic information can be obtained just ata glance. Then the possibility of moving inside the data allows the scientist to focus on regions ofinterest and there to perform quantitative calculations.AstroMD provides an effective and intuitive way of managing and analysing large amounts ofastrophysical data. It can find structures having a not well defined shape or symmetry, and performquantitative calculations on a selected region or structure. The most advanced visualizationtechniques are exploited, in particular stereographics visualization and virtual reality.AstroMD also contains functionalities for the calculation of quantities of cosmological interest,such as the two-point Correlation Function, the calculation of the Gravitational Field, the PowerSpectrum of the density fluctuations, the Minkowski Functionals and includes the Friend-of-friendgroup finding algorithm. The most common data formats used in cosmological simulations (i.e.
Astronomical Data Analysis III 1
Astrophysical Data Analysis and Visualization Toolkit
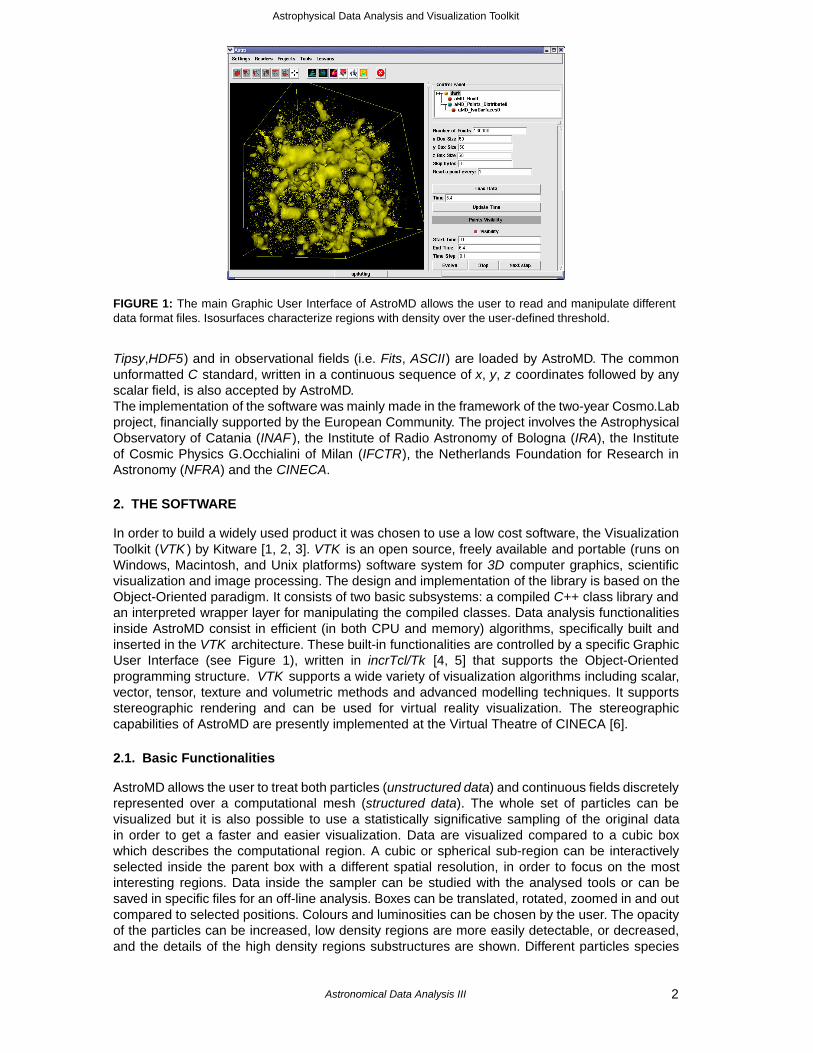
FIGURE 1: The main Graphic User Interface of AstroMD allows the user to read and manipulate differentdata format files. Isosurfaces characterize regions with density over the user-defined threshold.
Tipsy,HDF5) and in observational fields (i.e. Fits, ASCII) are loaded by AstroMD. The commonunformatted C standard, written in a continuous sequence of x, y, z coordinates followed by anyscalar field, is also accepted by AstroMD.The implementation of the software was mainly made in the framework of the two-year Cosmo.Labproject, financially supported by the European Community. The project involves the AstrophysicalObservatory of Catania (INAF ), the Institute of Radio Astronomy of Bologna (IRA), the Instituteof Cosmic Physics G.Occhialini of Milan (IFCTR), the Netherlands Foundation for Research inAstronomy (NFRA) and the CINECA.
2. THE SOFTWARE
In order to build a widely used product it was chosen to use a low cost software, the VisualizationToolkit (VTK ) by Kitware [1, 2, 3]. VTK is an open source, freely available and portable (runs onWindows, Macintosh, and Unix platforms) software system for 3D computer graphics, scientificvisualization and image processing. The design and implementation of the library is based on theObject-Oriented paradigm. It consists of two basic subsystems: a compiled C++ class library andan interpreted wrapper layer for manipulating the compiled classes. Data analysis functionalitiesinside AstroMD consist in efficient (in both CPU and memory) algorithms, specifically built andinserted in the VTK architecture. These built-in functionalities are controlled by a specific GraphicUser Interface (see Figure 1), written in incrTcl/Tk [4, 5] that supports the Object-Orientedprogramming structure. VTK supports a wide variety of visualization algorithms including scalar,vector, tensor, texture and volumetric methods and advanced modelling techniques. It supportsstereographic rendering and can be used for virtual reality visualization. The stereographiccapabilities of AstroMD are presently implemented at the Virtual Theatre of CINECA [6].
2.1. Basic Functionalities
AstroMD allows the user to treat both particles (unstructured data) and continuous fields discretelyrepresented over a computational mesh (structured data). The whole set of particles can bevisualized but it is also possible to use a statistically significative sampling of the original datain order to get a faster and easier visualization. Data are visualized compared to a cubic boxwhich describes the computational region. A cubic or spherical sub-region can be interactivelyselected inside the parent box with a different spatial resolution, in order to focus on the mostinteresting regions. Data inside the sampler can be studied with the analysed tools or can besaved in specific files for an off-line analysis. Boxes can be translated, rotated, zoomed in and outcompared to selected positions. Colours and luminosities can be chosen by the user. The opacityof the particles can be increased, low density regions are more easily detectable, or decreased,and the details of the high density regions substructures are shown. Different particles species
Astronomical Data Analysis III 2
Astrophysical Data Analysis and Visualization Toolkit
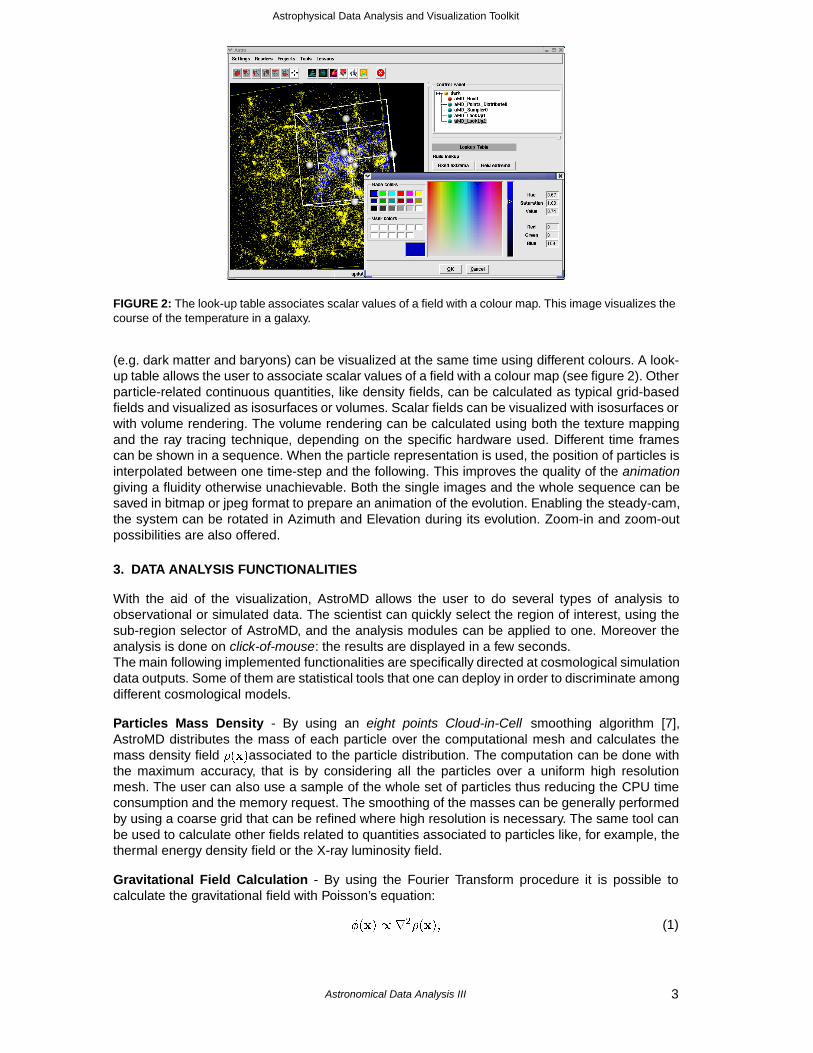
FIGURE 2: The look-up table associates scalar values of a field with a colour map. This image visualizes thecourse of the temperature in a galaxy.
(e.g. dark matter and baryons) can be visualized at the same time using different colours. A look-up table allows the user to associate scalar values of a field with a colour map (see figure 2). Otherparticle-related continuous quantities, like density fields, can be calculated as typical grid-basedfields and visualized as isosurfaces or volumes. Scalar fields can be visualized with isosurfaces orwith volume rendering. The volume rendering can be calculated using both the texture mappingand the ray tracing technique, depending on the specific hardware used. Different time framescan be shown in a sequence. When the particle representation is used, the position of particles isinterpolated between one time-step and the following. This improves the quality of the animationgiving a fluidity otherwise unachievable. Both the single images and the whole sequence can besaved in bitmap or jpeg format to prepare an animation of the evolution. Enabling the steady-cam,the system can be rotated in Azimuth and Elevation during its evolution. Zoom-in and zoom-outpossibilities are also offered.
3. DATA ANALYSIS FUNCTIONALITIES
With the aid of the visualization, AstroMD allows the user to do several types of analysis toobservational or simulated data. The scientist can quickly select the region of interest, using thesub-region selector of AstroMD, and the analysis modules can be applied to one. Moreover theanalysis is done on click-of-mouse: the results are displayed in a few seconds.The main following implemented functionalities are specifically directed at cosmological simulationdata outputs. Some of them are statistical tools that one can deploy in order to discriminate amongdifferent cosmological models.
Particles Mass Density - By using an eight points Cloud-in-Cell smoothing algorithm [7],AstroMD distributes the mass of each particle over the computational mesh and calculates themass density field ����associated to the particle distribution. The computation can be done withthe maximum accuracy, that is by considering all the particles over a uniform high resolutionmesh. The user can also use a sample of the whole set of particles thus reducing the CPU timeconsumption and the memory request. The smoothing of the masses can be generally performedby using a coarse grid that can be refined where high resolution is necessary. The same tool canbe used to calculate other fields related to quantities associated to particles like, for example, thethermal energy density field or the X-ray luminosity field.
Gravitational Field Calculation - By using the Fourier Transform procedure it is possible tocalculate the gravitational field with Poisson’s equation:
���� � ������� (1)
Astronomical Data Analysis III 3
Astrophysical Data Analysis and Visualization Toolkit
where ���� is the gravitational potential and ���� is the mass density defined over thecomputational mesh as above. If Poisson’s equation is represented in terms of wave vectors,the equation is reduced to a simpler algebric operation:
���� ��
� �� ������ (2)
where ���� and ���� are the Fourier images of the potential and of the density respectively, and� �� � is the square module of the wavenumber. Finally, the potential is transformed into physicalspace using an inverse FFT [8].
Fourier decomposition, Power Spectrum and Correlation Function - The fluctuation of density��� � ����� � �������� is expressible as a Fourier series:
��� ���
������� � �� ���
��������� � ��� (3)
For a statistically homogeneous and isotropic density field, the variance across the statisticalensemble is:
�� � ��� ��
��
��
���
�
���
��
�
����� (4)
where, in the limit �� �, the quantity ��� �� is called Power Spectrum [9].
The covariance function can be defined in terms of density field ����:
�� � ������� � �������� � ��� �����
����� ������ � ��� (5)
and, passing to the limit �� � , we can see that the Power Spectrum is the Fourier Transformof the Covariance Function (Wiener-Khintchine theorem):
�� �
����������� � ����� (6)
Six modules were specifically implemented for the computation of the two-point CorrelationFunction and the Power Spectrum of a point distribution. The two-point Correlation Function ofAstroMD is based on the three-dimensional counterpart of the Peebles & Hauser estimator (1974):
��� ���� �
��� �����
��� �� (7)
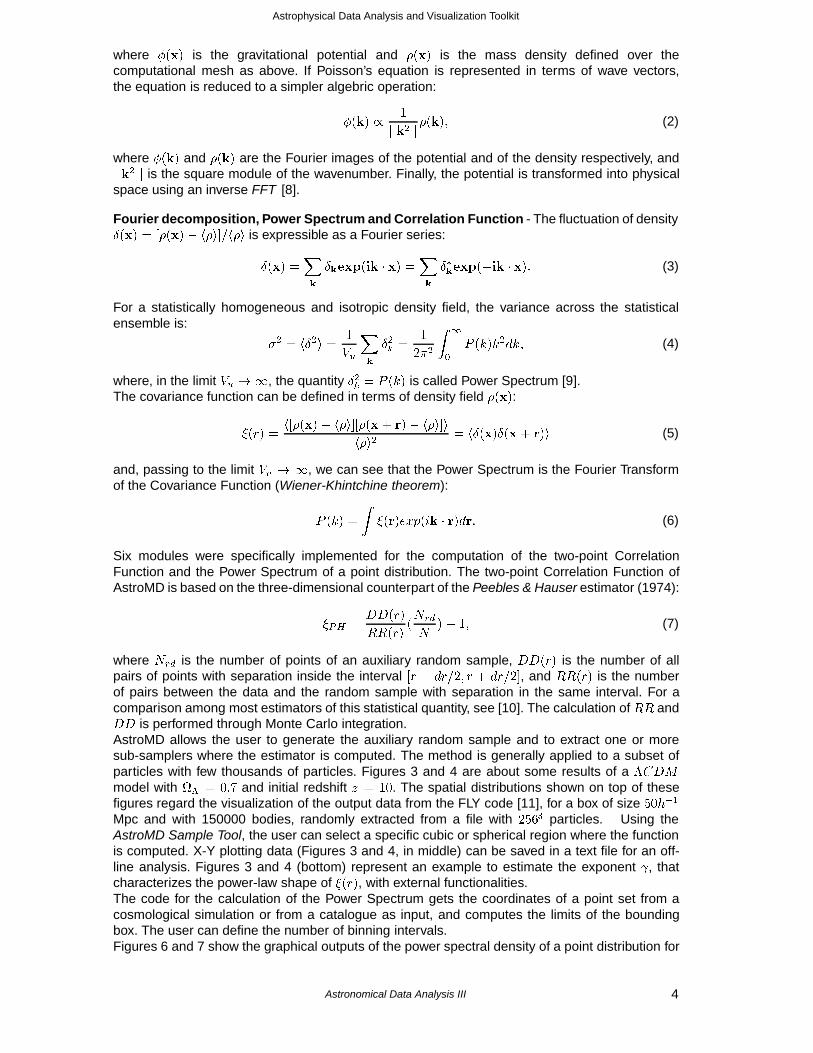
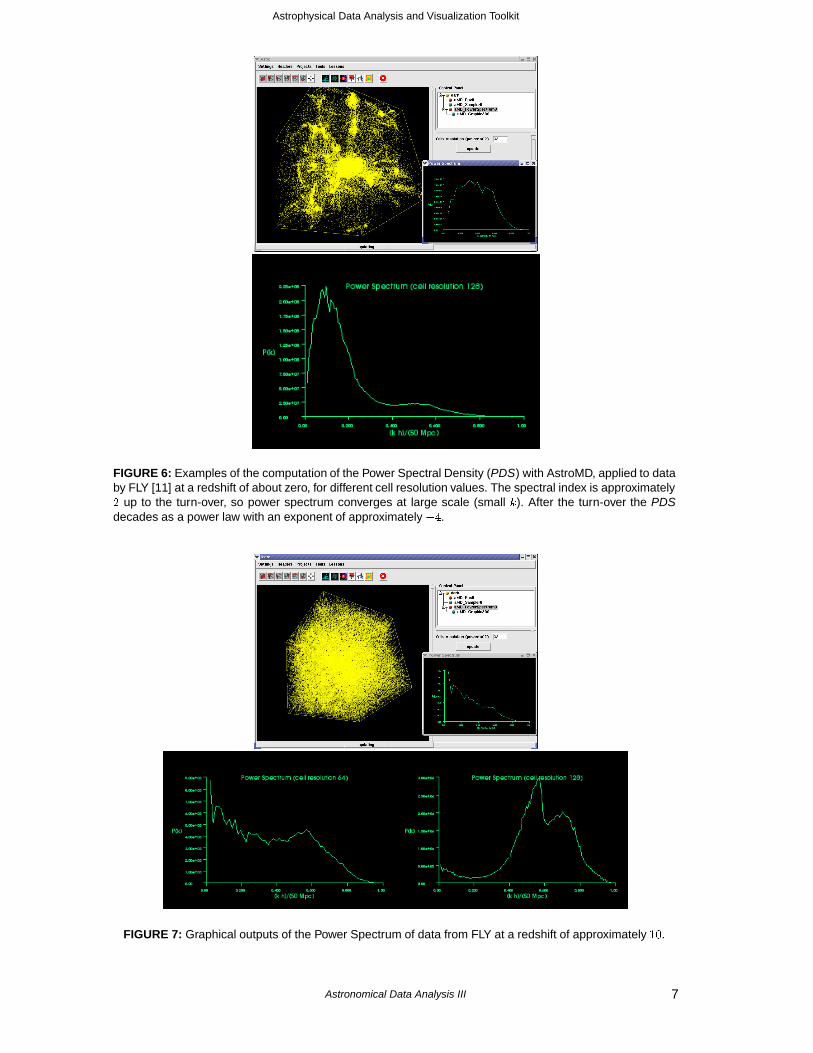
where ��� is the number of points of an auxiliary random sample, ��� � is the number of allpairs of points with separation inside the interval � � � ��� � � ���, and ��� � is the numberof pairs between the data and the random sample with separation in the same interval. For acomparison among most estimators of this statistical quantity, see [10]. The calculation of �� and�� is performed through Monte Carlo integration.AstroMD allows the user to generate the auxiliary random sample and to extract one or moresub-samplers where the estimator is computed. The method is generally applied to a subset ofparticles with few thousands of particles. Figures 3 and 4 are about some results of a ���model with � � ��� and initial redshift � � ��. The spatial distributions shown on top of thesefigures regard the visualization of the output data from the FLY code [11], for a box of size ����
Mpc and with 150000 bodies, randomly extracted from a file with � �� particles. Using theAstroMD Sample Tool, the user can select a specific cubic or spherical region where the functionis computed. X-Y plotting data (Figures 3 and 4, in middle) can be saved in a text file for an off-line analysis. Figures 3 and 4 (bottom) represent an example to estimate the exponent �, thatcharacterizes the power-law shape of �� �, with external functionalities.The code for the calculation of the Power Spectrum gets the coordinates of a point set from acosmological simulation or from a catalogue as input, and computes the limits of the boundingbox. The user can define the number of binning intervals.Figures 6 and 7 show the graphical outputs of the power spectral density of a point distribution for
Astronomical Data Analysis III 4
Astrophysical Data Analysis and Visualization Toolkit
FIGURE 3: Some applications of the analysis tools of AstroMD to output data from FLY code [11] at differentredshifts. From left to right, � � �� and � � ���. X-Y plotting data can be studied with external analysis tools.Bottom figures show an approach for characterizing the slope of the curves.
Astronomical Data Analysis III 5
Astrophysical Data Analysis and Visualization Toolkit
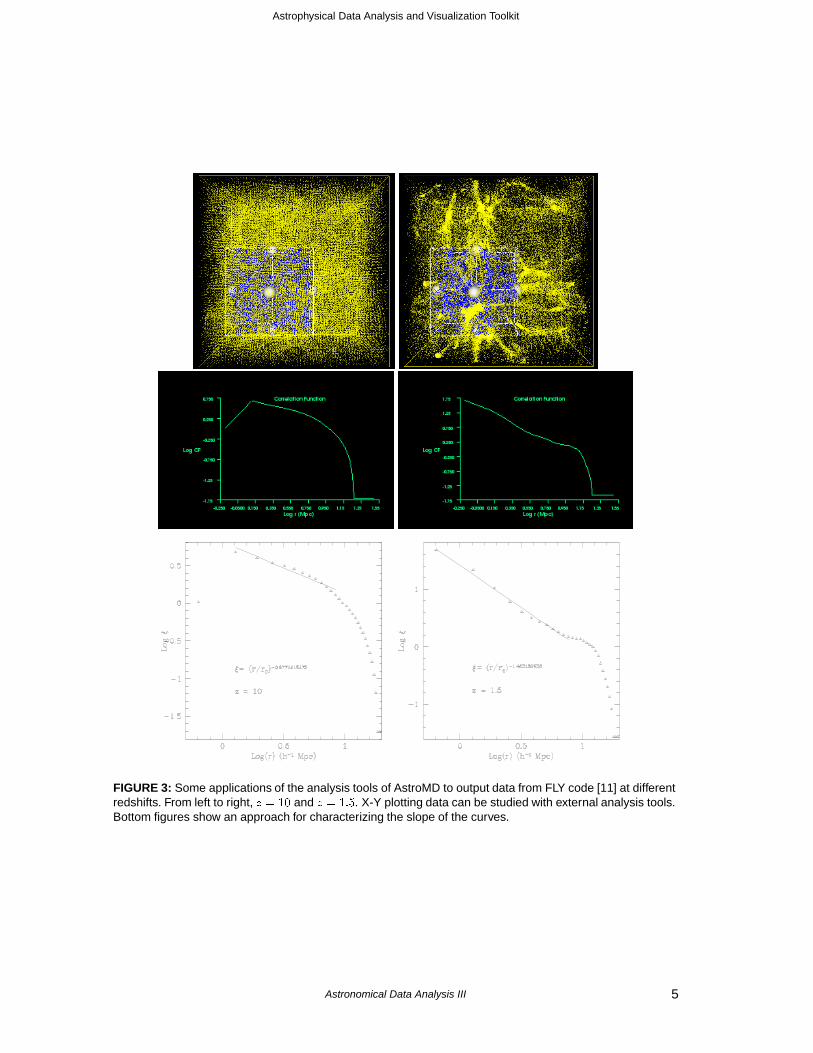
FIGURE 4: Examples of the two-point Correlation Function obtained at different redshifts for a ����simulation model.
FIGURE 5: Composition of the two-point Correlation Function in a logarithmic plot for the whole box (size�����Mpc) at different redshifts for the same cosmological model. The unit of time �, in this case, is a fractionof the Hubble time.
Astronomical Data Analysis III 6
Astrophysical Data Analysis and Visualization Toolkit
FIGURE 6: Examples of the computation of the Power Spectral Density (PDS) with AstroMD, applied to databy FLY [11] at a redshift of about zero, for different cell resolution values. The spectral index is approximately� up to the turn-over, so power spectrum converges at large scale (small �). After the turn-over the PDSdecades as a power law with an exponent of approximately��.
FIGURE 7: Graphical outputs of the Power Spectrum of data from FLY at a redshift of approximately ��.
Astronomical Data Analysis III 7
Astrophysical Data Analysis and Visualization Toolkit
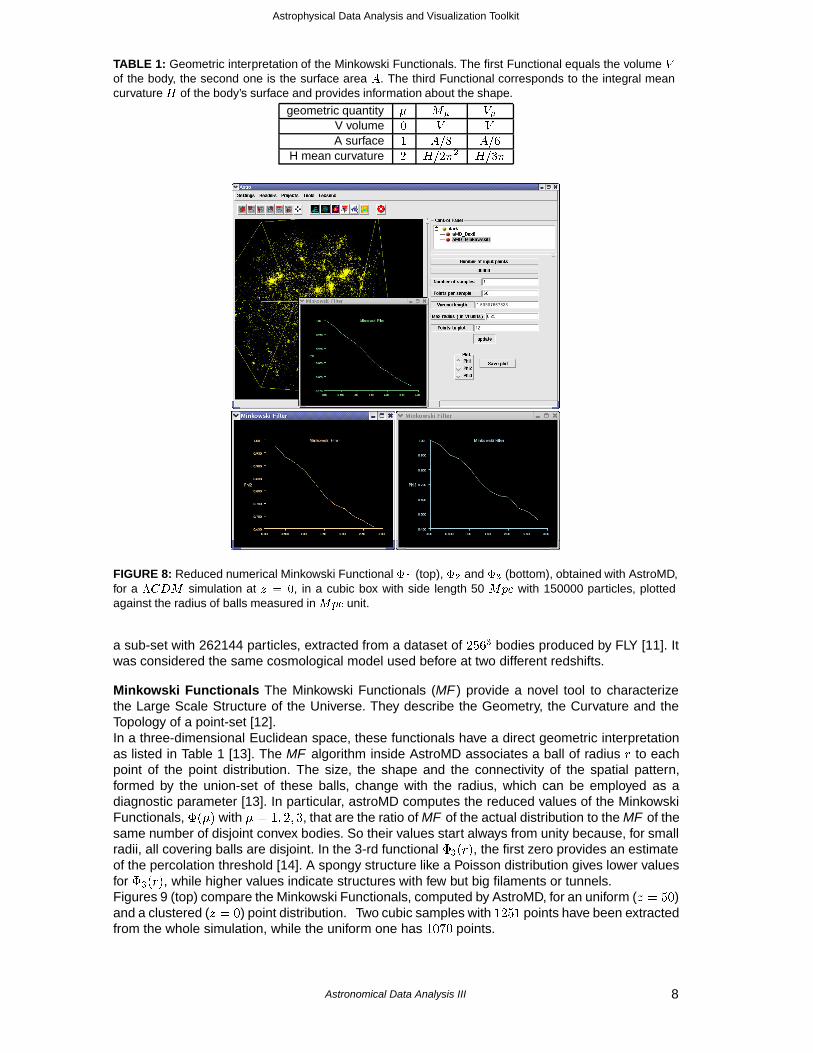
TABLE 1: Geometric interpretation of the Minkowski Functionals. The first Functional equals the volume of the body, the second one is the surface area . The third Functional corresponds to the integral meancurvature � of the body’s surface and provides information about the shape.
geometric quantity � �� �V volume �
A surface � �
H mean curvature � � ��� � �
FIGURE 8: Reduced numerical Minkowski Functional � � (top), �� and �� (bottom), obtained with AstroMD,for a ���� simulation at � � �, in a cubic box with side length 50 ��� with 150000 particles, plottedagainst the radius of balls measured in ��� unit.
a sub-set with 262144 particles, extracted from a dataset of � �� bodies produced by FLY [11]. Itwas considered the same cosmological model used before at two different redshifts.
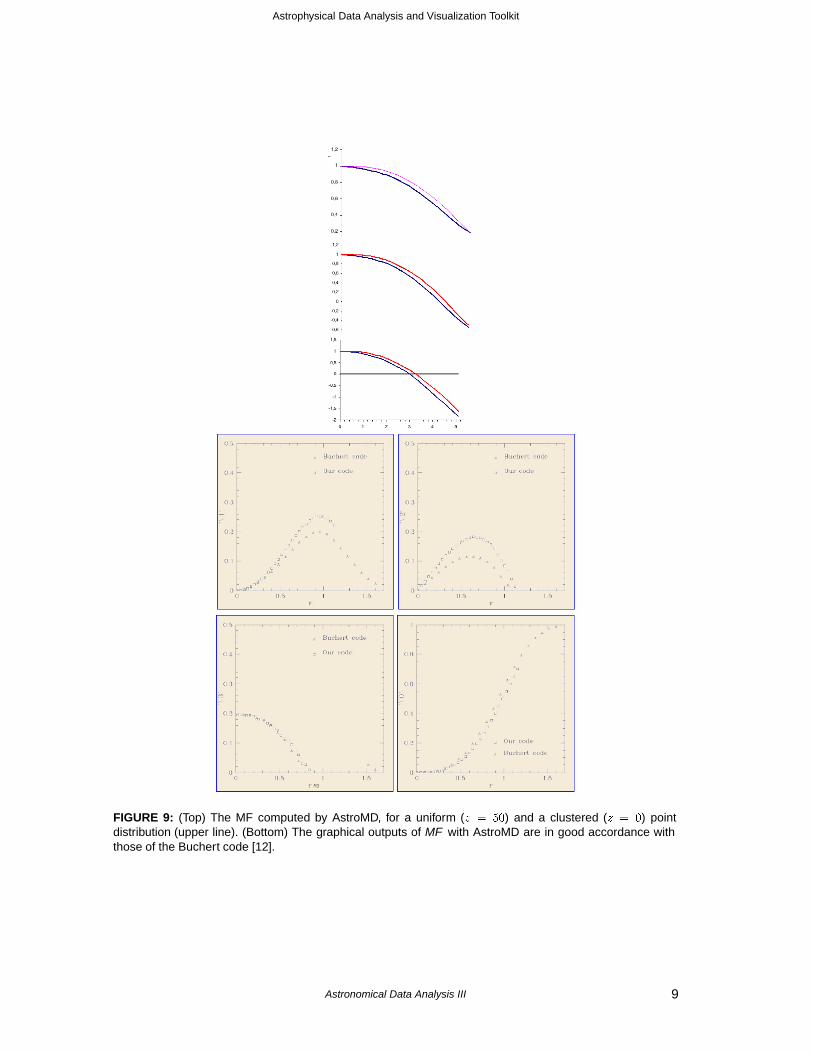
Minkowski Functionals The Minkowski Functionals (MF ) provide a novel tool to characterizethe Large Scale Structure of the Universe. They describe the Geometry, the Curvature and theTopology of a point-set [12].In a three-dimensional Euclidean space, these functionals have a direct geometric interpretationas listed in Table 1 [13]. The MF algorithm inside AstroMD associates a ball of radius to eachpoint of the point distribution. The size, the shape and the connectivity of the spatial pattern,formed by the union-set of these balls, change with the radius, which can be employed as adiagnostic parameter [13]. In particular, astroMD computes the reduced values of the MinkowskiFunctionals, ���� with � � �� �� �, that are the ratio of MF of the actual distribution to the MF of thesame number of disjoint convex bodies. So their values start always from unity because, for smallradii, all covering balls are disjoint. In the 3-rd functional ��� �, the first zero provides an estimateof the percolation threshold [14]. A spongy structure like a Poisson distribution gives lower valuesfor ��� �, while higher values indicate structures with few but big filaments or tunnels.Figures 9 (top) compare the Minkowski Functionals, computed by AstroMD, for an uniform (� � �)and a clustered (� � �) point distribution. Two cubic samples with �� � points have been extractedfrom the whole simulation, while the uniform one has ���� points.
Astronomical Data Analysis III 8
Astrophysical Data Analysis and Visualization Toolkit
FIGURE 9: (Top) The MF computed by AstroMD, for a uniform (� � ��) and a clustered (� � �) pointdistribution (upper line). (Bottom) The graphical outputs of MF with AstroMD are in good accordance withthose of the Buchert code [12].
Astronomical Data Analysis III 9
Astrophysical Data Analysis and Visualization Toolkit
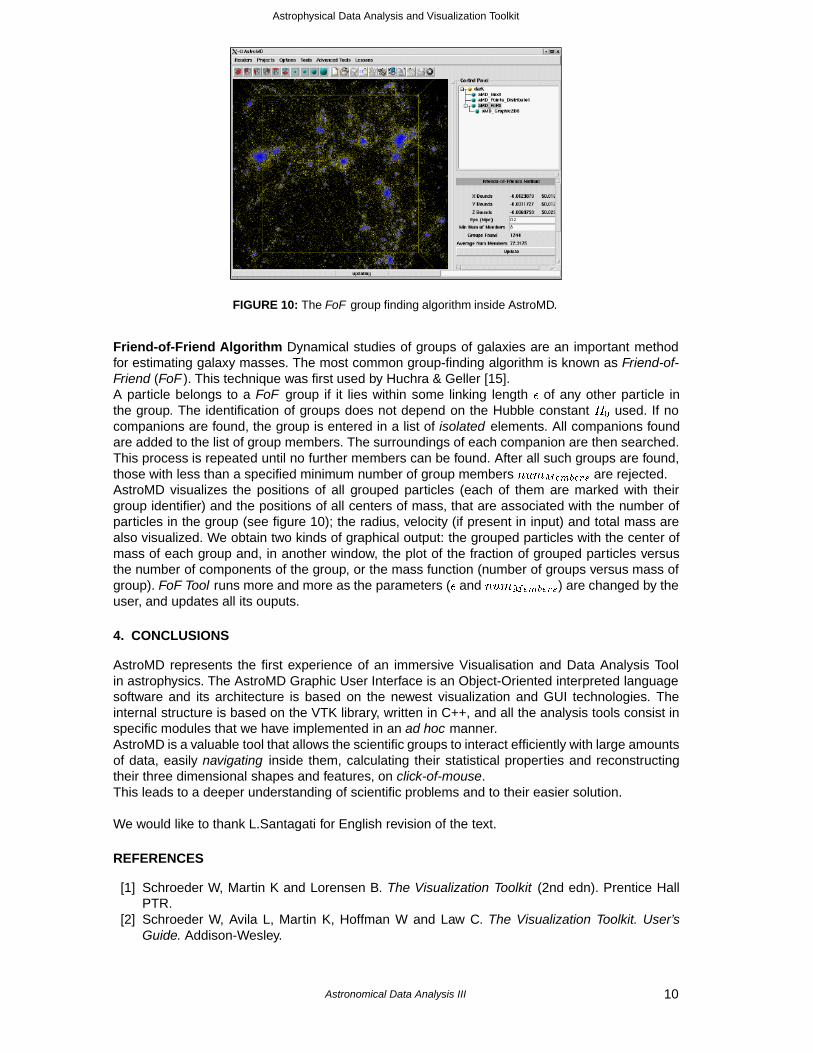
FIGURE 10: The FoF group finding algorithm inside AstroMD.
Friend-of-Friend Algorithm Dynamical studies of groups of galaxies are an important methodfor estimating galaxy masses. The most common group-finding algorithm is known as Friend-of-Friend (FoF ). This technique was first used by Huchra & Geller [15].A particle belongs to a FoF group if it lies within some linking length � of any other particle inthe group. The identification of groups does not depend on the Hubble constant �� used. If nocompanions are found, the group is entered in a list of isolated elements. All companions foundare added to the list of group members. The surroundings of each companion are then searched.This process is repeated until no further members can be found. After all such groups are found,those with less than a specified minimum number of group members �������� are rejected.AstroMD visualizes the positions of all grouped particles (each of them are marked with theirgroup identifier) and the positions of all centers of mass, that are associated with the number ofparticles in the group (see figure 10); the radius, velocity (if present in input) and total mass arealso visualized. We obtain two kinds of graphical output: the grouped particles with the center ofmass of each group and, in another window, the plot of the fraction of grouped particles versusthe number of components of the group, or the mass function (number of groups versus mass ofgroup). FoF Tool runs more and more as the parameters (� and ��������) are changed by theuser, and updates all its ouputs.
4. CONCLUSIONS
AstroMD represents the first experience of an immersive Visualisation and Data Analysis Toolin astrophysics. The AstroMD Graphic User Interface is an Object-Oriented interpreted languagesoftware and its architecture is based on the newest visualization and GUI technologies. Theinternal structure is based on the VTK library, written in C++, and all the analysis tools consist inspecific modules that we have implemented in an ad hoc manner.AstroMD is a valuable tool that allows the scientific groups to interact efficiently with large amountsof data, easily navigating inside them, calculating their statistical properties and reconstructingtheir three dimensional shapes and features, on click-of-mouse.This leads to a deeper understanding of scientific problems and to their easier solution.
We would like to thank L.Santagati for English revision of the text.
REFERENCES
[1] Schroeder W, Martin K and Lorensen B. The Visualization Toolkit (2nd edn). Prentice HallPTR.
[2] Schroeder W, Avila L, Martin K, Hoffman W and Law C. The Visualization Toolkit. User’sGuide. Addison-Wesley.
Astronomical Data Analysis III 10

Astrophysical Data Analysis and Visualization Toolkit
[3] http://www.kitware.com/[4] Welch B. Practical Programming in Tcl and Tk. Prentice Hall PTR.[5] www.tcltk.com/itcl/.[6] http://www.cineca.it/HPSystems/Vis.I.T/.[7] Hockney R and Eastwood J. Computer Simulation using particles. New York, Mac Graw Hill
HE.[8] Demmel J. Solving the Discrete Poisson Equation using Jacobi, SOR, Conjugate gradients
and the FFT. CS267 Lectures, 1996, 15-16.[9] Coles P and Lucchin F. Cosmology. The Origin and Evolution of Cosmic Structure. Wiley.
[10] Pons-Borderia M, Martinez V, Stoyan D, Stoyan H and Saar E. Comparing Estimators of theGalaxy Correlation Function. ApJ 523 480.
[11] Antonuccio-Delogu V, Becciani U and Ferro D. FLY. A parallel tree N-body code forcosmological simulations. Reference Guide. astro-ph/0310786.
[12] Platzoder M, and Buchert T. Applications of Minkowski-functionals to the Statistical Analysisof Dark Matter Models. astro-ph/9509014.
[13] Schmalzing J, Kerscher M and Buchert T. Minkowski Functionals in Cosmology. astro-ph/9508154.
[14] Mecke K and Wagner H. 1991, J. Stat. Phys., 64, 843.[15] Huchra J and Geller M. Groups of Galaxies I. Nearby Groups. ApJ 257 423.
Astronomical Data Analysis III 11