Embed Size (px)
Citation preview
Asw
ath Dam
odaran1
Valuation
Asw
ath Dam
odaran
http://ww
w.dam
odaran.com
Asw
ath Dam
odaran2
Some Initial T
houghts
" One hundred thousand lem
mings cannot be w
rong"
Graffiti

Asw
ath Dam
odaran3
Misconceptions about V
aluation
Myth 1: A
valuation is an objective search for “true” value•
Truth 1.1: A
ll valuations are biased. The only questions are how
much and in
which direction.
•T
ruth 1.2: The direction and m
agnitude of the bias in your valuation is directlyproportional to w
ho pays you and how m
uch you are paid.
Myth 2.: A
good valuation provides a precise estimate of value
•T
ruth 2.1: There are no precise valuations
•T
ruth 2.2: The payoff to valuation is greatest w
hen valuation is least precise.
Myth 3: . T
he more quantitative a m
odel, the better the valuation•
Truth 3.1: O
ne’s understanding of a valuation model is inversely proportional to
the number of inputs required for the m
odel.
•T
ruth 3.2: Simpler valuation m
odels do much better than com
plex ones.
Asw
ath Dam
odaran4
Approaches to V
aluation
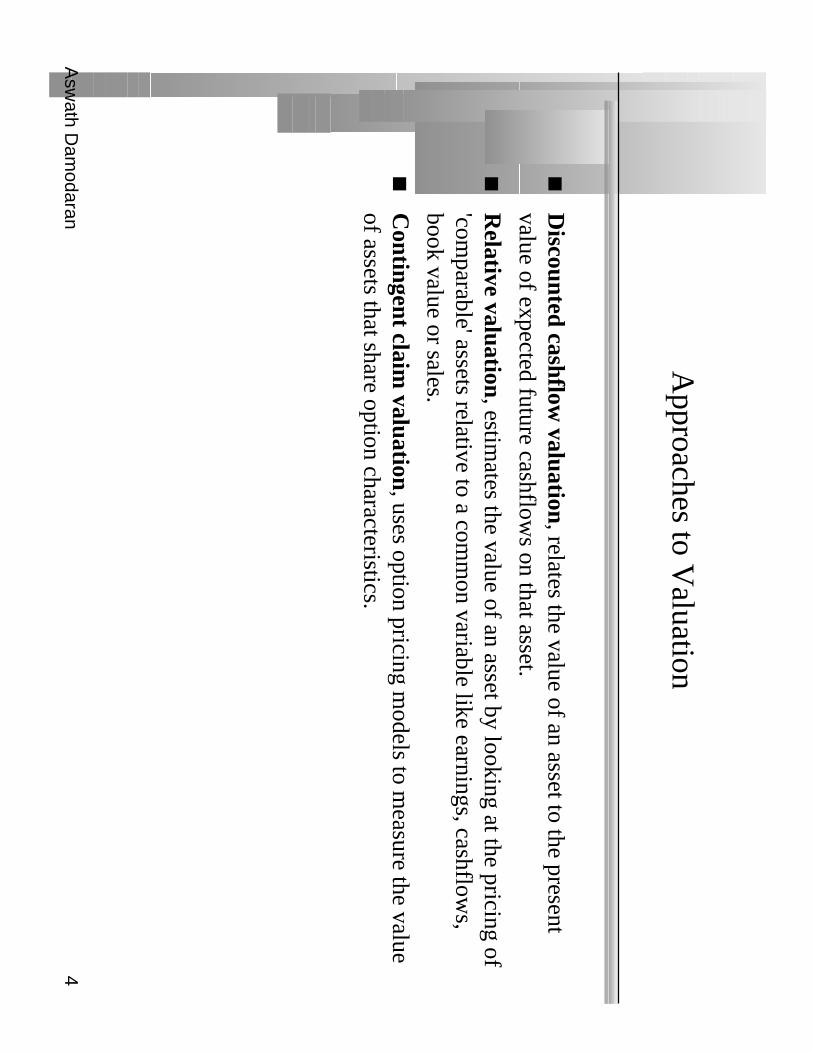
Discounted cashflow
valuation, relates the value of an asset to the present
value of expected future cashflows on that asset.
Relative valuation
, estimates the value of an asset by looking at the pricing of
'comparable' assets relative to a com
mon variable like earnings, cashflow
s,book value or sales.
Contingent claim
valuation, uses option pricing m
odels to measure the value
of assets that share option characteristics.
Asw
ath Dam
odaran5
Discounted C
ash Flow V
aluation
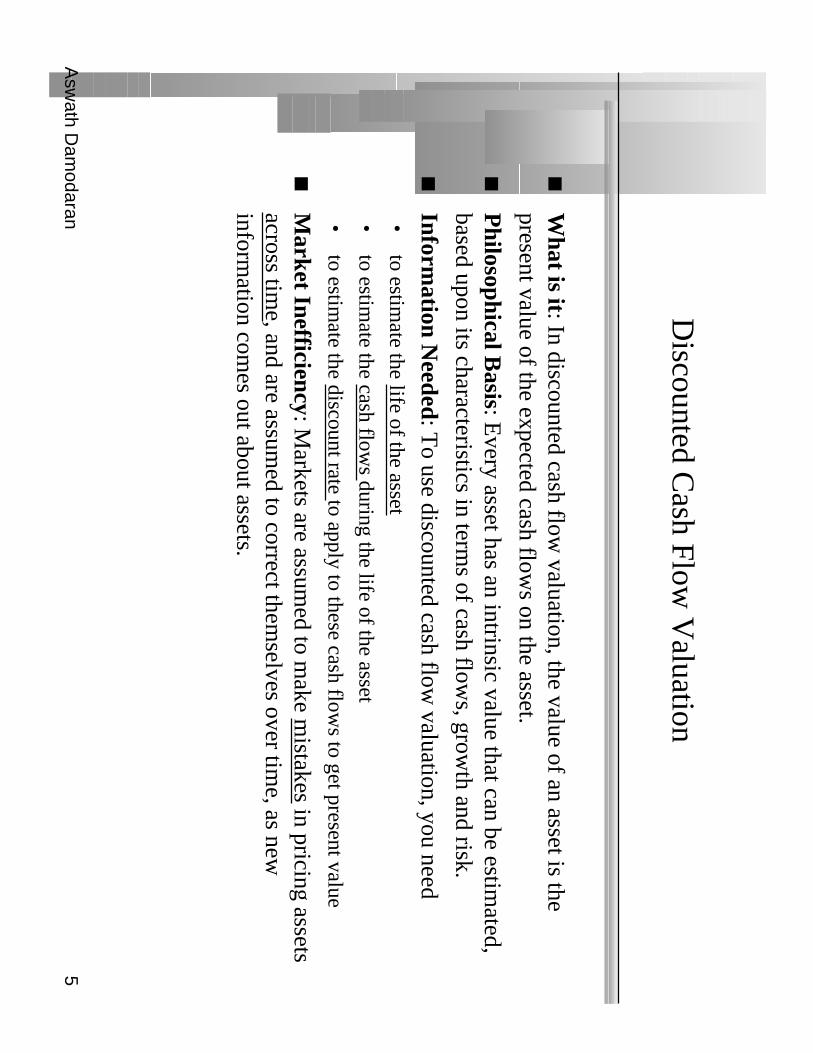
What is it: In discounted cash flow
valuation, the value of an asset is thepresent value of the expected cash flow
s on the asset.
Philosophical B
asis: Every asset has an intrinsic value that can be estim
ated,based upon its characteristics in term
s of cash flows, grow
th and risk.
Information N
eeded: To use discounted cash flow
valuation, you need•
to estimate the life of the asset
•to estim
ate the cash flows during the life of the asset
•to estim
ate the discount rate to apply to these cash flows to get present value
Market Inefficiency: M
arkets are assumed to m
ake mistakes in pricing assets
across time, and are assum
ed to correct themselves over tim
e, as newinform
ation comes out about assets.
Asw
ath Dam
odaran6
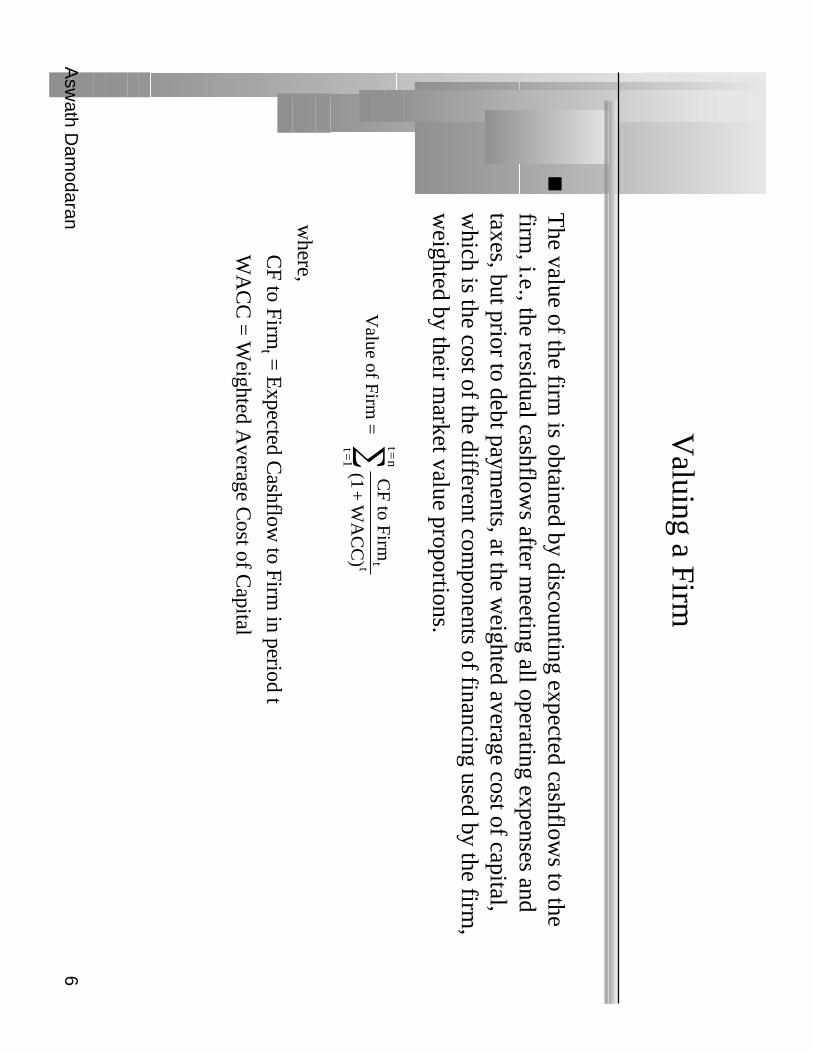
Valuing a Firm
The value of the firm
is obtained by discounting expected cashflows to the
firm, i.e., the residual cashflow
s after meeting all operating expenses and
taxes, but prior to debt payments, at the w
eighted average cost of capital,w
hich is the cost of the different components of financing used by the firm
,w
eighted by their market value proportions.
where,
CF to Firm
t = E
xpected Cashflow
to Firm in period t
WA
CC
= W
eighted Average C
ost of Capital
Value of F
irm=
C
F to F
irm
(1+
WA
CC
) ttt=
1
t=n
∑
Asw
ath Dam
odaran7
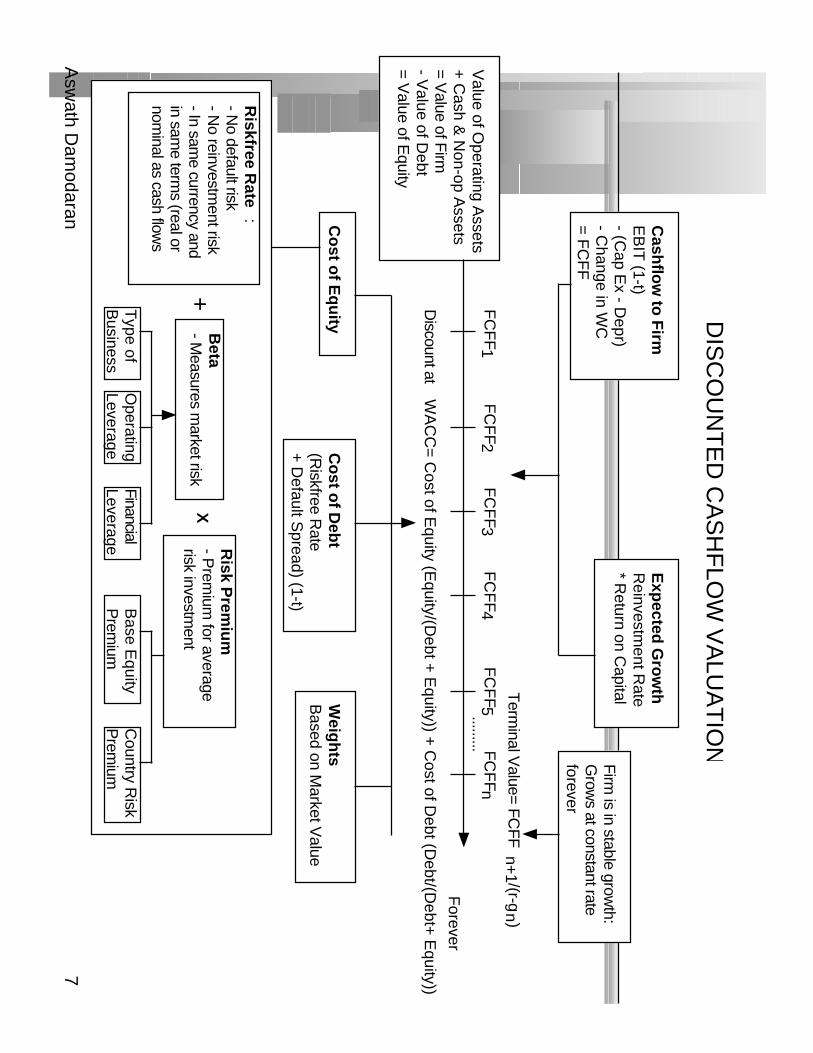
Cash
flow
to F
irmE
BIT
(1-t)- (C
ap Ex - D
epr)- C
hange in WC
= F
CF
F
Exp
ected G
row
thR
einvestment R
ate* R
eturn on Capital
FC
FF1
FC
FF2
FC
FF3
FC
FF4
FC
FF5
Forever
Firm
is in stable growth:
Grow
s at constant rateforever
Term
inal Value= F
CF
Fn+
1 /(r-gn
)
FC
FFn
.........
Co
st of E
qu
ityC
ost o
f Deb
t(R
iskfree Rate
+ D
efault Spread) (1-t)
Weig
hts
Based on M
arket Value
Discount at
WA
CC
= C
ost of Equity (E
quity/(Debt +
Equity)) +
Cost of D
ebt (Debt/(D
ebt+ E
quity))
Value of O
perating Assets
+ C
ash & N
on-op Assets
= Value of F
irm- V
alue of Debt
= Value of E
quity
Riskfree R
ate:
- No default risk
- No reinvestm
ent risk- In sam
e currency andin sam
e terms (real or
nominal as cash flow
s
+B
eta- M
easures market risk
X
Risk P
remiu
m- P
remium
for averagerisk investm
ent
Type of
Business
Operating
LeverageFinancialLeverage
Base E
quityP
remium
Country R
iskP
remium
DIS
CO
UN
TE
D C
AS
HF
LOW
VA
LUA
TIO
N
Asw
ath Dam
odaran8
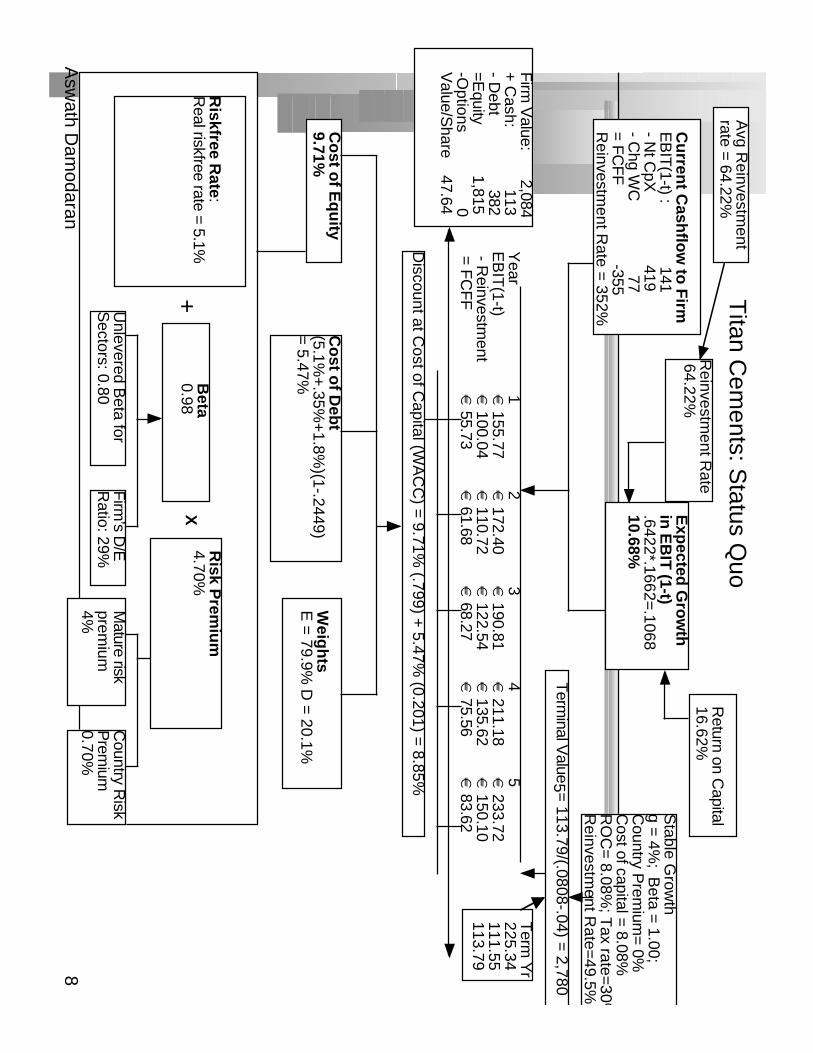
Cu
rrent C
ashflo
w to
Firm
EB
IT(1-t) : 141
- Nt C
pX 419
- Ch g W
C 77
= FC
FF
-355R
einvestment R
ate = 352%
Exp
ected G
row
th
in E
BIT
(1-t).6422*.1662=
.106810.68%
Stable G
rowth
g = 4%
; Beta =
1.00;C
ountry Prem
ium= 0%
Cost of capital = 8.08%
R
OC
= 8.08%
; Tax rate=
30 %R
einvestment R
ate=49.5%
Term
inal Value5 =
113.79/(.0808-.04) = 2,780
Co
st of E
qu
ity9.71%
Co
st of D
ebt
(5.1%+
.35%+
1.8%)(1-.2449)
= 5.47%
Weig
hts
E =
79.9% D
= 20.1%
Discount at C
ost of Capital (W
AC
C) =
9.71% (.799) +
5.47% (0.201) =
8.85%
Firm
Value: 2,084
+ C
ash: 113
- Debt 382
=Equity 1,815
-Options
0V
alue/Share 47.64
Riskfree R
ate:R
eal riskfree rate = 5.1%+
Beta
0.98X
Risk P
remiu
m4.70%
Unlevered B
eta for S
ectors: 0.80F
irm’s D
/ER
atio: 29%M
ature riskprem
ium4%
Country R
iskP
remium
0.70%
Titan C
ements: S
tatus Quo
Reinvestm
ent Rate
64.22%
Return on C
apital16.62%
Term
Yr
225.34111.55113.79
Avg R
einvestment
rate = 64.22%
Year
12
34
5E
BIT
(1-t)€
155.77€
172.40€
190.81€
211.18€
233.72 - R
einvestment
€ 100.04
€ 110.72
€ 122.54
€ 135.62
€ 150.10
= F
CF
F€
55.73€
61.68€
68.27€
75.56€
83.62
Asw
ath Dam
odaran9
FC
FF1
FC
FF2
FC
FF3
FC
FF4
FC
FF5
Forever
Term
inal Value= F
CF
Fn+
1/(r-g
n)
FC
FFn
.........
Co
st of E
qu
ityC
ost o
f Deb
t(R
iskfree Rate
+ D
efault Spread) (1-t)
Weig
hts
Based on M
arket Value
Discount at
WA
CC
= C
ost of Equity (E
quity/(Debt +
Equity)) +
Cost of D
ebt (Debt/(D
ebt+ E
quity))
Value of O
perating Assets
+ C
ash & N
on-op Assets
= Value of F
irm- V
alue of Debt
= Value of E
quity- E
quity Options
= Value of E
quity in Stock
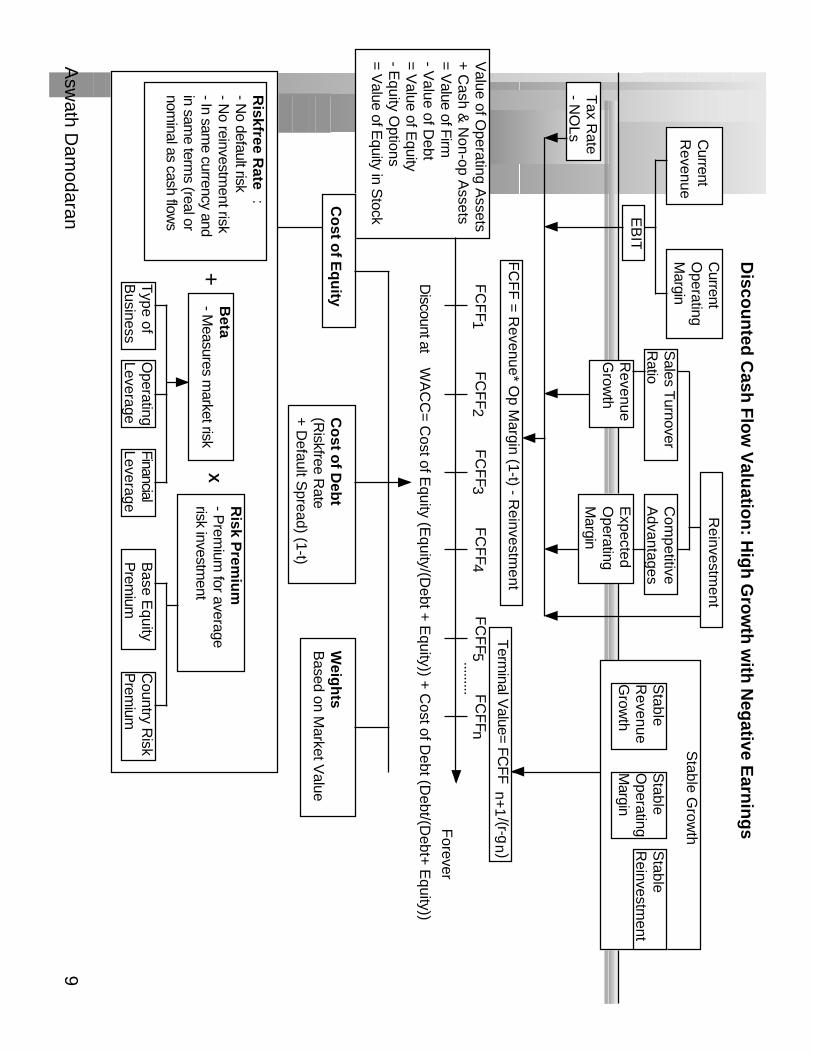
Riskfree R
ate:
- No default risk
- No reinvestm
ent risk- In sam
e currency andin sam
e terms (real or
nominal as cash flow
s
+B
eta- M
easures market risk
X
Risk P
remiu
m- P
remium
for averagerisk investm
ent
Type of
Business
Operating
LeverageFinancialLeverage
Base E
quityP
remium
Country R
iskP
remium
Current
Revenue
Current
Operating
Margin
Reinvestm
ent
Sales T
urnoverR
atioC
ompetitive
Advantages
Revenue
Grow
thE
xpected O
perating M
argin
Stable G
rowth
Stable
Revenue
Grow
th
Stable
Operating
Margin
Stable
Reinvestm
ent
Disco
un
ted C
ash F
low
Valu
ation
: Hig
h G
row
th w
ith N
egative E
arnin
gs
EB
IT
Tax R
ate- N
OLs
FC
FF
= R
evenue* Op M
argin (1-t) - Reinvestm
ent
Asw
ath Dam
odaran10
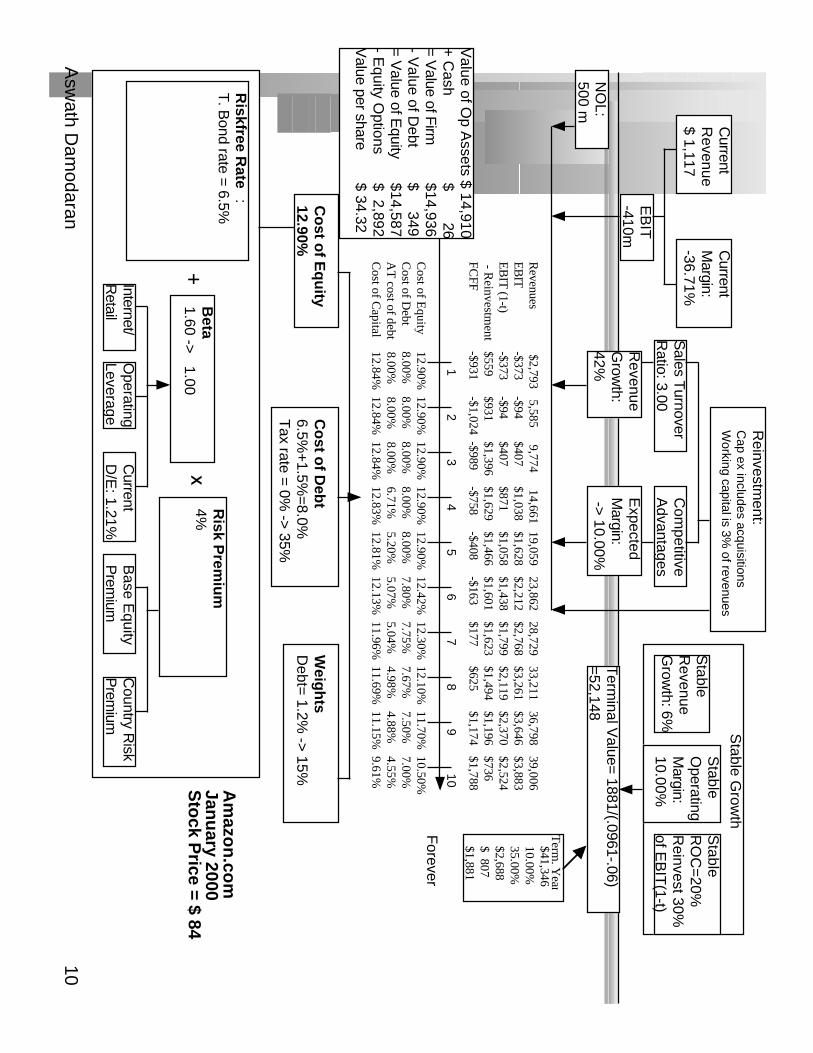
Forever
Term
inal Value= 1881/(.0961-.06)
=52,148
Co
st of E
qu
ity12.90%
Co
st of D
ebt
6.5%+
1.5%=
8.0%T
ax rate = 0% -> 35%
Weig
hts
Debt=
1.2% ->
15%
Value of O
p Assets $ 14,910
+ C
ash $ 26
= Value of F
irm$14,936
- Value of D
ebt$ 349
= Value of E
quity$14,587
- Equity O
ptions$ 2,892
Value per share
$ 34.32
Riskfree R
ate:
T. B
ond rate = 6.5%
+B
eta1.60 ->
1.00X
Risk P
remiu
m4%
Internet/R
etailO
perating Leverage
Current
D/E
: 1.21%B
ase Equity
Prem
iumC
ountry Risk
Prem
ium
Current
Revenue
$ 1,117
Current
Margin:
-36.71%
Reinvestm
ent:C
ap ex includes acquisitionsW
orking capital is 3% of revenues
Sales T
urnoverR
atio: 3.00C
ompetitive
Advantages
Revenue
Grow
th:42%
Expected
Margin:
-> 10.00%
Stable G
rowth
Stable
Revenue
Grow
th: 6%
Stable
Operating
Margin:
10.00%
Stable
RO
C=
20%R
einvest 30%
of EB
IT(1-t)
EB
IT-410m
NO
L:500 m
$41,346 10.00%
35.00%$2,688 $ 807 $1,881
Term
. Yea r
24
31
56
89
107
Cost of E
quity12.90%
12.90%12.90%
12.90%12.90%
12.42%12.30%
12.10%11.70%
10.50%C
ost of Debt
8.00%8.00%
8.00%8.00%
8.00%7.80%
7.75%7.67%
7.50%7.00%
AT
cost of debt8.00%
8.00%8.00%
6.71%5.20%
5.07%5.04%
4.98%4.88%
4.55%C
ost of Capital
12.84%12.84%
12.84%12.83%
12.81%12.13%
11.96%11.69%
11.15%9.61%
Revenues
$2,793 5,585
9,774 14,661
19,059 23,862
28,729 33,211
36,798 39,006
E
BIT
-$373-$94
$407$1,038
$1,628$2,212
$2,768$3,261
$3,646$3,883
EB
IT (1-t)
-$373-$94
$407$871
$1,058$1,438
$1,799$2,119
$2,370$2,524
- Reinvestm
ent$559
$931$1,396
$1,629$1,466
$1,601$1,623
$1,494$1,196
$736FC
FF-$931
-$1,024-$989
-$758-$408
-$163$177
$625$1,174
$1,788Am
azon
.com
Janu
ary 2000S
tock P
rice = $ 84
Asw
ath Dam
odaran11
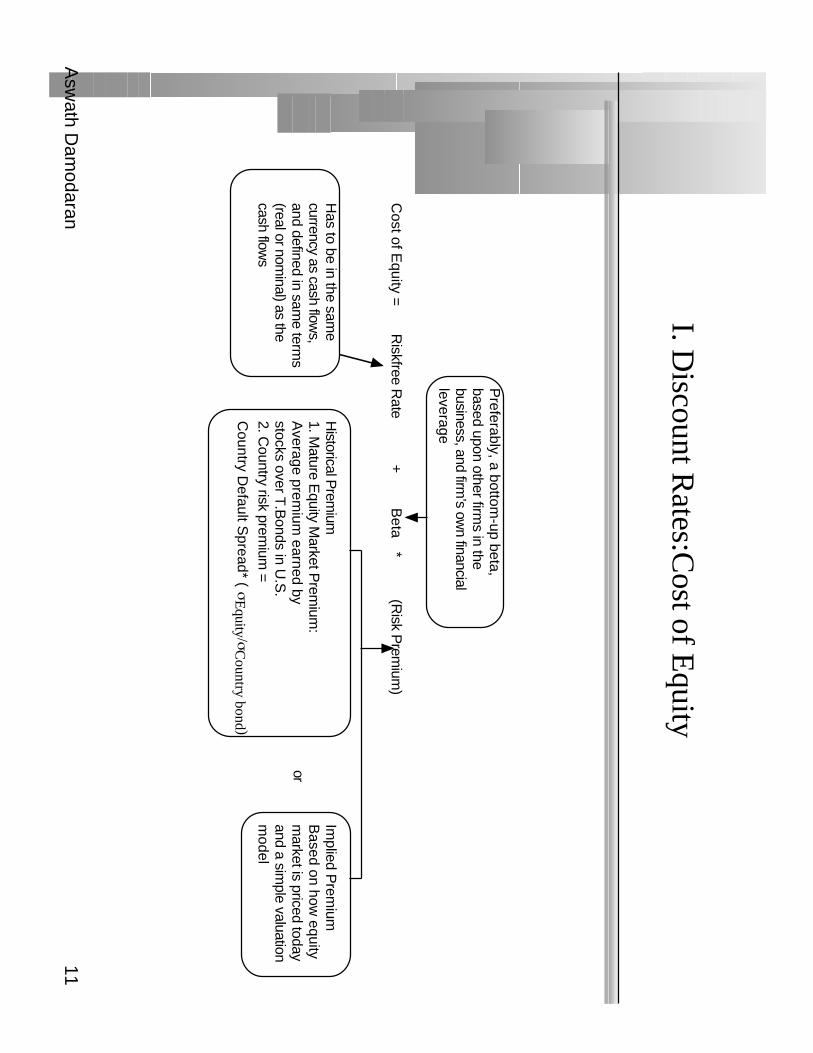
I. Discount R
ates:Cost of E
quity
Cost of E
quity =R
iskfree Rate
+B
eta*
(Risk P
remium
)
Has to be in the sam
ecurrency as cash flow
s, and defined in sam
e terms
(real or nominal) as the
cash flows
Preferably, a bottom
-up beta,based upon other firm
s in thebusiness, and firm
’s own financial
leverage
Historical P
remium
1. Mature E
quity Market P
remium
:A
verage premium
earned bystocks over T
.Bonds in U
.S.
2. Country risk prem
ium =
Country D
efault Spread* (
σE
quity /σC
ountry bond )
Implied P
remium
Based on how
equitym
arket is priced todayand a sim
ple valuationm
odel
or
Asw
ath Dam
odaran12
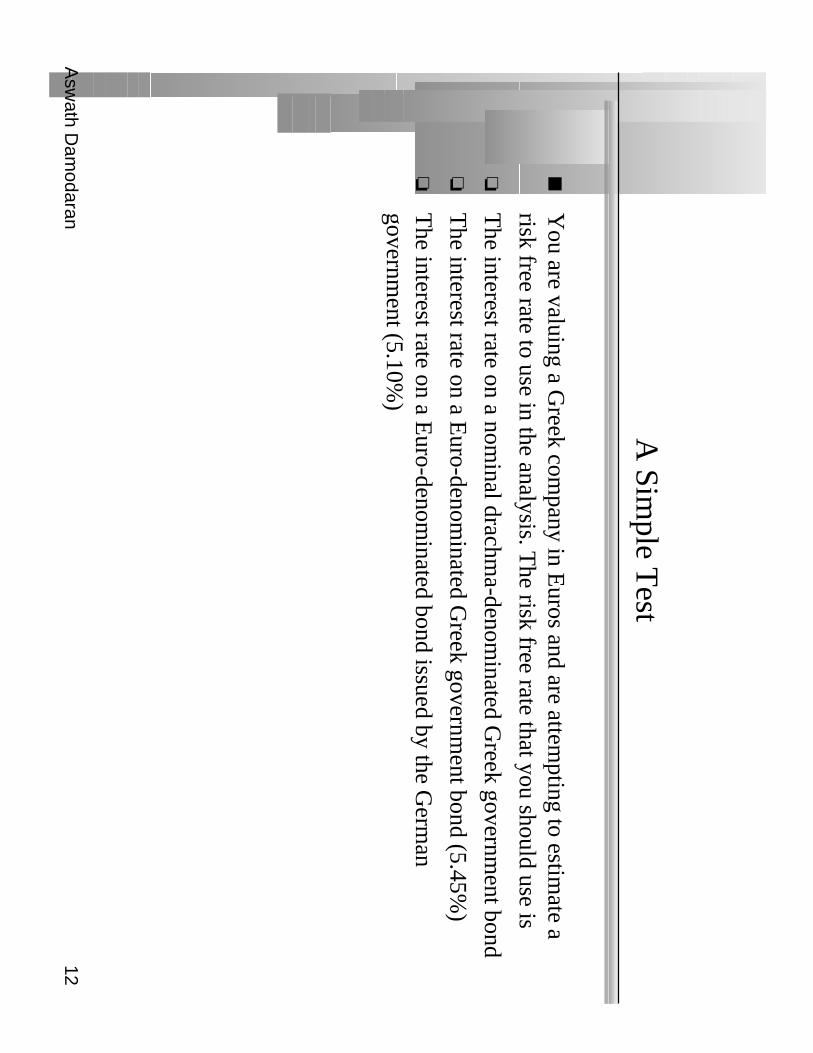
A Sim
ple Test
You are valuing a G
reek company in E
uros and are attempting to estim
ate arisk free rate to use in the analysis. T
he risk free rate that you should use is
The interest rate on a nom
inal drachma-denom
inated Greek governm
ent bond
The interest rate on a E
uro-denominated G
reek government bond (5.45%
)
The interest rate on a E
uro-denominated bond issued by the G
erman
government (5.10%
)

Asw
ath Dam
odaran13
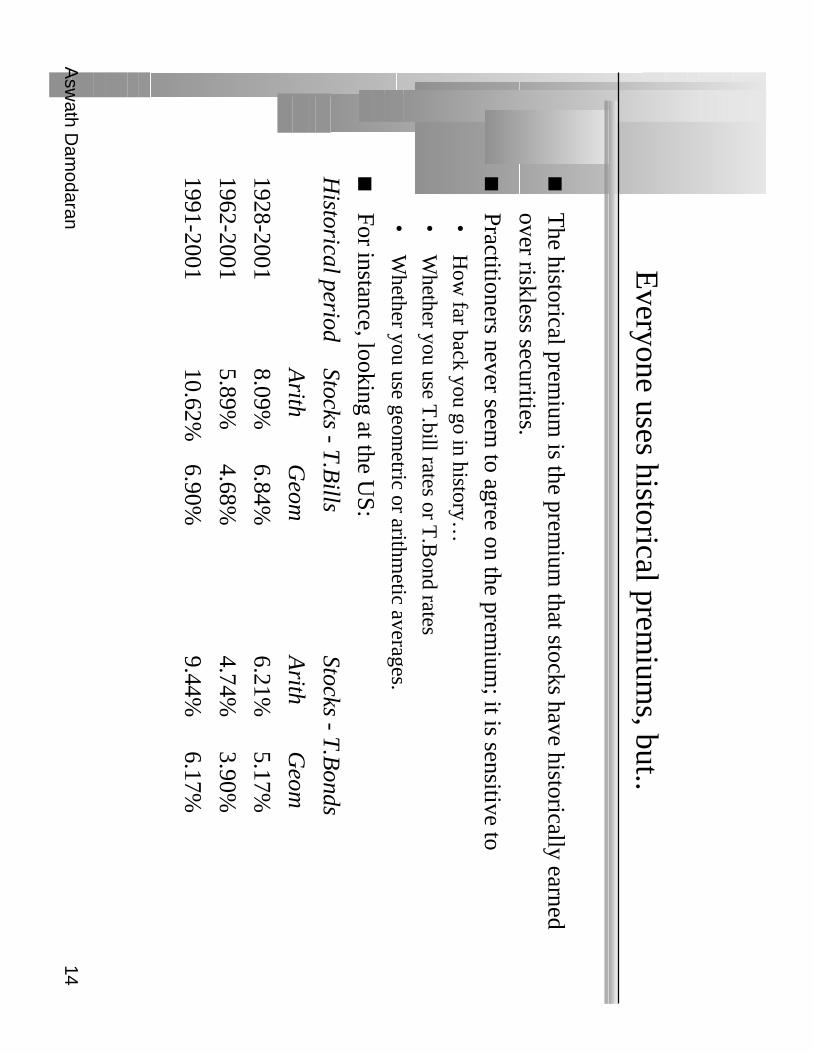
Everyone uses historical prem
iums, but..
The historical prem
ium is the prem
ium that stocks have historically earned
over riskless securities.
Practitioners never seem to agree on the prem
ium; it is sensitive to
•H
ow far back you go in history…
•W
hether you use T.bill rates or T
.Bond rates
•W
hether you use geometric or arithm
etic averages.
For instance, looking at the US:
Historical period
Stocks - T.B
illsStocks - T
.Bonds
Arith
Geom
Arith
Geom
1928-20018.09%
6.84%6.21%
5.17%
1962-20015.89%
4.68%4.74%
3.90%
1991-200110.62%
6.90%9.44%
6.17%
Asw
ath Dam
odaran14
Everyone uses historical prem
iums, but..
The historical prem
ium is the prem
ium that stocks have historically earned
over riskless securities.
Practitioners never seem to agree on the prem
ium; it is sensitive to
•H
ow far back you go in history…
•W
hether you use T.bill rates or T
.Bond rates
•W
hether you use geometric or arithm
etic averages.
For instance, looking at the US:
Historical period
Stocks - T.B
illsStocks - T
.Bonds
Arith
Geom
Arith
Geom
1928-20018.09%
6.84%6.21%
5.17%
1962-20015.89%
4.68%4.74%
3.90%
1991-200110.62%
6.90%9.44%
6.17%
Asw
ath Dam
odaran15
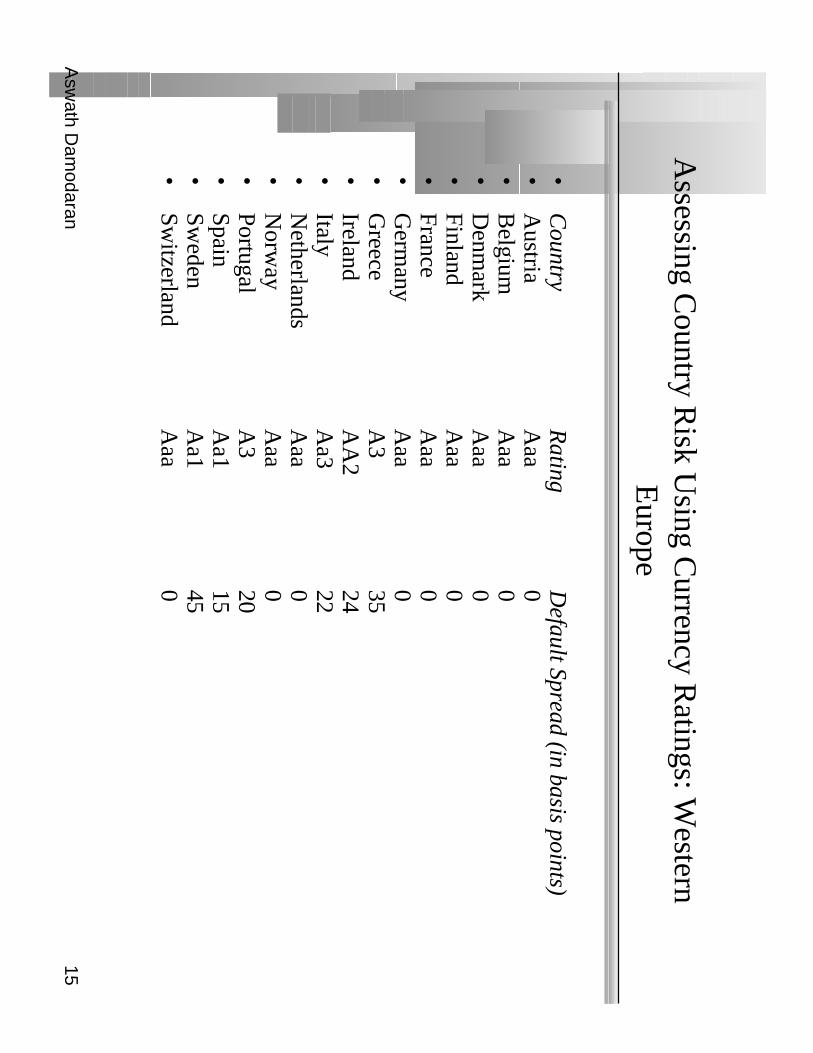
Assessing C
ountry Risk U
sing Currency R
atings: Western
Europe
•C
ountryR
atingD
efault Spread (in basis points)•
Austria
Aaa
0•
Belgium
Aaa
0•
Denm
arkA
aa0
•Finland
Aaa
0•
FranceA
aa0
•G
ermany
Aaa
0•
Greece
A3
35•
IrelandA
A2
24•
ItalyA
a322
•N
etherlandsA
aa0
•N
orway
Aaa
0•
PortugalA
320
•Spain
Aa1
15•
Sweden
Aa1
45•
Switzerland
Aaa
0
Asw
ath Dam
odaran16
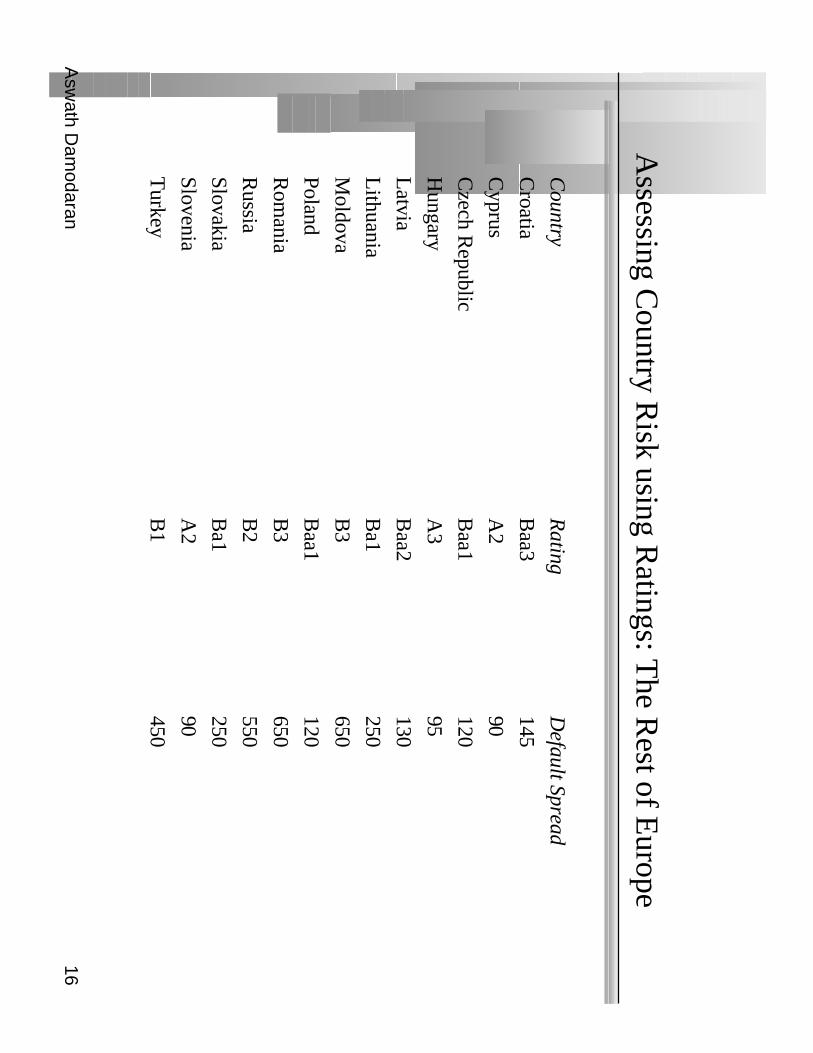
Assessing C
ountry Risk using R
atings: The R
est of Europe
Country
Rating
Default Spread
Croatia
Baa3
145
Cyprus
A2
90
Czech R
epublicB
aa1120
Hungary
A3
95
Latvia
Baa2
130
Lithuania
Ba1
250
Moldova
B3
650
PolandB
aa1120
Rom
aniaB
3650
Russia
B2
550
SlovakiaB
a1250
SloveniaA
290
Turkey
B1
450

Asw
ath Dam
odaran17
Using C
ountry Ratings to E
stimate E
quity Spreads
Country ratings m
easure default risk. While default risk prem
iums and equity
risk premium
s are highly correlated, one would expect equity spreads to be
higher than debt spreads.•
One w
ay to adjust the country spread upwards is to use inform
ation from the U
Sm
arket. In the US, the equity risk prem
ium has been roughly tw
ice the defaultspread on junk bonds.
•A
nother is to multiply the bond spread by the relative volatility of stock and bond
prices in that market. For exam
ple,–
Standard Deviation in G
reek ASE
(Equity) =
32%
–Standard D
eviation in Greek E
uro Bond =
16%
–A
djusted Equity Spread =
0.35% (32/16) =
0.70 %
Asw
ath Dam
odaran18
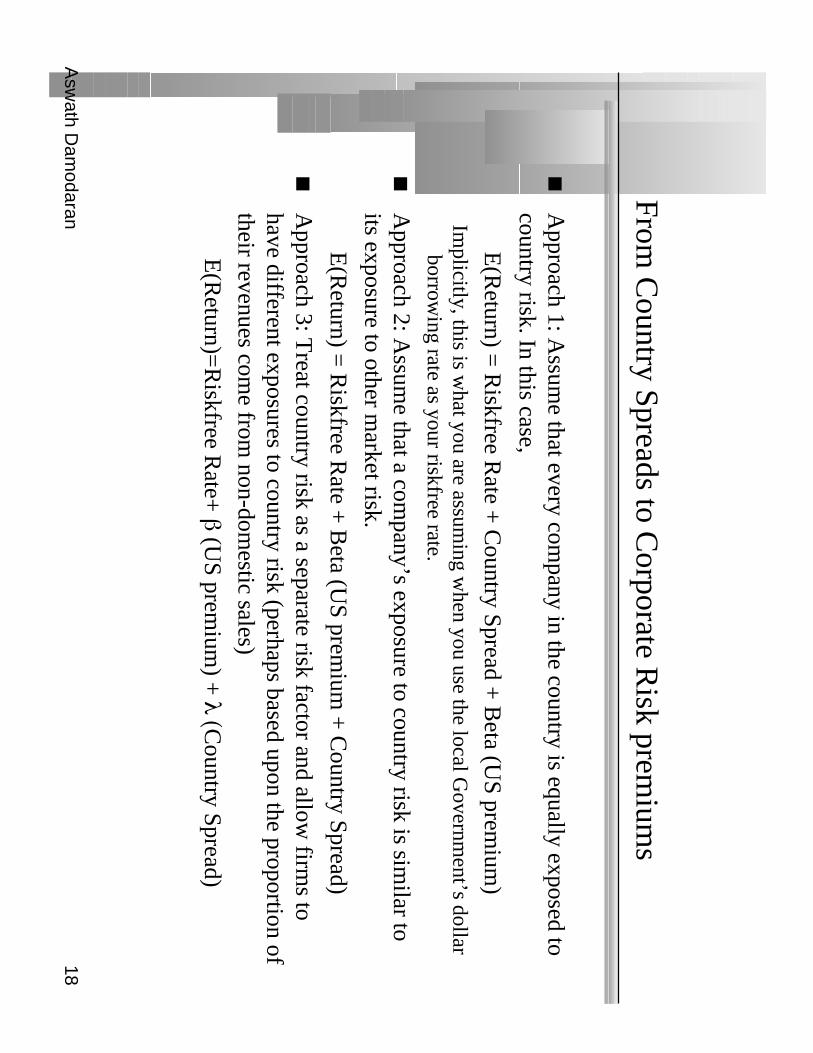
From C
ountry Spreads to Corporate R
isk premium
s
Approach 1: A
ssume that every com
pany in the country is equally exposed tocountry risk. In this case,
E(R
eturn) = R
iskfree Rate +
Country Spread +
Beta (U
S premium
)Im
plicitly, this is what you are assum
ing when you use the local G
overnment’s dollar
borrowing rate as your riskfree rate.
Approach 2: A
ssume that a com
pany’s exposure to country risk is similar to
its exposure to other market risk.
E(R
eturn) = R
iskfree Rate +
Beta (U
S premium
+ C
ountry Spread)
Approach 3: T
reat country risk as a separate risk factor and allow firm
s tohave different exposures to country risk (perhaps based upon the proportion oftheir revenues com
e from non-dom
estic sales)
E(R
eturn)=R
iskfree Rate+
β (US prem
ium) +
λ (Country Spread)
Asw
ath Dam
odaran19
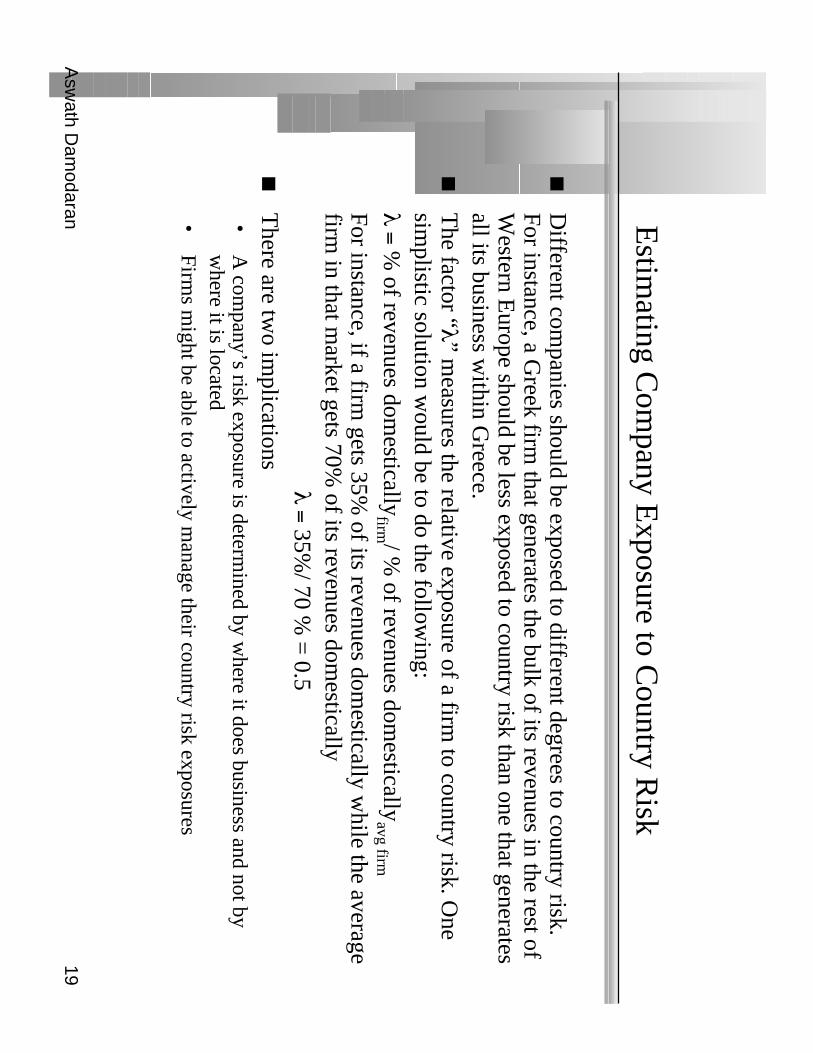
Estim
ating Com
pany Exposure to C
ountry Risk
Different com
panies should be exposed to different degrees to country risk.For instance, a G
reek firm that generates the bulk of its revenues in the rest of
Western E
urope should be less exposed to country risk than one that generatesall its business w
ithin Greece.
The factor “λ” m
easures the relative exposure of a firm to country risk. O
nesim
plistic solution would be to do the follow
ing:λ = %
of revenues domestically
firm / % of revenues dom
esticallyavg firm
For instance, if a firm gets 35%
of its revenues domestically w
hile the averagefirm
in that market gets 70%
of its revenues domestically
λ = 35%/ 70 %
= 0.5
There are tw
o implications
•A
company’s risk exposure is determ
ined by where it does business and not by
where it is located
•Firm
s might be able to actively m
anage their country risk exposures
Asw
ath Dam
odaran20
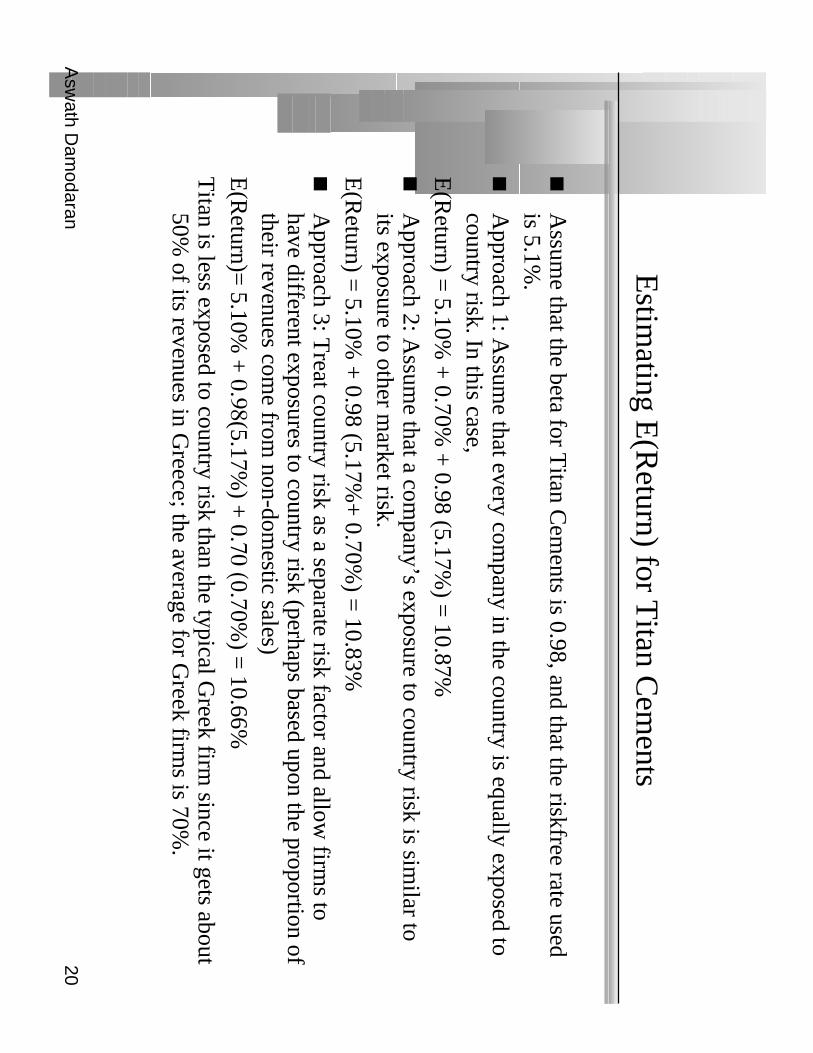
Estim
ating E(R
eturn) for Titan C
ements
Assum
e that the beta for Titan C
ements is 0.98, and that the riskfree rate used
is 5.1%.
Approach 1: A
ssume that every com
pany in the country is equally exposed tocountry risk. In this case,
E(R
eturn) = 5.10%
+ 0.70%
+ 0.98 (5.17%
) = 10.87%
Approach 2: A
ssume that a com
pany’s exposure to country risk is similar to
its exposure to other market risk.
E(R
eturn) = 5.10%
+ 0.98 (5.17%
+ 0.70%
) = 10.83%
Approach 3: T
reat country risk as a separate risk factor and allow firm
s tohave different exposures to country risk (perhaps based upon the proportion oftheir revenues com
e from non-dom
estic sales)E
(Return)=
5.10% +
0.98(5.17%) +
0.70 (0.70%) =
10.66%T
itan is less exposed to country risk than the typical Greek firm
since it gets about50%
of its revenues in Greece; the average for G
reek firms is 70%
.
Asw
ath Dam
odaran21
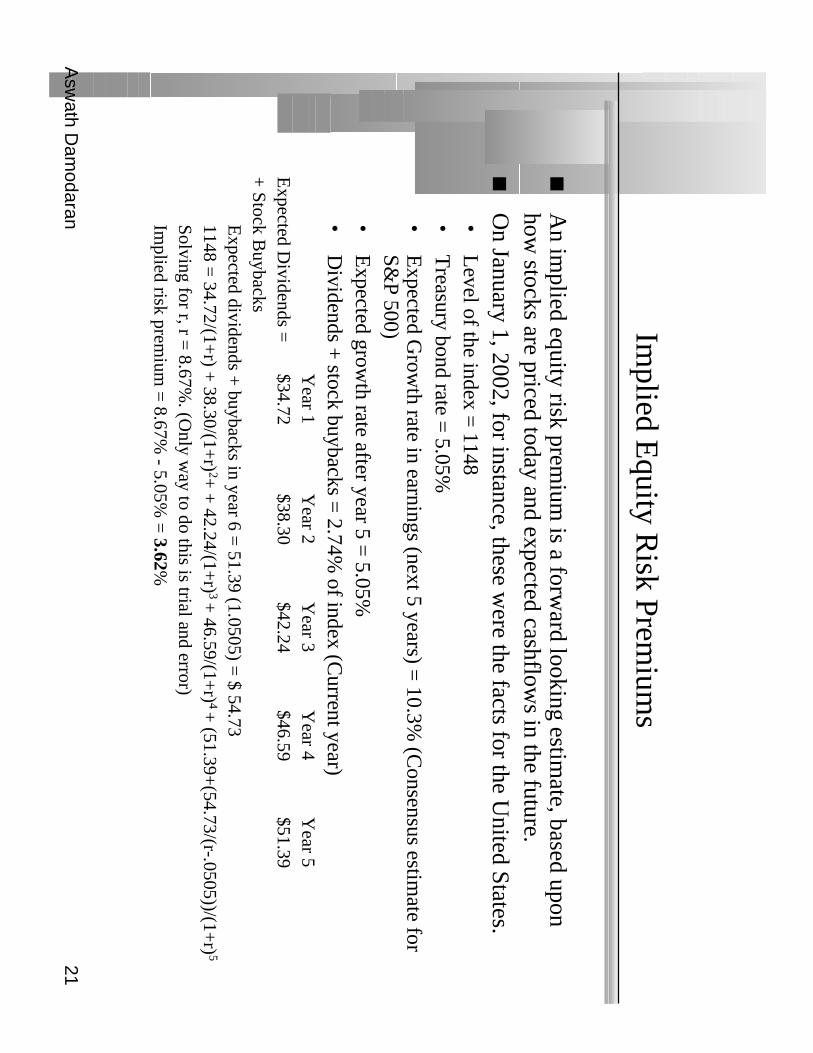
Implied E
quity Risk Prem
iums
An im
plied equity risk premium
is a forward looking estim
ate, based uponhow
stocks are priced today and expected cashflows in the future.
On January 1, 2002, for instance, these w
ere the facts for the United States.
•L
evel of the index = 1148
•T
reasury bond rate = 5.05%
•E
xpected Grow
th rate in earnings (next 5 years) = 10.3%
(Consensus estim
ate forS&
P 500)•
Expected grow
th rate after year 5 = 5.05%
•D
ividends + stock buybacks =
2.74% of index (C
urrent year)Y
ear 1Y
ear 2Y
ear 3Y
ear 4Y
ear 5E
xpected Dividends =
$34.72$38.30
$42.24$46.59
$51.39+
Stock Buybacks
Expected dividends +
buybacks in year 6 = 51.39 (1.0505) =
$ 54.731148 =
34.72/(1+r) +
38.30/(1+r) 2+
+ 42.24/(1+
r) 3 + 46.59/(1+
r) 4 + (51.39+
(54.73/(r-.0505))/(1+r) 5
Solving for r, r = 8.67%
. (Only w
ay to do this is trial and error)Im
plied risk premium
= 8.67%
- 5.05% =
3.62%

Asw
ath Dam
odaran22
U.S. E
quity Risk Prem
iums - 1960 - 2002
Imp
lied P
remiu
m fo
r US
Eq
uity M
arket
0.0
0%
1.0
0%
2.0
0%
3.0
0%
4.0
0%
5.0
0%
6.0
0%
7.0
0%
1960
1962
1964
1966
1968
1970
1972
1974
1976
1978
1980
1982
1984
1986
1988
1990
1992
1994
1996
1998
2000
Year
Implied Premium
Asw
ath Dam
odaran23
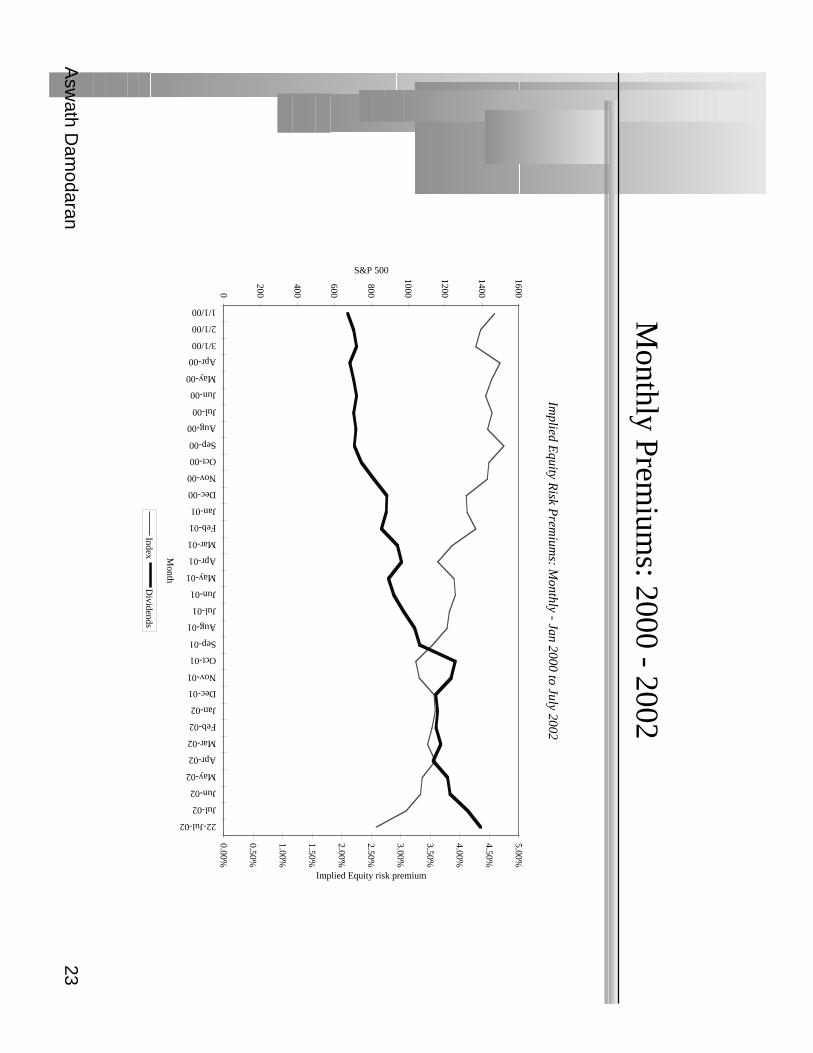
Monthly Prem
iums: 2000 - 2002
Implied E
quity Risk P
remium
s: Monthly - Jan 2000 to July 2002
0
200
400
600
800
1000
1200
1400
1600
1/1/00
2/1/00
3/1/00
Apr-00
May-00
Jun-00
Jul-00
Aug-00
Sep-00
Oct-00
Nov-00
Dec-00
Jan-01
Feb-01
Mar-01
Apr-01
May-01
Jun-01
Jul-01
Aug-01
Sep-01
Oct-01
Nov-01
Dec-01
Jan-02
Feb-02
Mar-02
Apr-02
May-02
Jun-02
Jul-02
22-Jul-02
Month
S&P 500
0.00%
0.50%
1.00%
1.50%
2.00%
2.50%
3.00%
3.50%
4.00%
4.50%
5.00%
Implied Equity risk premium
IndexD
ividends
Asw
ath Dam
odaran24
An Interm
ediate Solution
The historical risk prem
ium of 5.17%
for the United States is too high a
premium
to use in valuation. It is much higher than the actual im
plied equityrisk prem
ium in the m
arket
The current im
plied equity risk premium
requires us to assume that the m
arketis correctly priced today. (If I w
ere required to be market neutral, this is the
premium
I would use)
The average im
plied equity risk premium
between 1960-2001 in the U
nitedStates is about 4%
. We w
ill use this as the premium
for a mature equity
market.
Asw
ath Dam
odaran25
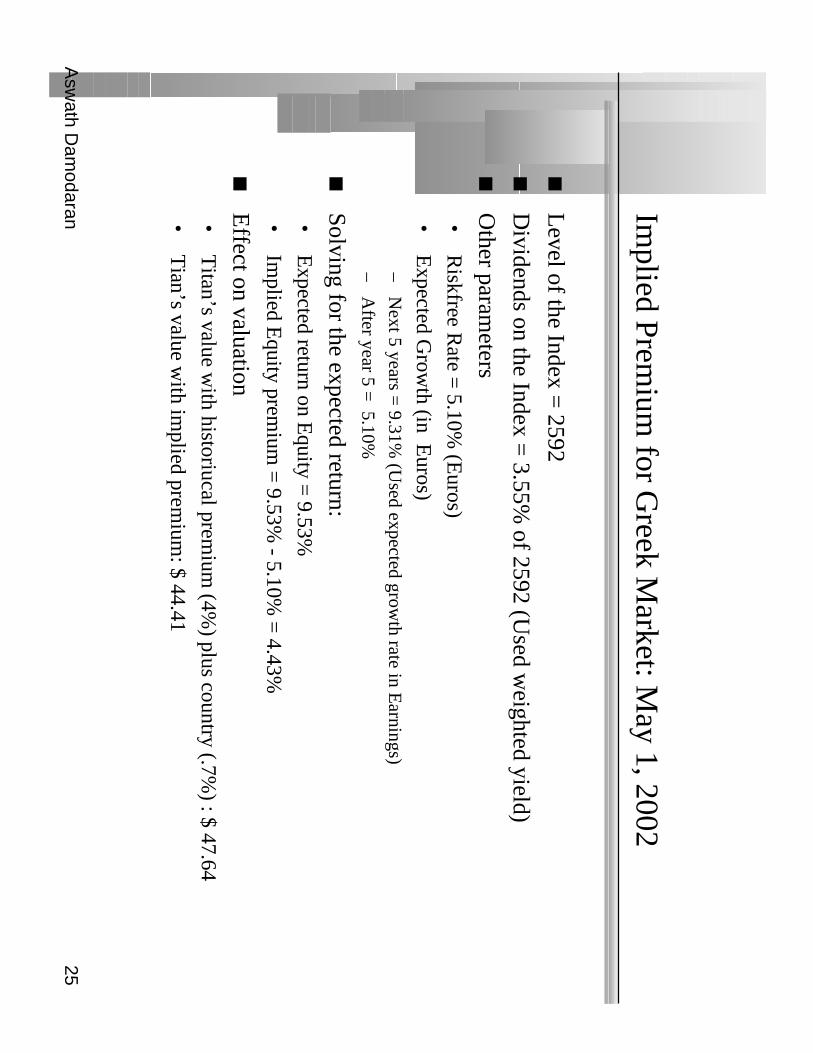
Implied Prem
ium for G
reek Market: M
ay 1, 2002
Level of the Index =
2592
Dividends on the Index =
3.55% of 2592 (U
sed weighted yield)
Other param
eters•
Riskfree R
ate = 5.10%
(Euros)
•E
xpected Grow
th (in Euros)
–N
ext 5 years = 9.31%
(Used expected grow
th rate in Earnings)
–A
fter year 5 = 5.10%
Solving for the expected return:•
Expected return on E
quity = 9.53%
•Im
plied Equity prem
ium =
9.53% - 5.10%
= 4.43%
Effect on valuation•
Titan’s value w
ith historiucal premium
(4%) plus country (.7%
) : $ 47.64
•T
ian’s value with im
plied premium
: $ 44.41
Asw
ath Dam
odaran26
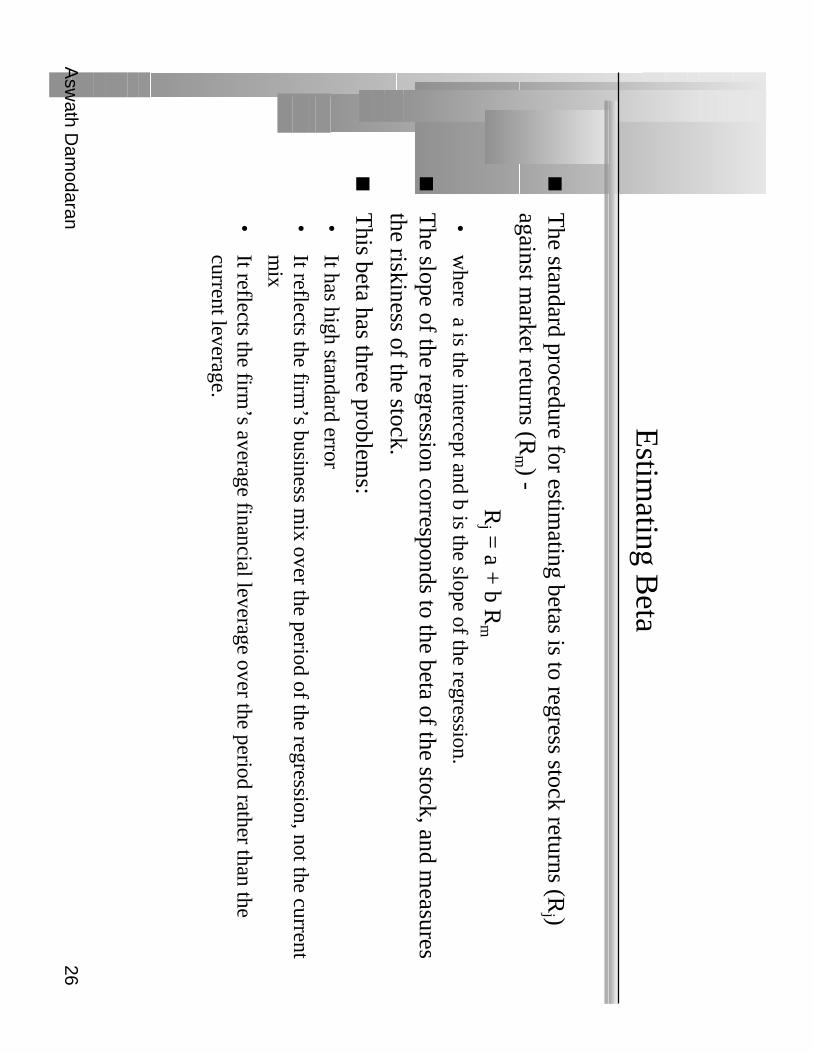
Estim
ating Beta
The standard procedure for estim
ating betas is to regress stock returns (Rj )
against market returns (R
m ) -
Rj =
a + b R
m
•w
here a is the intercept and b is the slope of the regression.
The slope of the regression corresponds to the beta of the stock, and m
easuresthe riskiness of the stock.
This beta has three problem
s:•
It has high standard error
•It reflects the firm
’s business mix over the period of the regression, not the current
mix
•It reflects the firm
’s average financial leverage over the period rather than thecurrent leverage.

Asw
ath Dam
odaran27
Beta E
stimation: A
mazon
Asw
ath Dam
odaran28
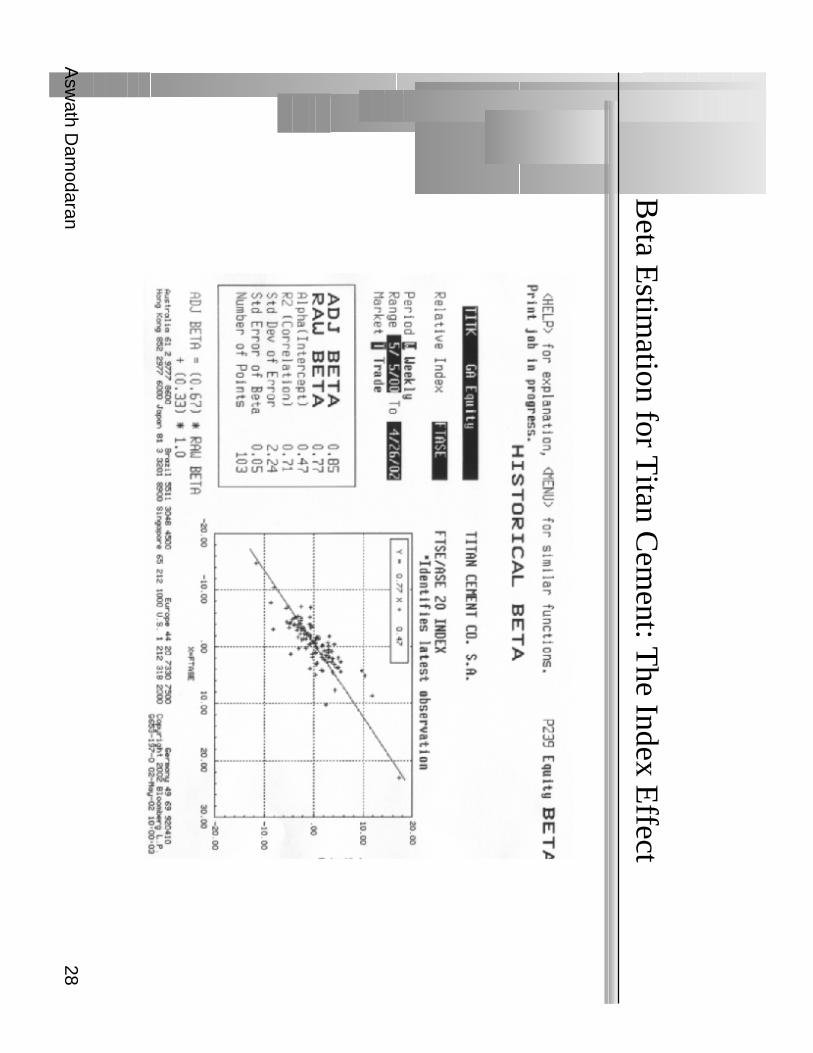
Beta E
stimation for T
itan Cem
ent: The Index E
ffect
Asw
ath Dam
odaran29
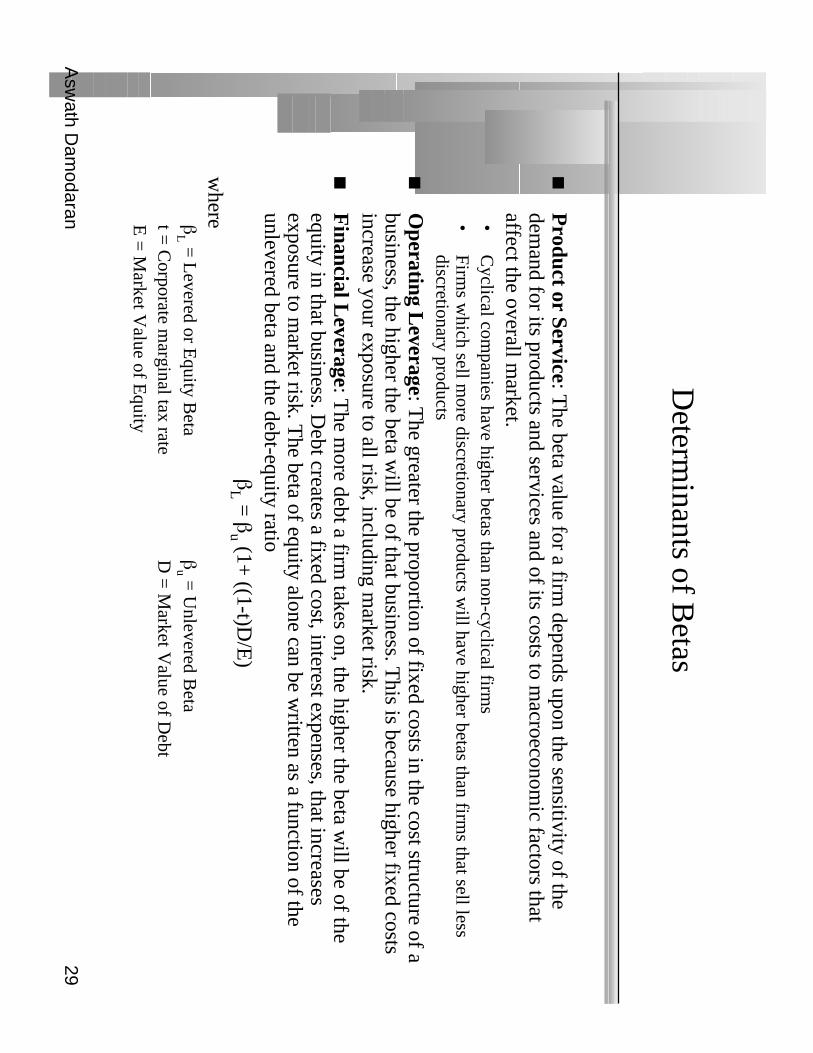
Determ
inants of Betas
Product or Service: T
he beta value for a firm depends upon the sensitivity of the
demand for its products and services and of its costs to m
acroeconomic factors that
affect the overall market.
•C
yclical companies have higher betas than non-cyclical firm
s•
Firms w
hich sell more discretionary products w
ill have higher betas than firms that sell less
discretionary products
Operating L
everage: The greater the proportion of fixed costs in the cost structure of a
business, the higher the beta will be of that business. T
his is because higher fixed costsincrease your exposure to all risk, including m
arket risk.F
inancial Leverage: T
he more debt a firm
takes on, the higher the beta will be of the
equity in that business. Debt creates a fixed cost, interest expenses, that increases
exposure to market risk. T
he beta of equity alone can be written as a function of the
unlevered beta and the debt-equity ratioβ
L = βu (1+
((1-t)D/E
)w
hereβL =
Levered or E
quity Beta
βu =
Unlevered B
etat =
Corporate m
arginal tax rateD
= M
arket Value of D
ebtE
= M
arket Value of E
quity
Asw
ath Dam
odaran30
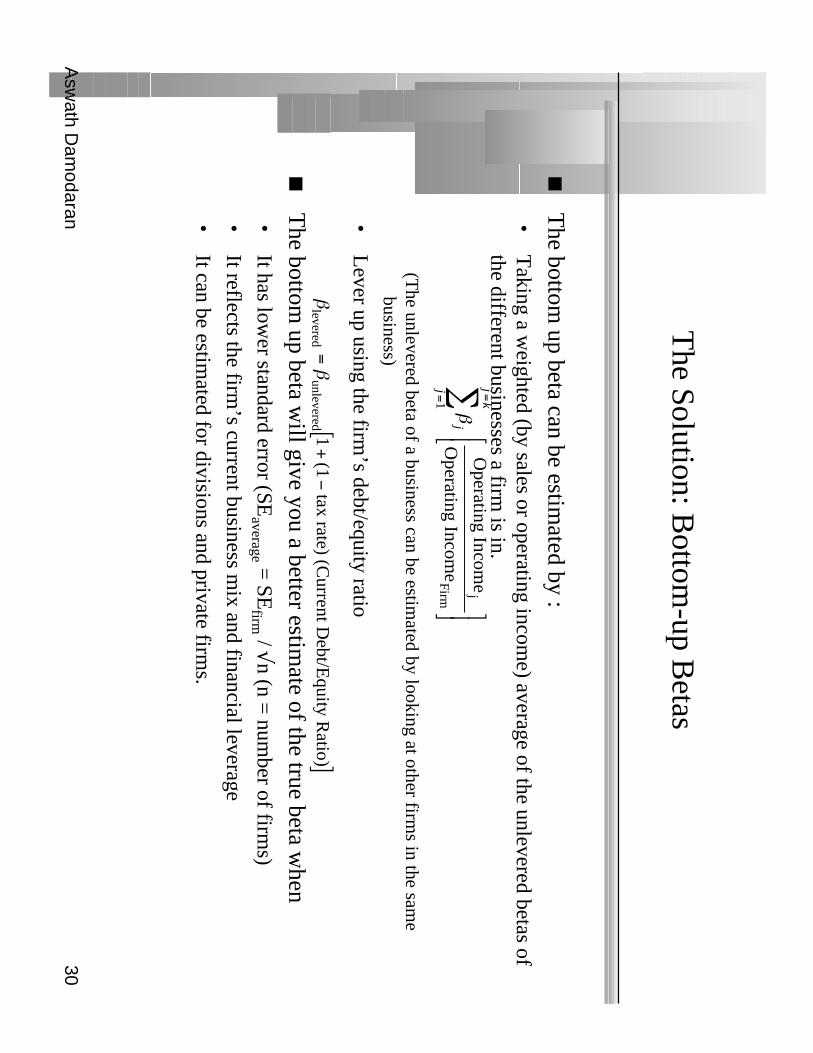
The Solution: B
ottom-up B
etas
The bottom
up beta can be estimated by :
•T
aking a weighted (by sales or operating incom
e) average of the unlevered betas ofthe different businesses a firm
is in.
(The unlevered beta of a business can be estim
ated by looking at other firms in the sam
ebusiness)
•L
ever up using the firm’s debt/equity ratio
The bottom
up beta will give you a better estim
ate of the true beta when
•It has low
er standard error (SEaverage = SE
firm / √n (n = num
ber of firms)
•It reflects the firm
’s current business mix and financial leverage
•It can be estim
ated for divisions and private firms.
βj
j jk
= =
∑
1
O
perating Income
Operating Incom
ej
Firm
ββ
leveredunlevered
1(1
tax rate) (Current D
ebt/Equity R
atio)=
+−
[]

Asw
ath Dam
odaran31
Titan’s B
ottom-up B
eta
Business
Unlevered
D/E
Ratio
Levered beta
Proportion of V
alue
Cem
ent.82
25.21%0.98
100%
Levered B
eta= U
nlevered Beta ( 1 +
(1- tax rate) (D/E
Ratio)
= 0.82 ( 1 +
(1-.2449) (.2521)) = 0.98
A H
ypothetical scenario: Assum
e that Titan had been in tw
o businesses- cement and
technology. You could estm
ate a beta for the combined firm
as follows
Com
parable firms
Business
Revenues
Value/Sales U
nlevered betaV
alueW
eightW
eight*Beta
Cem
ent623
3.00.82
186979%
.79*.82
Technology
1005.0
1.20 500
21%.21*1.20
Firm=
.90
Asw
ath Dam
odaran32
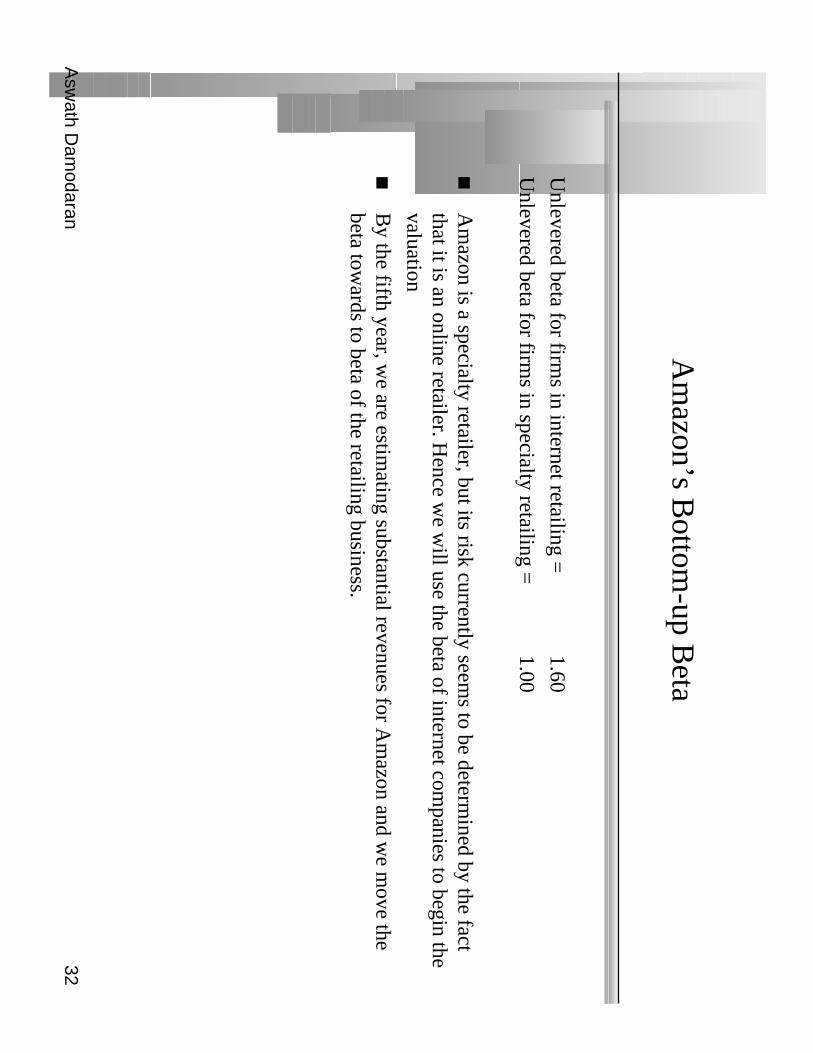
Am
azon’s Bottom
-up Beta
Unlevered beta for firm
s in internet retailing =1.60
Unlevered beta for firm
s in specialty retailing =
1.00
Am
azon is a specialty retailer, but its risk currently seems to be determ
ined by the factthat it is an online retailer. H
ence we w
ill use the beta of internet companies to begin the
valuation
By the fifth year, w
e are estimating substantial revenues for A
mazon and w
e move the
beta towards to beta of the retailing business.
Asw
ath Dam
odaran33
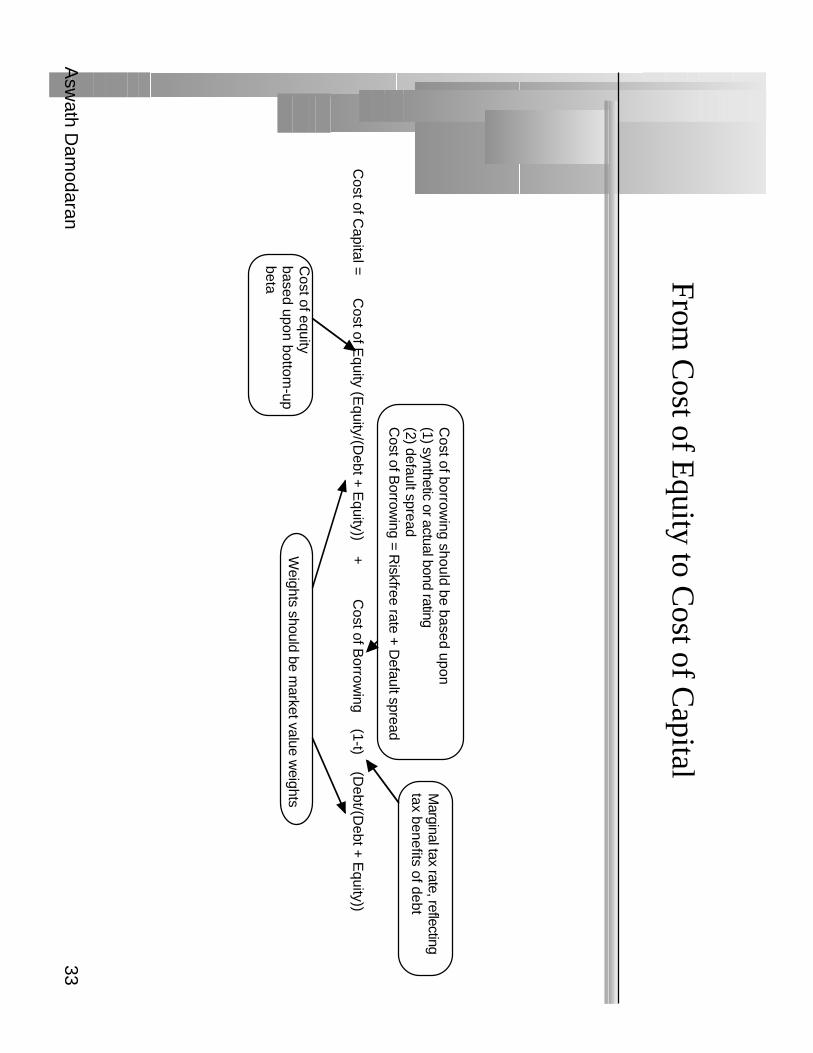
From C
ost of Equity to C
ost of Capital
Cost of C
apital =C
ost of Equity (E
quity/(Debt +
Equity))
+C
ost of Borrow
ing (1-t)
(Debt/(D
ebt + E
quity))
Cost of borrow
ing should be based upon(1) synthetic or actual bond rating(2) default spreadC
ost of Borrow
ing = Riskfree rate + D
efault spread
Marginal tax rate, reflecting
tax benefits of debt
Weights should be m
arket value weights
Cost of equity
based upon bottom-up
beta

Asw
ath Dam
odaran34
Estim
ating Synthetic Ratings
The rating for a firm
can be estimated using the financial characteristics of the
firm. In its sim
plest form, the rating can be estim
ated from the interest
coverage ratioInterest Coverage R
atio = E
BIT
/ Interest Expenses
For Titan’s interest coverage ratio, w
e used the interest expenses and EB
ITfrom
2000.
Interest Coverage R
atio = 186.40/ 26 =
7.17
Am
azon.com has negative operating incom
e; this yields a negative interestcoverage ratio, w
hich should suggest a low rating. W
e computed an average
interest coverage ratio of 2.82 over the next 5 years.
Asw
ath Dam
odaran35
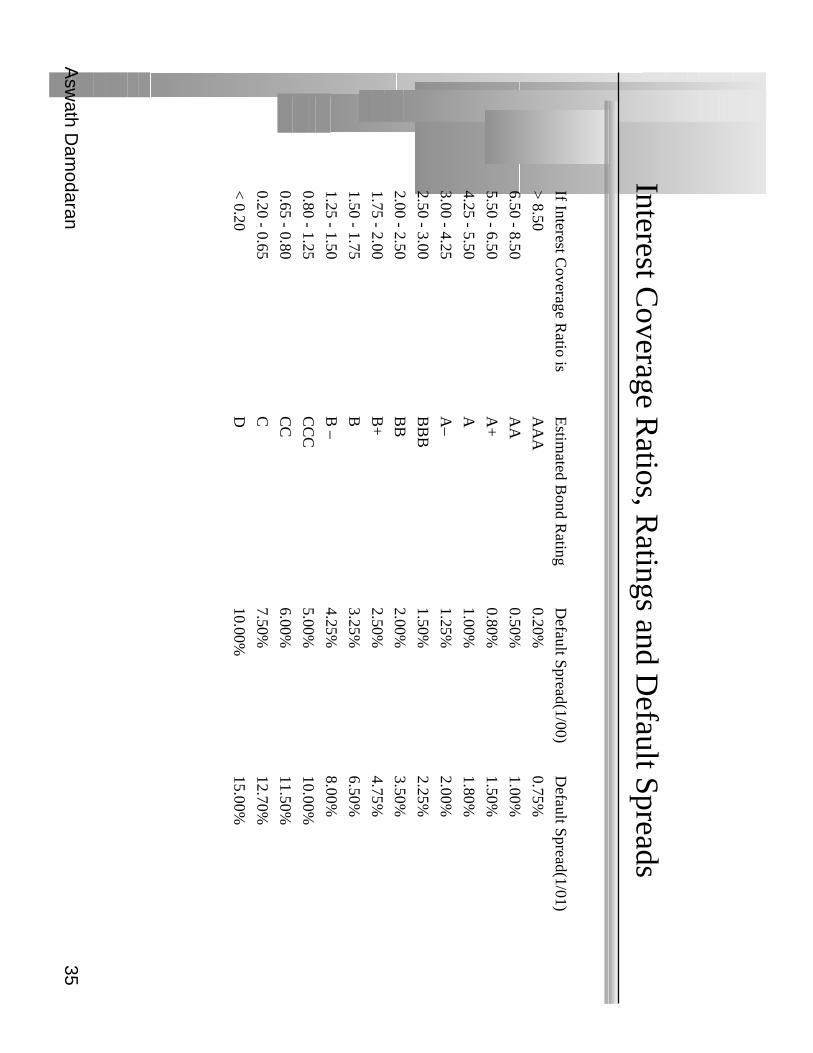
Interest Coverage R
atios, Ratings and D
efault Spreads
If Interest Coverage R
atio isE
stimated B
ond Rating
Default Spread(1/00)
Default Spread(1/01)
> 8.50
AA
A0.20%
0.75%
6.50 - 8.50A
A0.50%
1.00%
5.50 - 6.50A
+0.80%
1.50%
4.25 - 5.50A
1.00%1.80%
3.00 - 4.25A
–1.25%
2.00%
2.50 - 3.00B
BB
1.50%2.25%
2.00 - 2.50B
B2.00%
3.50%
1.75 - 2.00B
+2.50%
4.75%
1.50 - 1.75B
3.25%6.50%
1.25 - 1.50B
–4.25%
8.00%
0.80 - 1.25C
CC
5.00%10.00%
0.65 - 0.80C
C6.00%
11.50%
0.20 - 0.65C
7.50%12.70%
< 0.20
D10.00%
15.00%
Asw
ath Dam
odaran36
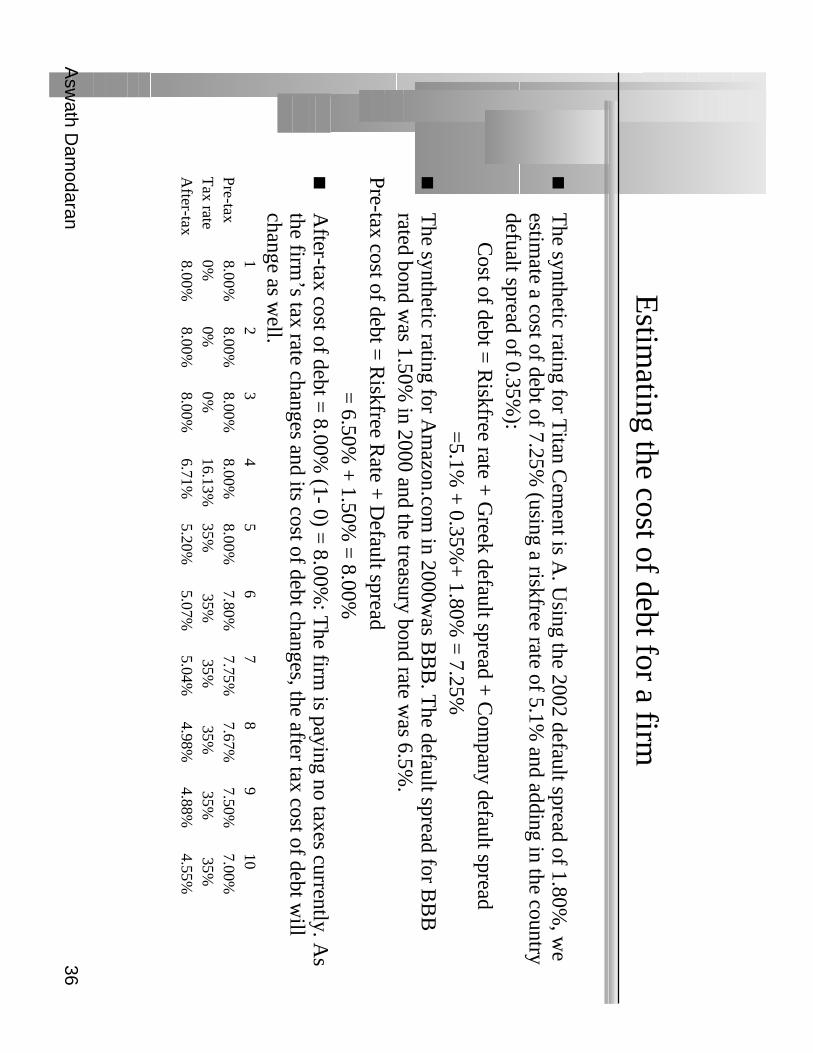
Estim
ating the cost of debt for a firm
The synthetic rating for T
itan Cem
ent is A. U
sing the 2002 default spread of 1.80%, w
eestim
ate a cost of debt of 7.25% (using a riskfree rate of 5.1%
and adding in the countrydefualt spread of 0.35%
): C
ost of debt = R
iskfree rate + G
reek default spread + C
ompany default spread
=5.1%
+ 0.35%
+ 1.80%
= 7.25%
The synthetic rating for A
mazon.com
in 2000was B
BB
. The default spread for B
BB
rated bond was 1.50%
in 2000 and the treasury bond rate was 6.5%
.Pre-tax cost of debt =
Riskfree R
ate + D
efault spread=
6.50% +
1.50% =
8.00%A
fter-tax cost of debt = 8.00%
(1- 0) = 8.00%
: The firm
is paying no taxes currently. As
the firm’s tax rate changes and its cost of debt changes, the after tax cost of debt w
illchange as w
ell.1
23
45
67
89
10P
re-tax8.00%
8.00%8.00%
8.00%8.00%
7.80%7.75%
7.67%7.50%
7.00%
Tax rate
0%0%
0%16.13%
35% 35%
35%
35% 35%
35%A
fter-tax8.00%
8.00%8.00%
6.71%5.20%
5.07%5.04%
4.98%4.88%
4.55%
Asw
ath Dam
odaran37
Weights for the C
ost of Capital C
omputation
The w
eights used to compute the cost of capital should be the m
arket valuew
eights for debt and equity.
There is an elem
ent of circularity that is introduced into every valuation bydoing this, since the values that w
e attach to the firm and equity at the end of
the analysis are different from the values w
e gave them at the beginning.
As a general rule, the debt that you should subtract from
firm value to arrive at
the value of equity should be the same debt that you used to com
pute the costof capital.
Asw
ath Dam
odaran38
Estim
ating Cost of C
apital: Am
azon.com
Equity•
Cost of E
quity = 6.50%
+ 1.60 (4.00%
) = 12.90%
•M
arket Value of E
quity = $ 84/share* 340.79 m
il shs = $ 28,626 m
il (98.8%)
Debt
•C
ost of debt = 6.50%
+ 1.50%
(default spread) = 8.00%
•M
arket Value of D
ebt = $ 349 m
il (1.2%)
Cost of C
apital
Cost of C
apital = 12.9 %
(.988) + 8.00%
(1- 0) (.012)) = 12.84%
Asw
ath Dam
odaran39
Estim
ating Cost of C
apital: Titan C
ements
Equity•
Cost of E
quity = 5.10%
+ 0.98 (4%
+ 0.70%
) = 9.71 %
•M
arket Value of E
quity =1517 m
illion Euros (79.9%
)
Debt
•C
ost of debt = 5.10%
+ 0.35%
+1.80%
= 7.25%
•M
arket Value of D
ebt = 382 m
illion Euros (20.1%
)
Cost of C
apitalC
ost of Capital =
9.71 % (.799) +
7.25% (1- .2449) (0.201)) =
8.85%
The book value of equity at T
itan Cem
ent is 458 million E
urosT
he book value of debt at Titan C
ement is 390 m
illion; Interest expense is 26 mil;
Average m
aturity of debt = 4 years
Estim
ated market value of debt =
26 million (PV
of annuity, 4 years, 7.25%) +
$390 million/1.0725
4 = $382 m
illion
Asw
ath Dam
odaran40
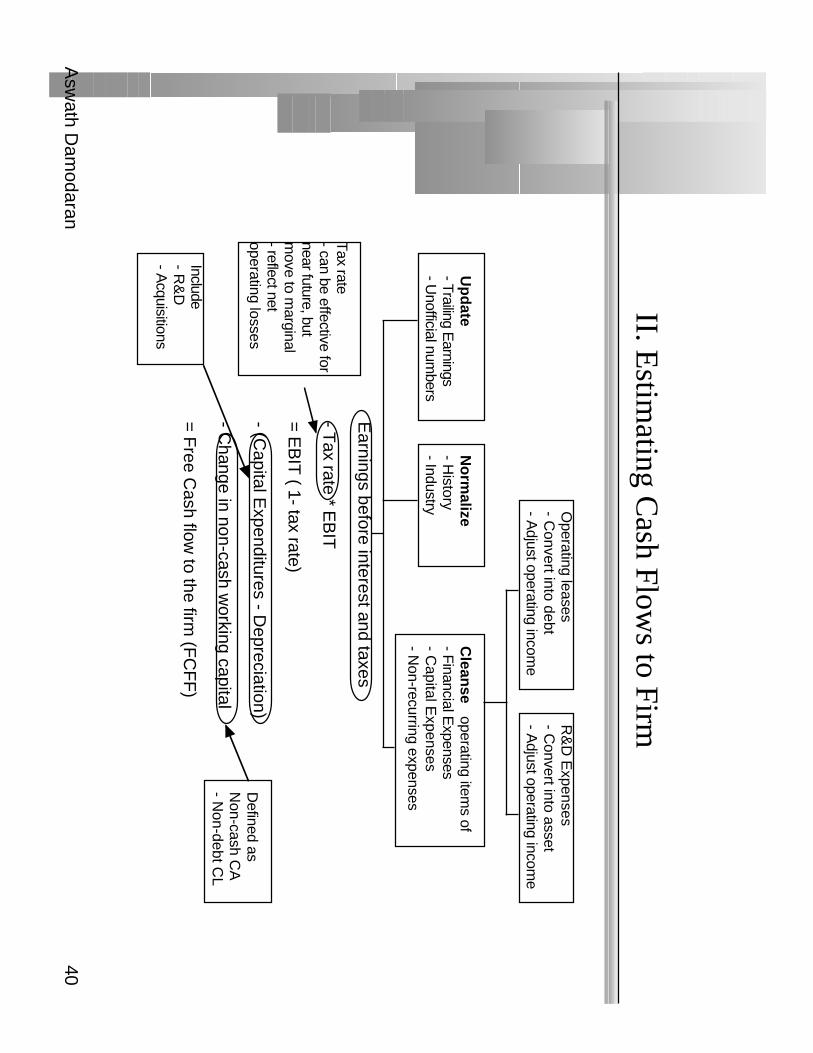
II. Estim
ating Cash Flow
s to Firm
Earnings before interest and taxes
- Tax rate * E
BIT
= EB
IT ( 1- tax rate)
- (Capital E
xpenditures - Depreciation)
- Change in non-cash w
orking capital
= F
ree Cash flow
to the firm (F
CF
F)
Up
date
- Trailing Earnings
- Unofficial num
bers
No
rmalize
- History
- Industry
Clean
se operating item
s of- F
inancial Expenses
- Capital E
xpenses- N
on-recurring expenses
Operating leases
- Convert into debt
- Adjust operating incom
e
R&
D E
xpenses- C
onvert into asset- A
djust operating income
Tax rate
- can be effective for near future, but m
ove to marginal
- reflect net operating losses
Include- R
&D
- Acquisitions
Defined as
Non-cash C
A- N
on-debt CL
Asw
ath Dam
odaran41
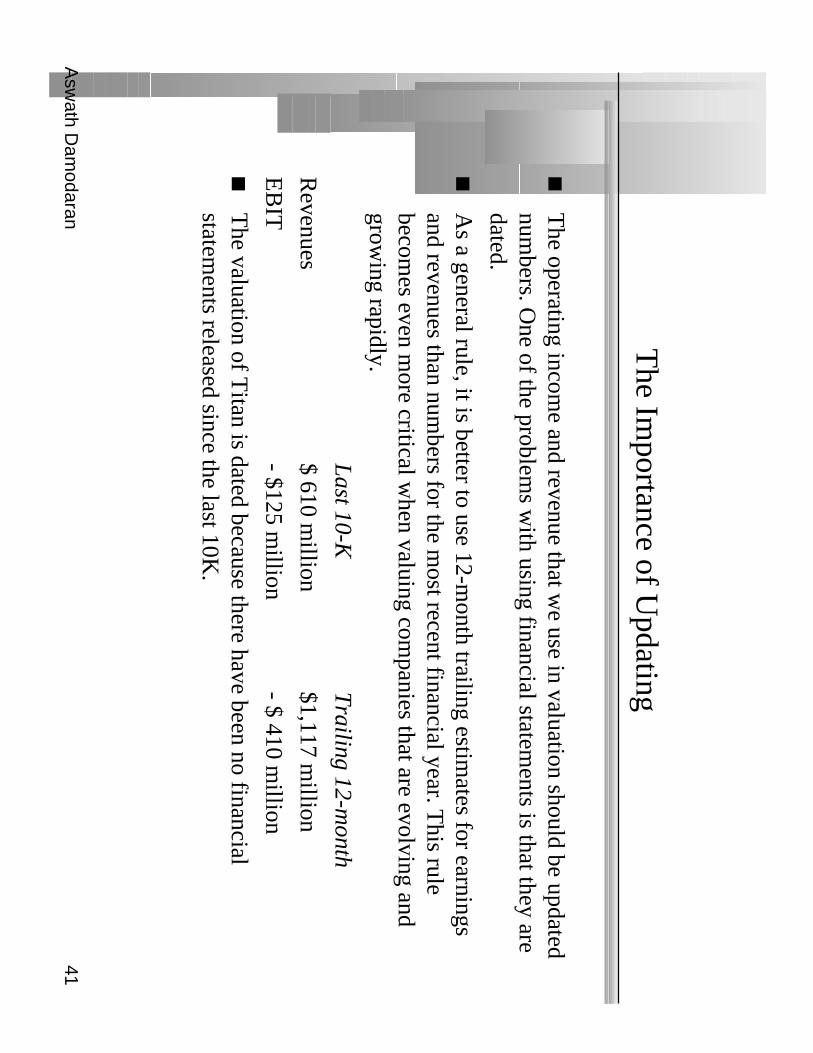
The Im
portance of Updating
The operating incom
e and revenue that we use in valuation should be updated
numbers. O
ne of the problems w
ith using financial statements is that they are
dated.
As a general rule, it is better to use 12-m
onth trailing estimates for earnings
and revenues than numbers for the m
ost recent financial year. This rule
becomes even m
ore critical when valuing com
panies that are evolving andgrow
ing rapidly.
L
ast 10-KT
railing 12-month
Revenues
$ 610 million
$1,117 million
EB
IT- $125 m
illion- $ 410 m
illion
The valuation of T
itan is dated because there have been no financialstatem
ents released since the last 10K.
Asw
ath Dam
odaran42
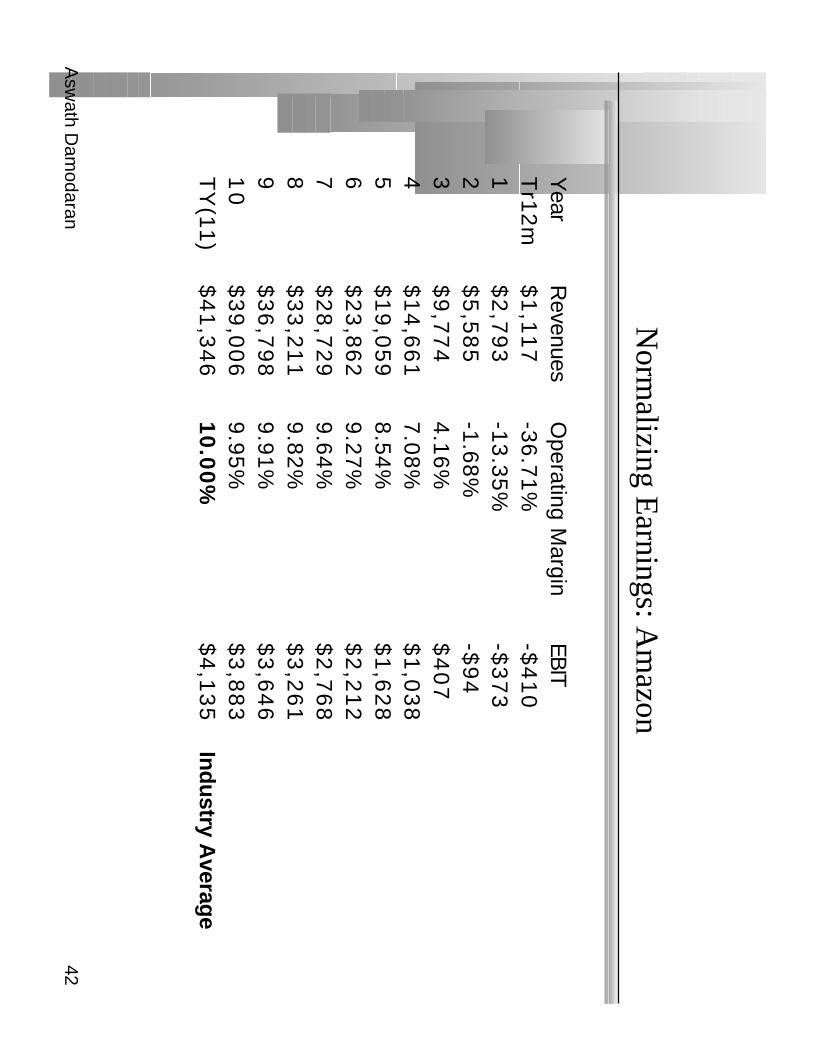
Norm
alizing Earnings: A
mazon
Year
Revenues
Operating M
arginE
BIT
Tr1
2m
$1
,11
7-3
6.7
1%
-$4
10
1$
2,7
93
-13
.35
%-$
37
32
$5
,58
5-1
.68
%-$
94
3$
9,7
74
4.1
6%
$4
07
4$
14
,66
17
.08
%$
1,0
38
5$
19
,05
98
.54
%$
1,6
28
6$
23
,86
29
.27
%$
2,2
12
7$
28
,72
99
.64
%$
2,7
68
8$
33
,21
19
.82
%$
3,2
61
9$
36
,79
89
.91
%$
3,6
46
10
$3
9,0
06
9.9
5%
$3
,88
3T
Y(1
1)
$4
1,3
46
10
.00
%$
4,1
35
Ind
ustry A
verage
Asw
ath Dam
odaran43
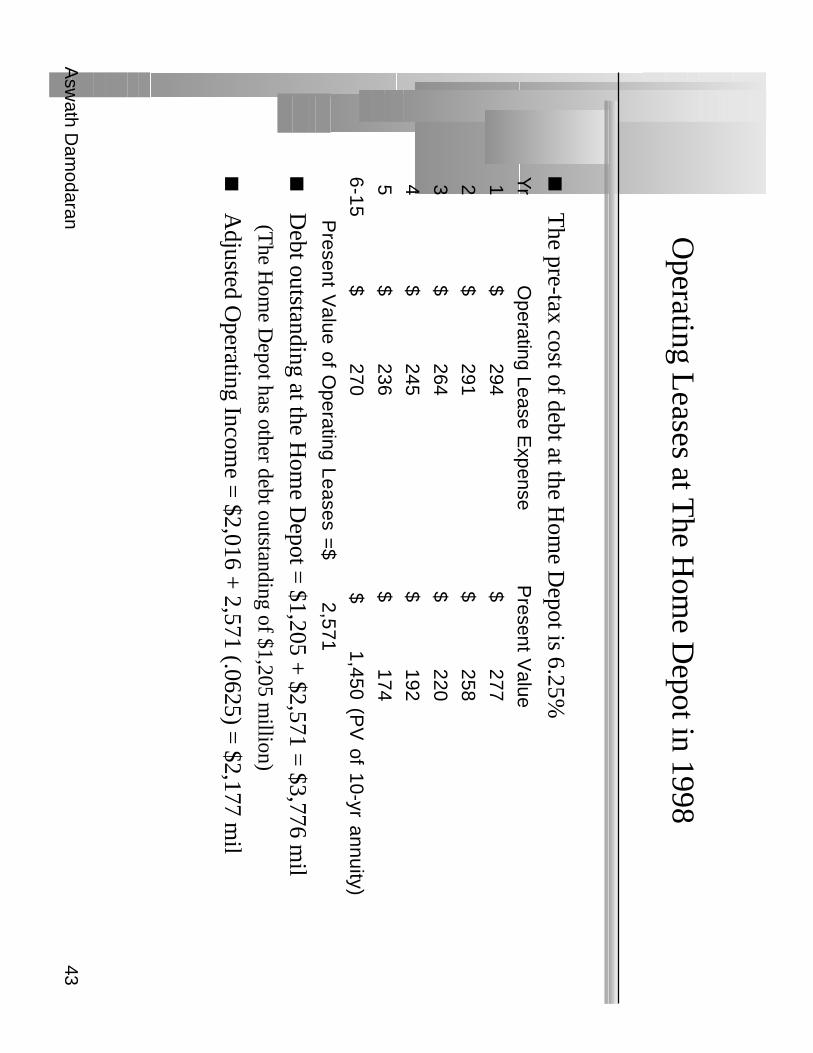
Operating L
eases at The H
ome D
epot in 1998
The pre-tax cost of debt at the H
ome D
epot is 6.25%Y
rO
perating Lease Expense
Present V
alue 1
$ 294 $ 277
2$ 291
$ 258 3
$ 264 $ 220
4$ 245
$ 192 5
$ 236 $ 174
6-1
5
$ 270 $ 1,450 (P
V of 10-yr annuity)
Present V
alue of Operating Leases =
$ 2,571
Debt outstanding at the H
ome D
epot = $1,205 +
$2,571 = $3,776 m
il(T
he Hom
e Depot has other debt outstanding of $1,205 m
illion)
Adjusted O
perating Income =
$2,016 + 2,571 (.0625) =
$2,177 mil

Asw
ath Dam
odaran44
Capitalizing R
&D
Expenses: Shire Pharm
aceuticals
To capitalize R
&D
,•
Specify an amortizable life for R
&D
(2 - 10 years)•
Collect past R
&D
expenses for as long as the amortizable life
•Sum
up the unamortized R
&D
over the period. (Thus, if the am
ortizable life is 5 years, the research asset canbe obtained by adding up 1/5th of the R
&D
expense from five years ago, 2/5th of the R
&D
expense from four
years ago...:
R &
D w
as assumed to have a 5-year life.
Year
R&
DU
namortized R
&D
Am
ortizationC
urrent£48.12
1.00£48.12
£0.00-1
£37.420.80
£29.94£7.48
-2£28.99
0.60£17.39
£5.80-3
£17.880.40
£7.15£3.58
-4£8.18
0.20£1.64
£1.64-5
£4.560.00
£0.00£0.91
£104.24£19.41
Value of research asset =
£104.24A
mortization of research asset in 2000 =
£19.41A
djustment to O
perating Income =
Add back R
&D
and subtract Am
ortization of R&
DA
djusted Operating Incom
e = £41.03 +
£48.12 - £19.41 = £
69
.74

Asw
ath Dam
odaran45
The E
ffect of Net O
perating Losses: A
mazon.com
’s Tax
Rate
Year
12
34
5
EB
IT-$373
-$94$407
$1,038$1,628
Taxes
$0$0
$0$167
$570
EB
IT(1-t)
-$373-$94
$407$871
$1,058
Tax rate
0%0%
0%16.13%
35%
NO
L$500
$873$967
$560$0
After year 5, the tax rate becom
es 35%.
Asw
ath Dam
odaran46
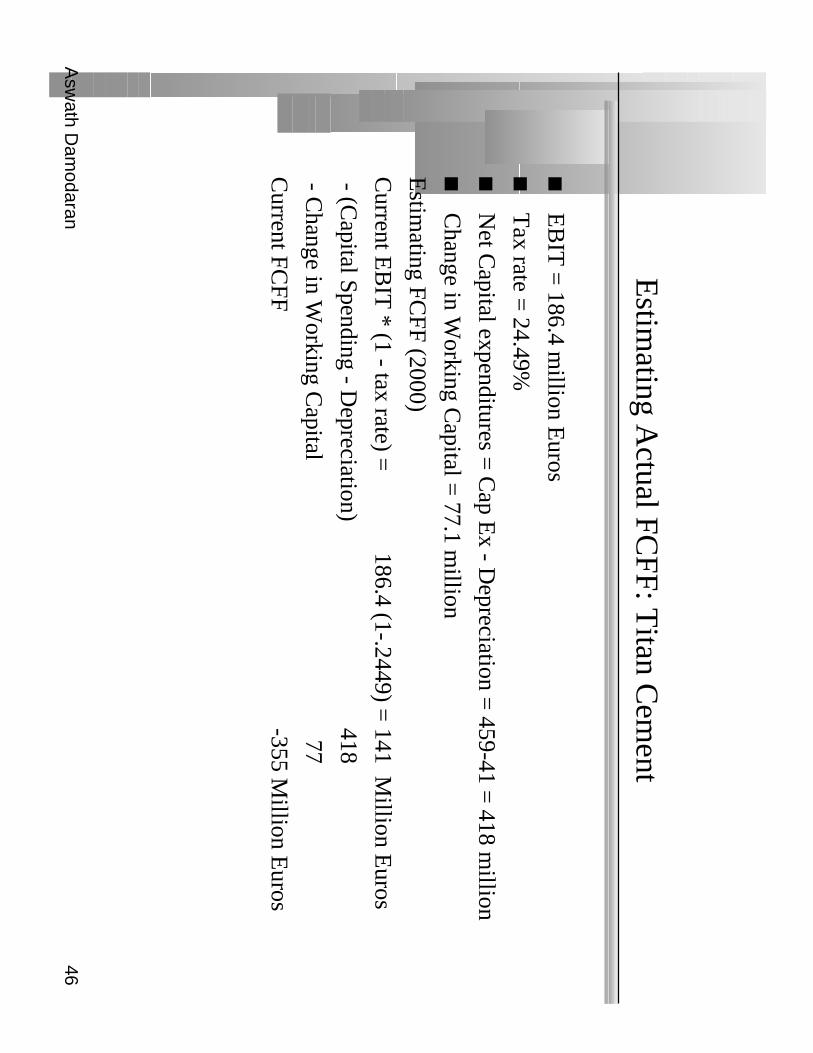
Estim
ating Actual FC
FF: Titan C
ement
EB
IT =
186.4 million E
uros
Tax rate =
24.49%
Net C
apital expenditures = C
ap Ex - D
epreciation = 459-41 =
418 million
Change in W
orking Capital =
77.1 million
Estim
ating FCFF (2000)
Current E
BIT
* (1 - tax rate) =186.4 (1-.2449) =
141 Million E
uros
- (Capital Spending - D
epreciation)418
- Change in W
orking Capital
77
Current FC
FF-355 M
illion Euros
Asw
ath Dam
odaran47
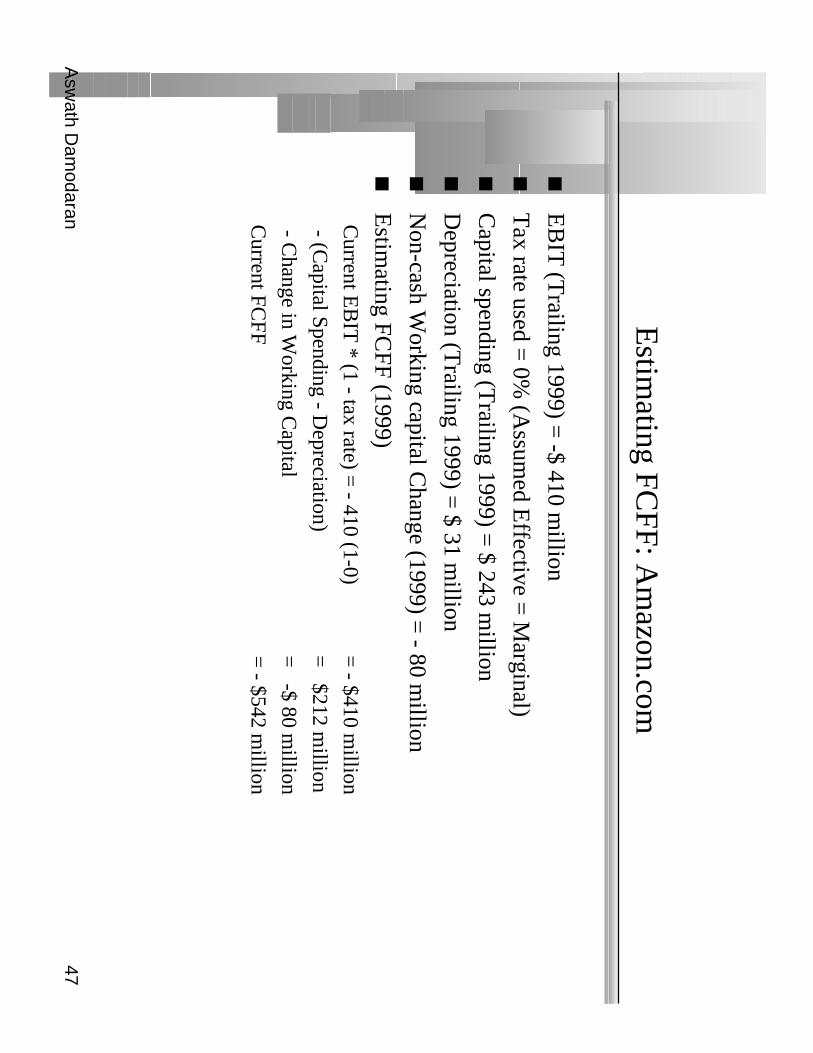
Estim
ating FCFF: A
mazon.com
EB
IT (T
railing 1999) = -$ 410 m
illion
Tax rate used =
0% (A
ssumed E
ffective = M
arginal)
Capital spending (T
railing 1999) = $ 243 m
illion
Depreciation (T
railing 1999) = $ 31 m
illion
Non-cash W
orking capital Change (1999) =
- 80 million
Estim
ating FCFF (1999)
Current E
BIT
* (1 - tax rate) = - 410 (1-0)
= - $410 m
illion
- (Capital Spending - D
epreciation)
= $212 m
illion
- Change in W
orking Capital
= -$ 80 m
illion
Current FC
FF=
- $542 million

Asw
ath Dam
odaran48
IV. E
xpected Grow
th in EB
IT and Fundam
entals
Reinvestm
ent Rate and R
eturn on Capital
gE
BIT
= (N
et Capital E
xpenditures + C
hange in WC
)/EB
IT(1-t) * R
OC
= R
einvestment R
ate * RO
C
Proposition: No firm
can expect its operating income to grow
over time
without reinvesting som
e of the operating income in net capital expenditures
and/or working capital.
Proposition: The net capital expenditure needs of a firm
, for a given growth
rate, should be inversely proportional to the quality of its investments.
Asw
ath Dam
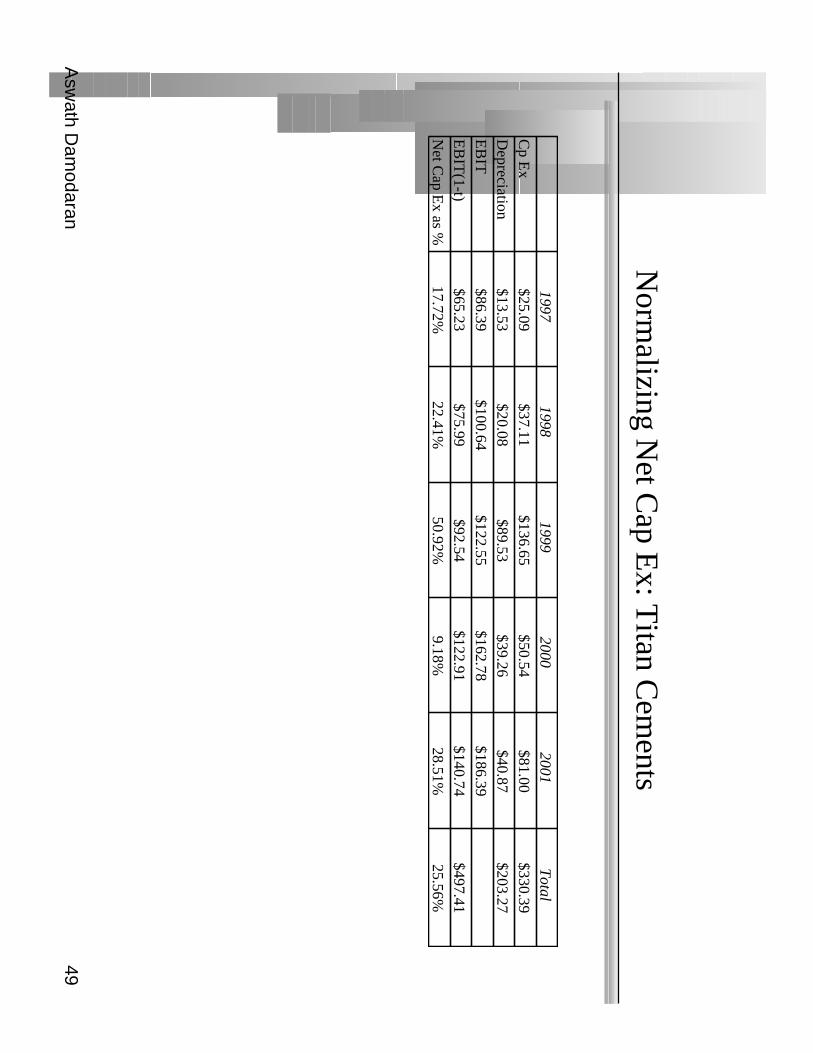
odaran49
Norm
alizing Net C
ap Ex: T
itan Cem
ents
19971998
19992000
2001T
otalC
p Ex
$25.09$37.11
$136.65$50.54
$81.00$330.39
Depreciation
$13.53$20.08
$89.53$39.26
$40.87$203.27
EB
IT$86.39
$100.64$122.55
$162.78$186.39
EB
IT(1-t)
$65.23$75.99
$92.54$122.91
$140.74$497.41
Net C
a p Ex as %
o17.72%
22.41%50.92%
9.18%28.51%
25.56%
Asw
ath Dam
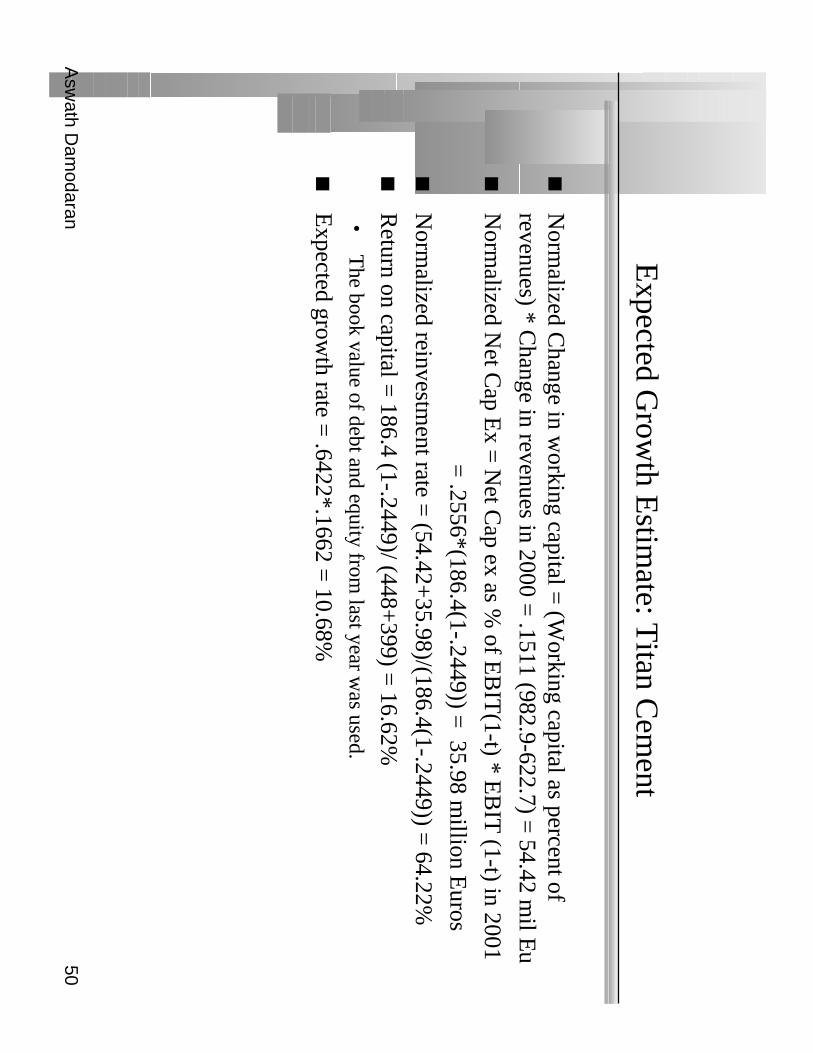
odaran50
Expected G
rowth E
stimate: T
itan Cem
ent
Norm
alized Change in w
orking capital = (W
orking capital as percent ofrevenues) * C
hange in revenues in 2000 = .1511 (982.9-622.7) =
54.42 mil E
u
Norm
alized Net C
ap Ex =
Net C
ap ex as % of E
BIT
(1-t) * EB
IT (1-t) in 2001
= .2556*(186.4(1-.2449)) =
35.98 million E
uros
Norm
alized reinvestment rate =
(54.42+35.98)/(186.4(1-.2449)) =
64.22%
Return on capital =
186.4 (1-.2449)/ (448+399) =
16.62%•
The book value of debt and equity from
last year was used.
Expected grow
th rate = .6422*.1662 =
10.68%

Asw
ath Dam
odaran51
Revenue G
rowth and O
perating Margins
With negative operating incom
e and a negative return on capital, thefundam
ental growth equation is of little use for A
mazon.com
For Am
azon, the effect of reinvestment show
s up in revenue growth rates and
changes in expected operating margins:
Expected R
evenue Grow
th in $ = R
einvestment (in $ term
s) * (Sales/ Capital)
The effect on expected m
argins is more subtle. A
mazon’s reinvestm
ents(especially in acquisitions) m
ay help create barriers to entry and othercom
petitive advantages that will ultim
ately translate into high operatingm
argins and high profits.
Asw
ath Dam
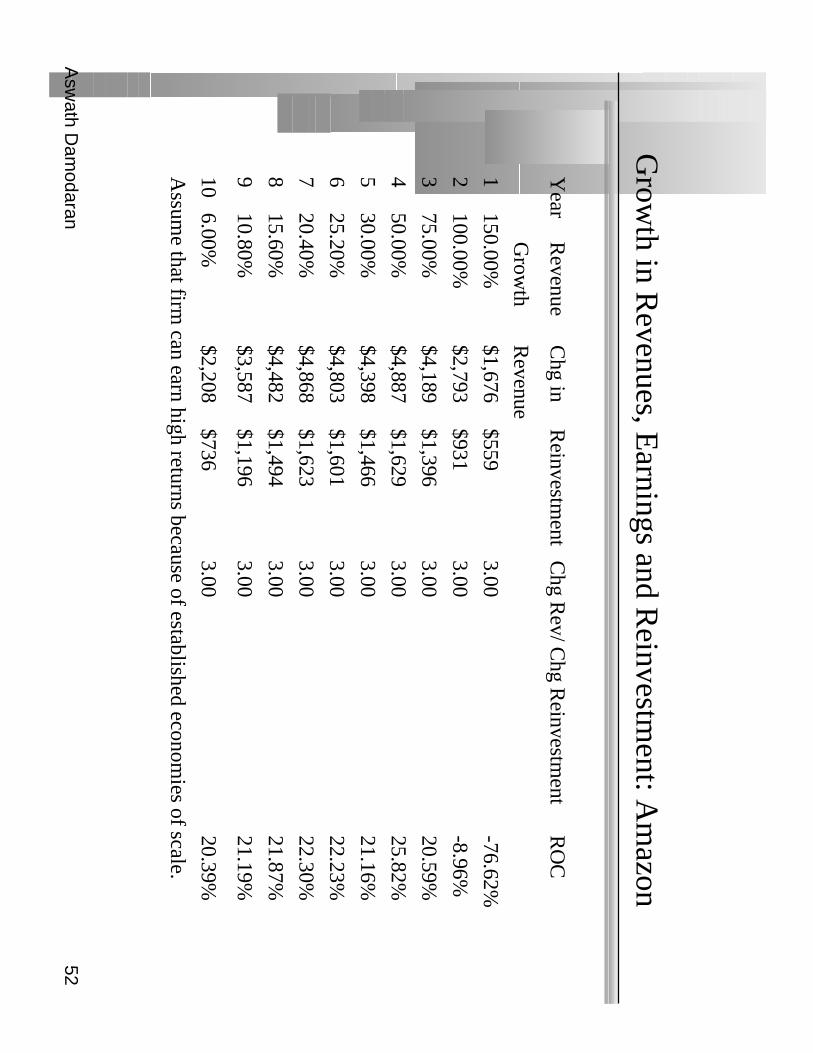
odaran52
Grow
th in Revenues, E
arnings and Reinvestm
ent: Am
azon
Year
Revenue
Chg in
Reinvestm
entC
hg Rev/ C
hg Reinvestm
entR
OC
Grow
thR
evenue
1150.00%
$1,676$559
3.00-76.62%
2100.00%
$2,793$931
3.00-8.96%
375.00%
$4,189$1,396
3.0020.59%
450.00%
$4,887$1,629
3.0025.82%
530.00%
$4,398$1,466
3.0021.16%
625.20%
$4,803$1,601
3.0022.23%
720.40%
$4,868$1,623
3.0022.30%
815.60%
$4,482$1,494
3.0021.87%
910.80%
$3,587$1,196
3.0021.19%
106.00%
$2,208$736
3.0020.39%
Assum
e that firm can earn high returns because of established econom
ies of scale.
Asw
ath Dam
odaran53
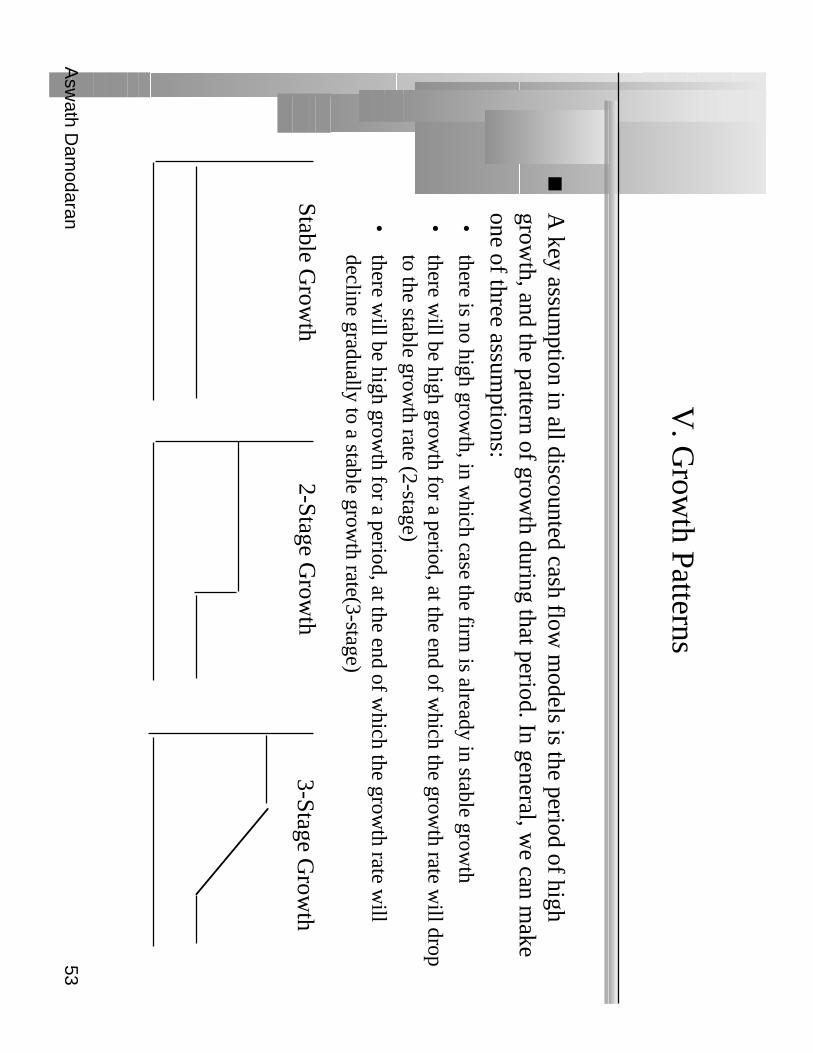
V. G
rowth Patterns
A key assum
ption in all discounted cash flow m
odels is the period of highgrow
th, and the pattern of growth during that period. In general, w
e can make
one of three assumptions:
•there is no high grow
th, in which case the firm
is already in stable growth
•there w
ill be high growth for a period, at the end of w
hich the growth rate w
ill dropto the stable grow
th rate (2-stage)
•there w
ill be high growth for a period, at the end of w
hich the growth rate w
illdecline gradually to a stable grow
th rate(3-stage)
Stable Grow
th2-Stage G
rowth
3-Stage Grow
th
Asw
ath Dam
odaran54
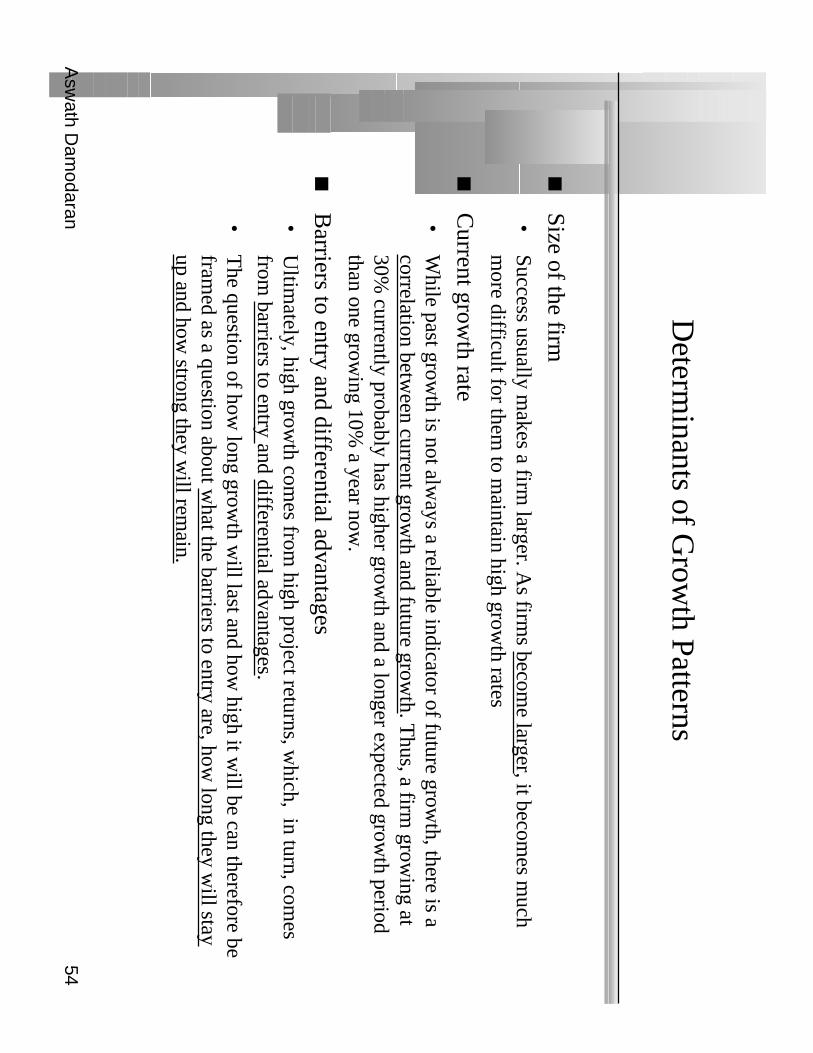
Determ
inants of Grow
th Patterns
Size of the firm•
Success usually makes a firm
larger. As firm
s become larger, it becom
es much
more difficult for them
to maintain high grow
th rates
Current grow
th rate•
While past grow
th is not always a reliable indicator of future grow
th, there is acorrelation betw
een current growth and future grow
th. Thus, a firm
growing at
30% currently probably has higher grow
th and a longer expected growth period
than one growing 10%
a year now.
Barriers to entry and differential advantages•
Ultim
ately, high growth com
es from high project returns, w
hich, in turn, comes
from barriers to entry and differential advantages.
•T
he question of how long grow
th will last and how
high it will be can therefore be
framed as a question about w
hat the barriers to entry are, how long they w
ill stayup and how
strong they will rem
ain.
Asw
ath Dam
odaran55
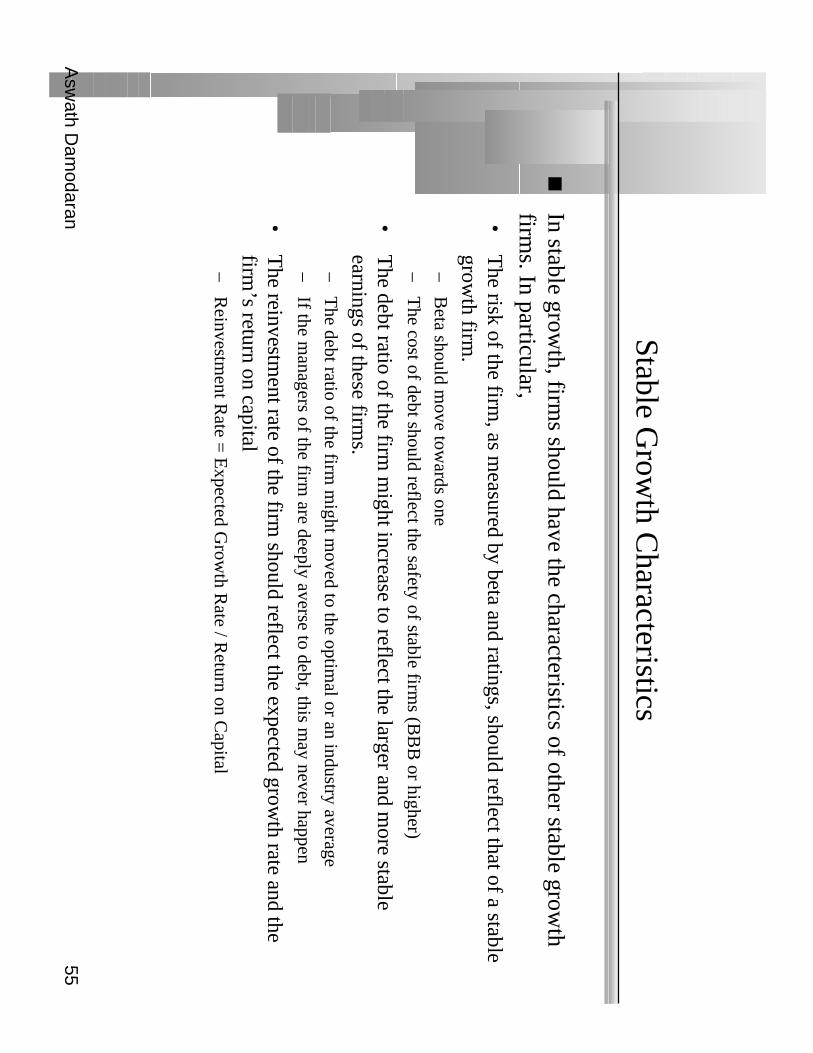
Stable Grow
th Characteristics
In stable growth, firm
s should have the characteristics of other stable growth
firms. In particular,
•T
he risk of the firm, as m
easured by beta and ratings, should reflect that of a stablegrow
th firm.
–B
eta should move tow
ards one
–T
he cost of debt should reflect the safety of stable firms (B
BB
or higher)
•T
he debt ratio of the firm m
ight increase to reflect the larger and more stable
earnings of these firms.
–T
he debt ratio of the firm m
ight moved to the optim
al or an industry average
–If the m
anagers of the firm are deeply averse to debt, this m
ay never happen
•T
he reinvestment rate of the firm
should reflect the expected growth rate and the
firm’s return on capital
–R
einvestment R
ate = E
xpected Grow
th Rate / R
eturn on Capital
Asw
ath Dam
odaran56
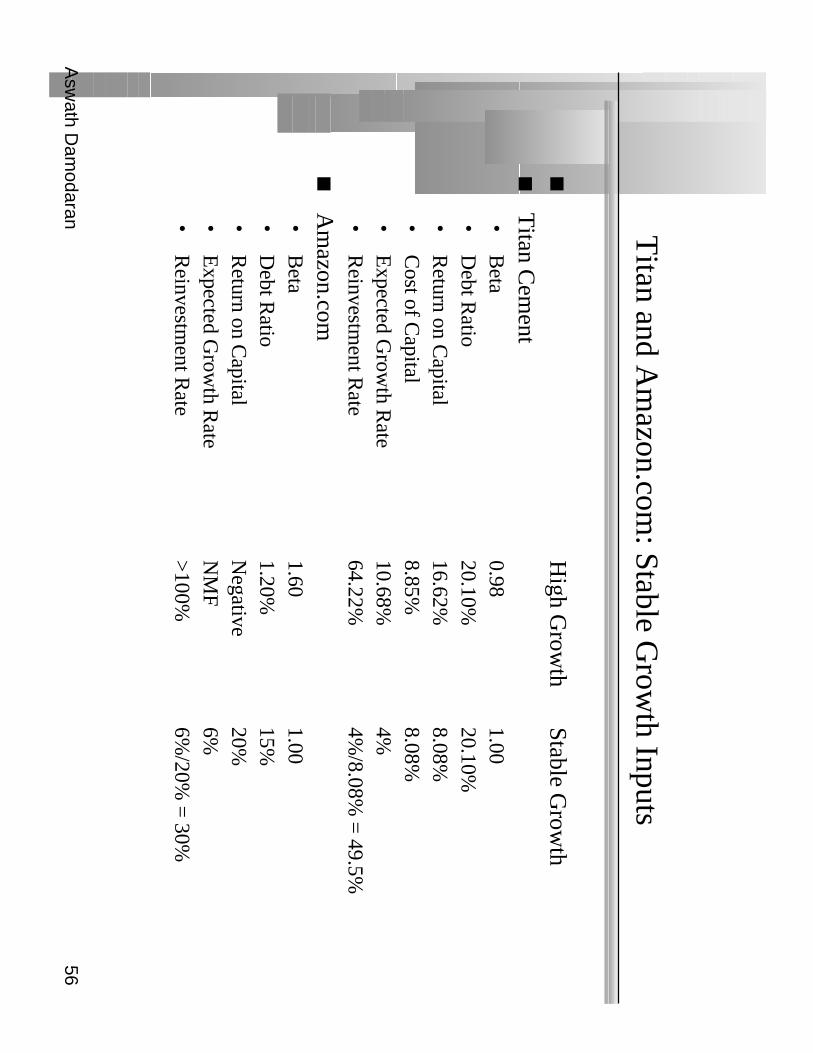
Titan and A
mazon.com
: Stable Grow
th Inputs
H
igh Grow
thStable G
rowth
Titan C
ement
•B
eta0.98
1.00•
Debt R
atio20.10%
20.10%•
Return on C
apital16.62%
8.08%•
Cost of C
apital8.85%
8.08%•
Expected G
rowth R
ate 10.68%
4%•
Reinvestm
ent Rate
64.22%4%
/8.08% =
49.5%
Am
azon.com•
Beta
1.601.00
•D
ebt Ratio
1.20%15%
•R
eturn on Capital
Negative
20%•
Expected G
rowth R
ateN
MF
6%•
Reinvestm
ent Rate
>100%
6%/20%
= 30%
Asw
ath Dam
odaran57
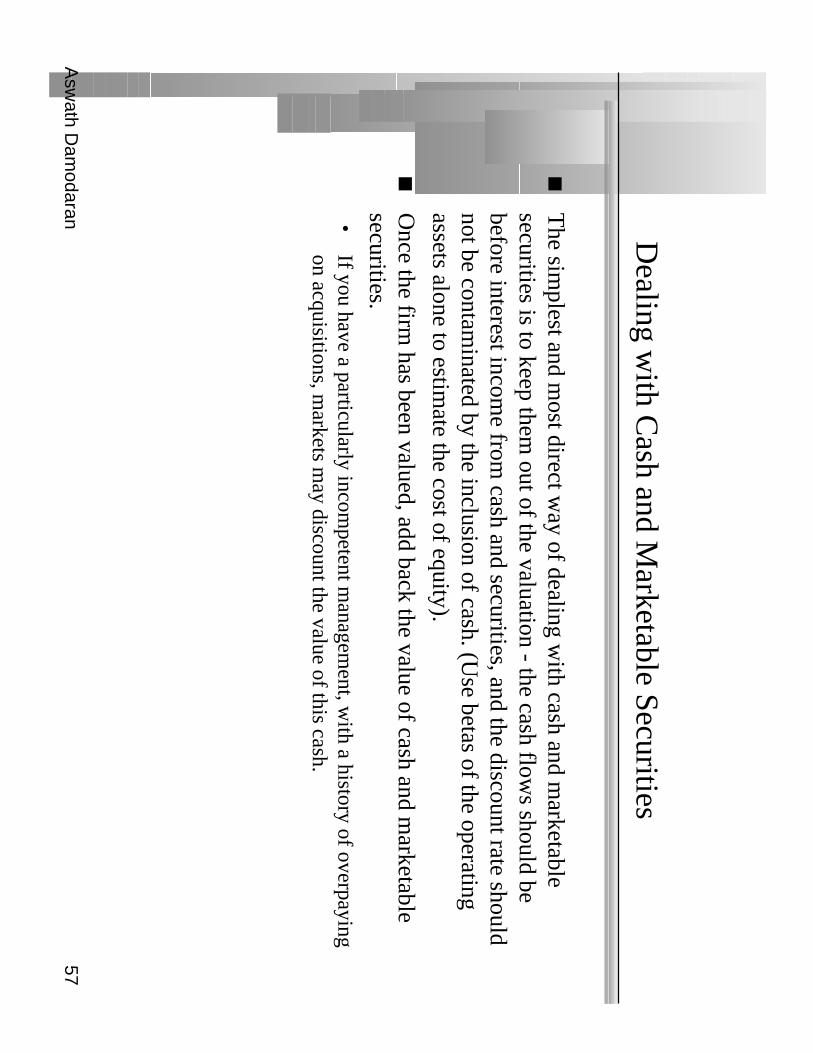
Dealing w
ith Cash and M
arketable Securities
The sim
plest and most direct w
ay of dealing with cash and m
arketablesecurities is to keep them
out of the valuation - the cash flows should be
before interest income from
cash and securities, and the discount rate shouldnot be contam
inated by the inclusion of cash. (Use betas of the operating
assets alone to estimate the cost of equity).
Once the firm
has been valued, add back the value of cash and marketable
securities.•
If you have a particularly incompetent m
anagement, w
ith a history of overpayingon acquisitions, m
arkets may discount the value of this cash.
Asw
ath Dam
odaran58
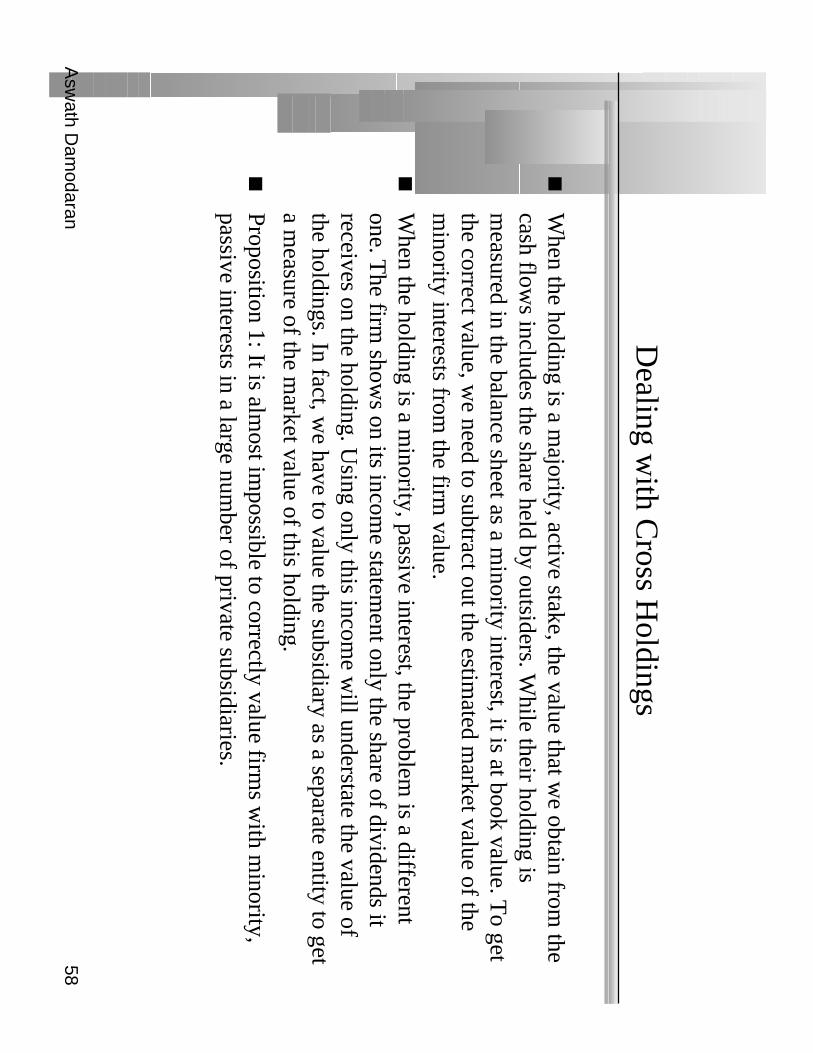
Dealing w
ith Cross H
oldings
When the holding is a m
ajority, active stake, the value that we obtain from
thecash flow
s includes the share held by outsiders. While their holding is
measured in the balance sheet as a m
inority interest, it is at book value. To get
the correct value, we need to subtract out the estim
ated market value of the
minority interests from
the firm value.
When the holding is a m
inority, passive interest, the problem is a different
one. The firm
shows on its incom
e statement only the share of dividends it
receives on the holding. Using only this incom
e will understate the value of
the holdings. In fact, we have to value the subsidiary as a separate entity to get
a measure of the m
arket value of this holding.
Proposition 1: It is almost im
possible to correctly value firms w
ith minority,
passive interests in a large number of private subsidiaries.

Asw
ath Dam
odaran59
Am
azon: Estim
ating the Value of E
quity Options
Details of options outstanding
•A
verage strike price of options outstanding =$ 13.375
•A
verage maturity of options outstanding =
8.4 years
•Standard deviation in ln(stock price) =
50.00%
•A
nnualized dividend yield on stock =0.00%
•T
reasury bond rate =6.50%
•N
umber of options outstanding =
38 million
•N
umber of shares outstanding =
340.79 million
Value of options outstanding (using dilution-adjusted B
lack-Scholes model)
•V
alue of equity options = $ 2,892 m
illion

Asw
ath Dam
odaran60
Forever
Term
inal Value= 1881/(.0961-.06)
=52,148
Co
st of E
qu
ity12.90%
Co
st of D
ebt
6.5%+
1.5%=
8.0%T
ax rate = 0% -> 35%
Weig
hts
Debt=
1.2% ->
15%
Value of O
p Assets $ 14,910
+ C
ash $ 26
= Value of F
irm$14,936
- Value of D
ebt$ 349
= Value of E
quity$14,587
- Equity O
ptions$ 2,892
Value per share
$ 34.32
Riskfree R
ate:
T. B
ond rate = 6.5%
+B
eta1.60 ->
1.00X
Risk P
remiu
m4%
Internet/R
etailO
perating Leverage
Current
D/E
: 1.21%B
ase Equity
Prem
iumC
ountry Risk
Prem
ium
Current
Revenue
$ 1,117
Current
Margin:
-36.71%
Reinvestm
ent:C
ap ex includes acquisitionsW
orking capital is 3% of revenues
Sales T
urnoverR
atio: 3.00C
ompetitive
Advantages
Revenue
Grow
th:42%
Expected
Margin:
-> 10.00%
Stable G
rowth
Stable
Revenue
Grow
th: 6%
Stable
Operating
Margin:
10.00%
Stable
RO
C=
20%R
einvest 30%
of EB
IT(1-t)
EB
IT-410m
NO
L:500 m
$41,346 10.00%
35.00%$2,688 $ 807 $1,881
Term
. Year
24
31
56
89
107
Cost of E
quity12.90%
12.90%12.90%
12.90%12.90%
12.42%12.30%
12.10%11.70%
10.50%C
ost of Debt
8.00%8.00%
8.00%8.00%
8.00%7.80%
7.75%7.67%
7.50%7.00%
AT
cost of debt8.00%
8.00%8.00%
6.71%5.20%
5.07%5.04%
4.98%4.88%
4.55%C
ost of Capital
12.84%12.84%
12.84%12.83%
12.81%12.13%
11.96%11.69%
11.15%9.61%
Revenues
$2,793 5,585
9,774 14,661
19,059 23,862
28,729 33,211
36,798 39,006
E
BIT
-$373-$94
$407$1,038
$1,628$2,212
$2,768$3,261
$3,646$3,883
EB
IT (1-t)
-$373-$94
$407$871
$1,058$1,438
$1,799$2,119
$2,370$2,524
- Reinvestm
ent$559
$931$1,396
$1,629$1,466
$1,601$1,623
$1,494$1,196
$736FC
FF-$931
-$1,024-$989
-$758-$408
-$163$177
$625$1,174
$1,788Am
azon
.com
Janu
ary 2000S
tock P
rice = $ 84
Asw
ath Dam
odaran61
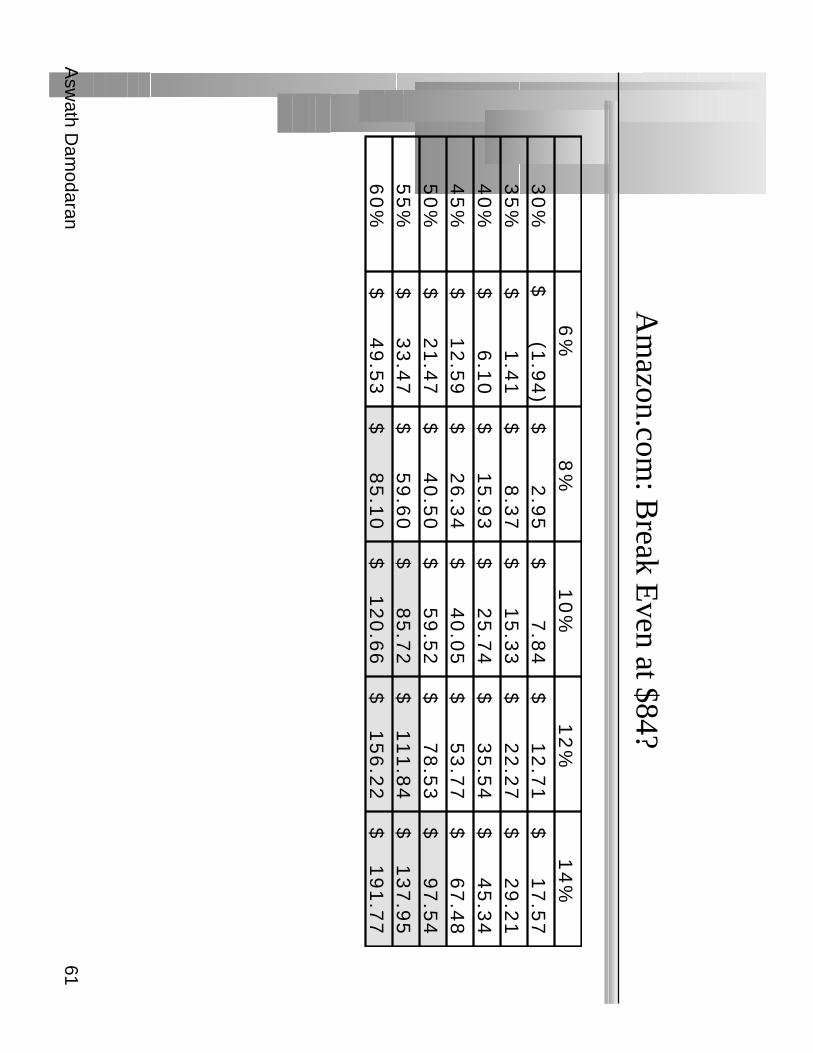
Am
azon.com: B
reak Even at $84?
6%
8%
10
%1
2%
14
%3
0%
(1.9
4)
$ 2
.95
$ 7
.84
$ 1
2.7
1$
17
.57
$ 3
5%
1.4
1$
8.3
7$
15
.33
$ 2
2.2
7$
29
.21
$ 4
0%
6.1
0$
15
.93
$ 2
5.7
4$
35
.54
$ 4
5.3
4$
45
%1
2.5
9$
26
.34
$ 4
0.0
5$
53
.77
$ 6
7.4
8$
50
%2
1.4
7$
40
.50
$ 5
9.5
2$
78
.53
$ 9
7.5
4$
55
%3
3.4
7$
59
.60
$ 8
5.7
2$
11
1.8
4$
13
7.9
5$
60
%4
9.5
3$
85
.10
$ 1
20
.66
$ 1
56
.22
$ 1
91
.77
$

Asw
ath Dam
odaran62
Forever
Term
inal Value= 1064/(.0876-.05)
=$ 28,310
Co
st of E
qu
ity13.81%
Co
st of D
ebt
5.1%+
4.75%=
9.85%T
ax rate = 0% -> 35%
Weig
hts
Debt=
27.38% ->
15%
Value of O
p Assets $ 7,967
+ C
ash & N
on-op $ 1,263
= Value of F
irm$ 9,230
- Value of D
ebt$ 1,890
= Value of E
quity$ 7,340
- Equity O
ptions$ 748
Value per share
$ 18.74
Riskfree R
ate:
T. B
ond rate = 5.1%
+B
eta2.18->
1.10X
Risk P
remiu
m4%
Internet/R
etailO
perating Leverage
Current
D/E
: 37.5%B
ase Equity
Prem
iumC
ountry Risk
Prem
ium
Current
Revenue
$ 2,465
Current
Margin:
-34.60%
Reinvestm
ent:C
ap ex includes acquisitionsW
orking capital is 3% of revenues
Sales T
urnoverR
atio: 3.02C
ompetitive
Advantages
Revenue
Grow
th:25.41%
Expected
Margin:
-> 9.32%
Stable G
rowth
Stable
Revenue
Grow
th: 5%
Stable
Operating
Margin:
9.32%
Stable
RO
C=
16.94%R
einvest 29.5%
of EB
IT(1-t)
EB
IT-853m
NO
L:1,289 m
$24,912$2,322$1,509$ 445$1,064
Term
. Year
24
31
56
89
107
Debt R
atio27.27%
27.27%27.27%
27.27%27.27%
24.81%24.20%
23.18%21.13%
15.00%B
eta2.18
2.182.18
2.182.18
1.96 1.75
1.53 1.32
1.10 C
ost of Equity
13.81%13.81%
13.81%13.81%
13.81%12.95%
12.09%11.22%
10.36%9.50%
AT
cost of debt10.00%
10.00%10.00%
10.00%9.06%
6.11%6.01%
5.85%5.53%
4.55%C
ost of Capital
12.77%12.77%
12.77%12.77%
12.52%11.25%
10.62%9.98%
9.34%8.76%
Am
azon
.com
Janu
ary 2001S
tock p
rice = $14
Revenues
$4,314$6,471
$9,059$11,777
$14,132$16,534
$18,849$20,922
$22,596$23,726
$24,912E
BIT
-$703
-$364$54
$499$898
$1,255$1,566
$1,827$2,028
$2,164$2,322
EB
IT(1-t)
-$703-$364
$54$499
$898$1,133
$1,018$1,187
$1,318$1,406
$1,509 - R
einvestment
$612$714
$857$900
$780$796
$766$687
$554$374
$445FC
FF-$1,315
-$1,078-$803
-$401$118
$337$252
$501$764
$1,032$1,064
Asw
ath Dam
odaran63
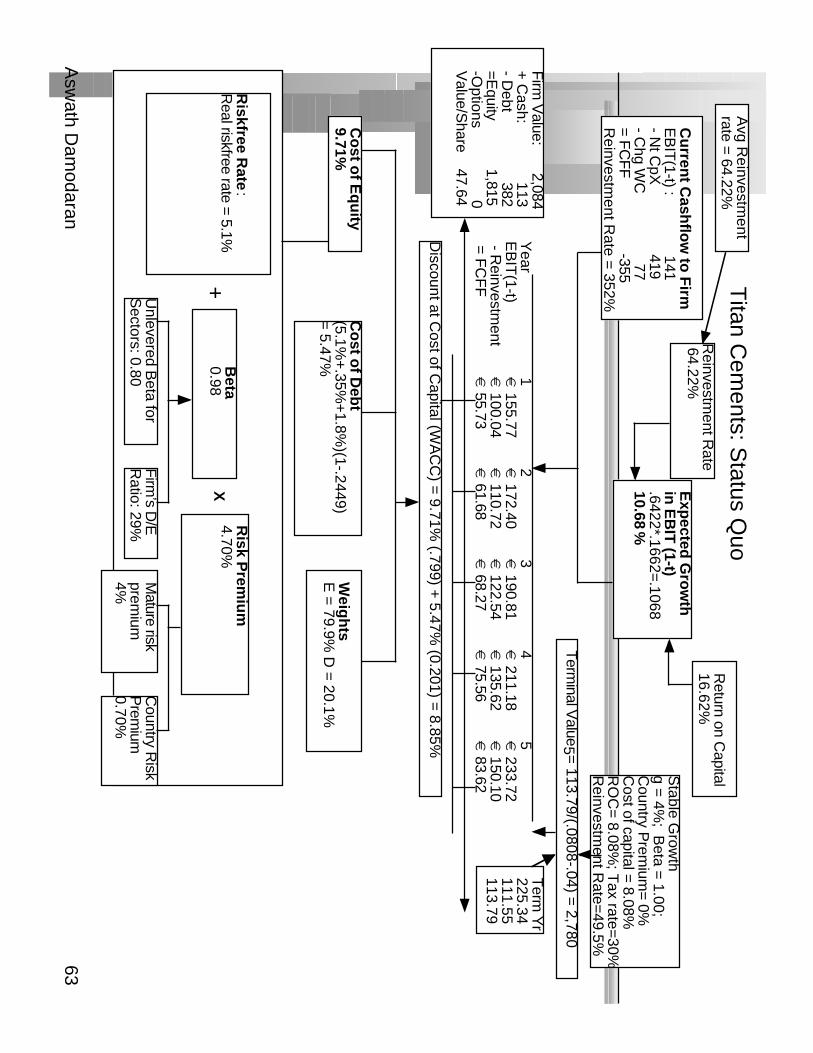
Cu
rrent C
ashflo
w to
Firm
EB
IT(1-t) : 141
- Nt C
pX 419
- Ch g W
C 77
= FC
FF
-355R
einvestment R
ate = 352%
Exp
ected G
row
th
in E
BIT
(1-t).6422*.1662=
.106810.68
%
Stable G
rowth
g = 4%
; Beta =
1.00;C
ountr y Prem
ium= 0%
Cost of capital = 8.08%
R
OC
= 8.08%
; Tax rate=
30%R
einvestment R
ate=49.5%
Term
inal Value5 =
113.79/(.0808-.04) = 2,780
Co
st of E
qu
ity9.71%
Co
st of D
ebt
(5.1%+
.35%+
1.8%)(1-.2449)
= 5.47%
Weig
hts
E =
79.9% D
= 20.1%
Discount at C
ost of Capital (W
AC
C) =
9.71% (.799) +
5.47% (0.201) =
8.85%
Firm
Value: 2,08 4
+ C
ash: 113
- Debt 382
=Equit y 1,815
-Options
0V
alue/Share 47.64
Riskfree R
ate:
Real riskfree rate = 5.1%
+B
eta 0.98
X
Risk P
remiu
m4.70%
Unlevered B
eta for S
ectors: 0.80F
irm’s D
/ER
atio: 29%M
ature riskprem
ium4%
Country R
iskP
remium
0.70%
Titan C
ements: S
tatus Quo
Reinvestm
ent Rate
64.22%
Return on C
apital16.62%
Term
Yr
225.34111.55113.79
Avg R
einvestment
rate = 64.22%
Year
12
34
5E
BIT
(1-t)€
155.77€
172.40€
190.81€
211.18€
233.72 - R
einvestment
€ 100.04
€ 110.72
€ 122.54
€ 135.62
€ 150.10
= F
CF
F€
55.73€
61.68€
68.27€
75.56€
83.62
Asw
ath Dam
odaran64
Value E
nhancement: B
ack to Basics
Asw
ath Dam
odaran
http://ww
w.stern.nyu.edu/~adam
odar

Asw
ath Dam
odaran65
Price Enhancem
ent versus Value E
nhancement
Asw
ath Dam
odaran66
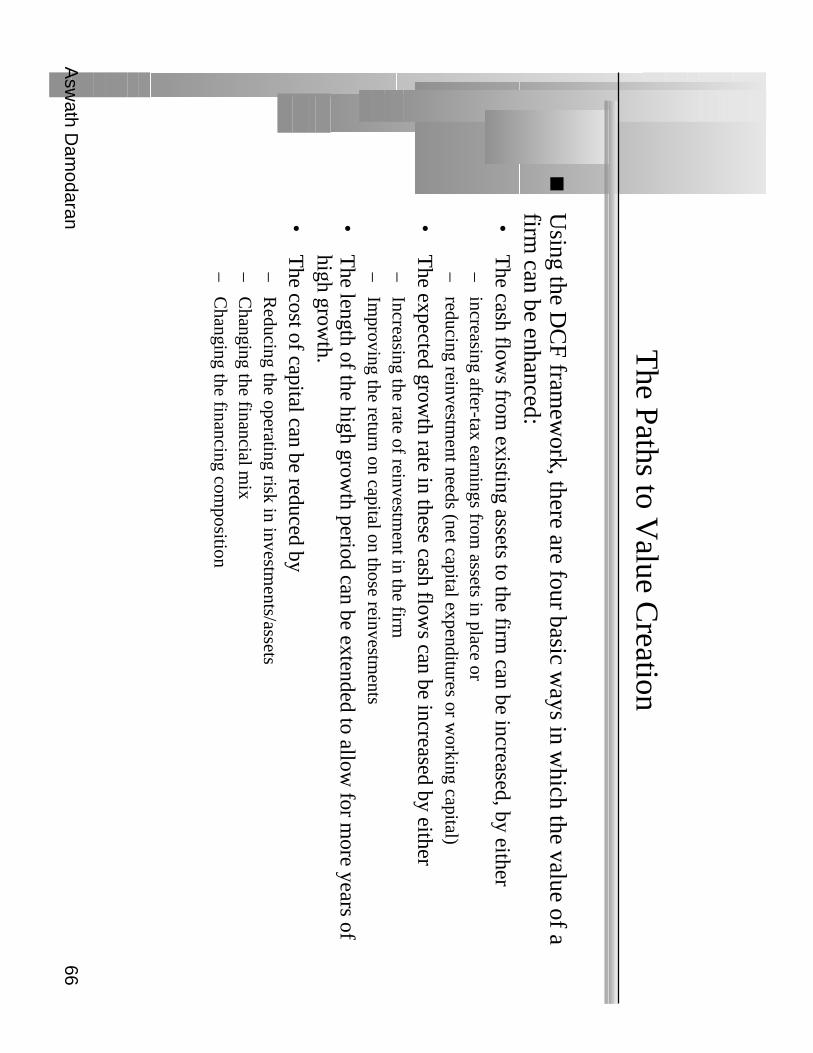
The Paths to V
alue Creation
Using the D
CF fram
ework, there are four basic w
ays in which the value of a
firm can be enhanced:
•T
he cash flows from
existing assets to the firm can be increased, by either
–increasing after-tax earnings from
assets in place or–
reducing reinvestment needs (net capital expenditures or w
orking capital)
•T
he expected growth rate in these cash flow
s can be increased by either–
Increasing the rate of reinvestment in the firm
–Im
proving the return on capital on those reinvestments
•T
he length of the high growth period can be extended to allow
for more years of
high growth.
•T
he cost of capital can be reduced by–
Reducing the operating risk in investm
ents/assets–
Changing the financial m
ix–
Changing the financing com
position

Asw
ath Dam
odaran67
A B
asic Proposition
For an action to affect the value of the firm, it has to
•A
ffect current cash flows (or)
•A
ffect future growth (or)
•A
ffect the length of the high growth period (or)
•A
ffect the discount rate (cost of capital)
Proposition 1: A
ctions that do not affect current cash flows, future
growth, the length of the high grow
th period or the discount rate cannotaffect value.
Asw
ath Dam
odaran68
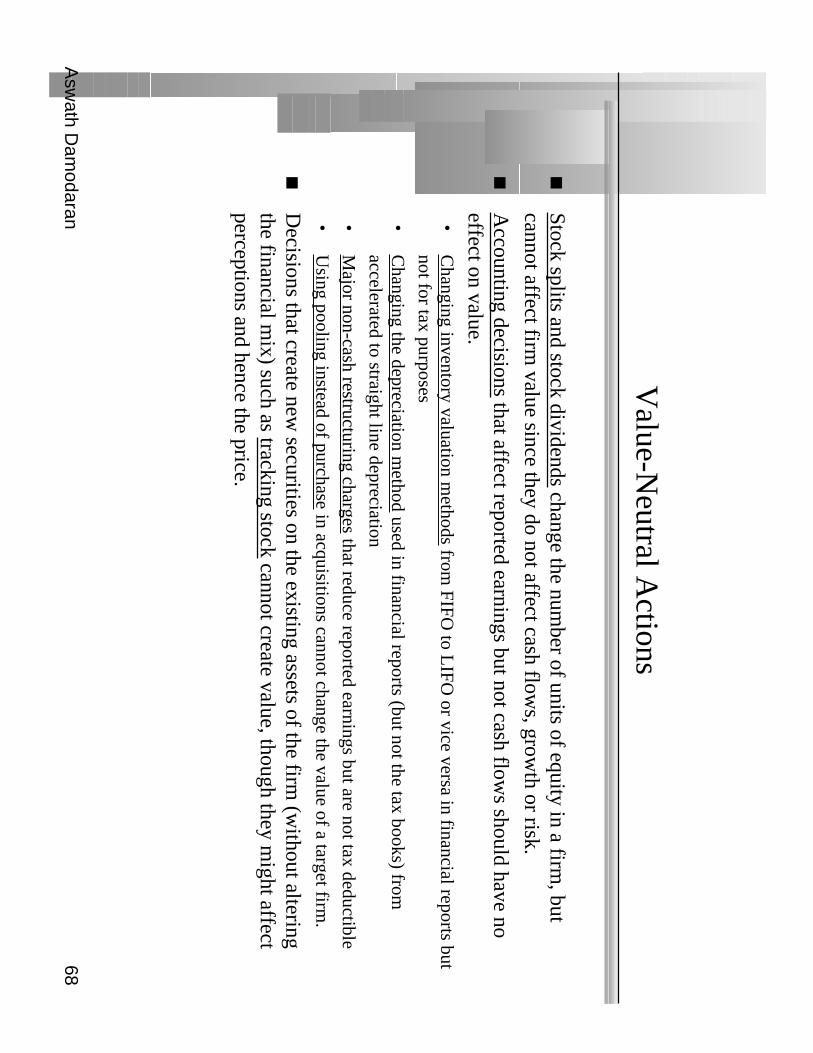
Value-N
eutral Actions
Stock splits and stock dividends change the number of units of equity in a firm
, butcannot affect firm
value since they do not affect cash flows, grow
th or risk.
Accounting decisions that affect reported earnings but not cash flow
s should have noeffect on value.
•C
hanging inventory valuation methods from
FIFO to L
IFO or vice versa in financial reports but
not for tax purposes
•C
hanging the depreciation method used in financial reports (but not the tax books) from
accelerated to straight line depreciation
•M
ajor non-cash restructuring charges that reduce reported earnings but are not tax deductible
•U
sing pooling instead of purchase in acquisitions cannot change the value of a target firm.
Decisions that create new
securities on the existing assets of the firm (w
ithout alteringthe financial m
ix) such as tracking stock cannot create value, though they might affect
perceptions and hence the price.

Asw
ath Dam
odaran69
I. Ways of Increasing C
ash Flows from
Assets in Place
Revenues
* Operating M
argin
= E
BIT
- Tax R
ate * EB
IT
= E
BIT
(1-t)
+ Depreciation
- Capital E
xpenditures- C
hg in Working C
apital=
FC
FF
Divest assets that
have negative EB
IT
More efficient
operations and cost cuttting: H
igher Margins
Reduce tax rate
- moving incom
e to lower tax locales
- transfer pricing- risk m
anagement
Live off past over- investm
ent
Better inventory
managem
ent and tighter credit policies
Asw
ath Dam
odaran70
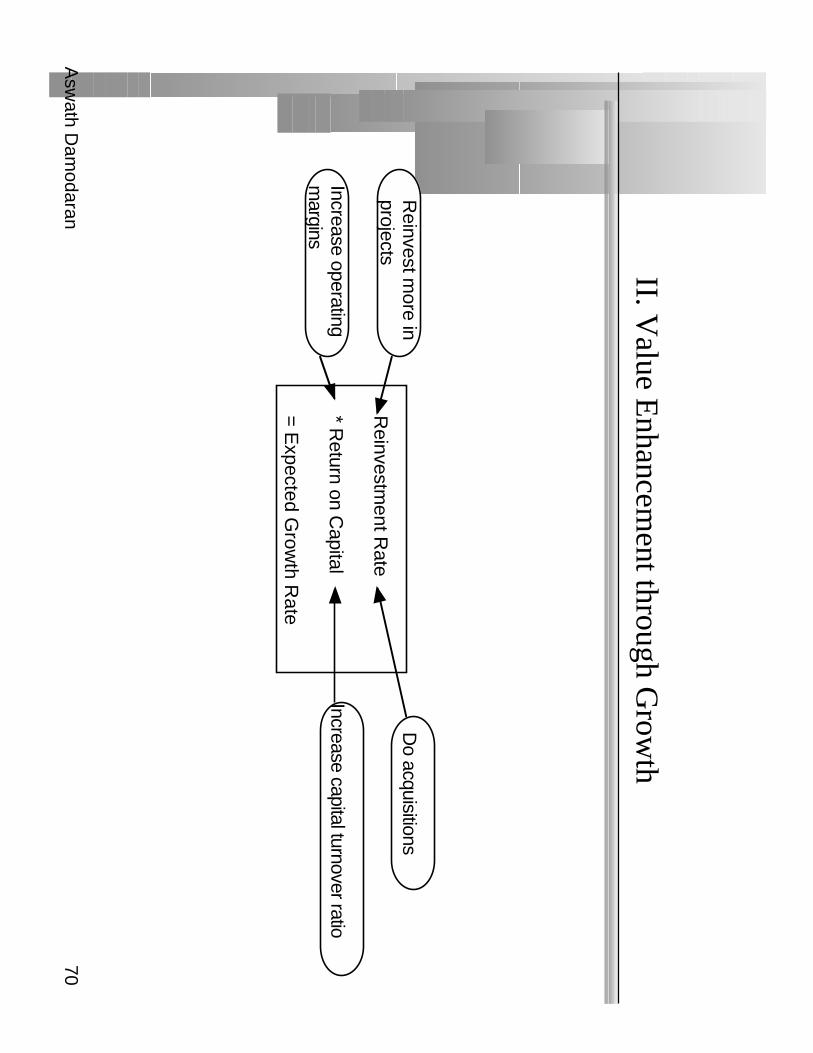
II. Value E
nhancement through G
rowth
Reinvestm
ent Rate
* Return on C
apital
= E
xpected Grow
th Rate
Reinvest m
ore inprojects
Do acquisitions
Increase operatingm
arginsIncrease capital turnover ratio
Asw
ath Dam
odaran71
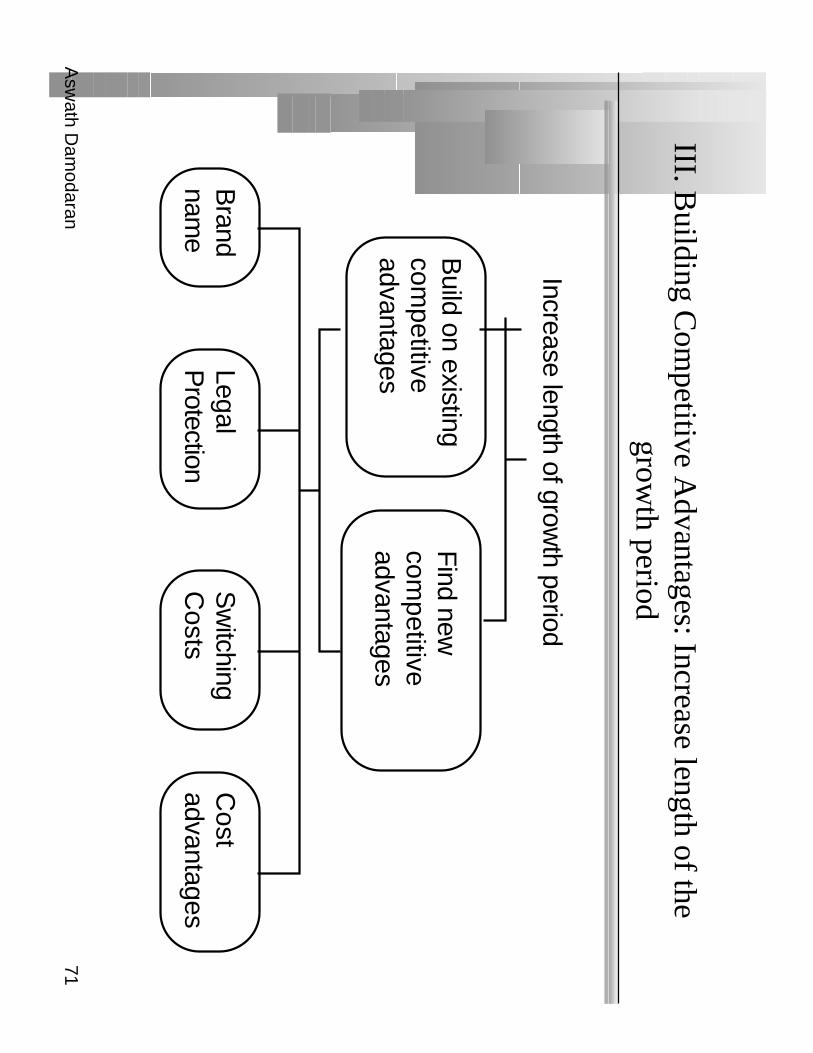
III. Building C
ompetitive A
dvantages: Increase length of thegrow
th period
Increase length of growth period
Build on existing
competitive
advantages
Find new
com
petitive advantages
Brand
name
Legal P
rotectionS
witching
Costs
Cost
advantages
Asw
ath Dam
odaran72
3.1: The B
rand Nam
e Advantage
Some firm
s are able to sustain above-normal returns and grow
th because theyhave w
ell-recognized brand names that allow
them to charge higher prices
than their competitors and/or sell m
ore than their competitors.
Firms that are able to im
prove their brand name value over tim
e can increaseboth their grow
th rate and the period over which they can expect to grow
atrates above the stable grow
th rate, thus increasing value.
Asw
ath Dam
odaran73
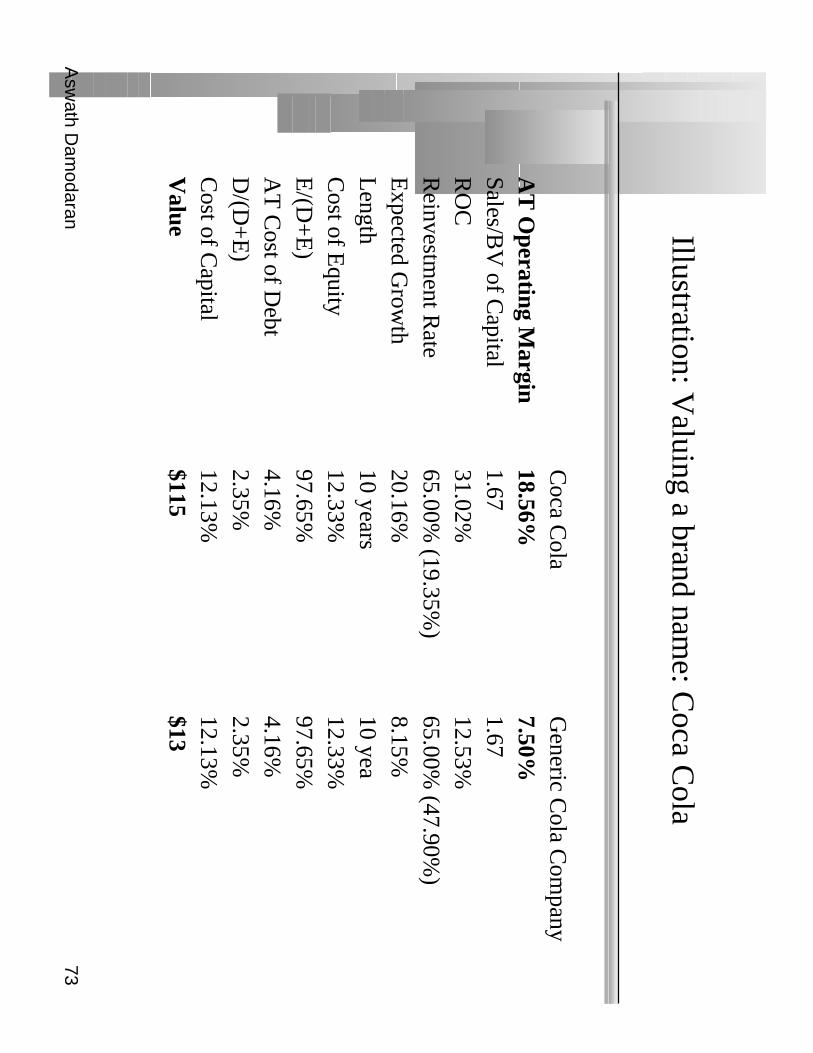
Illustration: Valuing a brand nam
e: Coca C
ola
Coca C
olaG
eneric Cola C
ompany
AT
Operating M
argin18.56%
7.50%Sales/B
V of C
apital1.67
1.67R
OC
31.02%12.53%
Reinvestm
ent Rate
65.00% (19.35%
)65.00%
(47.90%)
Expected G
rowth
20.16%8.15%
Length
10 years10 yea
Cost of E
quity12.33%
12.33%E
/(D+
E)
97.65%97.65%
AT
Cost of D
ebt4.16%
4.16%D
/(D+
E)
2.35%2.35%
Cost of C
apital12.13%
12.13%V
alue$115
$13
Asw
ath Dam
odaran74
3.2: Patents and Legal Protection
The m
ost complete protection that a firm
can have from com
petitive pressureis to ow
n a patent, copyright or some other kind of legal protection allow
ing itto be the sole producer for an extended period.
Note that patents only provide partial protection, since they cannot protect a
firm against a com
petitive product that meets the sam
e need but is not coveredby the patent protection.
Licenses and governm
ent-sanctioned monopolies also provide protection
against competition. T
hey may, how
ever, come w
ith restrictions on excessreturns; utilities in the U
nited States, for instance, are monopolies but are
regulated when it com
es to price increases and returns.
Asw
ath Dam
odaran75
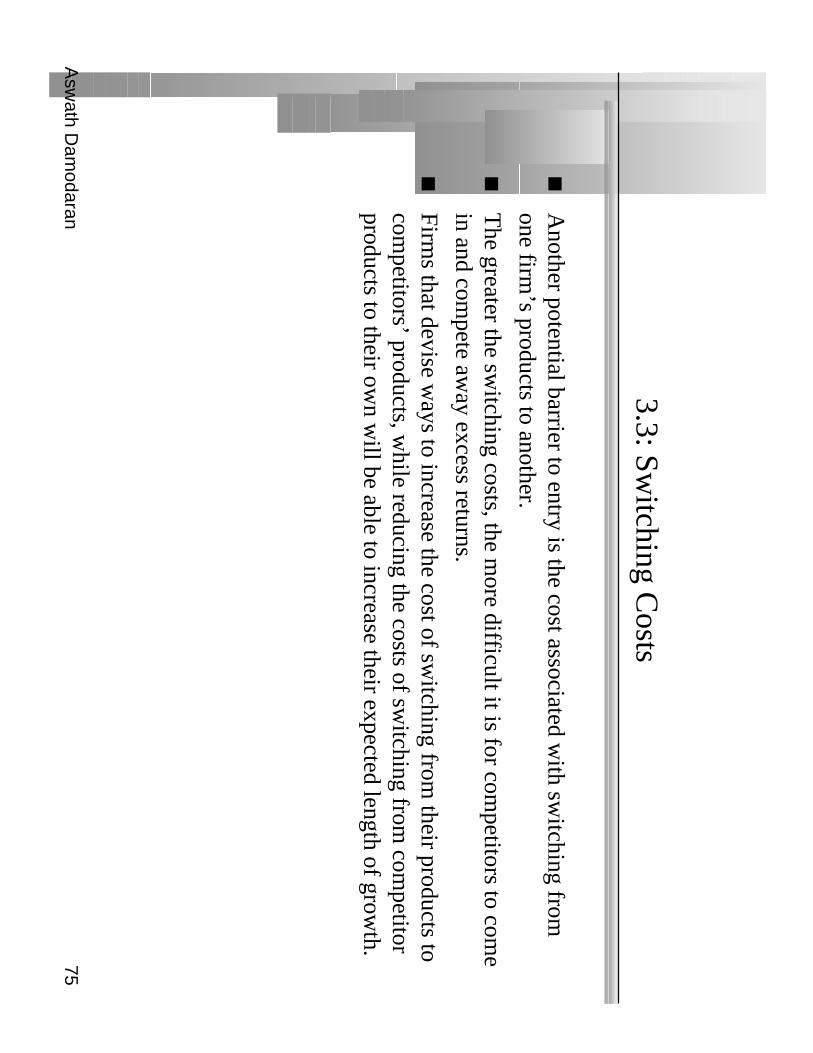
3.3: Switching C
osts
Another potential barrier to entry is the cost associated w
ith switching from
one firm’s products to another.
The greater the sw
itching costs, the more difficult it is for com
petitors to come
in and compete aw
ay excess returns.
Firms that devise w
ays to increase the cost of switching from
their products tocom
petitors’ products, while reducing the costs of sw
itching from com
petitorproducts to their ow
n will be able to increase their expected length of grow
th.
Asw
ath Dam
odaran76
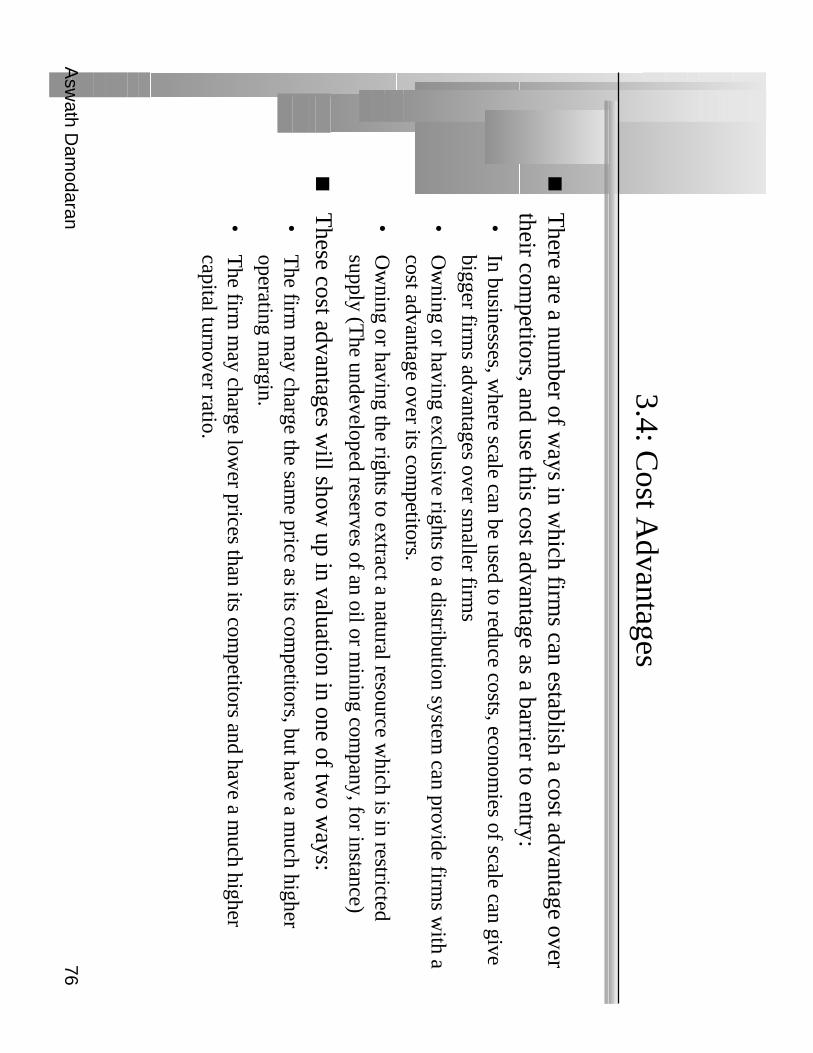
3.4: Cost A
dvantages
There are a num
ber of ways in w
hich firms can establish a cost advantage over
their competitors, and use this cost advantage as a barrier to entry:
•In businesses, w
here scale can be used to reduce costs, economies of scale can give
bigger firms advantages over sm
aller firms
•O
wning or having exclusive rights to a distribution system
can provide firms w
ith acost advantage over its com
petitors.
•O
wning or having the rights to extract a natural resource w
hich is in restrictedsupply (T
he undeveloped reserves of an oil or mining com
pany, for instance)
These cost advantages w
ill show up in valuation in one of tw
o ways:
•T
he firm m
ay charge the same price as its com
petitors, but have a much higher
operating margin.
•T
he firm m
ay charge lower prices than its com
petitors and have a much higher
capital turnover ratio.
Asw
ath Dam
odaran77
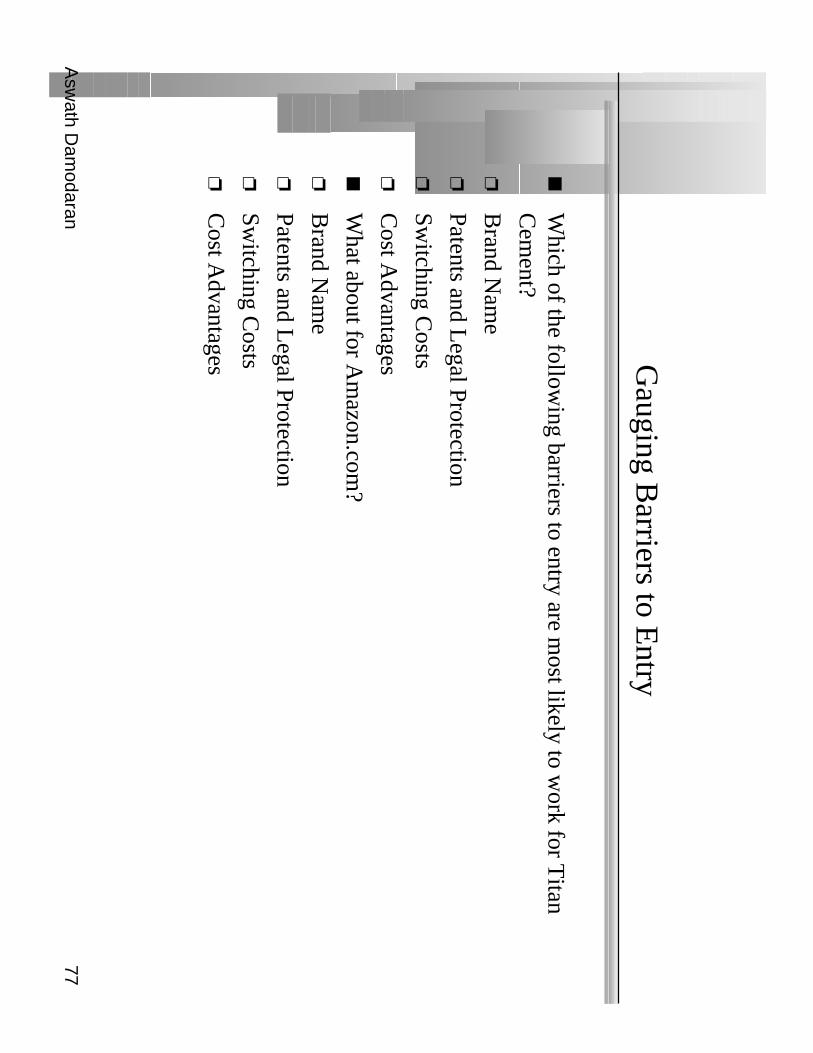
Gauging B
arriers to Entry
Which of the follow
ing barriers to entry are most likely to w
ork for Titan
Cem
ent?
Brand N
ame
Patents and Legal Protection
Switching C
osts
Cost A
dvantages
What about for A
mazon.com
?
Brand N
ame
Patents and Legal Protection
Switching C
osts
Cost A
dvantages
Asw
ath Dam
odaran78
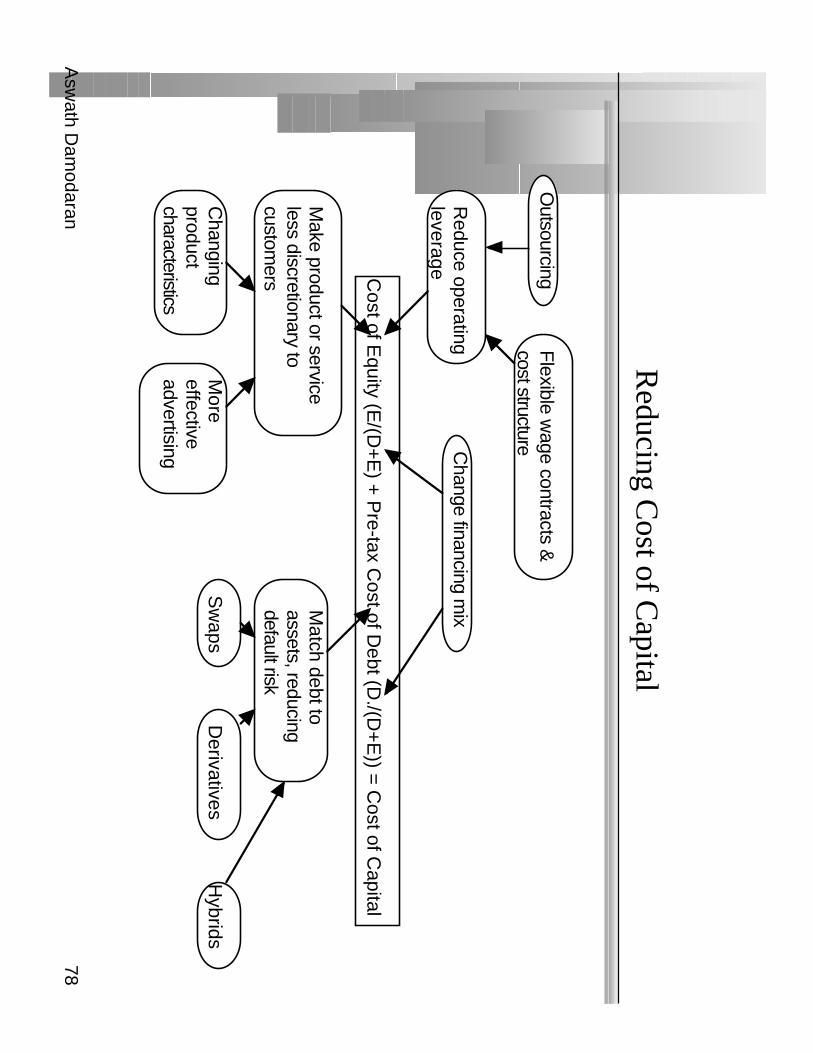
Reducing C
ost of Capital
Cost of E
quity (E/(D
+E
) + P
re-tax Cost of D
ebt (D./(D
+E
)) = C
ost of Capital
Change financing m
ix
Make product or service
less discretionary to custom
ers
Reduce operating
leverage
Match debt to
assets, reducing default risk
Changing
product characteristics
More
effective advertising
Outsourcing
Flexible w
age contracts &cost structure
Sw
apsD
erivativesH
ybrids
Asw
ath Dam
odaran79
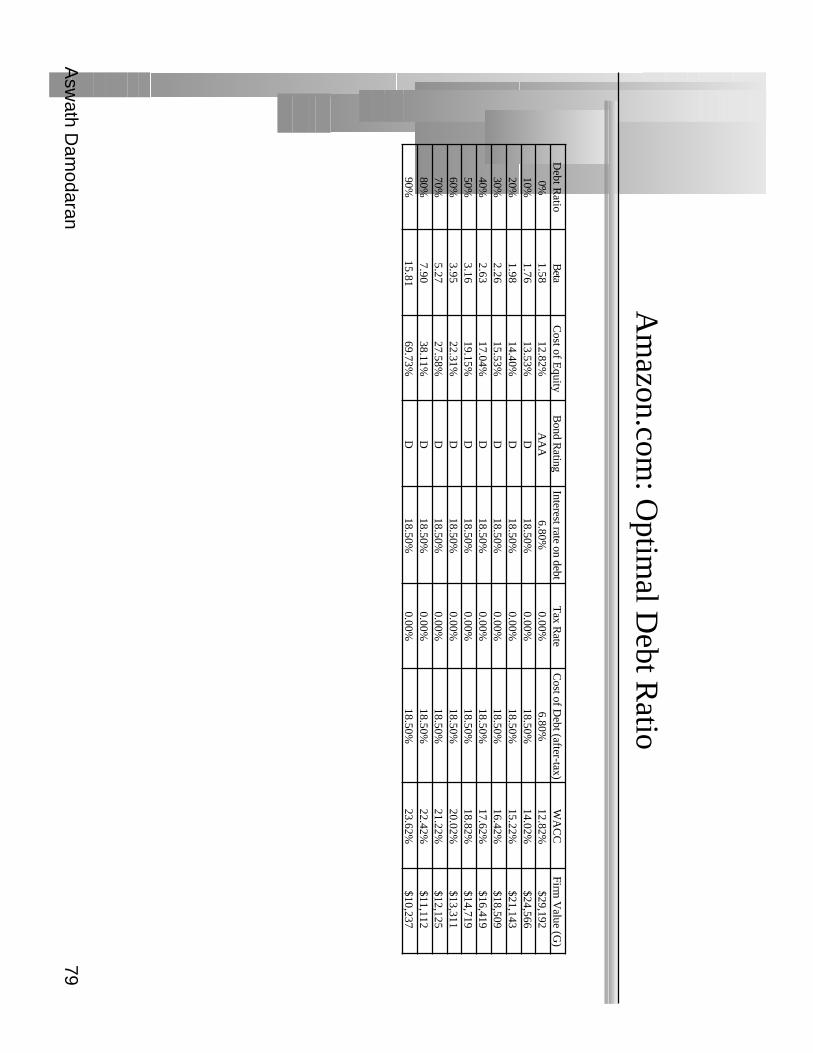
Am
azon.com: O
ptimal D
ebt Ratio
Debt R
atioB
etaC
ost of Equity
Bond R
atingInterest rate on debt
Tax R
ateC
ost of Debt (after-tax)
WA
CC
Firm V
alue (G)
0%1.58
12.82%A
AA
6.80%0.00%
6.80%12.82%
$29,19210%
1.7613.53%
D18.50%
0.00%18.50%
14.02%$24,566
20%1.98
14.40%D
18.50%0.00%
18.50%15.22%
$21,14330%
2.2615.53%
D18.50%
0.00%18.50%
16.42%$18,509
40%2.63
17.04%D
18.50%0.00%
18.50%17.62%
$16,41950%
3.1619.15%
D18.50%
0.00%18.50%
18.82%$14,719
60%3.95
22.31%D
18.50%0.00%
18.50%20.02%
$13,31170%
5.2727.58%
D18.50%
0.00%18.50%
21.22%$12,125
80%7.90
38.11%D
18.50%0.00%
18.50%22.42%
$11,11290%
15.8169.73%
D18.50%
0.00%18.50%
23.62%$10,237
Asw
ath Dam
odaran80
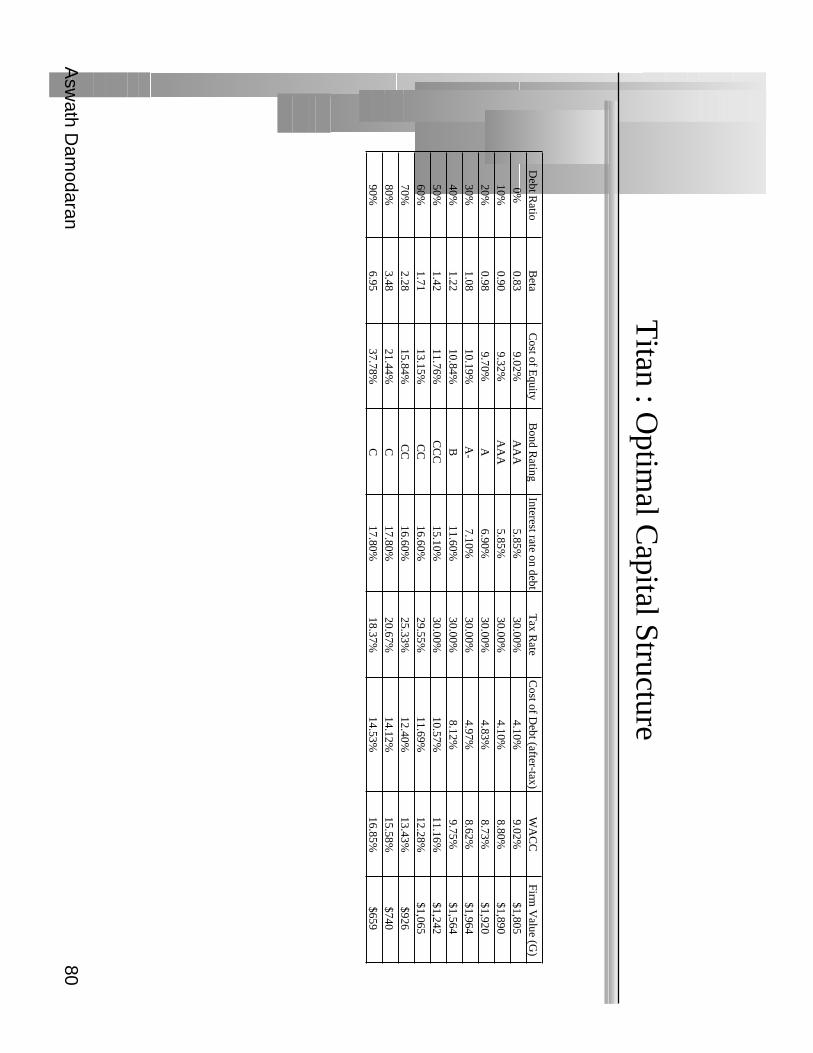
Titan : O
ptimal C
apital Structure
Debt R
atioB
etaC
ost of Equity
Bond R
atingInterest rate on debt
Tax R
ateC
ost of Debt (after-tax)
WA
CC
Firm V
alue (G)
0%0.83
9.02%A
AA
5.85%30.00%
4.10%9.02%
$1,80510%
0.909.32%
AA
A5.85%
30.00%4.10%
8.80%$1,890
20%0.98
9.70%A
6.90%30.00%
4.83%8.73%
$1,92030%
1.0810.19%
A-
7.10%30.00%
4.97%8.62%
$1,96440%
1.2210.84%
B11.60%
30.00%8.12%
9.75%$1,564
50%1.42
11.76%C
CC
15.10%30.00%
10.57%11.16%
$1,24260%
1.7113.15%
CC
16.60%29.55%
11.69%12.28%
$1,06570%
2.2815.84%
CC
16.60%25.33%
12.40%13.43%
$92680%
3.4821.44%
C17.80%
20.67%14.12%
15.58%$740
90%6.95
37.78%C
17.80%18.37%
14.53%16.85%
$659
Asw
ath Dam
odaran81
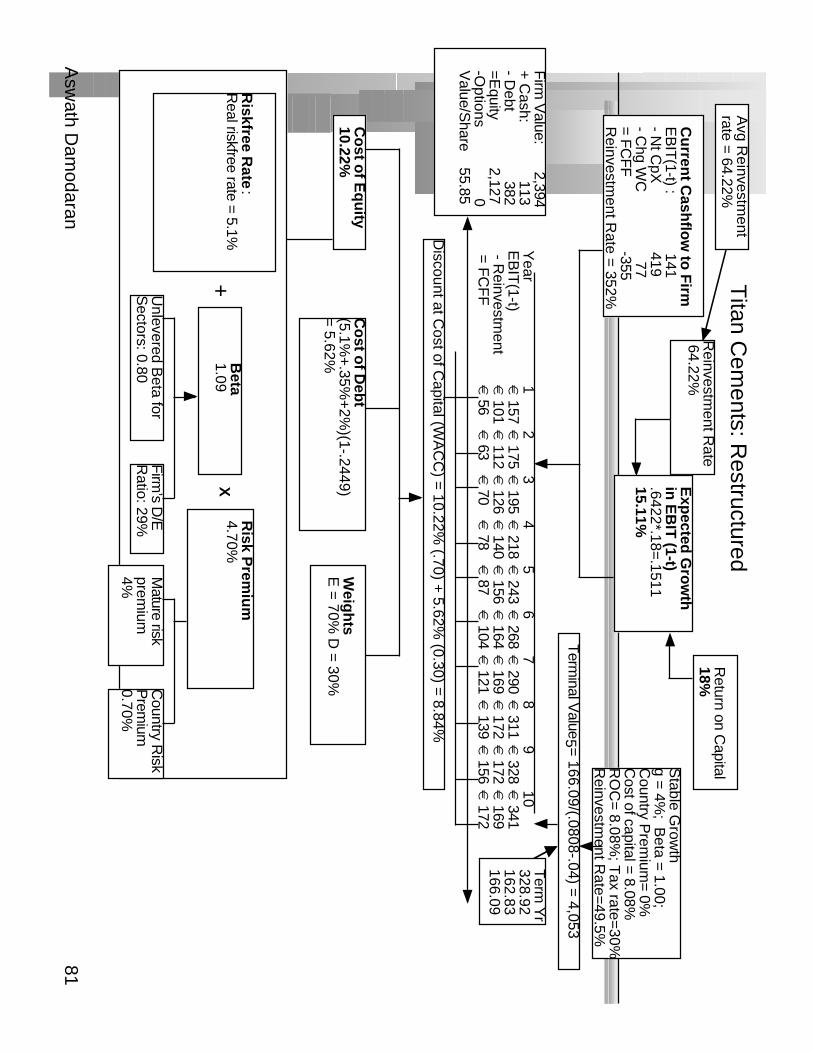
Cu
rrent C
ashflo
w to
Firm
EB
IT(1-t) : 141
- Nt C
pX 419
- Ch g W
C 77
= FC
FF
-355R
einvestment R
ate = 352%
Exp
ected G
row
th
in E
BIT
(1-t).6422*.18=
.151115.11%
Stable G
rowth
g = 4%
; Beta =
1.00;C
ountry Prem
ium= 0%
Cost of capital = 8.08%
R
OC
= 8.08%
; Tax rate=
30%R
einvestment R
ate=49.5%
Term
inal Value5 =
166.09/(.0808-.04) = 4,053
Co
st of E
qu
ity10.22%
Co
st of D
ebt
(5.1%+
.35%+
2%)(1-.2449)
= 5.62%
Weig
hts
E =
70% D
= 30%
Discount at C
ost of Capital (W
AC
C) =
10.22% (.70) +
5.62% (0.30) =
8.84%
Firm
Value: 2,394
+ C
ash: 113
- Debt 382
=Equity 2,127
-Options
0V
alue/Share 55.85
Riskfree R
ate:
Real riskfree rate = 5.1%
+B
eta 1.09
X
Risk P
remiu
m4.70%
Unlevered B
eta for S
ectors: 0.80F
irm’s D
/ER
atio: 29%M
ature riskprem
ium4%
Country R
iskP
remium
0.70%
Titan C
ements: R
estructured R
einvestment R
ate 64.22%
Return on C
apital18%
Term
Yr
328.92162.83166.09
Avg R
einvestment
rate = 64.22%
Year
12
34
56
78
910
EB
IT(1-t)
€ 157
€ 175
€ 195
€ 218
€ 243
€ 268
€ 290
€ 311
€ 328
€ 341
- Reinvestm
ent€
101€
112€
126€
140€
156€
164€
169€
172€
172€
169 =
FC
FF
€ 56
€ 63
€ 70
€ 78
€ 87
€ 104
€ 121
€ 139
€ 156
€ 172
Asw
ath Dam
odaran82
The V
alue of Control?
If the value of a firm run optim
ally is significantly higher than the value of thefirm
with the status quo (or incum
bent managem
ent), you can write the value
that you should be willing to pay as:
Value of control =
Value of firm
optimally run - V
alue of firm w
ith status quo
Implications:
•T
he value of control is greatest at poorly run firms.
•V
oting shares in poorly run firms should trade at a prem
ium on non-voting shares
if the votes associated with the shares w
ill give you a chance to have a say in ahostile acquisition.
•W
hen valuing private firms, your estim
ate of value will vary depending upon
whether you gain control of the firm
. For example, 49%
of a private firm m
ay bew
orth less than 51% of the sam
e firm.
49% stake =
49% of status quo value
51% stake =
51% of optim
al value
Asw
ath Dam
odaran83
Back to L
emm
ings...