Embed Size (px)
Citation preview

Aswath Damodaran 1
Returning Cash to the Owners: Dividend Policy
Aswath Damodaran

Aswath Damodaran 2
First Principles
Invest in projects that yield a return greater than the minimum acceptable hurdle rate.
• The hurdle rate should be higher for riskier projects and reflect the financing mix used - owners’ funds (equity) or borrowed money (debt)
• Returns on projects should be measured based on cash flows generated and the timing of these cash flows; they should also consider both positive and negative side effects of these projects.
Choose a financing mix that minimizes the hurdle rate and matches the assets being financed.
If there are not enough investments that earn the hurdle rate, return the cash to stockholders.
• The form of returns - dividends and stock buybacks - will depend upon the stockholders’ characteristics.
Objective: Maximize the Value of the Firm

Aswath Damodaran 3
Dividends are sticky
Dividend Changes : 1989-1998
0.00%
10.00%
20.00%
30.00%
40.00%
50.00%
60.00%
1989 1990 1991 1992 1993 1994 1995 1996 1997 1998
Year
% of all firms
Increasing dividends Decreasing dividends Not changing dividends

Aswath Damodaran 4
Dividends tend to follow earnings
Figure 21.5: Dividends and Earnings at US Firms: 1960 - 1998
0.00
5.00
10.00
15.00
20.00
25.00
30.00
35.00
40.00
45.00
196019611962196319641965196619671968196919701971197219731974197519761977197819791980198119821983198419851986198719881989199019911992199319941995199619971998
Year
$ Dividends/Earnings
Earnings Dividends

Aswath Damodaran 5
More and more firms are buying back stock, rather than pay dividends...
Figure 22.1: Stock Buybacks and Dividends: Aggregate for US Firms - 1989-98
$-
$50,000.00
$100,000.00
$150,000.00
$200,000.00
$250,000.00
1988 1989 1990 1991 1992 1993 1994 1995 1996 1997 1998
Year
Stock Buybacks Dividends
Aswath Damodaran 6
Measures of Dividend Policy
Dividend Payout:• measures the percentage of earnings that the company pays in dividends
• = Dividends / Earnings Dividend Yield :
• measures the return that an investor can make from dividends alone
• = Dividends / Stock Price

Aswath Damodaran 7
Dividend Payout Ratios: January 2002
0
20
40
60
80
100
120
140
160
180
0-5% 5-10% 10-15%15-20%20-25%25-30%30-35%35-40%40-45%45-50%50-60%60-70%70-80%80-90%90-100%>100%
Dividend Payout Ratios: January 2002 Firms paying/not paying dividends
0
500
1000
1500
2000
2500
Pay dividends Pay no dividends
Number of firms

Aswath Damodaran 8
Dividend Yields in the United States: January 2002
0
50
100
150
200
250
0-0.25%0.25-0.5%0.5-0.75%
0.75-%1-1.25% 1-1.5%1.5-1.75%
1.75-2% 2-2.5% 2.5-3% 3-3.5% 3.5-4%4-5% >5%
Dividend Yields: January 2002
Number of dividend Paying firms = 1800Number of non-dividend Paying firms = 3971
Aswath Damodaran 9
Three Schools Of Thought On Dividends
1. If • (a) there are no tax disadvantages associated with dividends
• (b) companies can issue stock, at no cost, to raise equity, whenever needed
• Dividends do not matter, and dividend policy does not affect value. 2. If dividends have a tax disadvantage,
• Dividends are bad, and increasing dividends will reduce value 3. If stockholders like dividends, or dividends operate as a signal of future prospects,
• Dividends are good, and increasing dividends will increase value

Aswath Damodaran 10
The balanced viewpoint
If a company has excess cash, and few good projects (NPV>0), returning money to stockholders (dividends or stock repurchases) is GOOD.
If a company does not have excess cash, and/or has several good projects (NPV>0), returning money to stockholders (dividends or stock repurchases) is BAD.

Aswath Damodaran 11
Why do firms pay dividends?
The Miller-Modigliani Hypothesis: Dividends do not affect value Basis:
• If a firm's investment policy (and hence cash flows) don't change, the value of the firm cannot change with dividend policy. If we ignore personal taxes, investors have to be indifferent to receiving either dividends or capital gains.
Underlying Assumptions:• (a) There are no tax differences between dividends and capital gains.
• (b) If companies pay too much in cash, they can issue new stock, with no flotation costs or signaling consequences, to replace this cash.
• (c) If companies pay too little in dividends, they do not use the excess cash for bad projects or acquisitions.

Aswath Damodaran 12
The Tax Response: Dividends are taxed more than capital gains
Basis: • Dividends are taxed more heavily than capital gains. A stockholder will
therefore prefer to receive capital gains over dividends. Evidence:
• Examining ex-dividend dates should provide us with some evidence on whether dividends are perfect substitutes for capital gains.

Aswath Damodaran 13
Price Behavior on Ex-Dividend Date
Let Pb= Price before the stock goes ex-dividend Pa=Price after the stock goes ex-dividend D = Dividends declared on stock to, tcg = Taxes paid on ordinary income and capital gains respectively
$ Pb $Pa______________|_______ Ex-Dividend Day _______________|

Aswath Damodaran 14
Cashflows from Selling around Ex-Dividend Day
The cash flows from selling before then are-Pb - (Pb - P) tcg
The cash flows from selling after the ex-dividend day are-Pa - (Pa - P) tcg + D(1-to)
Since the average investor should be indifferent between selling before the ex-dividend day and selling after the ex-dividend day -
Pb - (Pb - P) tcg = Pa - (Pa - P) tcg + D(1-to)Moving the variables around, we arrive at the following:
Aswath Damodaran 15
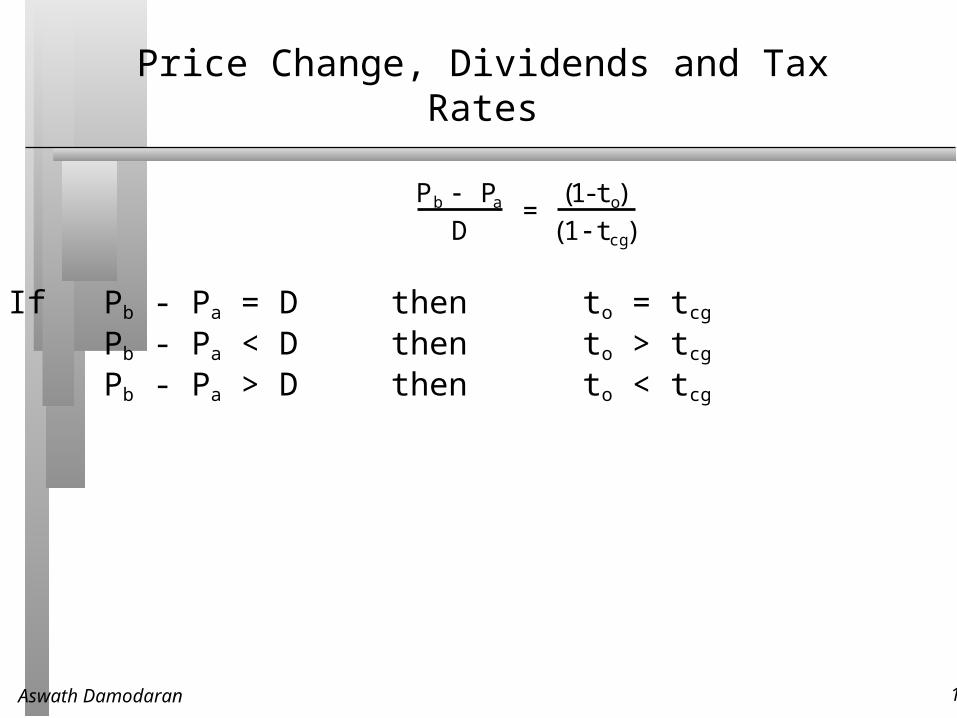
Price Change, Dividends and Tax Rates
If Pb - Pa = D then to = tcg
Pb - Pa < D then to > tcg
Pb - Pa > D then to < tcg
P b P a
D =
(1- t o)
(1 t cg)

Aswath Damodaran 16
The Evidence on Ex-Dividend Day Behavior
Ordi nary I nco me Capit al Gai ns ( Pb - Pa)/ D
Bef ore 1981 70 % 28 % 0. 78 ( 1966- 69)
1981- 85 50 % 20 % 0. 85
1986- 1990 28 % 28 % 0. 90
1991- 1993 33 % 28 % 0. 92
1994.. 39. 6 % 28 % 0.90

Aswath Damodaran 17
Dividend Arbitrage
Assume that you are a tax exempt investor, and that you know that the price drop on the ex-dividend day is only 90% of the dividend. How would you exploit this differential?
Invest in the stock for the long term Sell short the day before the ex-dividend day, buy on the ex-dividend
day Buy just before the ex-dividend day, and sell after. ______________________________________________

Aswath Damodaran 18
Example of dividend capture strategy with tax factors
XYZ company is selling for $50 at close of trading May 3. On May 4, XYZ goes ex-dividend; the dividend amount is $1. The price drop (from past examination of the data) is only 90% of the dividend amount.
The transactions needed by a tax-exempt U.S. pension fund for the arbitrage are as follows:• 1. Buy 1 million shares of XYZ stock cum-dividend at $50/share.
• 2. Wait till stock goes ex-dividend; Sell stock for $49.10/share (50 - 1* 0.90)
• 3. Collect dividend on stock. Net profit = - 50 million + 49.10 million + 1 million = $0.10 million
Aswath Damodaran 19
The wrong reasons for paying dividendsThe bird in the hand fallacy
Argument: Dividends now are more certain than capital gains later. Hence dividends are more valuable than capital gains.
Counter: The appropriate comparison should be between dividends today and price appreciation today. (The stock price drops on the ex-dividend day.)

Aswath Damodaran 20
The excess cash hypothesis
Argument: The firm has excess cash on its hands this year, no investment projects this year and wants to give the money back to stockholders.
Counter: So why not just repurchase stock? If this is a one-time phenomenon, the firm has to consider future financing needs. Consider the cost of issuing new stock:

Aswath Damodaran 21
The Cost of Raising Funds
Issuing new equity is much more expensive than raising new debt for companies that are already publicly traded, in terms of transactions costs and investment banking fees
Raising small amounts is much more expensive than raising large amounts, for both equity and debt. Making a small equity issue ( say $ 25-$ 50 million might be prohibitively expensive)

Aswath Damodaran 22
Are firms perverse? Some evidence that they are not

Aswath Damodaran 23
Evidence from Canadian Firms
Company Premium for Cash dividend over
Stock Dividend Shares
Consolidated Bathurst 19.30%
Donfasco 13.30%
Dome Petroleum 0.30%
Imperial Oil 12.10%
Newfoundland Light & Power 1.80%
Royal Trustco 17.30%
Stelco 2.70%
TransAlta 1.10%
Average 7.54%

Aswath Damodaran 24
A clientele based explanation
Basis: Investors may form clienteles based upon their tax brackets. Investors in high tax brackets may invest in stocks which do not pay dividends and those in low tax brackets may invest in dividend paying stocks.
Evidence: A study of 914 investors' portfolios was carried out to see if their portfolio positions were affected by their tax brackets. The study found that • (a) Older investors were more likely to hold high dividend stocks and
• (b) Poorer investors tended to hold high dividend stocks
Aswath Damodaran 25
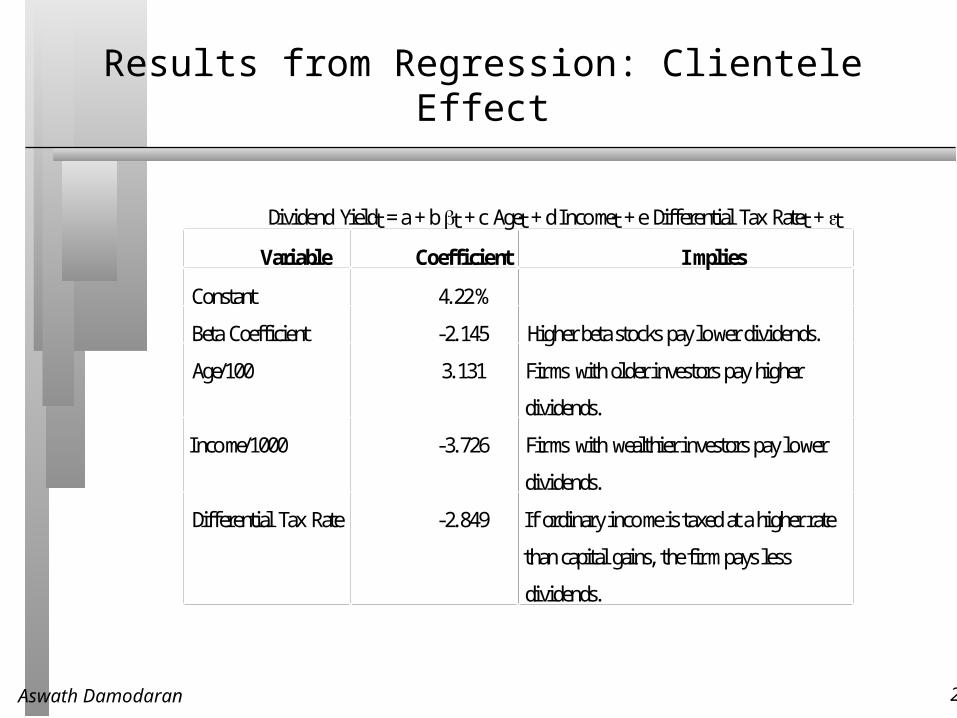
Results from Regression: Clientele Effect
Dividend Yieldt = a + b t + c Aget + d Incomet + e Differential Tax Ratet + t
Variable Coefficient Implies
Constant 4.22%
Beta Coefficient -2.145 Higher beta stocks pay lower dividends.
Age/100 3.131 Firms with older investors pay higher
dividends.
Income/1000 -3.726 Firms with wealthier investors pay lower
dividends.
Differential Tax Rate -2.849 If ordinary income is taxed at a higher rate
than capital gains, the firm pays less
dividends.

Aswath Damodaran 26
Dividend Policy and Clientele
Assume that you run a phone company, and that you have historically paid large dividends. You are now planning to enter the telecommunications and media markets. Which of the following paths are you most likely to follow?
Courageously announce to your stockholders that you plan to cut dividends and invest in the new markets.
Continue to pay the dividends that you used to, and defer investment in the new markets.
Continue to pay the dividends that you used to, make the investments in the new markets, and issue new stock to cover the shortfall
Other

Aswath Damodaran 27
The Signaling Hypothesis

Aswath Damodaran 28
An Alternative Story..Dividends as Negative Signals

Aswath Damodaran 29
The Wealth Transfer Hypothesis
-2
-1.5
-1
-0.5
0
0.5
t:-15
-12 -9 -6 -3 0 3 6 9 12 15
CAR (Div Up)
CAR (Div down)
EXCESS RETURNS ON STRAIGHT BONDS AROUND DIVIDEND CHANGES
Day (0: Announcement date)
CAR

Aswath Damodaran 30
Management Beliefs about Dividend Policy
A firm’s dividend payout ratio affects its stock price. Dividend payments operate as a signal to financial markets Dividend announcements provide information to financial markets. Investors think that dividends are safer than retained earnings Investors are not indifferent between dividends and price appreciation. Stockholders are attracted to firms that have dividend policies that
they like.

Aswath Damodaran 31
Determinants of Dividend Policy
Investment Opportunities: More investment opportunities - > Lower Dividends
Stability in earnings: More stable earnings -> Higher Dividends Alternative sources of capital: More alternative sources -> Higher
Dividends Constraints: More constraints imposed by bondholders and lenders ->
Lower Dividends Signaling Incentives: More options to supply information to financial
markets - Lower need to pay dividends as signal Stockholder characteristics: Older, poorer stockholders -> Higher
dividends

Aswath Damodaran 32
Questions to Ask in Dividend Policy Analysis
How much could the company have paid out during the period under question?
How much did the the company actually pay out during the period in question?
How much do I trust the management of this company with excess cash?• How well did they make investments during the period in question?
• How well has my stock performed during the period in question?

Aswath Damodaran 33
A Measure of How Much a Company Could have Afforded to Pay out: FCFE
The Free Cashflow to Equity (FCFE) is a measure of how much cash is left in the business after non-equity claimholders (debt and preferred stock) have been paid, and after any reinvestment needed to sustain the firm’s assets and future growth.Net Income
+ Depreciation & Amortization
= Cash flows from Operations to Equity Investors
- Preferred Dividends
- Capital Expenditures
- Working Capital Needs
- Principal Repayments
+ Proceeds from New Debt Issues
= Free Cash flow to Equity

Aswath Damodaran 34
Estimating FCFE when Leverage is Stable
Net Income
- (1- ) (Capital Expenditures - Depreciation)
- (1- ) Working Capital Needs
= Free Cash flow to Equity
= Debt/Capital Ratio
For this firm, • Proceeds from new debt issues = Principal Repayments + (Capital
Expenditures - Depreciation + Working Capital Needs)

Aswath Damodaran 35
An Example: FCFE Calculation
Consider the following inputs for Microsoft in 1996. In 1996, Microsoft’s FCFE was:• Net Income = $2,176 Million
• Capital Expenditures = $494 Million
• Depreciation = $ 480 Million
• Change in Non-Cash Working Capital = $ 35 Million
• Debt Ratio = 0% FCFE = Net Income - (Cap ex - Depr) (1-DR) - Chg WC (!-DR)
= $ 2,176 - (494 - 480) (1-0) - $ 35 (1-0)
= $ 2,127 Million
Aswath Damodaran 36
Microsoft: Dividends?
By this estimation, Microsoft could have paid $ 2,127 Million in dividends/stock buybacks in 1996. They paid no dividends and bought back no stock. Where will the $2,127 million show up in Microsoft’s balance sheet?
Aswath Damodaran 37
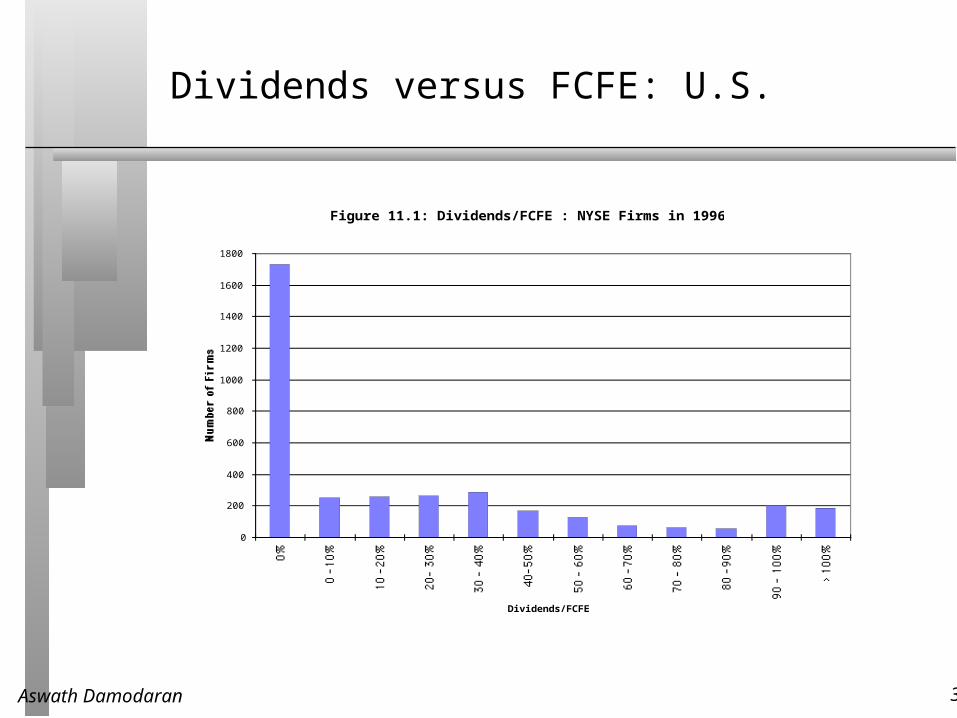
Dividends versus FCFE: U.S.
Figure 11.1: Dividends/FCFE : NYSE Firms in 1996
0
200
400
600
800
1000
1200
1400
1600
1800
0%
0 -10%10 -20% 20- 30% 30 - 40%
40-50%50 - 60% 60 -70% 70 - 80% 80 -90%
90 - 100%
> 100%
Dividends/FCFE
Number of Firms

Aswath Damodaran 38
The Consequences of Failing to pay FCFE
Chrysler: FCFE, Dividends and Cash Balance
($500)
$0
$500
$1,000
$1,500
$2,000
$2,500
$3,000
1985 1986 1987 1988 1989 1990 1991 1992 1993 1994
Year
Cash Flow
$0
$1,000
$2,000
$3,000
$4,000
$5,000
$6,000
$7,000
$8,000
$9,000
Cash Balance
= Free CF to Equity = Cash to Stockholders Cumulated Cash

Aswath Damodaran 39
Application Test: Estimating your firm’s FCFE
In General, If cash flow statement usedNet Income Net Income+ Depreciation & Amortization + Depreciation & Amortization- Capital Expenditures + Capital Expenditures- Change in Non-Cash Working Capital + Changes in Non-cash WC- Preferred Dividend + Preferred Dividend- Principal Repaid + Increase in LT Borrowing+ New Debt Issued + Decrease in LT Borrowing
+ Change in ST Borrowing= FCFE = FCFE
Compare toDividends (Common) -Common Dividend
+ Stock Buybacks - Decrease in Capital Stock+ Increase in Capital Stock

Aswath Damodaran 40
A Practical Framework for Analyzing Dividend Policy
How much did the firm pay out? How much could it have afforded to pay out?What it could have paid out What it actually paid outNet Income Dividends- (Cap Ex - Depr’n) (1-DR) + Equity Repurchase- Chg Working Capital (1-DR)= FCFE
Firm pays out too littleFCFE > Dividends
Firm pays out too muchFCFE < Dividends
Do you trust managers in the company withyour cash?Look at past project choice:Compare ROE to Cost of Equity
ROC to WACC
What investment opportunities does the firm have?Look at past project choice:Compare ROE to Cost of Equity
ROC to WACC
Firm has history of good project choice and good projects in the future
Firm has historyof poor project choice
Firm has good projects
Firm has poor projects
Give managers the flexibility to keep cash and set dividends
Force managers to justify holding cash or return cash to stockholders
Firm should cut dividends and reinvest more
Firm should deal with its investment problem first and then cut dividends

Aswath Damodaran 41
A Dividend Matrix
FCFE - Dividends
Good ProjectsPoor Projects
MaximumFlexibility in Dividend Policy
Reduce cash payout to stockholders
Significant pressureon managers to pay cash out
Investment and Dividend problems; cut dividends but also check project choice

Aswath Damodaran 42
Disney: An analysis of FCFE from 1992-1996
Year Net Income (Cap Ex- Depr) Chg in WC FCFE
(1- Debt Ratio) (1-Debt Ratio)
1992 $817 $173 ($81) $725
1993 $889 $328 $160 $402
1994 $1,110 $469 $498 $143
1995 $1,380 $325 $206 $849
1996* $1,214 $466 ($470) $1,218
Avge $1,082 $352 $63 $667
(The numbers for 1996 are reported without the Capital Cities Acquisition)
The debt ratio used to estimate the free cash flow to equity was estimated as follows = Net Debt Issues/(Net Cap Ex + Change in Non-cash WC)

Aswath Damodaran 43
Disney’s Dividends and Buybacks from 1992 to 1996
Year FCFE Dividends + Stock Buybacks
1992 $725 $105
1993 $402 $160
1994 $143 $724
1995 $849 $529
1996 $1,218 $733
Average $667 $450

Aswath Damodaran 44
Disney: Dividends versus FCFE
Disney paid out $ 217 million less in dividends (and stock buybacks) than it could afford to pay out. How much cash do you think Disney accumulated during the period?

Aswath Damodaran 45
Can you trust Disney’s management?
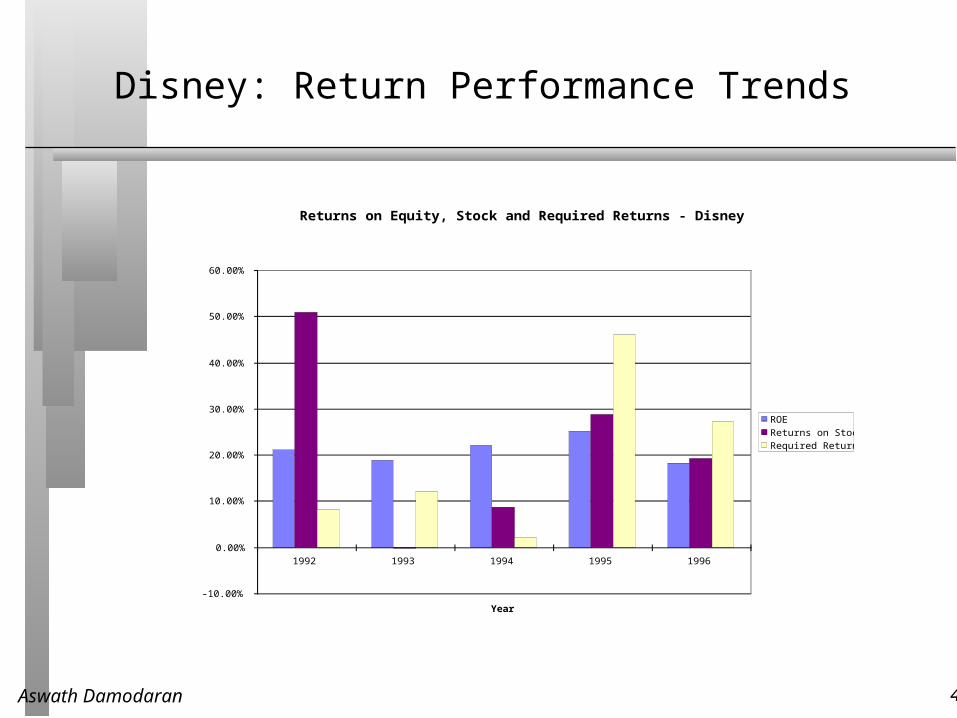
During the period 1992-1996, Disney had• an average return on equity of 21.07% on projects taken
• earned an average return on 21.43% for its stockholders
• a cost of equity of 19.09% Disney has taken good projects and earned above-market returns for
its stockholders during the period. If you were a Disney stockholder, would you be comfortable with
Disney’s dividend policy? Yes No
Aswath Damodaran 46
Disney: Return Performance Trends
Returns on Equity, Stock and Required Returns - Disney
-10.00%
0.00%
10.00%
20.00%
30.00%
40.00%
50.00%
60.00%
1992 1993 1994 1995 1996
Year
ROEReturns on StockRequired Return

Aswath Damodaran 47
The Bottom Line on Disney Dividends
Disney could have afforded to pay more in dividends during the period of the analysis.
It chose not to, and used the cash for the ABC acquisition. The excess returns that Disney earned on its projects and its stock over
the period provide it with some dividend flexibility. The trend in these returns, however, suggests that this flexibility will be rapidly depleted.
The flexibility will clearly not survive if the ABC acquisition does not work out.

Aswath Damodaran 48
Aracruz: Dividends and FCFE: 1994-1996
1994 1995 1996Net Income BR248.21 BR326.42 BR47.00 - (Cap. Exp - Depr)*(1-DR) BR174.76 BR197.20 BR14.96 - ∂ Working Capital*(1-DR) (BR47.74) BR15.67 (BR23.80) = Free CF to Equity BR121.19 BR113.55 BR55.84
Dividends BR80.40 BR113.00 BR27.00 + Equity Repurchases BR 0.00 BR 0.00 BR 0.00
= Cash to Stockholders BR80.40 BR113.00 BR27.00

Aswath Damodaran 49
Aracruz: Investment Record
1994 1995 1996Project Performance MeasuresROE 19.98% 16.78% 2.06%Required rate of return 3.32% 28.03% 17.78% Difference 16.66% -11.25% -15.72%Stock Performance MeasureReturns on stock 50.82% -0.28% 8.65%Required rate of return 3.32% 28.03% 17.78%
Difference 47.50% -28.31% -9.13%

Aswath Damodaran 50
Aracruz: Its your call..
Assume that you are a large stockholder in Aracruz. They have a history of paying less in dividends than they have available in FCFE and have accumulated a cash balance of roughly 1 billion BR (25% of the value of the firm). Would you trust the managers at Aracruz with your cash?
Yes No

Aswath Damodaran 51
Mandated Dividend Payouts
There are many countries where companies are mandated to pay out a certain portion of their earnings as dividends. Given our discussion of FCFE, what types of companies will be hurt the most by these laws?
Large companies making huge profits Small companies losing money High growth companies that are losing money High growth companies that are making money

Aswath Damodaran 52
BP: Dividends- 1983-92
1 2 3 4 5 6 7 8 9 10
Net Income $1,256.00 $1,626.00 $2,309.00 $1,098.00 $2,076.00 $2,140.00 $2,542.00 $2,946.00 $712.00 $947.00
- (Cap. Exp - Depr)*(1-DR) $1,499.00 $1,281.00 $1,737.50 $1,600.00 $580.00 $1,184.00 $1,090.50 $1,975.50 $1,545.50 $1,100.00
∂ Working Capital*(1-DR) $369.50 ($286.50) $678.50 $82.00 ($2,268.00) ($984.50) $429.50 $1,047.50 ($305.00) ($415.00)
= Free CF to Equity ($612.50) $631.50 ($107.00) ($584.00) $3,764.00 $1,940.50 $1,022.00 ($77.00) ($528.50) $262.00
Dividends $831.00 $949.00 $1,079.00 $1,314.00 $1,391.00 $1,961.00 $1,746.00 $1,895.00 $2,112.00 $1,685.00
+ Equity Repurchases
= Cash to Stockholders $831.00 $949.00 $1,079.00 $1,314.00 $1,391.00 $1,961.00 $1,746.00 $1,895.00 $2,112.00 $1,685.00
Dividend Ratios
Payout Ratio 66.16% 58.36% 46.73% 119.67% 67.00% 91.64% 68.69% 64.32% 296.63% 177.93%
Cash Paid as % of FCFE -135.67% 150.28% -1008.41% -225.00% 36.96% 101.06% 170.84% -2461.04% -399.62% 643.13%
Performance Ratios
1. Accounting Measure
ROE 9.58% 12.14% 19.82% 9.25% 12.43% 15.60% 21.47% 19.93% 4.27% 7.66%
Required rate of return 19.77% 6.99% 27.27% 16.01% 5.28% 14.72% 26.87% -0.97% 25.86% 7.12%
Difference -10.18% 5.16% -7.45% -6.76% 7.15% 0.88% -5.39% 20.90% -21.59% 0.54%

Aswath Damodaran 53
BP: Summary of Dividend Policy
Summary of calculations
Average Standard Deviation Maximum Minimum
Free CF to Equity $571.10 $1,382.29 $3,764.00 ($612.50)
Dividends $1,496.30 $448.77 $2,112.00 $831.00
Dividends+Repurchases $1,496.30 $448.77 $2,112.00 $831.00
Dividend Payout Ratio 84.77%
Cash Paid as % of FCFE 262.00%
ROE - Required return -1.67% 11.49% 20.90% -21.59%
Aswath Damodaran 54
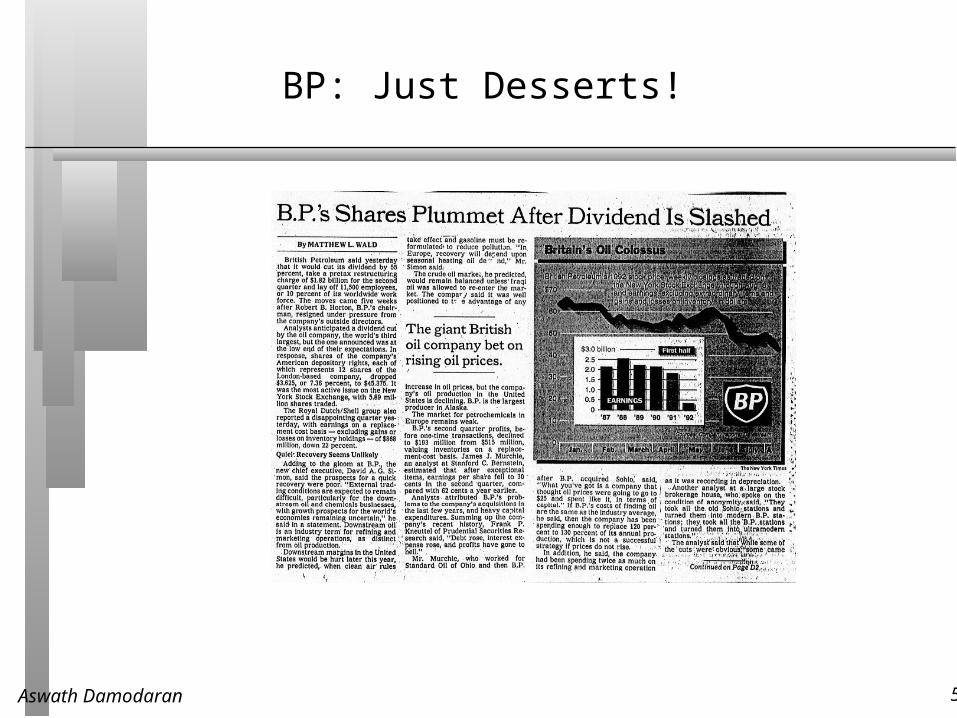
BP: Just Desserts!
Aswath Damodaran 55
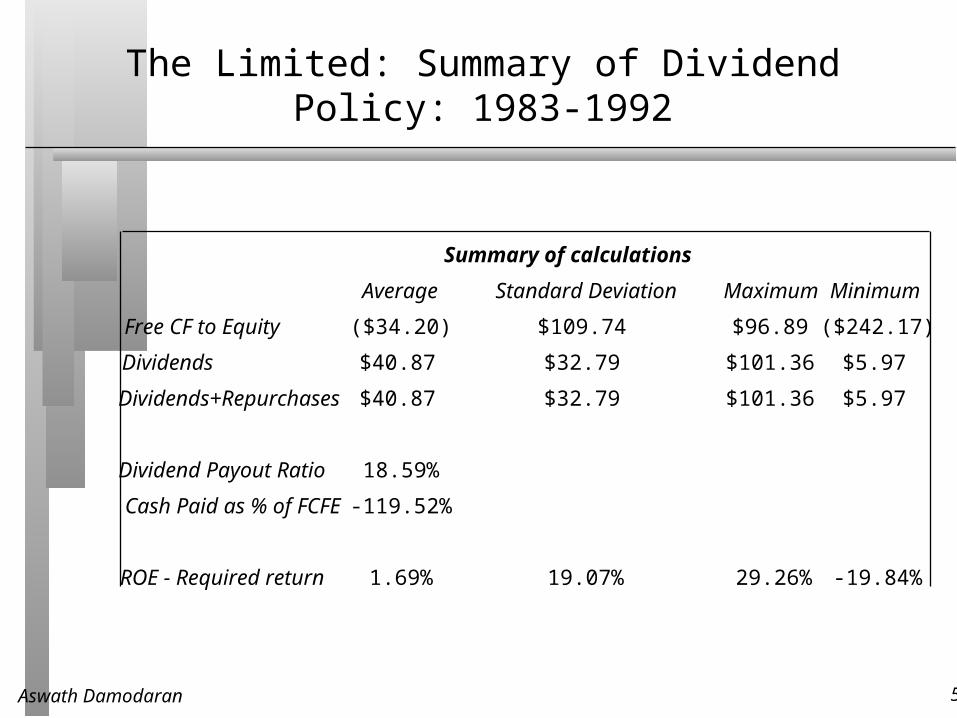
The Limited: Summary of Dividend Policy: 1983-1992
Summary of calculations
Average Standard Deviation Maximum Minimum
Free CF to Equity ($34.20) $109.74 $96.89 ($242.17)
Dividends $40.87 $32.79 $101.36 $5.97
Dividends+Repurchases $40.87 $32.79 $101.36 $5.97
Dividend Payout Ratio 18.59%
Cash Paid as % of FCFE -119.52%
ROE - Required return 1.69% 19.07% 29.26% -19.84%

Aswath Damodaran 56
Growth Firms and Dividends
High growth firms are sometimes advised to initiate dividends because its increases the potential stockholder base for the company (since there are some investors - like pension funds - that cannot buy stocks that do not pay dividends) and, by extension, the stock price. Do you agree with this argument?
Yes No
Why?

Aswath Damodaran 57
Application Test: Assessing your firm’s dividend policy
Compare your firm’s dividends to its FCFE, looking at the last 5 years of information.
Based upon your earlier analysis of your firm’s project choices, would you encourage the firm to return more cash or less cash to its owners?
If you would encourage it to return more cash, what form should it take (dividends versus stock buybacks)?

Aswath Damodaran 58
Other Actions that affect Stock Prices
In the case of dividends and stock buybacks, firms change the value of the assets (by paying out cash) and the number of shares (in the case of buybacks).
There are other actions that firms can take to change the value of their stockholder’s equity. • Divestitures: They can sell assets to another firm that can utilize them
more efficiently, and claim a portion of the value.• Spin offs: In a spin off, a division of a firm is made an independent entity.
The parent company has to give up control of the firm.• Equity carve outs: In an ECO, the division is made a semi-independent
entity. The parent company retains a controlling interest in the firm.• Tracking Stock: When tracking stock are issued against a division, the
parent company retains complete control of the division. It does not have its own board of directors.

Aswath Damodaran 59
Differences in these actions
Asset completelycovenrted into cashNo cash fortransactionControl fully lostParent companhy preservescontrol
Taxed on capital gainsNo TaxesBondholders negativelyaffectedBondholdersunaffectedDivestituresSpin offsECOTracking stockDivestituresSpin offsECOTracking stockDivestituresSpin offsDivestituresTracking stockECOsTrackingstockSpin offsECO